
Peritoneal-Membrane Characteristics and Hypervolemia Management in Peritoneal Dialysis: A Randomized Control Trial


Abstract
1. Introduction
2. Methods
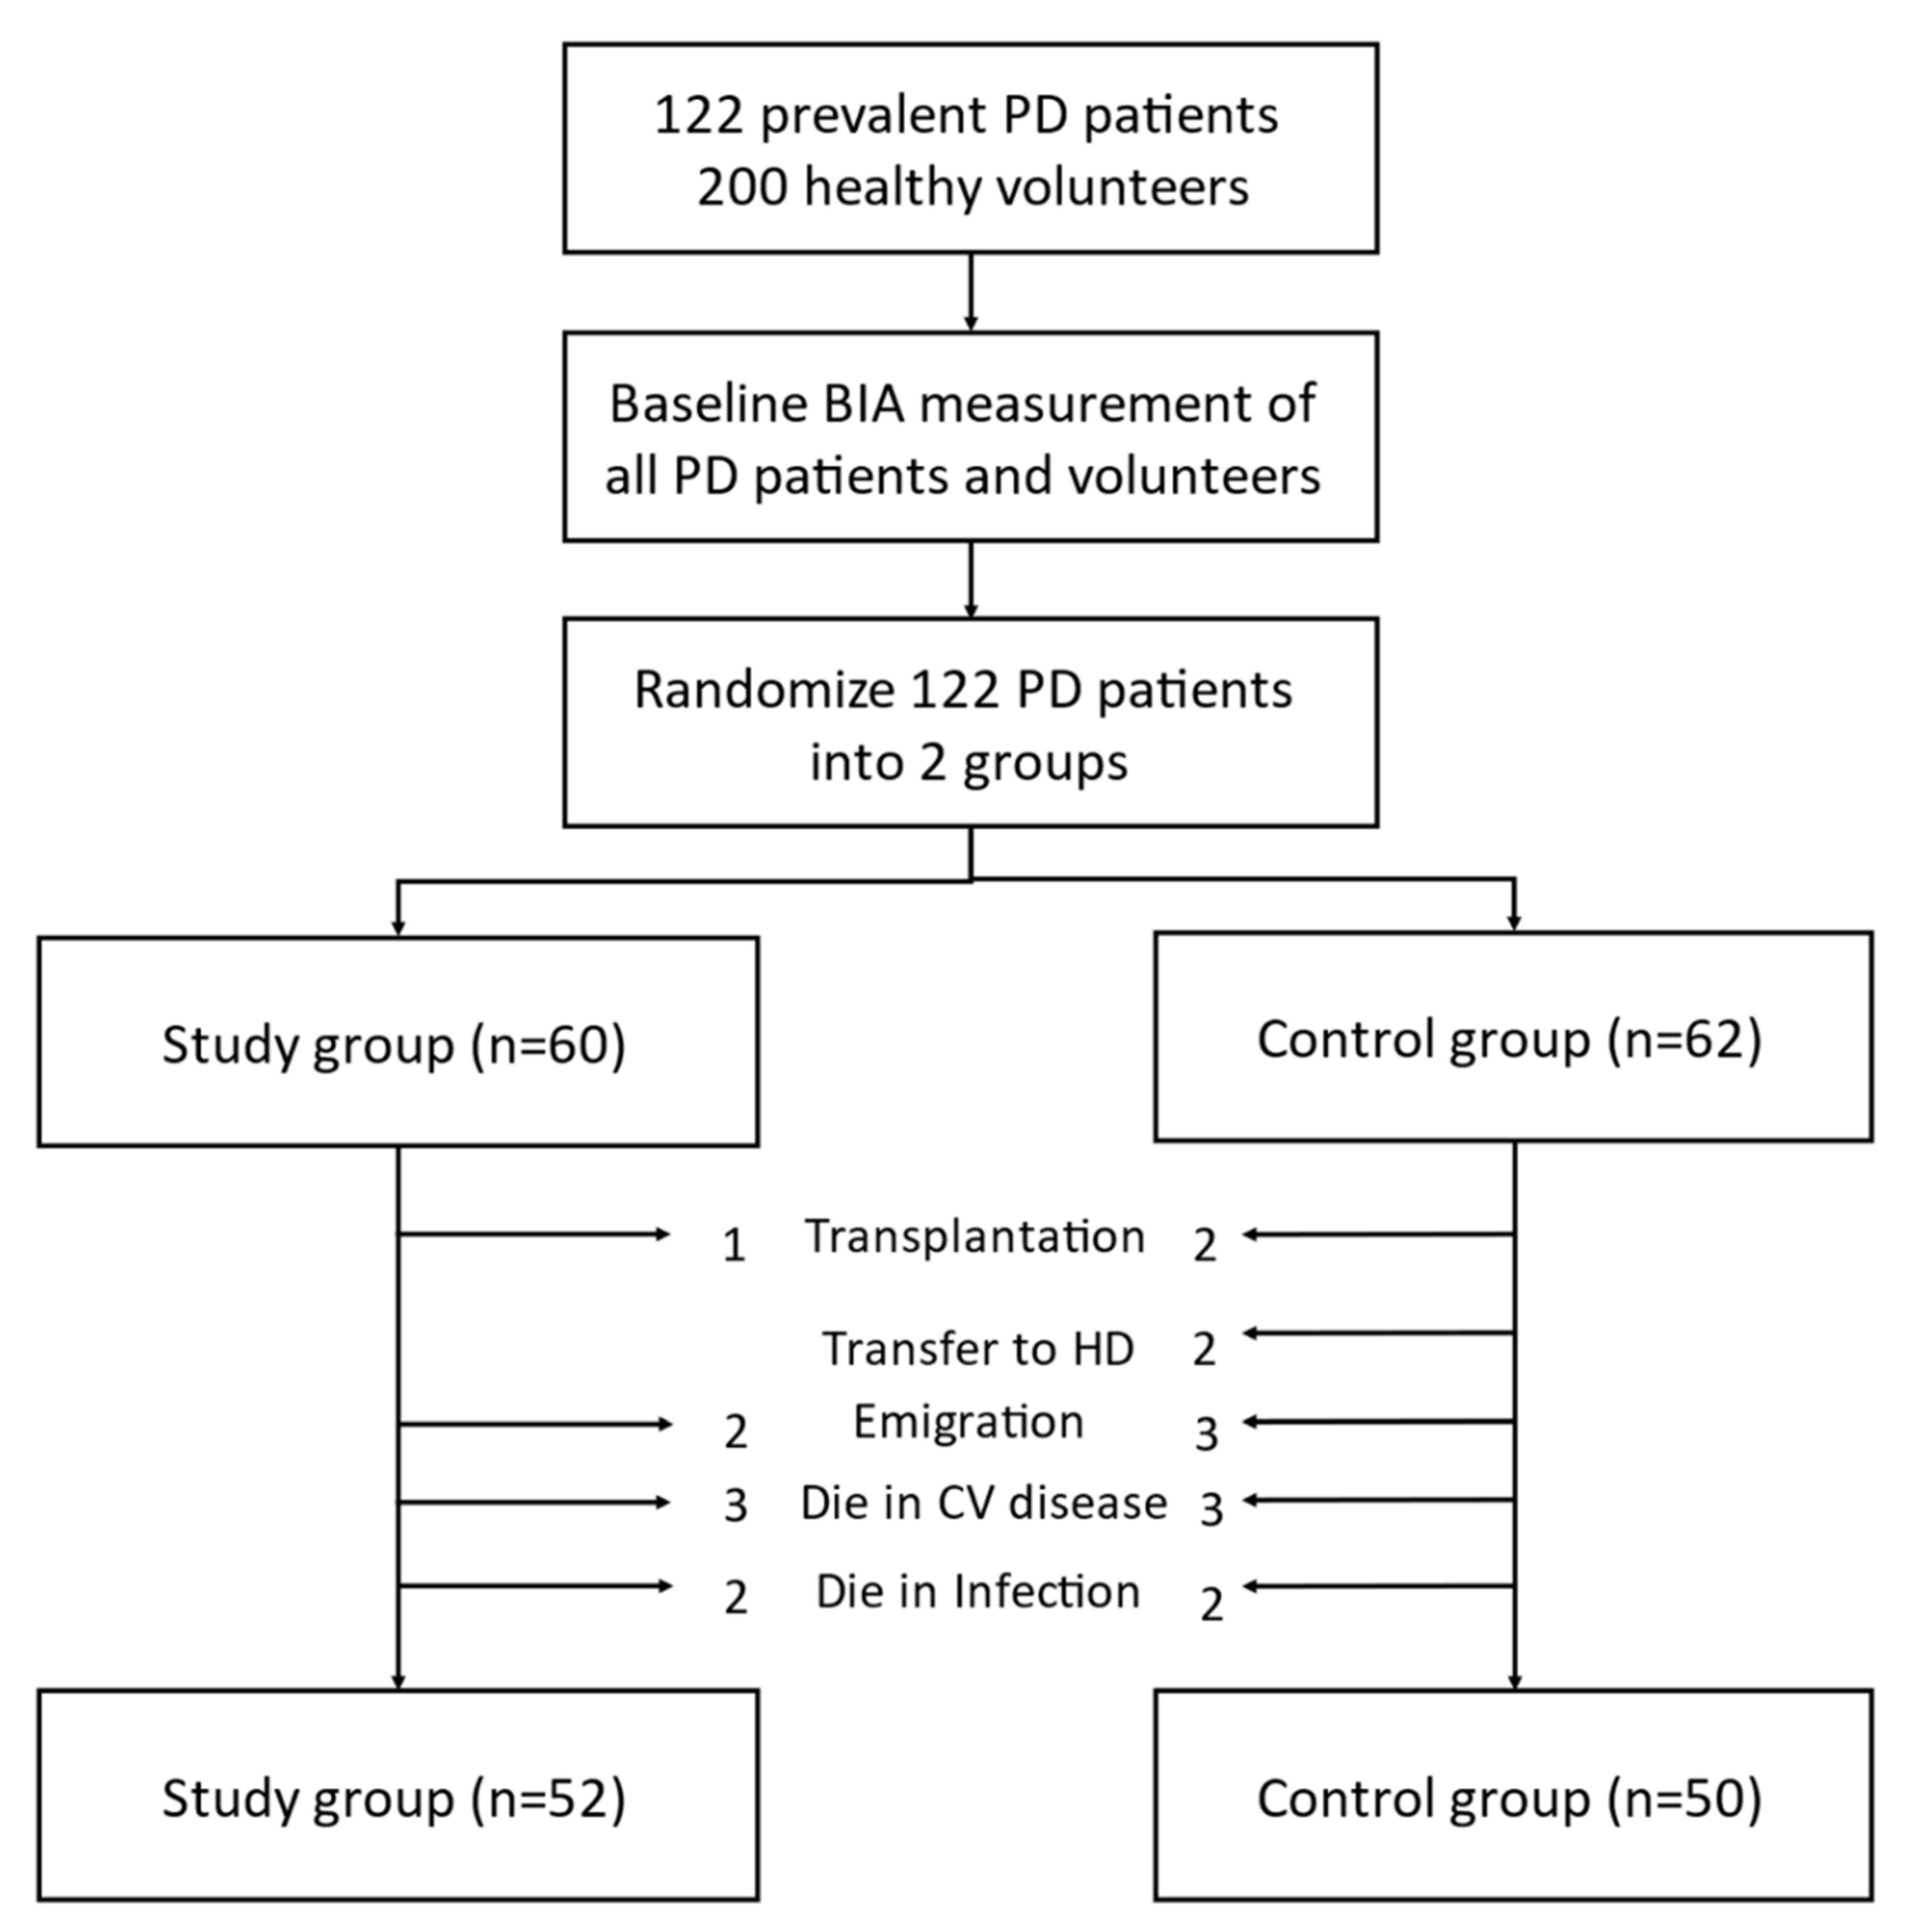
2.1. Study Design
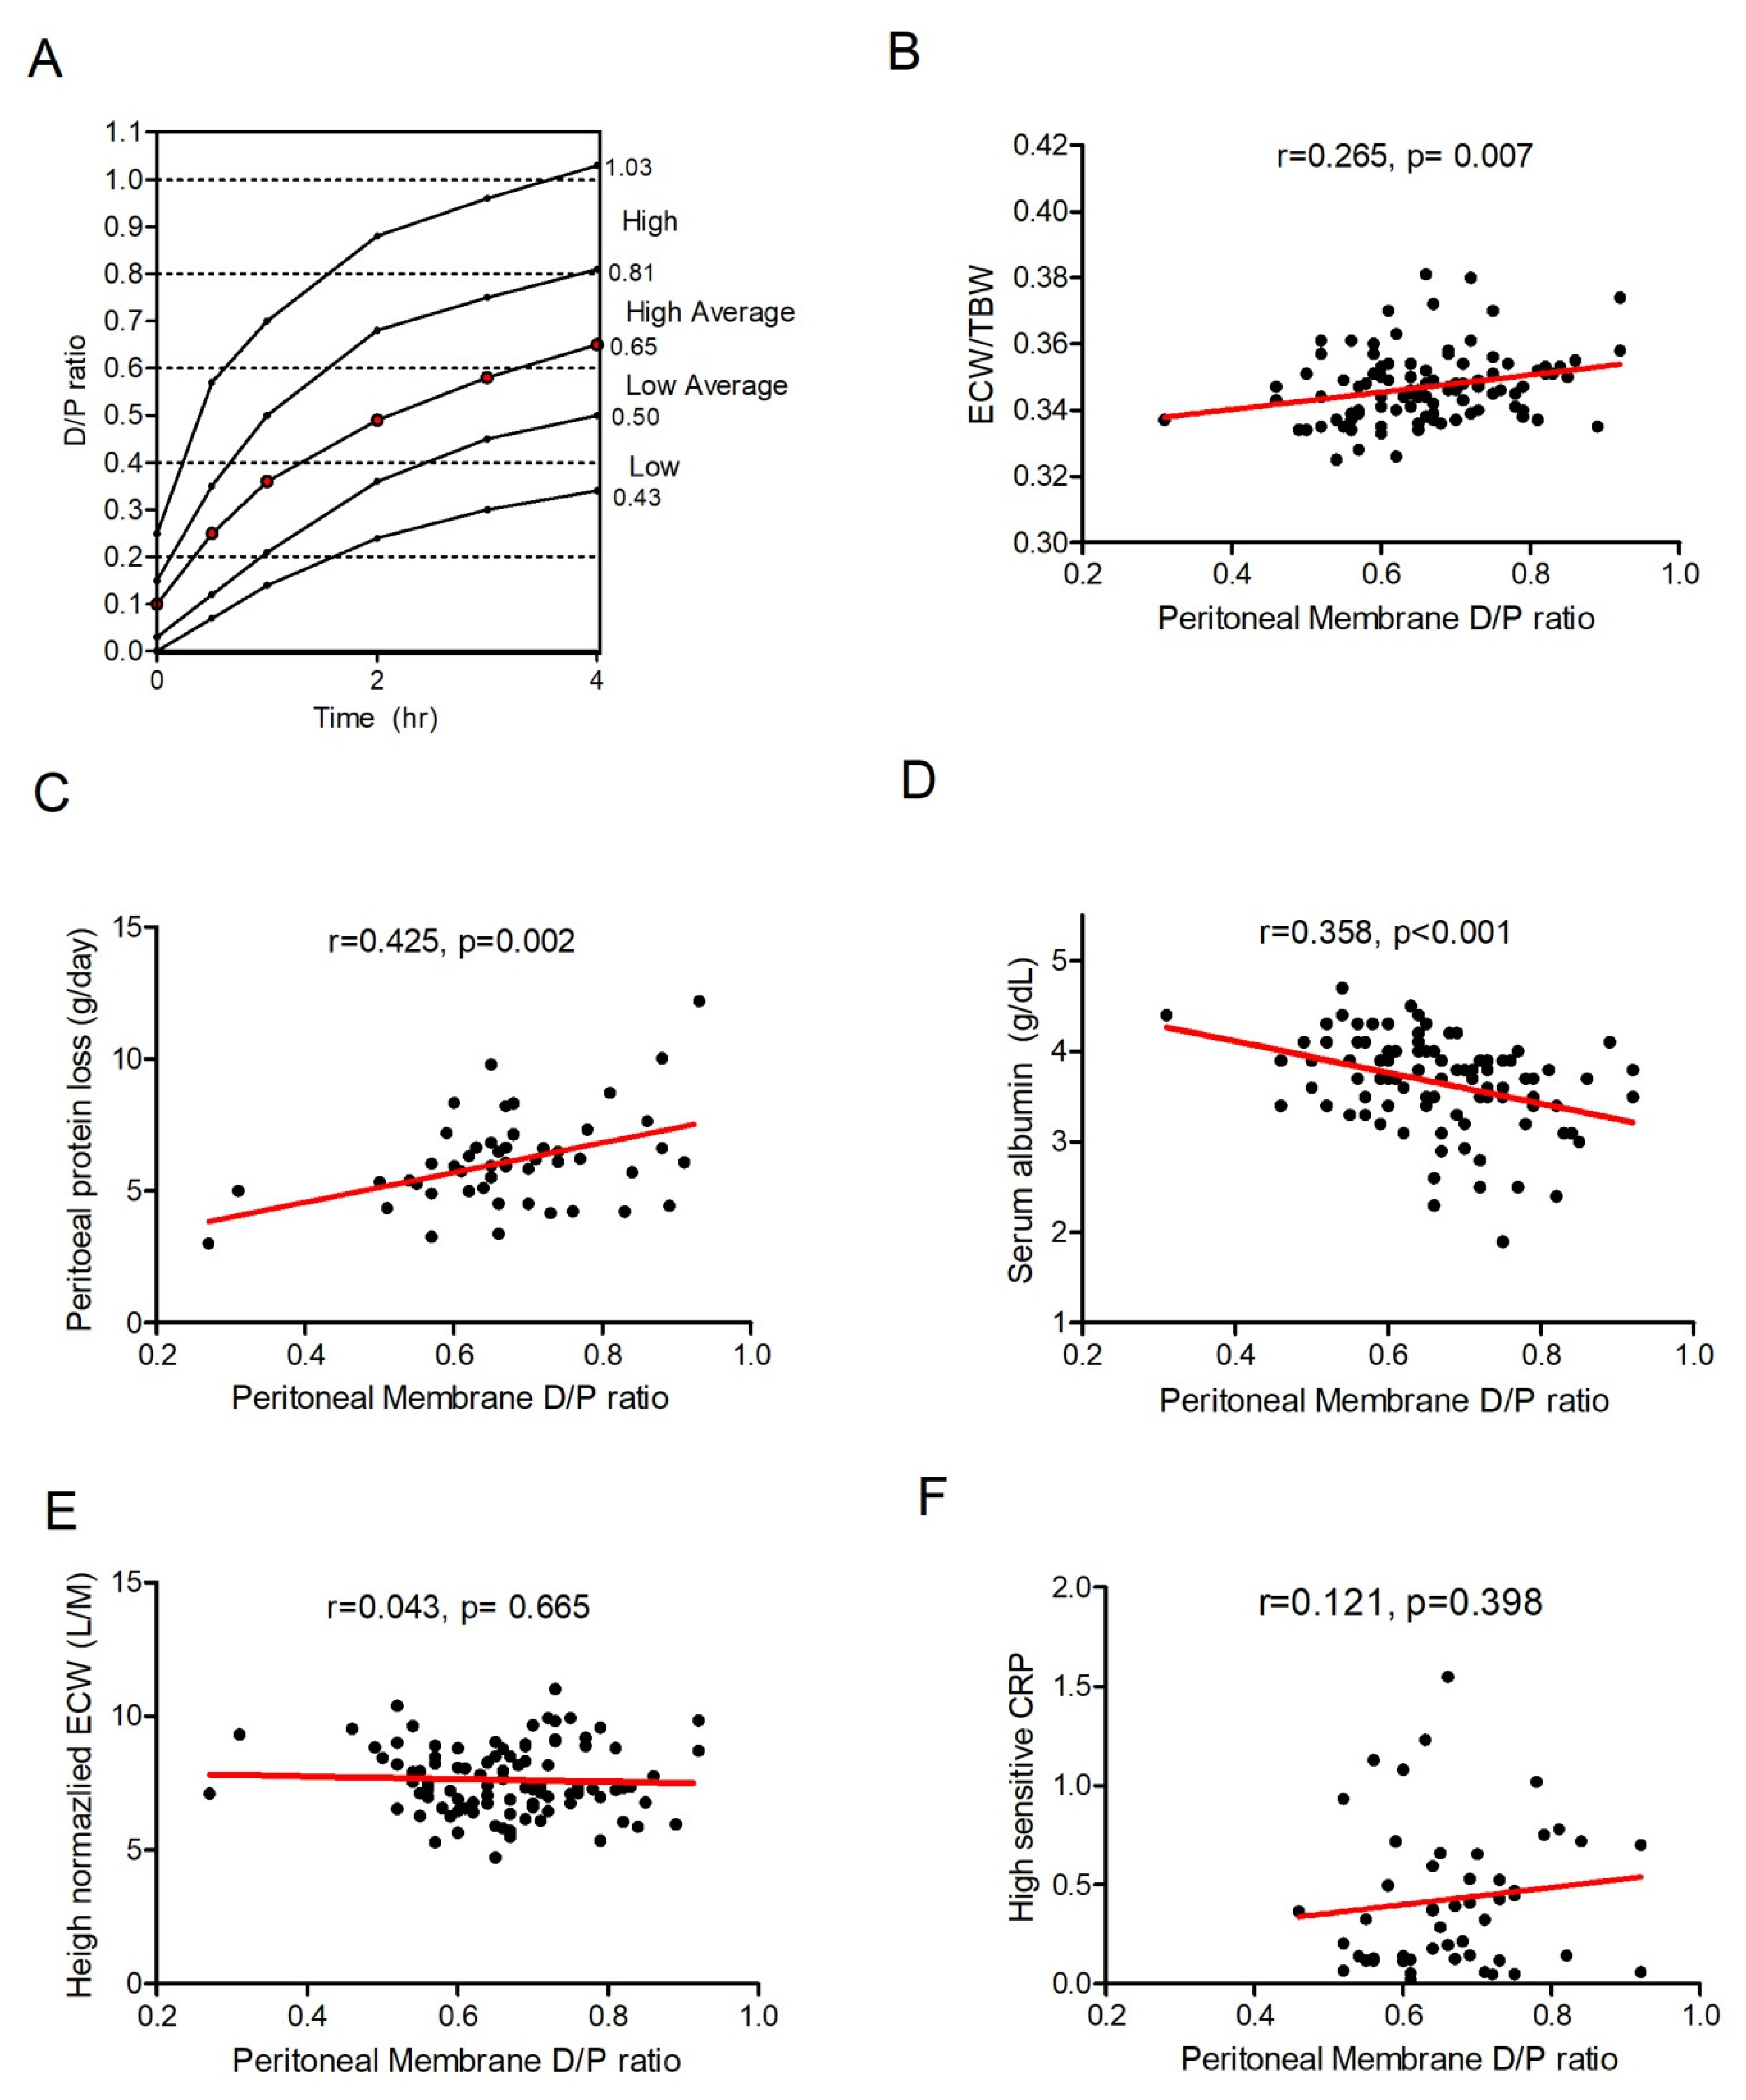
2.2. Peritoneal-Membrane Equilibration Analysis
2.3. Intervention
2.4. Body Composition Analysis
2.5. Statistical Analyses
3. Results
3.1. Peritoneal-Membrane Characteristics and Hydration Index
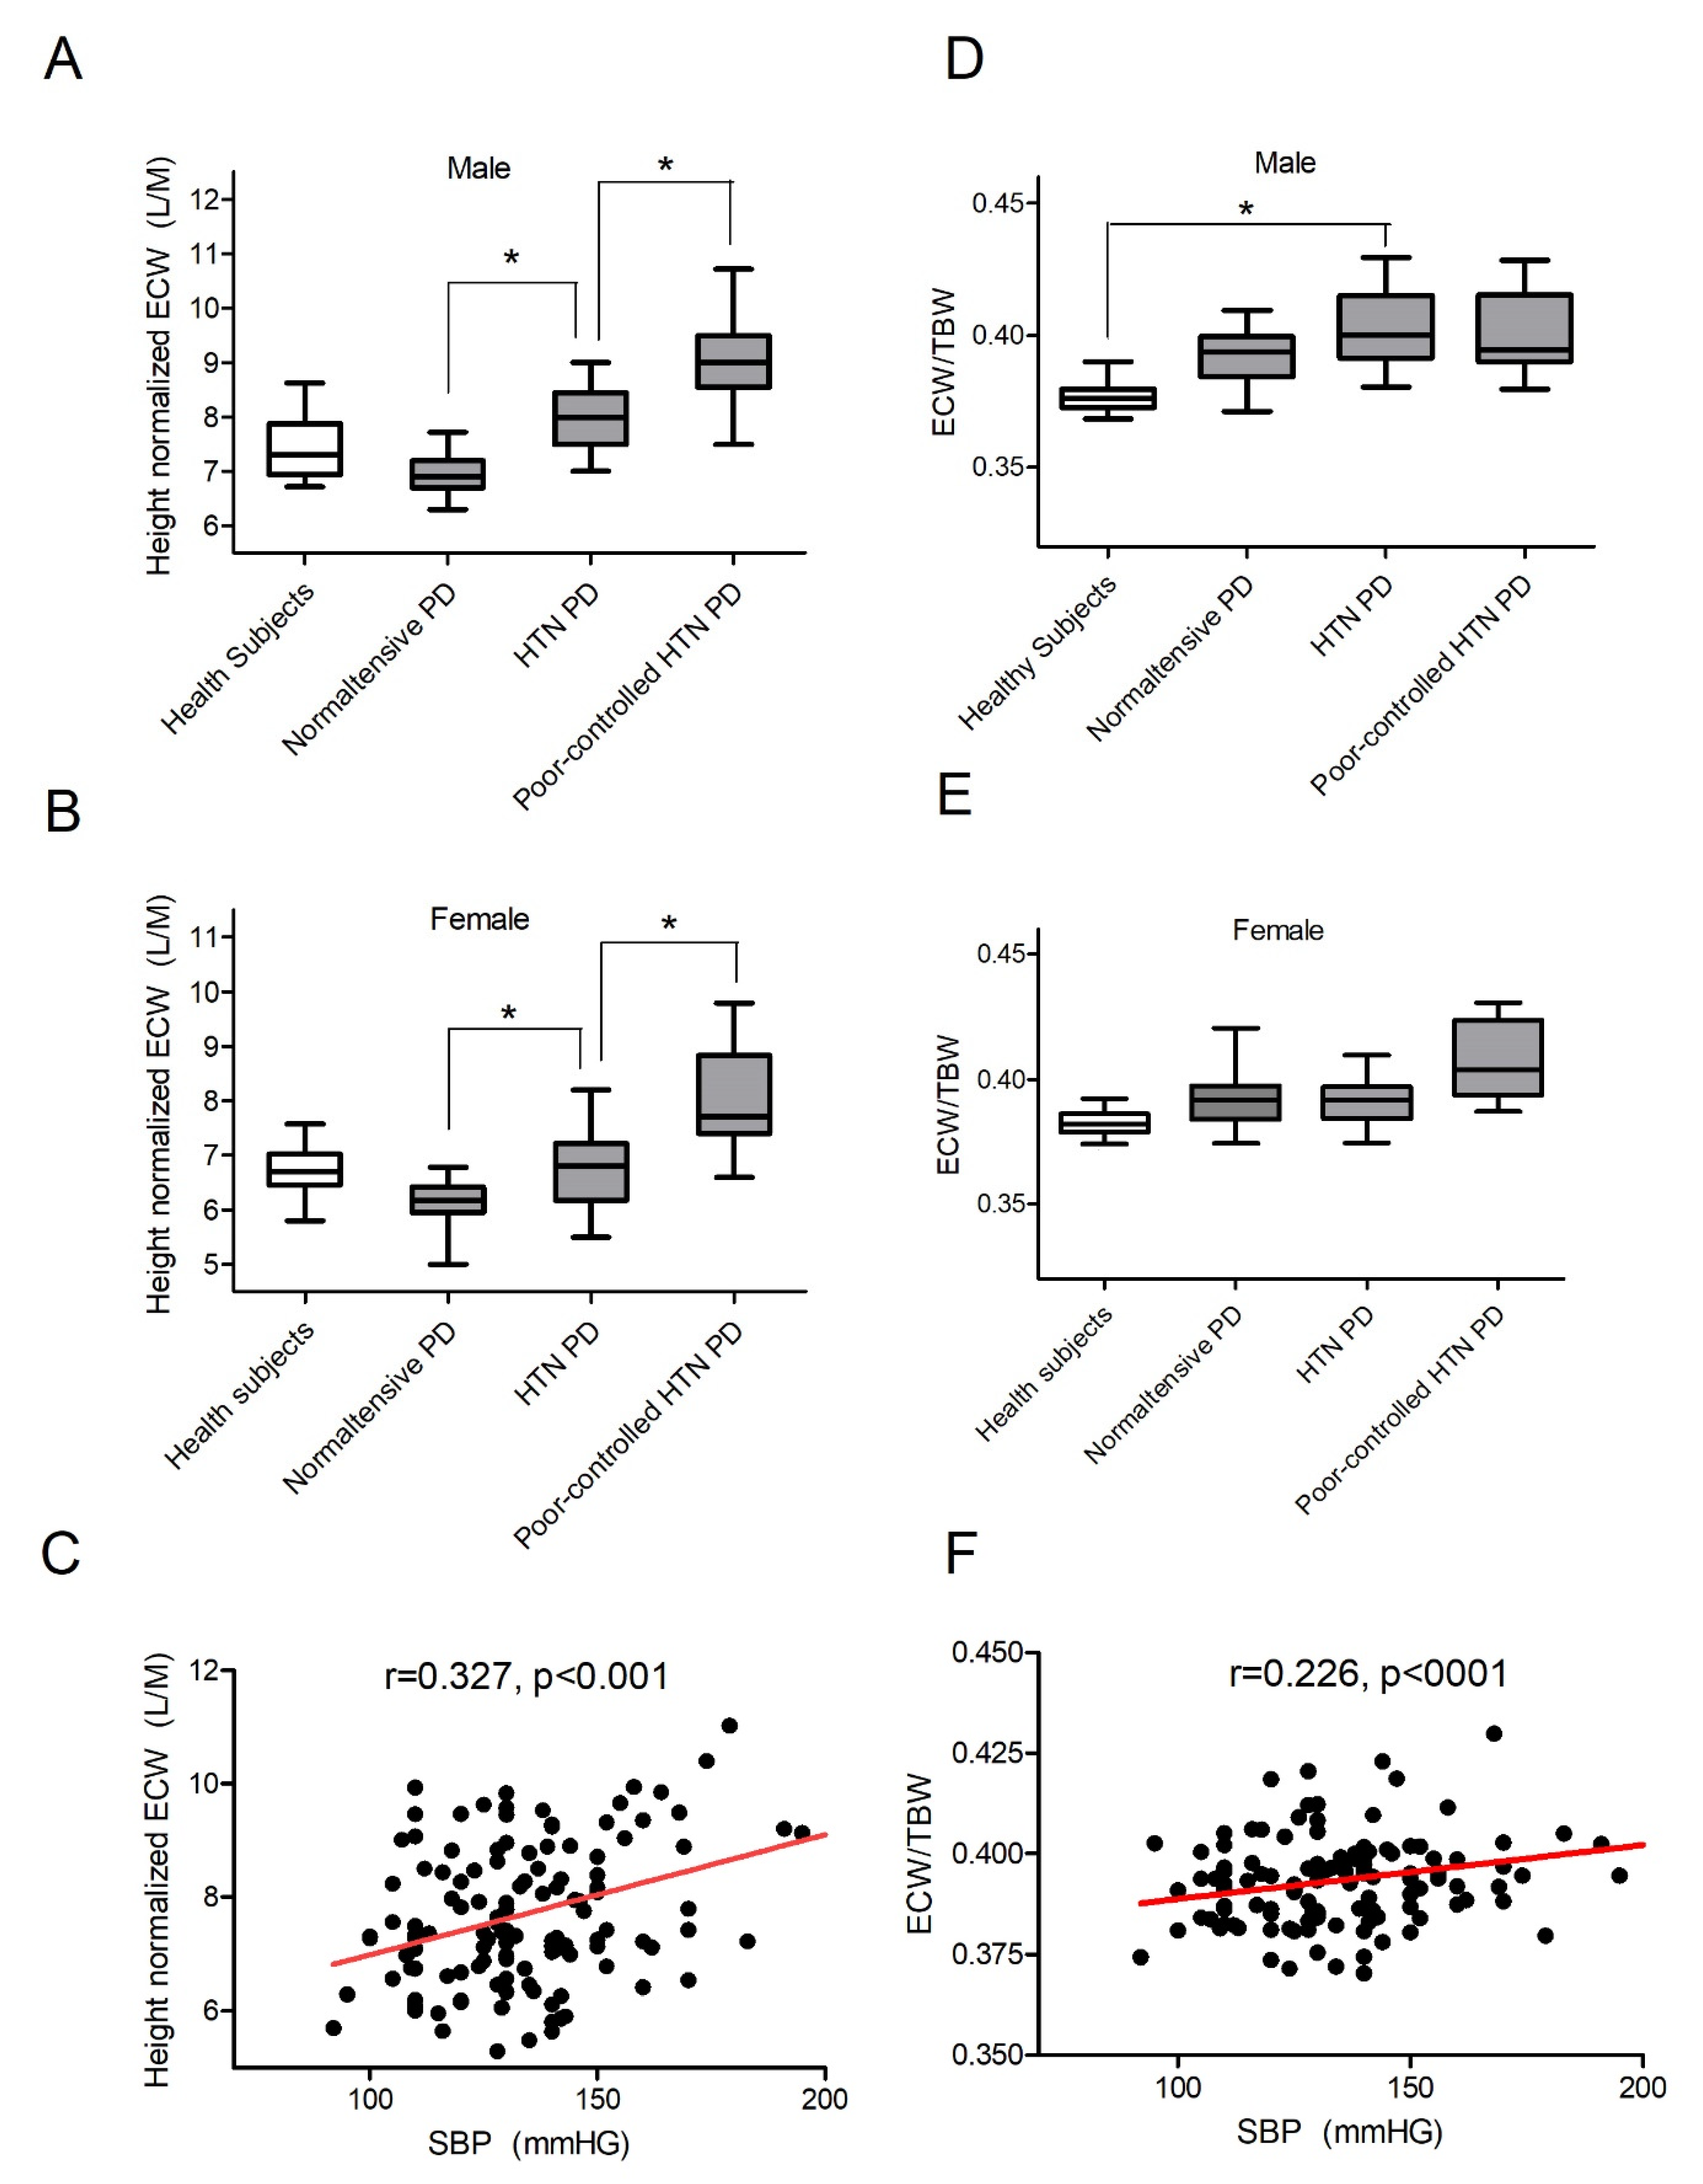
3.2. Most Patients on PD Are Fluid-Overloaded
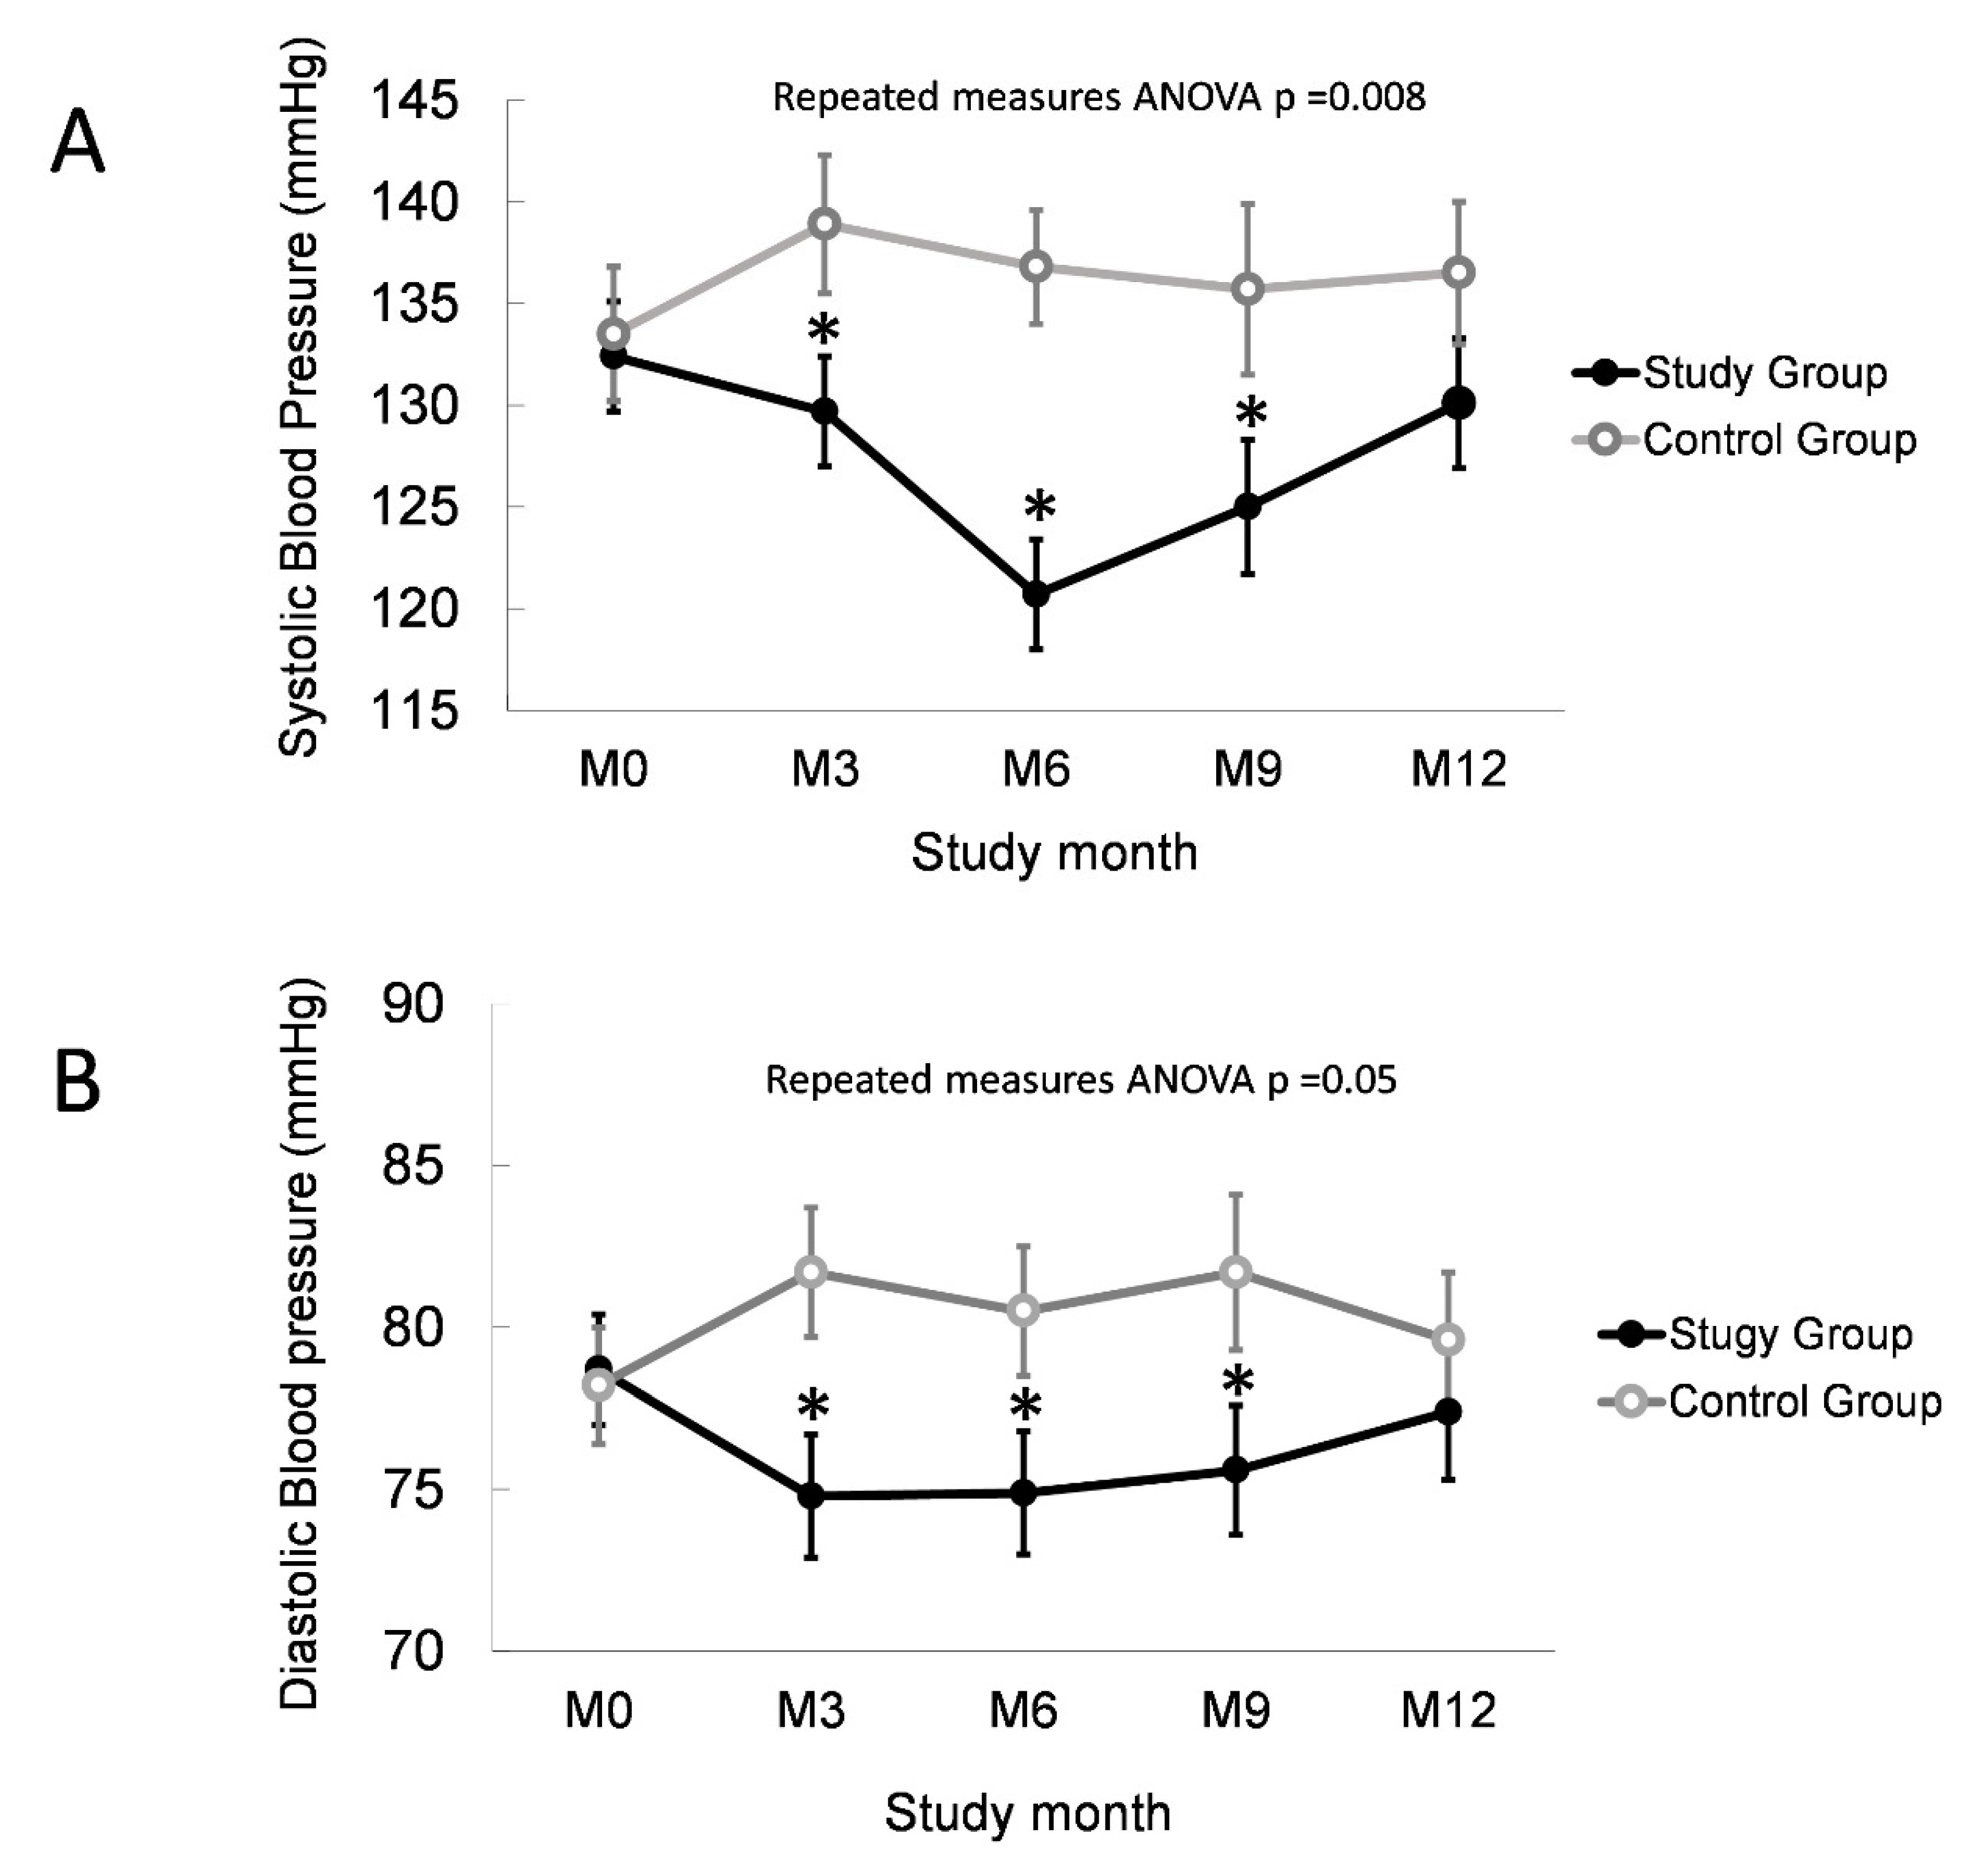
3.3. Normalized Overhydration Improves BP Control in PD
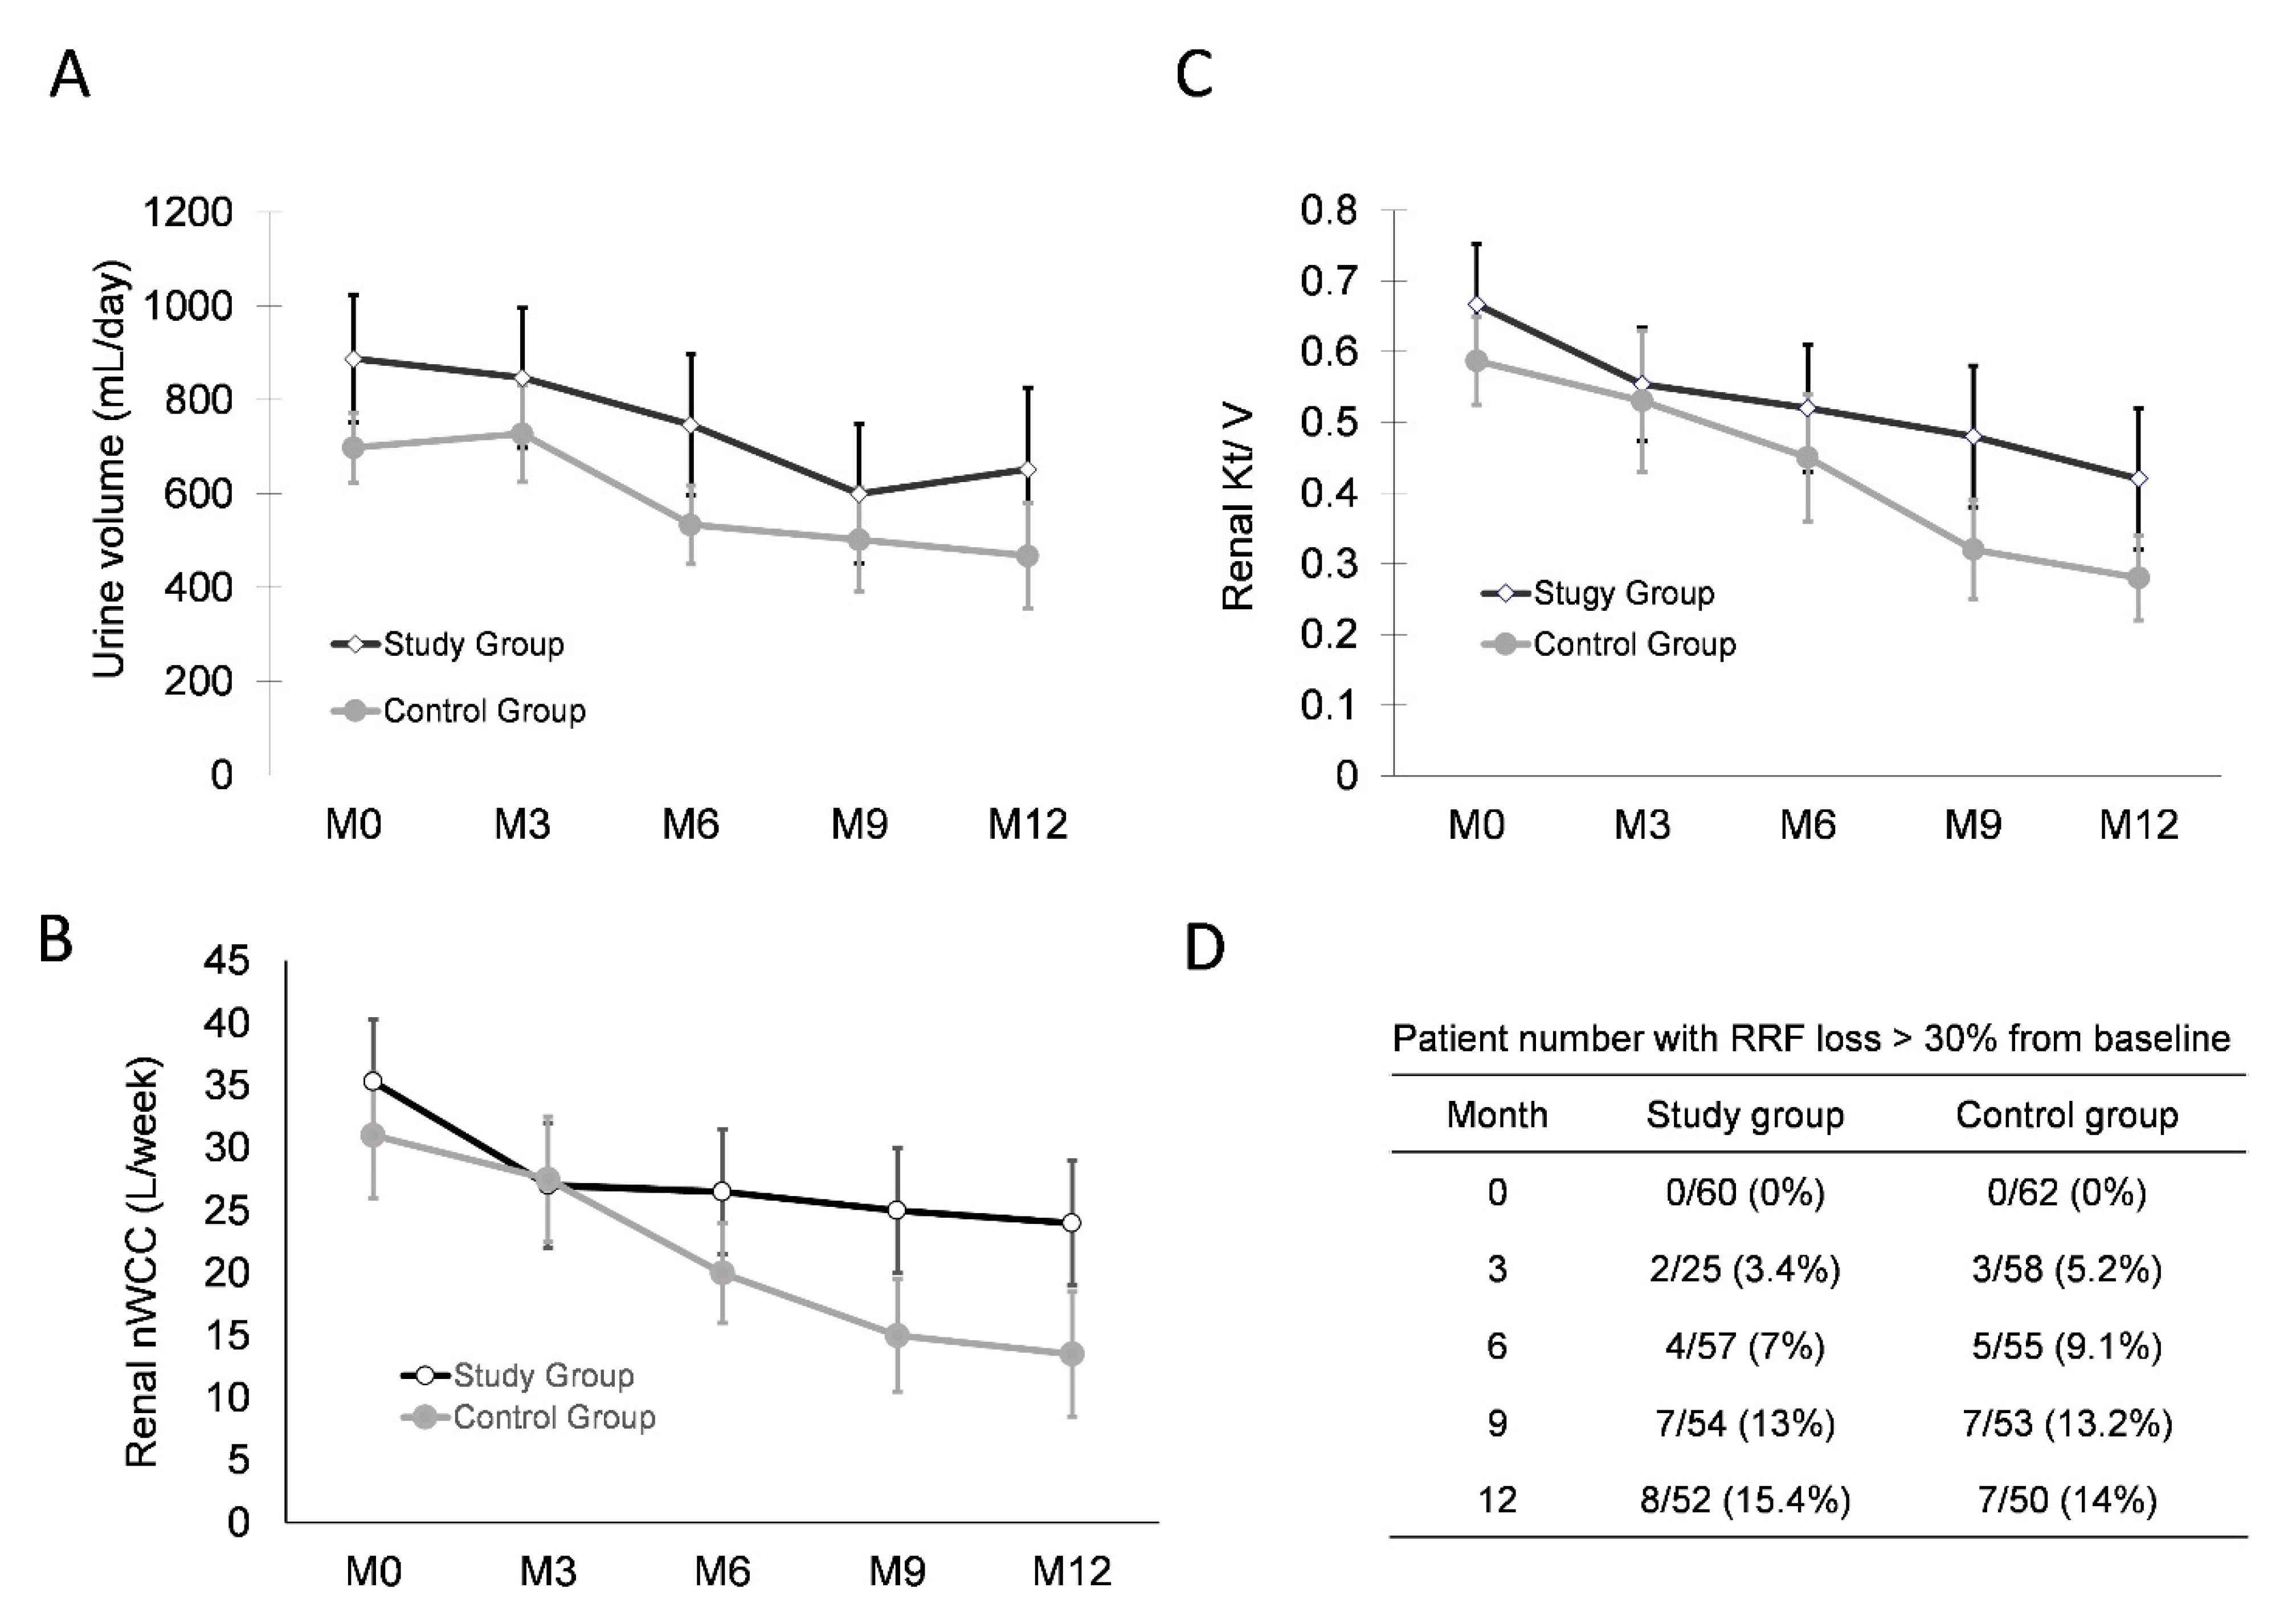
3.4. Normalized Overhydration Does Not Damage RRF or Peritoneal Membrane Function
4. Discussion
Author Contributions
Funding
Institutional Review Board Statement
Informed Consent Statement
Data Availability Statement
Conflicts of Interest
References
- Chazot, C.; Charra, B.; Laurent, G.; Didier, C.; Van, C.V.; Terrat, J.C.; Calemard, E.; Vanel, T.; Ruffet, M. Interdialysis blood pressure control by long haemodialysis sessions. Nephrol. Dial. Transplant. 1995, 10, 831–837. [Google Scholar] [CrossRef] [PubMed]
- Fishbane, S.; Natke, E.; Maesaka, J.K. Role of volume overload in dialysis-refractory hypertension. Am. J. Kidney Dis. 1996, 28, 257–261. [Google Scholar] [CrossRef]
- Konings, C.J.; Kooman, J.P.; Schonck, M.; Dammers, R.; Cheriex, E.; Meulemans, A.P.P.; Hoeks, A.P.; Van Kreel, B.; Gladziwa, U.; van der Sande, F.; et al. Fluid Status, Blood Pressure, and Cardiovascular Abnormalities in Patients on Peritoneal Dialysis. Perit. Dial. Int. 2002, 22, 477–487. [Google Scholar] [CrossRef]
- Lameire, N.; Van Biesen, W. Hypervolemia in peritoneal dialysis patients. J. Nephrol. 2004, 17, S58–S66. [Google Scholar]
- Fagugli, R.M.; Pasini, P.; Quintaliani, G.; Pasticci, F.; Ciao, G.; Cicconi, B.; Ricciardi, D.; Santirosi, P.V.; Buoncristiani, E.; Timio, F.; et al. Association between extracellular water, left ventricular mass and hypertension in haemodialysis patients. Nephrol. Dial. Transplant. 2003, 18, 2332–2338. [Google Scholar] [CrossRef]
- Günal, A.I.; Duman, S.; Özkahya, M.; Töz, H.; Asçi, G.; Akçiçek, F.; Basçi, A. Strict volume control normalizes hypertension in peritoneal dialysis patients. Am. J. Kidney Dis. 2001, 37, 588–593. [Google Scholar] [CrossRef]
- Hölttä, T.; Happonen, J.-M.; Rönnholm, K.; Fyhrquist, F.; Holmberg, C. Hypertension, cardiac state, and the role of volume overload during peritoneal dialysis. Pediatr. Nephrol. 2001, 16, 324–331. [Google Scholar] [CrossRef]
- Jaeger, J.Q.; Mehta, R.L. Assessment of dry weight in hemodialysis: An overview. J. Am. Soc. Nephrol. 1999, 10, 392–403. [Google Scholar] [CrossRef] [PubMed]
- Kouw, P.M.; Kooman, J.P.; Cheriex, E.C.; Olthof, C.G.; de Vries, P.M.; Leunissen, K.M. Assessment of postdialysis dry weight: A comparison of techniques. J. Am. Soc. Nephrol. 1993, 4, 98–104. [Google Scholar] [CrossRef]
- Loutradis, C.; Papadopoulos, C.; Sachpekidis, V.; Ekart, R.; Krunic, B.; Karpetas, A.; Bikos, A.; Tsouchnikas, I.; Mitsopoulos, E.; Papagianni, A.; et al. Lung Ultrasound–Guided Dry Weight Assessment and Echocardiographic Measures in Hypertensive Hemodialysis Patients: A Randomized Controlled Study. Am. J. Kidney Dis. 2020, 75, 11–20. [Google Scholar] [CrossRef]
- Sato, H.; Kawasaki, M.; Tanaka, R.; Yoshizane, T.; Ono, K.; Tadokoro, M.; Yano, Y.; Kondou, T.; Kariya, T.; Nagata, K.; et al. Relationships among pulmonary capillary wedge pressure, dry weight and natriuretic peptide in patients undergoing hemodialysis: A three-dimensional speckle tracking echocardiography study. J. Echocardiogr. 2020, 18, 160–168. [Google Scholar] [CrossRef] [PubMed]
- Covic, A.; Ciumanghel, A.-I.; Siriopol, D.; Kanbay, M.; Dumea, R.; Gavrilovici, C.; Nistor, I. Value of bioimpedance analysis estimated “dry weight” in maintenance dialysis patients: A systematic review and meta-analysis. Int. Urol. Nephrol. 2017, 49, 2231–2245. [Google Scholar] [CrossRef] [PubMed]
- Becker, G.J.; Wheeler, D.C.; De Zeeuw, D.; Fujita, T.; Furth, S.L.; Holdaas, H.; Mendis, S.; Oparil, S.; Perkovic, V.; Rodrigues, C.I.S.; et al. Kidney Disease: Improving Global Outcomes Blood Pressure Work G. KDIGO 2021 Clinical Practice Guideline for the Management of Blood Pressure in Chronic Kidney Disease. Kidney Int. Suppl. 2021, 2, 337–414. [Google Scholar]
- Bargman, J.M.; Thorpe, K.; Churchill, D.N. Relative Contribution of Residual Renal Function and Peritoneal Clearance to Adequacy of Dialysis: A Reanalysis of the CANUSA Study. J. Am. Soc. Nephrol. 2001, 12, 2158–2162. [Google Scholar] [CrossRef] [PubMed]
- Cocchi, R.; Degli Esposti, E.; Fabbri, A.; Lucatello, A.; Sturani, A.; Quarello, F.; Boero, R.; Bruno, M.; Dadone, C.; Favazza, A.; et al. Prevalence of hypertension in patients on peritoneal dialysis: Results of an Italian multicentre study. Nephrol. Dial. Transplant. Off. Publ. Eur. Dial. Transpl. Assoc.-Eur. Ren. Assoc. 1999, 14, 1536–1540. [Google Scholar] [CrossRef]
- Enia, G.; Mallamaci, F.; Benedetto, F.A.; Panuccio, V.; Parlongo, S.; Cutrupi, S.; Giacone, G.; Cottini, E.; Tripepi, G.; Malatino, L.S.; et al. Long-term CAPD patients are volume expanded and display more severe left ventricular hypertrophy than haemodialysis patients. Nephrol. Dial. Transplant. 2001, 16, 1459–1464. [Google Scholar] [CrossRef]
- Plum, J.; Schoenicke, G.; Kleophas, W.; Kulas, W.; Steffens, F.; Azem, A.; Grabensee, B. Comparison of body fluid distribution between chronic haemodialysis and peritoneal dialysis patients as assessed by biophysical and biochemical methods. Nephrol. Dial. Transplant. 2001, 16, 2378–2385. [Google Scholar] [CrossRef]
- Fan, S.; Sayed, R.H.; Davenport, A. Extracellular Volume Expansion in Peritoneal Dialysis Patients. Int. J. Artif. Organs 2012, 35, 338–345. [Google Scholar] [CrossRef]
- Panorchan, K.; Davenport, A. Increase in Extracellular Hydration Status after Initiating Peritoneal Dialysis Electively. Perit. Dial. Int. 2017, 37, 338–340. [Google Scholar] [CrossRef]
- Pannekeet, M.M.; Imholz, A.L.; Struijk, D.G.; Koomen, G.C.; Langedijk, M.J.; Schouten, N.; de Waart, R.; Hiralall, J.; Krediet, R.T. The standard peritoneal permeability analysis: A tool for the assessment of peritoneal permeability characteristics in CAPD patients. Kidney Int. 1995, 48, 866–875. [Google Scholar] [CrossRef] [PubMed][Green Version]
- Mehrotra, R.; Ravel, V.; Streja, E.; Kuttykrishnan, S.; Adams, S.V.; Katz, R.; Molnar, M.Z.; Kalantar-Zadeh, K. Peritoneal Equilibration Test and Patient Outcomes. Clin. J. Am. Soc. Nephrol. 2015, 10, 1990–2001. [Google Scholar] [CrossRef] [PubMed]
- Teitelbaum, I.; Burkart, J. Peritoneal dialysis. Am. J. Kidney Dis. 2003, 42, 1082–1096. [Google Scholar] [CrossRef] [PubMed]
- Kwan, B.C.-H.; Szeto, C.C.; Chow, K.-M.; Law, M.-C.; Cheng, M.S.; Leung, C.-B.; Pang, W.-F.; Kwong, V.W.-K.; Li, P.K.-T. Bioimpedance Spectroscopy for the Detection of Fluid Overload in Chinese Peritoneal Dialysis Patients. Perit. Dial. Int. 2014, 34, 409–416. [Google Scholar] [CrossRef] [PubMed]
- Demirci, M.S.; Demirci, C.; Ozdogan, O.; Kircelli, F.; Akcicek, F.; Başçı, A.; Ok, E.; Ozkahya, M.; Basci, A. Relations between malnutrition-inflammation-atherosclerosis and volume status. The usefulness of bioimpedance analysis in peritoneal dialysis patients. Nephrol. Dial. Transplant. 2010, 26, 1708–1716. [Google Scholar] [CrossRef]
- Malavolti, M.; Mussi, C.; Poli, M.; Fantuzzi, A.L.; Salvioli, G.; Battistini, N.; Bedogni, G. Cross-calibration of eight-polar bioelectrical impedance analysis versus dual-energy X-ray absorptiometry for the assessment of total and appendicular body composition in healthy subjects aged 21-82 yrs. Ann. Hum. Biol. 2003, 30, 380–391. [Google Scholar] [CrossRef]
- De Lorenzo, A.; Andreoli, A.; Matthie, J.; Withers, P. Predicting body cell mass with bioimpedance by using theoretical methods: A technological review. J. Appl. Physiol. 1997, 82, 1542–1558. [Google Scholar] [CrossRef]
- Tanaka, M.; Ishibashi, Y.; Hamasaki, Y.; Kamijo, Y.; Idei, M.; Nishi, T.; Takeda, M.; Nonaka, H.; Nangaku, M.; Mise, N. Bioimpedance Spectroscopy-Based Fluid Status in Combined Dialysis Compared With Hemodialysis and Peritoneal Dialysis: A Cross-Sectional Study. Ther. Apher. Dial. 2020, 24, 373–379. [Google Scholar] [CrossRef]
- van de Kerkhof, J.; Hermans, M.; Beerenhout, C.; Konings, C.; van der Sande, F.M.; Kooman, J.P. Reference values for multifrequency bioimpedance analysis in dialysis patients. Blood Purif. 2004, 22, 301–306. [Google Scholar] [CrossRef]
- Cheng, L.-T.; Gao, Y.-L.; Qin, C.; Tian, J.-P.; Gu, Y.; Bi, S.-H.; Tang, W.; Wang, T. Volume Overhydration is Related to Endothelial Dysfunction in Continuous Ambulatory Peritoneal Dialysis Patients. Perit. Dial. Int. 2008, 28, 397–402. [Google Scholar] [CrossRef]
- Konings, C.J.; Kooman, J.P.; Schonck, M.; Cox–Reijven, P.L.; Van Kreel, B.; Gladziwa, U.; Wirtz, J.; Gerlag, P.G.; Hoorntje, S.J.; Wolters, J.; et al. Assessment of Fluid Status in Peritoneal Dialysis Patients. Perit. Dial. Int. 2002, 22, 683–692. [Google Scholar] [CrossRef]
- Asghar, R.B.; Green, S.; Engel, B.; Davies, S.J. Relationship of Demographic, Dietary, and Clinical Factors to the Hydration Status of Patients on Peritoneal Dialysis. Perit. Dial. Int. 2004, 24, 231–239. [Google Scholar] [CrossRef]
- Mendley, S.R.; Majkowski, N.L.; Schoeller, D.A. Validation of estimates of total body water in pediatric dialysis patients by deuterium dilution. Kidney Int. 2005, 67, 2056–2062. [Google Scholar] [CrossRef] [PubMed]
- Dumler, F. Use of bioelectric impedance analysis and dual-energy X-ray absorptiometry for monitoring the nutritional status of dialysis patients. ASAIO J. 1997, 43, 256–260. [Google Scholar] [PubMed]
- Wang, X.; Axelsson, J.; Lindholm, B.; Wang, T. Volume Status and Blood Pressure in Continuous Ambulatory Peritoneal Dialysis Patients. Blood Purif. 2005, 23, 373–378. [Google Scholar] [CrossRef]
- Cheng, L.-T.; Tang, W.; Wang, T. Strong Association Between Volume Status and Nutritional Status in Peritoneal Dialysis Patients. Am. J. Kidney Dis. 2005, 45, 891–902. [Google Scholar] [CrossRef]
- Mushnick, R.; Fein, P.A.; Mittman, N.; Goel, N.; Chattopadhyay, J.; Avram, M.M. Relationship of bioelectrical impedance parameters to nutrition and survival in peritoneal dialysis patients. Kidney Int. 2003, 64, S53–S56. [Google Scholar] [CrossRef]
- Konings, C.J.A.M.; Kooman, J.P.; Schonck, M.; Struijk, D.G.; Gladziwa, U.; Hoorntje, S.J.; Bake, A.W.V.D.W.; van der Sande, F.; Leunissen, K.M.L. Fluid status in CAPD patients is related to peritoneal transport and residual renal function: Evidence from a longitudinal study. Nephrol. Dial. Transplant. 2003, 18, 797–803. [Google Scholar] [CrossRef]
- McCafferty, K.; Fan, S.; Davenport, A. Extracellular volume expansion, measured by multifrequency bioimpedance, does not help preserve residual renal function in peritoneal dialysis patients. Kidney Int. 2014, 85, 151–157. [Google Scholar] [CrossRef]
- Schneditz, D. The arrow of bioimpedance. Kidney Int. 2006, 69, 1492–1493. [Google Scholar] [CrossRef] [PubMed][Green Version]
- London, G.M.; Marchais, S.J.; Guerin, A.P.; Metivier, F.; Adda, H.; Pannier, B. Inflammation, arteriosclerosis, and cardiovascular therapy in hemodialysis patients. Kidney Int. 2003, 63, S88–S93. [Google Scholar] [CrossRef][Green Version]
- Neumann, J.; Ligtenberg, G.; Klein, I.I.; Koomans, H.A.; Blankestijn, P.J. Sympathetic hyperactivity in chronic kidney disease: Pathogenesis, clinical relevance, and treatment. Kidney Int. 2004, 65, 1568–1576. [Google Scholar] [CrossRef]
- Agarwal, R. Systolic hypertension in hemodialysis patients. Semin. Dial. 2003, 16, 208–213. [Google Scholar] [CrossRef]
- Konings, C.J.; Kooman, J.P.; Schonck, M.; Gladziwa, U.; Wirtz, J.; Bake, A.W.V.D.W.; Gerlag, P.G.; Hoorntje, S.J.; Wolters, J.; Van Der Sande, F.M.; et al. Effect of icodextrin on volume status, blood pressure and echocardiographic parameters: A randomized study. Kidney Int. 2003, 63, 1556–1563. [Google Scholar] [CrossRef] [PubMed]
- Davies, S.J.; Woodrow, G.; Donovan, K.; Plum, J.; Williams, P.; Johansson, A.C.; Bosselmann, H.-P.; Heimbürger, O.; Simonsen, O.; Davenport, A.; et al. Icodextrin Improves the Fluid Status of Peritoneal Dialysis Patients: Results of a Double-Blind Randomized Controlled Trial. J. Am. Soc. Nephrol. 2003, 14, 2338–2344. [Google Scholar] [CrossRef] [PubMed]
- Konings, C.J.; Kooman, J.P.; Gladziwa, U.; Van Der Sande, F.M.; Leunissen, K.M. A decline in residual glomerular filtration during the use of icodextrin may be due to underhydration. Kidney Int. 2005, 67, 1190–1191. [Google Scholar] [CrossRef] [PubMed][Green Version]
- Tian, N.; Yang, X.; Guo, Q.; Zhou, Q.; Yi, C.; Lin, J.; Cao, P.; Ye, H.; Chen, M.; Yu, X. Bioimpedance Guided Fluid Management in Peritoneal Dialysis: A Randomized Controlled Trial. Clin. J. Am. Soc. Nephrol. 2020, 15, 685–694. [Google Scholar] [CrossRef]


| Variables | Normotensive PD | HTN-PD | Poor Controlled HTN PD | All Patient |
|---|---|---|---|---|
| Patient number | 35 | 67 | 20 | 122 |
| Age (years) | 56.4 ± 14.5 | 56.3 ± 13.3 | 47.9 ± 12.0 | 55.1 ± 13.8 |
| Gender (males) | 12 (34%) | 30 (45%) | 9 (45%) | 51 (41%) |
| Body weight (Kg) | 55.7 ± 11.5 | 59.2 ± 11.2 | 62.2 ± 11.7 | 58.6 ± 11.5 |
| DM | 6 (17%) | 14 (21%) | 6 (30%) | 26 |
| SBP (mmHg) | 114 ± 11 | 137 ± 13 | 165 ± 22 | 133 ± 21 |
| DBP (mmHg) | 70.1± 9.7 | 79.9 ± 11.0 | 95.2 ± 11.6 | 78.9 ± 13.2 |
| HTN pill number | 0 | 1.46 | 2.85 | 1.3 |
| Albumin (g/dL) | 3.61 ± 0.45 | 3.66 ± 0.55 | 3.68 ± 0.41 | 3.65 ± 0.50 |
| Hemoglobin (g/dL) | 10.1 ± 1.6 | 10 ± 1.5 | 9.6 ± 1.2 | 10 ± 1.5 |
| D/P ratio | 0.66 ± 0.10 | 0.65 ± 0.12 | 0.68 ± 0.08 | 0.66 ± 0.11 |
| Kt/V | 1.8 ± 0.43 | 1.74 ± 0.58 | 1.79 ± 0.49 | 1.77 ± 0.56 |
| Urine kt/V | 0.426 ± 0.51 | 0.366 ± 0.48 | 0.282 ± 0.29 | 0.37 ± 0.47 |
| Urine volume (mL) | 488 ± 557 | 512 ± 730 | 417 ± 463 | 492 ± 635 |
| Variables | Study Group | Control Group | p |
|---|---|---|---|
| Age | 56.4 (25~80) | 55.6 (20~83) | NS |
| Gender (males) | 24 (40%) | 27(43%) | NS |
| DM | 14 (23%) | 12 (19%) | NS |
| APD | 4 (7%) | 6 (10%) | NS |
| Weight (kg) | 58.2 ± 1.4 | 58.1 ± 1.7 | NS |
| BMI (Kg/M2 ) | 22.8 ± 4.0 | 22.5 ± 4.1 | NS |
| Peritoneal D/P ratio | 0.65 ± 0.13 | 0.66 ± 0.11 | NS |
| Dialysis adequacy (nKT/V) | 1.74 ± 0.08 | 1.77 ± 0.07 | NS |
| ACEI/ARB prescription | 16(26%) | 18(30% ) | NS |
| 4.25% hypertonic PD solution | 2(3%) | 2(3%) | NS |
| Hematocrit (%) | 29.8 ± 0.65 | 29.1 ± 0.52 | NS |
| Total cholesterol (mg/dL) | 182.6 ± 6.5 | 191.7 ± 5.8 | NS |
| Serum BUN (mg/dL) | 58.7 ± 2.7 | 58.5 ± 2.1 | NS |
| Serum creatinine (mg/dL) | 10.7 ± 0.4 | 10.7 ± 0.4 | NS |
| ECW: TBW (×100%) | 34.49 ± 1.00 | 34.76 ± 1.21 | NS |
| nECW in females (L/m) | 7.06 ± 0.95 | 6.96 ± 0.92 | NS |
| nECW in males (L/m) | 8.62 ± 0.99 | 8.89 ± 1.44 | NS |
| Data in the Beginning | Study Group (n = 60) | Control Group (n = 62) | p |
|---|---|---|---|
| Furosemide dosage (mg) | 92.8 ± 10.2 | 85.2 ± 13.1 | NS |
| Urine volume (ml/day) | 888 ± 136 (n = 34) | 698 ± 75 (n = 35) | NS |
| Renal KT/V | 0.667 ± 0.085 | 0.587 ± 0.619 | NS |
| Renal nWCC (L/week) | 34.5 ± 4.4 | 30.6 ± 5.5 | NS |
| SBP (mmHg) | 132.4 ± 2.7 | 135.2 ± 3.3 | NS |
| DBP (mmHg) | 78.7 ± 1.7 | 78.2 ± 1.8 | NS |
| Antihypertensive drugs | 2.97 ± 0.77 (n = 32) | 2.63 ± 0.75 (n = 29) | NS |
| ACEI/ARB prescription | 16(31%) | 18(36%) | NS |
| ECW: TBW (×100%) | 34.49 ± 1.00 | 34.76 ± 1.21 | NS |
| nECW in females (L/m) | 7.06 ± 0.95 | 6.96 ± 0.92 | NS |
| nECW in males (L/m) | 8.62 ± 0.99 | 8.89 ± 1.44 | NS |
| Albumin (g/dL) | 3.73 ± 0.43 | 3.59 ± 0.53 | NS |
| HS-CRP (md/dL) | 0.430 ± 0.085 | 0.485 ± 0.104 | NS |
| 1.5% PD dialysate utilization (%) | 84.6 ± 20.2 | 85.8 ± 19.2 | NS |
| 2.5% PD dialysate utilization (%) | 23.2 ± 35.5 | 23.6 ± 35.3 | NS |
| 4.25% or ixoderin utilization (%) | 1.9 ± 6.6 | 0.4 ± 3.2 | NS |
| End of the Intervention (6th M) | Study Group (n = 57) | Control Group (n = 55) | |
| Delta body weight (kg) | −1.2 ± 0.4 | 0.1 ± 0.4 | 0.014 |
| Furosemide dosage | 96 ± 12.1 | 104.4 ± 13 | NS |
| Urine volume (ml/day) | 747 ± 150 (n= 31) | 534 ± 84 (n= 31) | NS |
| Renal KT/V | 0.52 ± 0.09 | 0.45 ± 0.09 | NS |
| Renal nWCC (L/week) | 24.9 ± 4.4 | 15.7 ± 3.2 | NS |
| Patient with RRF loss 30% | 4 (13%) | 5 (16%) | NS |
| SBP (mmHg) | 124.7 ± 2.7 | 136.8 ± 2.8 | <0.001 |
| DBP (mmHg) | 74.9 ± 1.9 | 80.5 ± 2.0 | 0.050 |
| Antihypertensive drugs | 2.56 ± 0.40 (n = 31) | 2.58 ± 0.30 (n = 29) | NS |
| ACEI/ARB prescription | 13 (25%) | 16 (32%) | NS |
| Delta ECW/TBW (×100%) | −0.063 ± 0.71 | −0.059 ± 0.67 | NS |
| Delta nECW (L/m) | −0.41 ± 0.13 | −0.08 ± 0.07 | 0.042 |
| Albumin (g/dL) | 3.77 ± 0.075 | 3.57 ± 0.070 | NS |
| HS-CRP (mg/dL) | 0.520 ± 0.114 | 0.620 ± 0.093 | NS |
| 1.5% PD dialysate utilization (%) | 81.3 ± 20.5 | 81.4 ± 19.3 | NS |
| 2.5% PD dialysate utilization (%) | 28.5 ± 36.8 | 28.9 ± 35.6 | NS |
| 4.25% or ixoderin utilization (%) | 2.1 ± 6.8 | 1.3 ± 5.7 | NS |
| End of the Maintenance (12th M) | Study Group (n = 52) | Control Group (n = 50) | |
| Delta body weight | −0.78 ± 0.53 | 0.28 ± 0.49 | NS |
| Furosemide dosage | 93.2 ± 11.8 | 98.4 ± 12.9 | NS |
| Urine volume (ml/day) | 652 ± 174 (n = 25) | 468 ± 112 (n = 26) | NS |
| Renal KT/V | 0.42 ± 0.10 | 0.28 ± 0.06 | NS |
| Renal nWCC (L/week) | 21.8 ± 5.0 | 13.6 ± 3.3 | NS |
| Patient with RRF loss >30% | 8 (32%) | 7 (27%) | NS |
| SBP (mmHg) | 130.1 ± 3.2 | 136.5 ± 3.5 | NS |
| DBP (mmHg) | 77.4 ± 2.1 | 79.6 ± 2.1 | NS |
| Antihypertensive drugs | 2.95 ± 0.35 (n = 29) | 2.77 ± 0.29 (n = 26) | NS |
| ACEI/ARB prescription | 13 (25%) | 14 (28%) | NS |
| Delta ECW/TBW (×100%) | −0.05 ± 0.89 | −0.08 ± 0.70 | NS |
| Delta nECW (L/m) | −0.03 ± 0.07 | 0.01 ± 0.12 | NS |
| Albumin (g/dL) | 3.65 ± 0.077 | 3.54 ± 0.89 | NS |
| HS-CRP (mg/dL) | 0.542 ± 0.102 | 0.811 ± 0.185 | NS |
| 1.5% PD dialysate utilization (%) | 76.1 ± 18.9 | 76.0 ± 18.2 | NS |
| 2.5% PD dialysate utilization (%) | 34.7 ± 35.9 | 35.7 ± 34.5 | NS |
| 4.25% or ixoderin utilization (%) | 3.2 ± 8.4 | 2.5 ± 7.6 | NS |
Publisher’s Note: MDPI stays neutral with regard to jurisdictional claims in published maps and institutional affiliations. |
© 2021 by the authors. Licensee MDPI, Basel, Switzerland. This article is an open access article distributed under the terms and conditions of the Creative Commons Attribution (CC BY) license (https://creativecommons.org/licenses/by/4.0/).
Share and Cite
Li, S.-Y.; Chuang, C.-L.; Lin, C.-C.; Tsai, S.-H.; Chen, J.-Y. Peritoneal-Membrane Characteristics and Hypervolemia Management in Peritoneal Dialysis: A Randomized Control Trial. Membranes 2021, 11, 768. https://doi.org/10.3390/membranes11100768
Li S-Y, Chuang C-L, Lin C-C, Tsai S-H, Chen J-Y. Peritoneal-Membrane Characteristics and Hypervolemia Management in Peritoneal Dialysis: A Randomized Control Trial. Membranes. 2021; 11(10):768. https://doi.org/10.3390/membranes11100768
Chicago/Turabian StyleLi, Szu-Yuan, Chiao-Lin Chuang, Chih-Ching Lin, Shin-Hung Tsai, and Jinn-Yang Chen. 2021. "Peritoneal-Membrane Characteristics and Hypervolemia Management in Peritoneal Dialysis: A Randomized Control Trial" Membranes 11, no. 10: 768. https://doi.org/10.3390/membranes11100768
APA StyleLi, S.-Y., Chuang, C.-L., Lin, C.-C., Tsai, S.-H., & Chen, J.-Y. (2021). Peritoneal-Membrane Characteristics and Hypervolemia Management in Peritoneal Dialysis: A Randomized Control Trial. Membranes, 11(10), 768. https://doi.org/10.3390/membranes11100768