Abstract
Seawater desalination is an alternative technology to provide safe drinking water and to solve water issues in an area having low water quality and limited drinking water supply. Currently, reverse osmosis (RO) is commonly used in the desalination technology and experiencing significant growth. The aim of this study was to analyze the environmental impacts of the seawater reverse osmosis (SWRO) plant installed in Kampung Pantai Senok, Kelantan, as this plant was the first installed in Malaysia. The software SimaPro 8.5 together with the ReCiPe 2016 database were used as tools to evaluate the life cycle assessment (LCA) of the SWRO plant. The results showed that the impact of global warming (3.90 kg CO2 eq/year) was the highest, followed by terrestrial ecotoxicity (1.62 kg 1,4-DCB/year) and fossil resource scarcity (1.29 kg oil eq/year). The impact of global warming was caused by the natural gas used to generate the electricity, mainly during the RO process. Reducing the environmental impact can be effectively achieved by decreasing the electricity usage for the seawater desalination process. As a suggestion, electricity generation can be overcome by using a high-flux membrane with other suitable renewable energy for the plant such as solar and wind energy.
1. Introduction
Three-quarters of the planet’s surface is covered with water. It is one of the most abundant sources in the world, with 97.5% of water consisting of salt water from the oceans, and 2.5% of the clean water existing in the atmosphere, ice mountains, and ground water [1]. According to Thompson et al. and Taikan and Rose [2,3], one in three people in the world is affected by water scarcity, and nearly one-fifth of the world’s inhabitants live in areas with water shortage problems. Compounded by the increasing global population, industrial development, and agricultural activity, many countries are facing water scarcity and quality problems and thus are unable to meet the demand of providing clean water [4]. Therefore, the available water supply is less than the public demand, and the problem is expected to worsen due to population growth, urbanization, climate change, and accretion in household and industrial use. It is estimated that the global water needs by the year 2030 will rise from 4500 billion cubic meters (m3) to 6900 billion m3. This amount of the surface water resources is frankly not sufficient for the future generations [5].
Increasing potable water scarcity due to water quality problems and shortages of water supply to the consumers needs to be solved by finding alternative ways. Seawater can be used as one of the alternative ways to overcome the shortage of freshwater supply, especially in rural and urban areas. The production of freshwater from seawater using a membrane-based process includes reverse osmosis, electrodialysis, membrane distillation, and evaporation [5]. The desalination of seawater is the most commonly used method in countries that suffer from a scarcity of potable water [6,7]. Abdel-aal et al. [8] stated that reverse osmosis (RO) was frequently used for seawater and brackish water desalination, water treatment, and wastewater restoration for the past 30 years due to its preferable and stable production of water and low-cost system as compared to others. Commercially developed RO technology for desalination needs a large amount of electricity to power the shaft to generate pump, and the electricity is produced from non-renewable and fossil fuels pollutant.
According to previous studies, the water demand in Malaysia is growing at a rate of 4% annually and is predicted by 2020 to achieve about 20 billion m3 [9]. About 25 river basins have been identified as areas with water scarcity problems, and most of the rivers have already reached their maximum capacity and have been polluted at some stages [10]. The residence of Kelantan is facing unsteady water management due to outmoded water conveyance and deficient water storage capacity. Thus, these problems will restrict the conventional allocation of water to the residence. According to the report from the National Water Resources Survey [11], the abstraction rate for drinking water from the Kelantan River was at 60% or 254.074 million liters per day, while from groundwater was at 40% or 176.342 million liters per day. The Malaysian Government planned for the households in Kelantan to obtain clean water from 420 to 800 million liters daily in 2019. A desalination plant was built in Kampung Pantai Senok, Kelantan to provide clean and fresh potable water to the consumers due to the low quality of the groundwater in the rural area.
The environmental burdens caused by the installation of the desalination plant must be evaluated to provide environmentally friendly technology for the future development. Life cycle assessment (LCA) is a suitable tool to evaluate the environmental impacts, such as the depletion of natural resources and the environmental burden from desalination technologies [12,13]. The environmental impacts of the whole life cycle of the product, the process, and the activity can be quantified using LCA [14,15]. According to ISO 14040 [16], research on LCA has been carried out on the water treatment process, including desalination using RO, wastewater, and membrane industries. The main objective of this study focused on identifying the concepts of life cycle assessment and the main sources of environmental impacts during the operational phase of the seawater desalination plant. This study also evaluated the main sources of environmental impact considering the operational phase of the seawater desalination process.
2. RO Membranes in Desalination Technologies and Their Novel Theories
A membrane is a thin, semi-permeable layer located between two different phases of separation. Aspects of membrane classification include morphological forms (groups of asymmetric membranes and symmetrical membranes), existence forms (synthetic membranes and natural membranes), module shapes (flat membranes and tube membranes), and pore measurements (macropores, mesopores, and micropores). The membrane processes for the reverse osmosis (RO) technology using one of the membranes welding in terms of driving force are high pressure thrust, as well as microfiltration (MF), ultrafiltration (UF), and piezodialysis [17]. Membrane performance in RO systems is the top choice by the water-treatment industry leaders due to low-energy consumption; application under normal conditions; ease to be combined (hybridized) with other operations; requiring no optional additives; simple and compact membrane module design specifications; and ease of utilizing in its operation [18,19]. For example, two studies by Zhang [20,21] reported that the use of rotating graphene nanoporous membranes with pores of diameter 2 to 4 nanometers successfully performed almost 100% salt rejection by using the RO system.
Currently, the membrane RO system is the most well-known technology used in desalination technology. The sea water reverse osmosis (SWRO) equipment is standardized, consisting of membranes, motors, pumps, valves, flow meters, and a pressure gauge. The SWRO system is commonly used, as it only requires a small space due to its modularity, automatic process control, and low cost for water production compared to other systems [20]. Due to the modular design of SWRO systems, the maintenance for the machine can be performed without shutting down the entire plant. SWRO is the process of water passing through a semi-permeable membrane from high salt concentration to a lower salinity solution via osmotic pressure to separate the salt and other dissolved contaminants from water [22]. For SWRO, a high amount of pressure is needed for the seawater osmotic pressure to force water to pass through the membrane [23]. Figure 1 and Figure 2 is a conventional RO plant framework for a desalination technology.
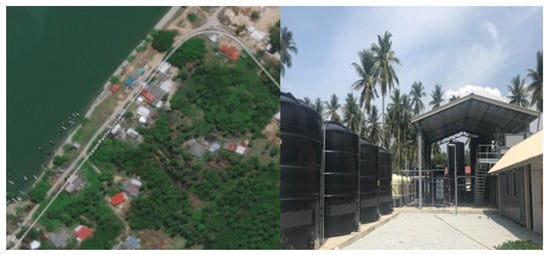
Figure 1.
Map of seawater reverse osmosis (SWRO) desalination plant located in Kampung Pantai Senok, Kelantan.
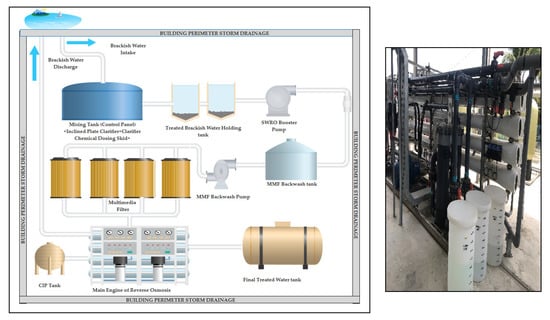
Figure 2.
Photograph of reverse osmosis (RO) membrane system (left), and design drawings of Senok plant adapted from the original sketch plan of Advanced Membrane Technology Research Centre (AMTEC), Universiti Teknologi Malaysia (UTM) (right).
Historically, the development of membrane technology began in 1627 by Sir Francis Bacon. Antonie Van Leewenhoek applied membrane research techniques using a microscope in 1676. Abbe Nollet introduced the semi-permeability concept in 1748. Then, in 1800 and 1804, Fick and Robert Thom [24,25], Sartorius Werke GmbH, Germany popularized small-scale membrane production in the industrial sector in 1950 [26,27]. Loeb and Sorajan created asymmetric membranes in the late 1950s [28], and the membrane was widespread commercialized in the 1960s and 1970s [29,30,31,32,33]. The literature boom also led to the development of decision-making methods designed to manage seawater desalination more efficiently, sustainably, and systematically in the 1990s until now [34,35,36]. Research by Antonio Martin et al. [37] successfully presented an overview of the application of life cycle assessment (LCA) to assess environmental performance and sustainability based on membrane technology processes. In 2005, the study by Raluy et al. [38] successfully used the LCA approach for different commercial desalination technologies, namely Multi-stage flash distillation (MSF), Multiple-effect distillation (MED), and Reverse Osmosis (RO) by modelling the results scores of different material loads, performing control mitigation to the affected variables. The variety of LCA works in the field of membrane desalination and technology has strengthened them as an effective method to assess alternative desalination environments.
To the best of the researchers’ knowledge, this was the first life cycle analysis (LCA) on an SWRO desalination plant in Malaysia that was implemented to lead a sustainable project operating framework, especially in rural areas affected by water supply crisis. Uniquely, LCA assessment using macro and meso approaches in this framework will delve into the evaluation process from “gate to gate”, including five levels of the SWRO system: water intake/water pumping, pre-treatment, reverse osmosis membrane separation, post-treatment, and water distribution. The author expects that the potential implementation of micro-approach to LCA for the performance of the RO hybrid membrane system is able to apply all the information generated from the findings of this study (for example, material input inventory system, uncertainty and equation value, model module, equipment, technology, and related infrastructure) to lead to economic and environmental savings. It is hoped that this LCA framework can be used to combine decision-making criteria from different disciplines, such as engineering, economics, the environment, and membrane commercial planning when seawater desalination investments are considered for expansion in other areas.
3. Materials and Methods
3.1. Area of Study
The survey of the SWRO desalination plant was conducted in Kampung Pantai Senok at Tawang District on the east of Kelantan with a latitude of 6.168325 and longitude of 102.3452891 [39]. Kampung Pantai Senok (Senok Beach village) had a population of 7680 people living along the coastal area near Pengkalan Datu River, as depicted in Figure 1. The residents of this area were 98% Malay, while the rest were Chinese or not a Malaysian citizen. The main employment sectors of the population were farmers and fishermen. This desalination plant development project was fully funded by the Ministry of Higher Education through the Translation Research Grant Scheme (TRGS) under the Ministry’s Sustainable Water Resources Strategic Research Action Plan. This desalination plant was the first plant installed in Malaysia as an initiative to provide clean and fresh potable water supply for the residents due to the low groundwater quality in the rural area and limited access to clean water. The total area of the SWRO plant installed in Kampung Pantai Senok was 762 square meters (m2) in Lot 1968 and 78 m2. This plant was able to benefit around 3000 users in the village. With the ability to produce 500,000 L of treated water per day, the water demand of as many as 10,000 people can be accommodated every day.
3.2. The Reverse Osmosis (RO) System
Figure 2 describes the existence of the SWRO membrane system within the confines of the LCA study system. The area of the desalination plant was estimated at around 315 m2, which was 21 m × 15 m. The SWRO desalination plant had been operating for one year with a capacity for seawater treatment of 0.5 million liters per day or 20.8 cubic meters per hour (m3/h) with an expenditure cost of Ringgit Malaysia (RM) 3,200,000. Details of capital costs for the six related phases respectively are as follows: (1) Pumping seawater; RM384,000, (2) Pre-treatment; RM416,000, (3) Desalination; RM1,152,000, (4) Wastewater; RM256,000, (5) Post-treatment; RM 96,000, and (6) Storing and delivering water; RM160,000. At the initial stage, seawater intake was pumped from the Pengkalan Datu River through 52 m of high-density polyethylene (HDPE) pipes. The second stage involved two pre-treatment processes: pre-treatment A and B. For pre-treatment A, brackish water with feed water around 80 m3/h was flowed into the mixing tank, inclined plate clarifier, clarifier chemical dosing skid, and seawater holding tank for coagulation, flocculation, and sedimentation processes. For pre-treatment B, the treated brackish water was pumped out of the seawater holding tank to the multimedia filter (MMF). Stage three was the desalination process. The SWRO machine removed all salts, fine particles, suspended particles and dissolved substances including bacteria from the RO feed water and produced fresh drinking water. The remaining salt water left by the SWRO system was dumped and returned to Sungai Pengkalan Datu. The final stage was the post-treatment process, in which the fresh drinking water was sent to the final water tank treatment for the disinfection of bacteria and pathogens using chlorine.
Basically, there were several stages involving preparation before, during, and in the application of RO membrane technology in this study. At the pre-treatment process stage, multimedia filter backwash, consisting of MMF backwash tank (capacity: 25 m3 per unit; power: 240/1/50 Hz) and MMF backwash pump (capacity: 35 m3/h; pressure gauges 2.5″ × 7 bar) filtered the total suspended solids (TSS) in the RO feed water so that possible damages to the RO membrane can be reduced. The adsorption process in the MMF system also involved two sizes of sand and a type of activated carbon made from coconut shells. At the current stage (operational) of SWRO membrane filtration, the estimated quantity of water product for 1 set of a seawater RO system used was 20.8 m3 per hour with permeate TDS; 210 ppm; and recovery of <5%. The spiral wound membrane module configuration was made from thin-film composite (TFC) for the purification process. This TFC consisted of three sections: a top layer (polyamide with 0.2 μm); a middle layer (120–150 μm polyethersulfone or polysulfone porous layer); and a bottom layer (40 μm non-woven fabric support sheet) [40]. In summary, the adaptation of membrane technology using integrated systems during the operating phase of this facility successfully achieved a minimal concentration of concentrated seawater and sludge, which is 614 L per year for concentrated saltwater and 0.5 tonnes per year for sludge.
3.3. LCA Method for Seawater Desalination
The environmental burden caused by the desalination plant was determined using the LCA approach. The environmental impacts of desalinated water including the electricity usage, materials, and operation of the desalination plant were calculated. According to ISO 14040 guidelines, LCA was divided into four phases:
- (a)
- Phase 1—Goal and Scope Definition: The goal for this research was to study the hotspot of environmental burdens for the SWRO desalination plant in Kampung Pantai Senok. The LCA approach was used as an evaluation method to analyze the environmental effects for both the installation and operational stages of the plant. The system boundary used in this research was gate to gate, which included the type of chemical and the electricity usage during the operational phase of the plant. The functional unit for this research was 1 m3 of desalinated seawater.
- (b)
- Phase 2—Life Cycle Inventory (LCI): This study only involved the operational phase of the seawater desalination process and did not include their piping system, water storage tank, and machinery due to their life time. Referring to Table 1, the LCI analysis contained inputs of chemicals and amount of electricity needed for 1 m3 of desalinated water. The data for chemicals used during the operational stage were obtained from Tarnacki et al. [41]. The energy consumption of seawater desalination plant for the operational phase was considered to be 3.1 kWh.
 Table 1. Inventory of operational phase of SWRO desalination.
 - (c)
- Phase 3—Life Cycle Impact Assessment (LCIA): The life cycle impact assessment was generated using ReCiPe 2016 from the LCA software, SimaPro 8.5. The input data gathered from the inventory were calculated using the software to evaluate the environmental impacts by the plant processes. The results from LCIA would determine the environmental burdens produced during the operational phase. The results were the midpoint impacts, which included 18 categories. The LCA library contained a database of energy consumption, emission, and material data to produce one unit of product.
- (d)
- Phase 4—Interpretation: The last phase of LCA was the interpretation of the results. This step involved the evaluation of the results from the inventory analysis and environmental impact assessment of the life stage process. The final stage of the desalination process was negligible due to the lower environmental load compared to the construction and operational stages of the desalination system. In conclusion, the outcomes and the recommendations for the product or the process were made for future studies and development.
4. Results and Discussion
4.1. Impact Assessment at the Midpoint Level
In this section, the method midpoint (H) for the Life Cycle Impact Assessment (ReCiPe) was used to assess the environmental impacts comprising of 18 impact categories for the SWRO operational phase, as shown in Table 2. The environmental impact assessment was evaluated and summarized based on the characterization of the main impact categories: source, ecotoxicity, and global warming. Referring to Table 2, climate change, fossil depletion, and human toxicity contributed the highest load of 98% compared to the other impact categories for the entire SWRO operational phase. This result showed that electricity and chemicals were among the main factors that yielded a significant load in the SWRO process. However, the release of halogenic anthropogenic can be classified as low risk at 2.6 × 10−0 kg CO2 eq per m3 per year, which is 23 times lower than the results reported in De Schryver et al. [42]. According to Huijbregts et al. [43], the ReCiPe output analysis was evaluated based on the hierarchical perspective using a long-term perspective, and the risk of this impact could be minimized by practicing the best management on the systems with identified hotspots.
Table 2.
Overall impact assessment results for operational phase.
Figure 3 shows the assessment for the relative energy contribution flow, the chemicals, and the use of membrane on the process impact in the SWRO operational phase. The electricity consumption during the operation of water desalination yielded the highest environmental load at 96%, followed by the use of chemicals and coagulants at 4%. The use of fossil fuels to generate electricity impacted all stages of the SWRO life cycle. The need to redesign the materials such as stainless steel and the use of an integrated electric grid could reduce the environmental impact category, especially on the issue of ozone depletion. Meanwhile, the potential contribution of chemicals and membrane was highest from components including soda ash, sodium hydrogen sulfite, nylon 6-6, glass-filled, sodium hydroxide, and polypropylene resin. According to Hancock et al. [44], the production of a membrane module for a desalination system requires a certain amount of raw materials, including chemicals such as cleaning and antiscalant agents, namely sodium hydroxide (NaOH), hydrochloric acid (HCl), sodium hypochlorite (NaOCl), and sodium tripolyphosphate (Na5P3O10). However, their relative contribution is regularly recorded as low environmental impact. In this study, the contribution of the chemicals was very low compared to that reported in other international studies [45,46]. It should be recognized that the lack of research collaboration between the local LCA community, academic analysts, and industry players will delay the recovery of sources and the control of environmental implications related to the Malaysian desalination sector. Based on this study, further research studies should be conducted on the SWRO management to avoid any additional environmental issues in the future, depending on the qualitative and quantitative assessments, measurement of short and long-term potential exposure, and analysis of more specific options.
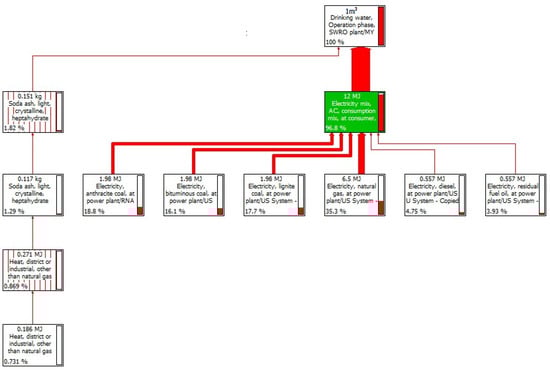
Figure 3.
Tree diagram for energy and chemical distribution in SWRO plant.
4.2. Comparison of the Operational Phase Impacts
Figure 4 shows the comparison of the relative contribution of impact categories based on the five stages of the Senok SWRO operation. Based on the plot, the terrestrial ecotoxicity and global warming category of the desalination–reverse osmosis and post-treatment stages produced the highest relative contribution to the impact categories in the SWRO process. The total electricity consumption for the membrane and pre-treatment operation for the desalination process was 2.82 kWh/m3 with the capacity of around 21 m3/h. These results showed that its main impacts were fossil resource scarcity, terrestrial ecotoxicity, and global warming. The results of this study are similar to those reported by other research groups [47,48,49]. According to Sabine and Thomas [50], the electric pump system will experience a large usage increment to force two streams of highly concentrated seawater and brine to freshwater through a permeable membrane. Then, the feed water goes through phases of catchment, removal, and demineralization.
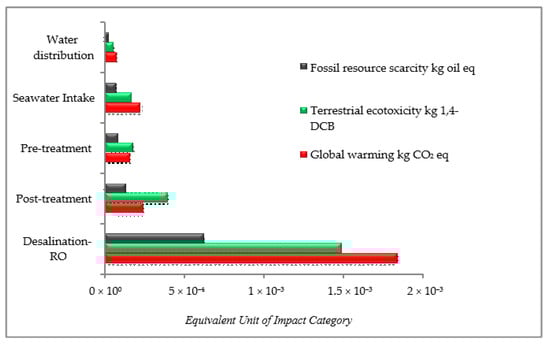
Figure 4.
Impact assessment results for the operational phase.
Based on the analysis of the life cycle on the point of risks in the SWRO system, several important summary and recommendations are shown in Table 3.
Table 3.
The alternative options for the mitigation aspects of the SWRO system.
4.3. Explantion of Reverse Osmosis (RO)—Water Quality Effects
Table 4 presents the comparison results of seawater quality analysis before and after treatment using the SWRO membrane technology conducted by AMTEC, Universiti Teknologi Malaysia (UTM). Among some important parameters, such as color, turbidity, boron, hardness, magnesium, sodium and sulfate content, and total dissolved solids, each showed a very different change, with low and good quality content values. Therefore, the removal of weak ions such as boron has met the maximum concentration of boron contained in mineral water of 0.5 mg/L according to the World Health Organization (WHO) standards [51]. According to Alkhudhiri et al. [52], the efficiency and effectiveness of the current SWRO membrane is able to eliminate around 94–96% of boron through the rejection of TDS and water production. Therefore, the application of hybrid SWRO membrane technology such as membrane distillation (MD) at high pH as well as boron adsorbent resin in the second and third stage can save production costs of about 20% in the SWRO membrane systems. This study also showed high trans-membrane pressure (TMP) with the first-pass RO permeate water at a capacity of 28 m3/h (pH: 5.7 at boost pressure of 43.7 bar) and second-pass RO permeate water at a capacity of 10 m3/h (pH: 5.7 at a power of 37 kW or 415/3/50 Hz). Consequently, this contributed to the increase in the passage of water flux across the membrane as well as the diffusion of better water quality. The RO membrane seems to provide the best results for water purification, reduction of employment, economic savings, and water products that taste more delicious and refreshing. Thus, this LCA case study highlights the importance to fill in key data gaps to further research on the development of the overall LCA approach on the SWRO-UF membrane, specifically at the Senok desalination plant.
Table 4.
Water quality analysis before and after treatment for Senok SWRO desalination.
4.4. Uncertainty Analysis
Referring to Figure 5, the Monte Carlo simulation results for the uncertainty analyses by using the SimaPro software algorithm adopted confidence intervals of 95% for 1000 iterations. The results obtained presented the characterization modeling of climate change impact with a mean value of 3.68 kg CO2-eq, followed by fossil depletion with 1.28 kg oil eq. This is because these two categories have significant impacts and the highest control over the interpretation of SWRO system analysis. Undeniably, the contributing factors indicated that other categories of impacts such as acidification, N2O emission, ecotoxicity, eutrophication, ionizing radiation, ozone and water depletion could cause impact but in a less visible contribution. The LCA results associated with these climate change indicators and fossil depletion can be significantly reduced if a number of contributing factors such as electricity usage during the operational phase are investigated in detail. At 2.5% deviation, the sensitivity value for climate change was 3.66 kg CO2-eq, producing cumulative effects of uncertainty that could be improved in terms of the suitability of data profiles, characterization, linear or non-linear modeling, process selection, and others. According to Finnveden [53], uncertainties occur due to selection errors, data inaccuracies, models, and epistemology. For this study, the most significant examples, the electrical profiles and raw input of chemical substance relied heavily on the Ecoinvent database from the European and international research literature. The hypothesis based on the findings of this uncertainty analysis is indeed helpful for the environmental decision-makers to enhance the resilience and sustainability of the desalination plant for a continuous period of time.
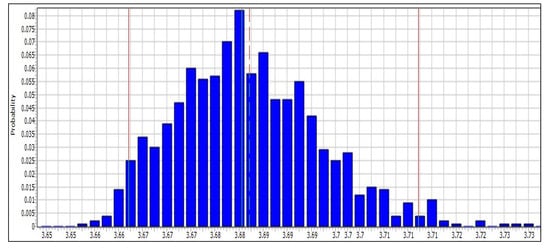
Figure 5.
The uncertainty analysis of 1 m3 of drinking water from the operational phase in the SWRO plant.
5. Conclusions
This paper examines whether the difference of load traces inherent in the SWRO system are capable of causing problems and concerns toward the social, economic, and costs aspects of local environment. Currently, there is a shortage in the effort of compiling complete inventory related to the management of input and output of desalination water in Malaysia. Thus, the effects of materials for the operational phase were successfully identified and described as three “hotspots” monitoring, which are electricity based on the use of fossil fuel sources that have a significant impact on input inventory and impact assessment results from the system stages of reverse osmosis, post-treatment, and seawater intake. Utilizing mitigation principles such as improved technology efficiency and the use of renewable source integration can minimize the release of pollutants laden to the environment. Henceforth, applying the principles of choosing the best assessment of emission control based on cost factors and adapting local regulations enforcement for different hybrid SWRO membrane system scales can provide good incentives and reputation to the practitioners of the desalination industry in Malaysia. The vision to provide environmentally friendly and sustainable SWRO technology also requires LCA practitioners to “dissect” and “extract” the justification of other load traces such as carbon footprints, water footprints, and energy footprint in accordance with more accurate literature and estimates. Finally, the author’s main recommendation is to conduct further research specifically on the LCA on SWRO membranes, as this paper has attempted to present the relationship of hot spots in the plant cycle chain with RO membrane existence.
Author Contributions
Data check and Formal analysis, L.A.G., I.S.N. and N.A.; Funding acquisition, N.A. and M.M.H.; Investigation, L.A.G., I.S.N., N.A. and M.M.H.; Methodology, L.A.G.; Project administration, L.A.G.; Supervision, L.A.G., N.A. and M.M.H.; Validation, L.A.G.; Writing—original draft, L.A.G. All authors have read and agreed to the published version of the manuscript.
Funding
This research was funded by Malaysia Ministry of Higher Education under the Translational Research Project.
Data Availability Statement
All data generated or analyzed during this study are included in this published article.
Acknowledgments
The authors would like to thank Malaysia Ministry of Higher Education on the initiative funding to the development of SWRO under Translational Research Project and the Universiti Malaysia Terengganu; Transdisciplinary Research Grant (TRGS): vote 53241 for supporting this project.
Conflicts of Interest
The authors declare no conflict of interest.
References
- Mahmoud, S.; Saffa, B.R. Water desalination technologies utilizing conventional and renewable energy sources. Int. J. Low-Carbon Technol. 2014, 9, 1–19. [Google Scholar]
- Thompson, T.; Fawell, J.; Kunikane, S.; Jackson, D.; Appleyard, S.; Callan, P.; Bartram, J.; Kingston, P. Chemical Safety of Drinking Water: Assessing Priorities for Risk Management; World Health Organization Publisher: Geneva, Switzerland, 2007; pp. 1–100. [Google Scholar]
- Taikan, O.; Quiocho, R.E. Economically challenged and water scarce: Identification of global populations most vulnerable to water crises. Int. J. Water Resour. Dev. 2020, 36, 416–428. [Google Scholar]
- Zhou, J.; Chang, V.W.C.; Fane, A.G. Environmental life cycle assessment of reverse osmosis desalination: The influence of different life cycle impact assessment methods on the characterization results. J. Desalin. 2011, 283, 227–236. [Google Scholar] [CrossRef]
- Farzaneh, M.; Siddiqui, H.; Pishbin, M.; Goordarzi, G.; Dehghani, S.; Date, A.; Akbarzadeh, A. Sustainable seawater desalination by permeate gap membrane distillation technology. J. Energy Procedia 2017, 110, 246–351. [Google Scholar]
- Aziz, N.I.H.A.; Hanafiah, M.M. Application of life cycle assessment for desalination: Progress, challenges and future directions. Environ. Pollut. 2021, 268, 115948. [Google Scholar] [CrossRef]
- Burn, S.; Hoang, M.; Zarzo, D.; Olewniak, F.; Campos, E.; Bolto, B.; Barron, O. Desalination techniques-A review of the opportunities for desalination in agriculture. Desalination 2015, 364, 2–16. [Google Scholar] [CrossRef]
- Abdel-Aal, E.; Farid, M.; Mohamed, A.; Mohamed, A.E. Desalination of red sea water using both electrodialysis and reverse osmosis as complementary methods. Egypt. J. Pet. 2015, 24, 71–75. [Google Scholar] [CrossRef]
- Zuraini, A.; Jaharudin, P.; Noorhaslinda Kulub, A.R.; Roseliza, M.A.; Haslina, M. Factors Affecting Water Demand: Macro Evidence in Malaysia. J. Ekon. Malays. 2019, 53, 17–25. [Google Scholar]
- Abdul Rahman, H. Water shortage in Malaysia: Again? Malays. Consum. Law J. 2014, 1, 115–128. [Google Scholar]
- National Water Resources. Review the National Water Resources (2000–2050) and Formulation of National Water Resources Policy-Volume 6 Water Resources Decision Support System Framework, Final Report. Malaysia. Available online: https://www.water.gov.my/jps (accessed on 10 June 2010).
- Zhou, J.; Chang, V.W.C.; Fane, A.G. Life cycle assessment for desalination: A review on methodology feasibility and reliability. J. Water Res. 2014, 61, 210–223. [Google Scholar] [CrossRef]
- Daniella, S.; Stephanie, K.L.; Ishii, P.W.E. Case study of life cycle assessment of coastal utility experiencing saltwater intrusion. J. AWWA 2015, 107, 543–548. [Google Scholar]
- Pieragostini, C.; Mussati, M.C.; Aguirre, P. On process optimization considering LCA methodology. J. Environ. Manag. 2012, 96, 43–54. [Google Scholar] [CrossRef] [PubMed]
- Jia, X.; Klemeš, J.J.; Petar, S.V.; Sharifah Rafidah, W.A. Analyzing the Energy Consumption, GHG Emission, and Cost of Seawater Desalination in China. Energies 2019, 12, 463. [Google Scholar] [CrossRef]
- ISO 14040. Environmental Management: Life Cycle Assessment–Principle of Framework; CEN: Brussels, Belgium, 2006; pp. 1–35. [Google Scholar]
- Obotey Ezugbe, E.; Rathilal, S. Membrane Technologies in Wastewater Treatment: A Review. Membranes 2020, 10, 89. [Google Scholar] [CrossRef]
- Homaeigohar, S.; Elbahri, M. Graphene membranes for water desalination. NPG Asia Mater. 2017, 9, e427. [Google Scholar] [CrossRef]
- Tian, X.; Cao, Z.; Wang, J.; Chen, J.; Wei, Y. Development of high-performance mixed matrix reverse osmosis membranes by incorporating aminosilane-modified hydrotalcite. RSC Adv. J. 2020, 10, 5648–5655. [Google Scholar] [CrossRef]
- Zhang, Z.; Zhang, F.; Liu, Z.; Cheng, G.; Wang, X.; Ding, J. Molecular Dynamics Study on the Reverse Osmosis Using Multilayer Porous Graphene Membranes. Nanomaterials 2018, 8, 805. [Google Scholar] [CrossRef]
- Zhang, Z.; Li, S.; Mi, B.; Wang, J.; Ding, J. Surface slip on rotating graphene membrane enables the temporal selectivity that breaks the permeability-selectivity trade-off. Sci. Adv. 2020, 6, eaba9471. [Google Scholar] [CrossRef]
- Zamri, W.M. Groundwater for domestic needs in Kelantan. Water Malays. 2009, 20, 6–10. [Google Scholar]
- Lawler, W.; Alvarez-Gaitan, J.; Leslie, G.; Le-Clech, P. Comparative life cycle assessment of end-of-life options for reverse osmosis membranes. J. Desalin. 2015, 444, 44–52. [Google Scholar] [CrossRef]
- Atab, S.M.; Smallbone, A.J.; Roskilly, A.P. A Hybrid reverse osmosis/adsorption desalination plant for irrigation and drinking water. J. Desalin. 2018, 444, 44–52. [Google Scholar] [CrossRef]
- Mulder, M. Basic Principle of Membrane Technology, 2nd ed.; Kluwer Academic Publishers: Boston, MA, USA, 1996; pp. 1–20. [Google Scholar]
- McGregor, W.C. Membrane Separation in Biotechnology; Taylor & Francis Group: New York, NY, USA, 1986; pp. 1–30. [Google Scholar]
- Alzahrani, S.; Mohammad, A.W. Challenges and trends in membrane technology implementation for produced water treatment: A review. J. Water Process Eng. 2014, 4, 107–133. [Google Scholar] [CrossRef]
- Glater, J. The early history of reverse osmosis membrane development. Desalination 1998, 117, 297–309. [Google Scholar] [CrossRef]
- Uemura, T.; Kotera, K.; Henmi, M.; Tomioka, H. Membrane technology in seawater desalination: History, recent developments and future prospects. Desalin. Water Treat. 2011, 33, 283–288. [Google Scholar] [CrossRef]
- Yang, Z.; Zhou, Y.; Feng, Z.; Rui, X.; Zhang, T.; Zhang, Z. A Review on Reverse Osmosis and Nanofiltration Membranes for Water Purification. Polymers 2019, 11, 1252. [Google Scholar] [CrossRef]
- Rodríguez-Calvo, A.; Silva-Castro, G.A.; Osorio, F.; González-López, J.; Calvo, C. Reverse osmosis seawater desalination: Current status of membrane systems. Desalin. Water Treat. 2015, 56, 849–861. [Google Scholar] [CrossRef]
- Li, D.; Wang, H. Recent developments in reverse osmosis desalination membranes. J. Mater. Chem. 2010, 22, 4551–4566. [Google Scholar] [CrossRef]
- Ghernaout, D. Reverse Osmosis Process Membranes Modeling—A Historical Overview. J. Civ. Constr. Environ. Eng. 2017, 4, 112–122. [Google Scholar]
- Rautenbach, R.; Albrecht, R. Membrane Processes; John Wiley & Sons: New York, NY, USA, 1989; pp. 1–35. [Google Scholar]
- Al-Nory, M.; Graves, S. Water desalination supply chain modeling and optimization, Date Engineering Workshops (ICDEW). In Proceedings of the 2013 IEEE 29th International Conference, Brisbane, Australia, 8–11 April 2013. [Google Scholar]
- Almansoori, A.; Saif’, Y. Design and operation of water desalination supply chain using mathematical modelling approach. Desalination 2014, 351, 184–201. [Google Scholar]
- Martins, A.A.; Caetano, N.S.; Mata, T.M. LCA for Membrane Processes. In Sustainable Membrane Technology for Water and Wastewater Treatment; Springer: Singapore, 2017; pp. 23–63. [Google Scholar]
- Raluy, R.G.; Serra, L.; Uche, J. Life Cycle Assessment of water production technologies. Part 1: Life Cycle Assessment of different commercial desalination technologies (MSF, MED, RO). Int. J. Life Cycle Assess. 2005, 10, 285–293. [Google Scholar] [CrossRef]
- Abdul Ghani, L.; Nazaran, I.S.; Ali, N.; Hanafiah, M.M. Improving Prediction Accuracy of Socio-Human Relationships in a Small-Scale Desalination Plant. Sustainability 2020, 12, 6949. [Google Scholar] [CrossRef]
- Ehsan Yakavalangi, M.; Rimaz, S.; Vatanpour, V. Effect of surface properties of polysulfone support on the performance of thin film composite polyamide reverse osmosis membranes. J. Appl. Polym. 2017, 134. [Google Scholar] [CrossRef]
- Tarnacki, K.; Menese, M.; Melin, T.; Medevoort, J.V.; Jansen, A. Environmental assessment of desalination processes: Reverse osmosis and memstill. J. Desalin. 2012, 296, 69–80. [Google Scholar] [CrossRef]
- De Schryver, A.; Struijs, J.; Van Zelm, R. Recipe 2008: A Life Cycle Impact Assessment Method Which Comprises Harmonised Category Indicators at the Midpoint and the Endpoint Level; Ministry of Housing, Spatial Planning and the Environment: Amersfoort, The Netherlands, 2009; pp. 1–50.
- Huijbregts, M.A.J.; Steinmann, Z.J.N.; Elshout, P.M.F.; Stam, G.; Verones, F.; Vieira, M.D.M.; Van Zelm, R. ReCiPe 2016 v1.1. A Harmonized Life Cycle Impact Assessment Method at Midpoint and Endpoint Level. Report I: Characterization; Department of Environmental Science, Radbound University: Nijmegen, The Netherlands, 2017; pp. 1–40. [Google Scholar]
- Hancock, N.T.; Black, N.D.; Cath, T.Y. A comparative life cycle assessment of hybrid osmotic dilution desalination and wastewater reclamation processes. J. Water Res. 2012, 46, 1145–1154. [Google Scholar] [CrossRef] [PubMed]
- Monnot, M.; Nguyen, H.T.K.; Laborie, S.; Cabassud, C. Seawater reverse osmosis desalination plant at community-scale: Role of an innovative pre-treatment on process performances and intensification. J. Chem. Eng. Process. Process Intensif. 2017, 113, 42–55. [Google Scholar] [CrossRef]
- Mannan, M.; Alhaj, M.; Mabrouk, A.N.; Al-Ghamdi, S.G. Examining the life-cycle environmental impacts of desalination: A case study in the State of Qatar. Desalination 2019, 452, 238–246. [Google Scholar] [CrossRef]
- Zolfagharian, S.; Nourbakhsh, M.; Izizarry, J.; Raessang, A.; Gheisari, M. Environmental impact assessment on construction sites. Constr. Res. Congr. 2012, 1, 1750–1757. [Google Scholar]
- Mannan, M.; Al-Ghamdi, S.G. Integrating concentrated solar power with seawater desalination technologies: A multiregional environmental assessment. Environ. Res. Lett. 2019, 14, 074014. [Google Scholar]
- Goga, T.; Friedrich, E.; Buckley, C.A. Environmental life cycle assessment for potable water production—A case study of se water desalination and mine-water reclamation in South Africa. Water SA 2019, 45, 700–709. [Google Scholar] [CrossRef]
- Sabine, L.; Thomas, H. Environmental impact and impact assessment of seawater desalination. Desalination 2008, 220, 1–15. [Google Scholar]
- Wolska, J.; Bryjak, M. Methods for boron removal from aqueous solutions—A review. J. Desalin. 2013, 310, 18–24. [Google Scholar] [CrossRef]
- Alkhudhiri, A.; Bin Darwish, N.; Hakami, M.W.; Abdullah, A.; Alsadun, A.; Abu Homod, H. Boron Removal by Membrane Distillation: A Comparison Study. Membranes 2020, 10, 263. [Google Scholar] [CrossRef] [PubMed]
- Finnveden, G. On the Limitations of Life Cycle Assessment and Environmental Systems Analysis Tools in General. Int. J. Life Cycle Assess. 2012, 5, 229–238. [Google Scholar] [CrossRef]


Publisher’s Note: MDPI stays neutral with regard to jurisdictional claims in published maps and institutional affiliations. |
© 2021 by the authors. Licensee MDPI, Basel, Switzerland. This article is an open access article distributed under the terms and conditions of the Creative Commons Attribution (CC BY) license (http://creativecommons.org/licenses/by/4.0/).