Solid-State EDLC Device Based on Magnesium Ion-Conducting Biopolymer Composite Membrane Electrolytes: Impedance, Circuit Modeling, Dielectric Properties and Electrochemical Characteristics

 ,
,  ,
,  ,
, 
Abstract
1. Introduction
2. Experimental Details
2.1. Sample Preparation
2.2. Characterization Methods
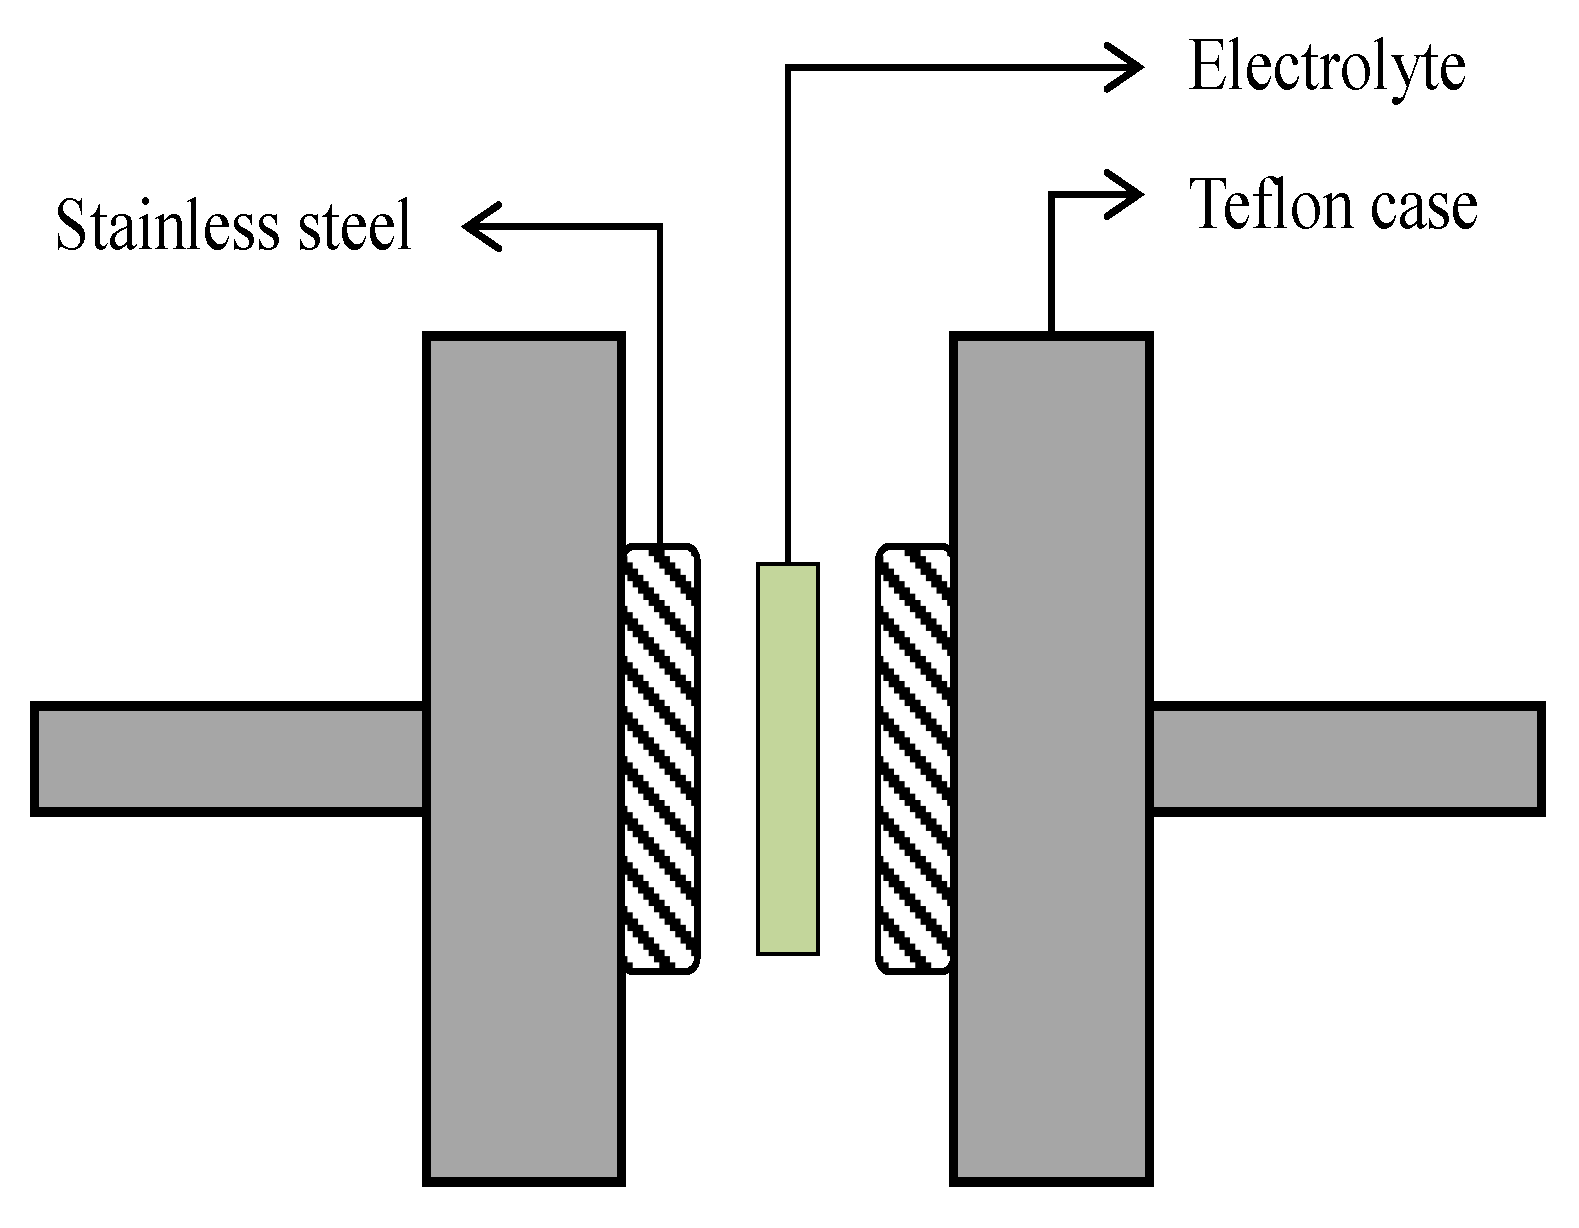
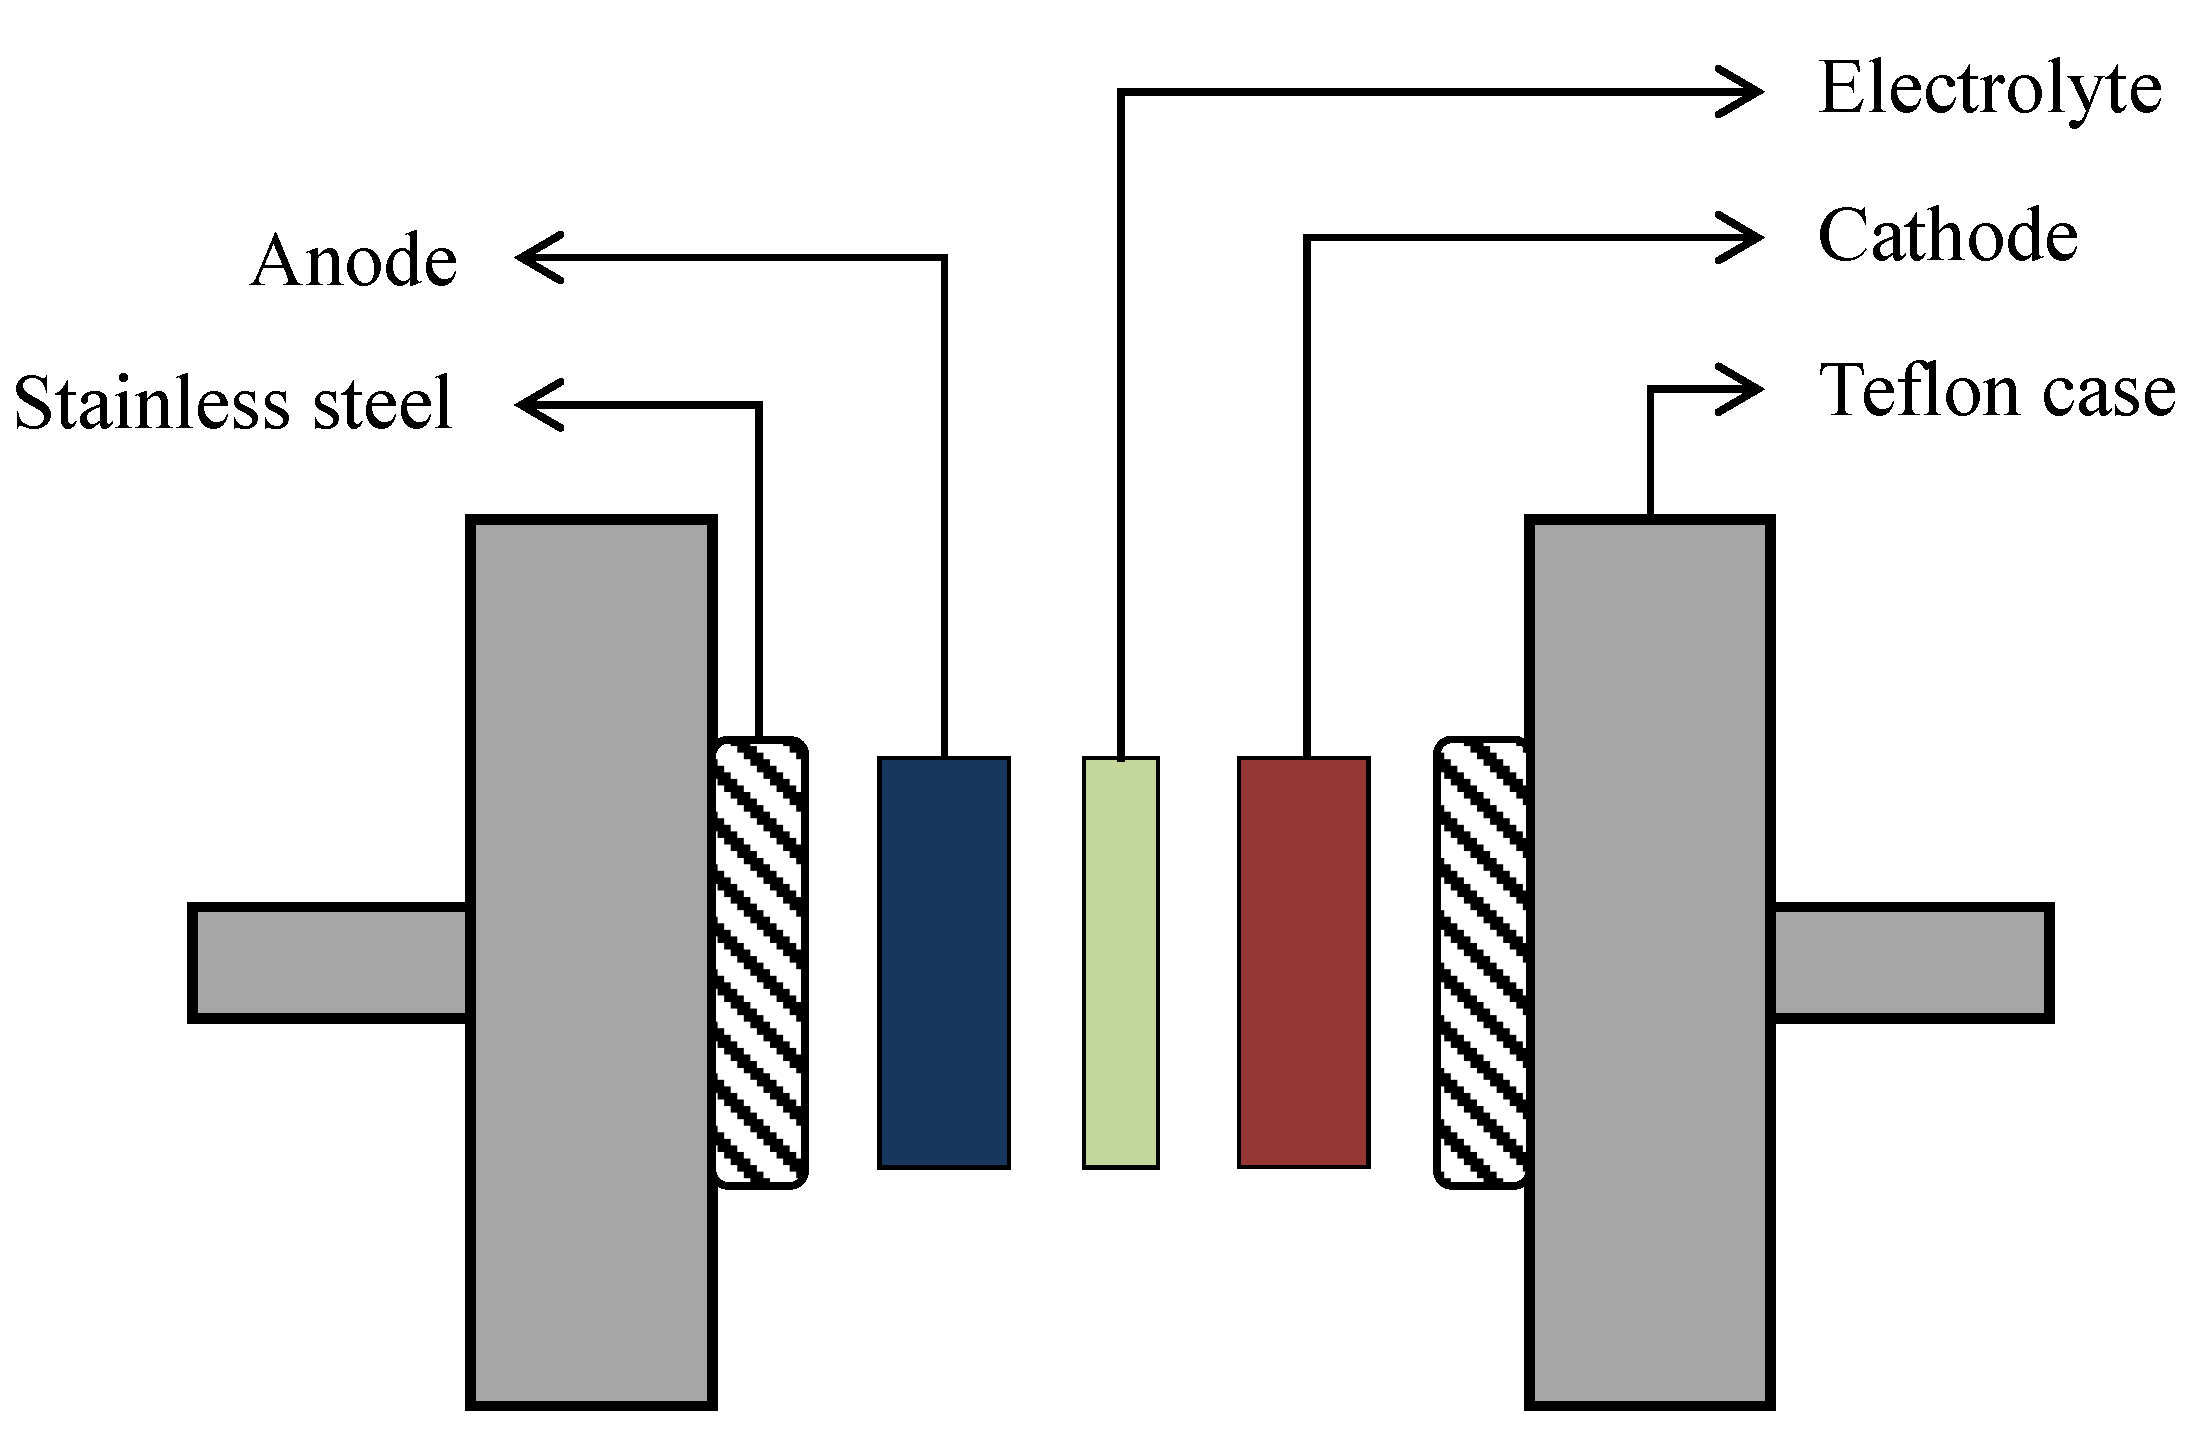
2.3. EDLC Fabrication
3. Results and Discussion
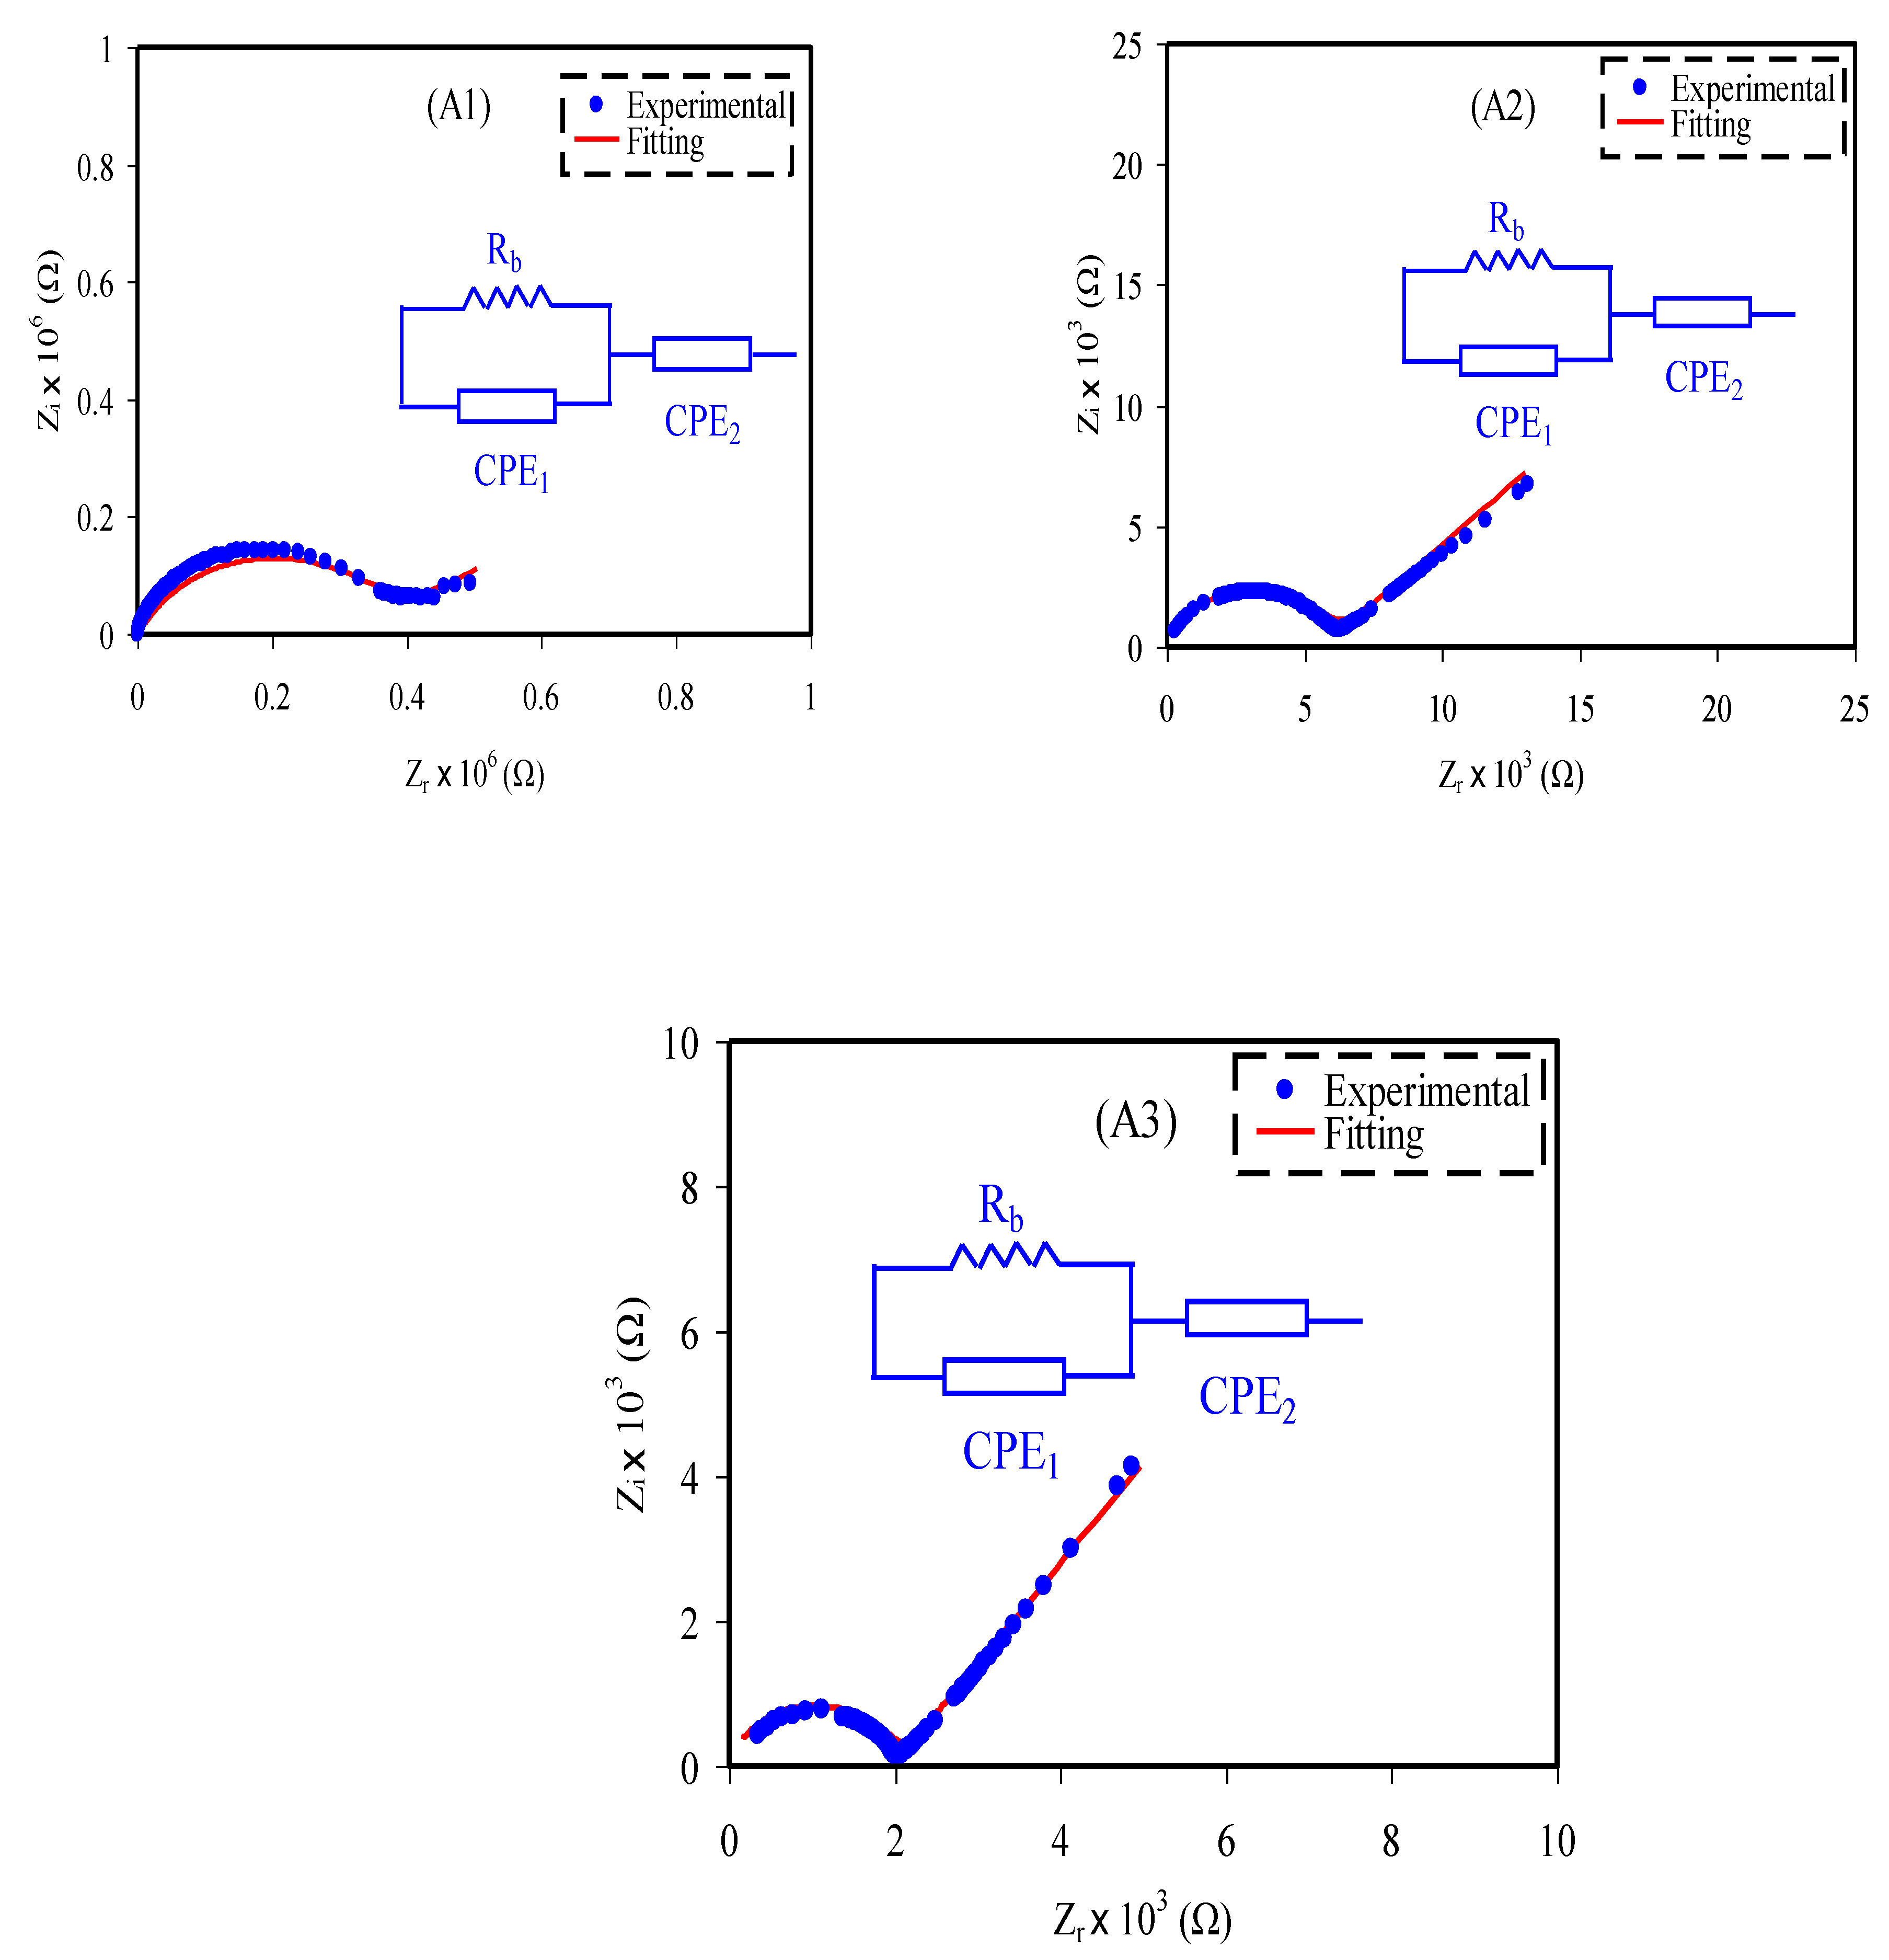
3.1. Impedance Study
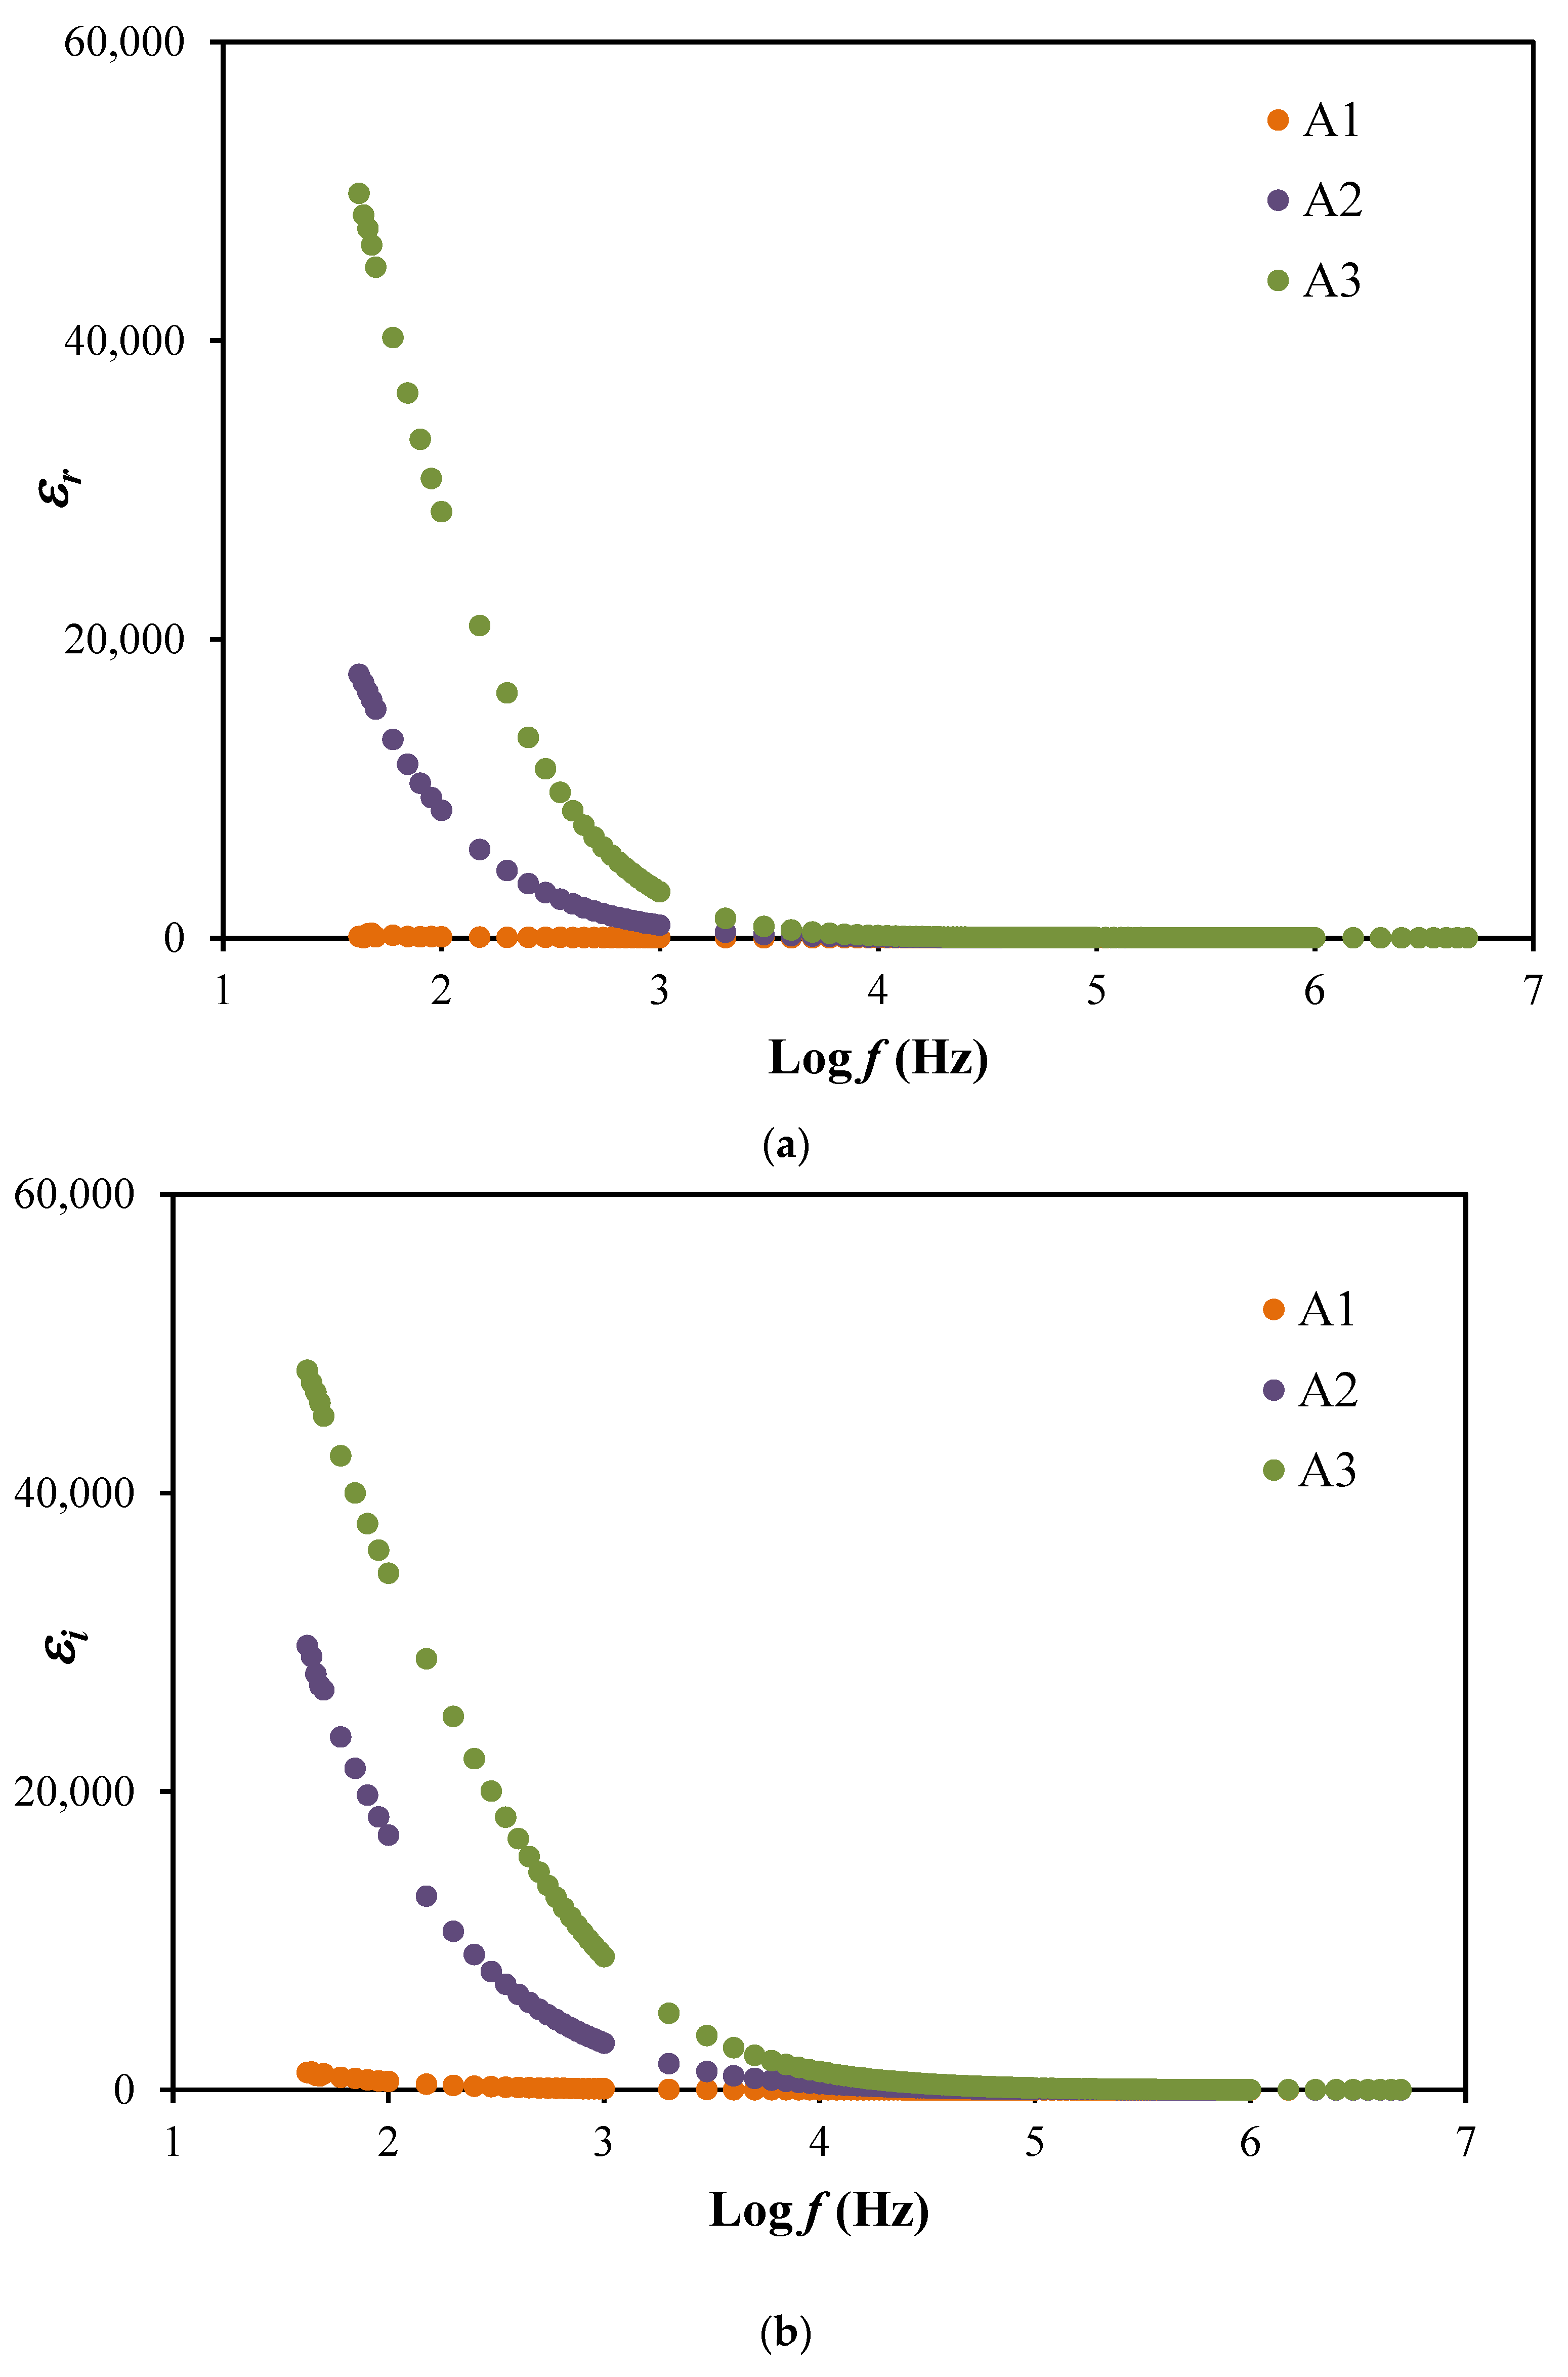
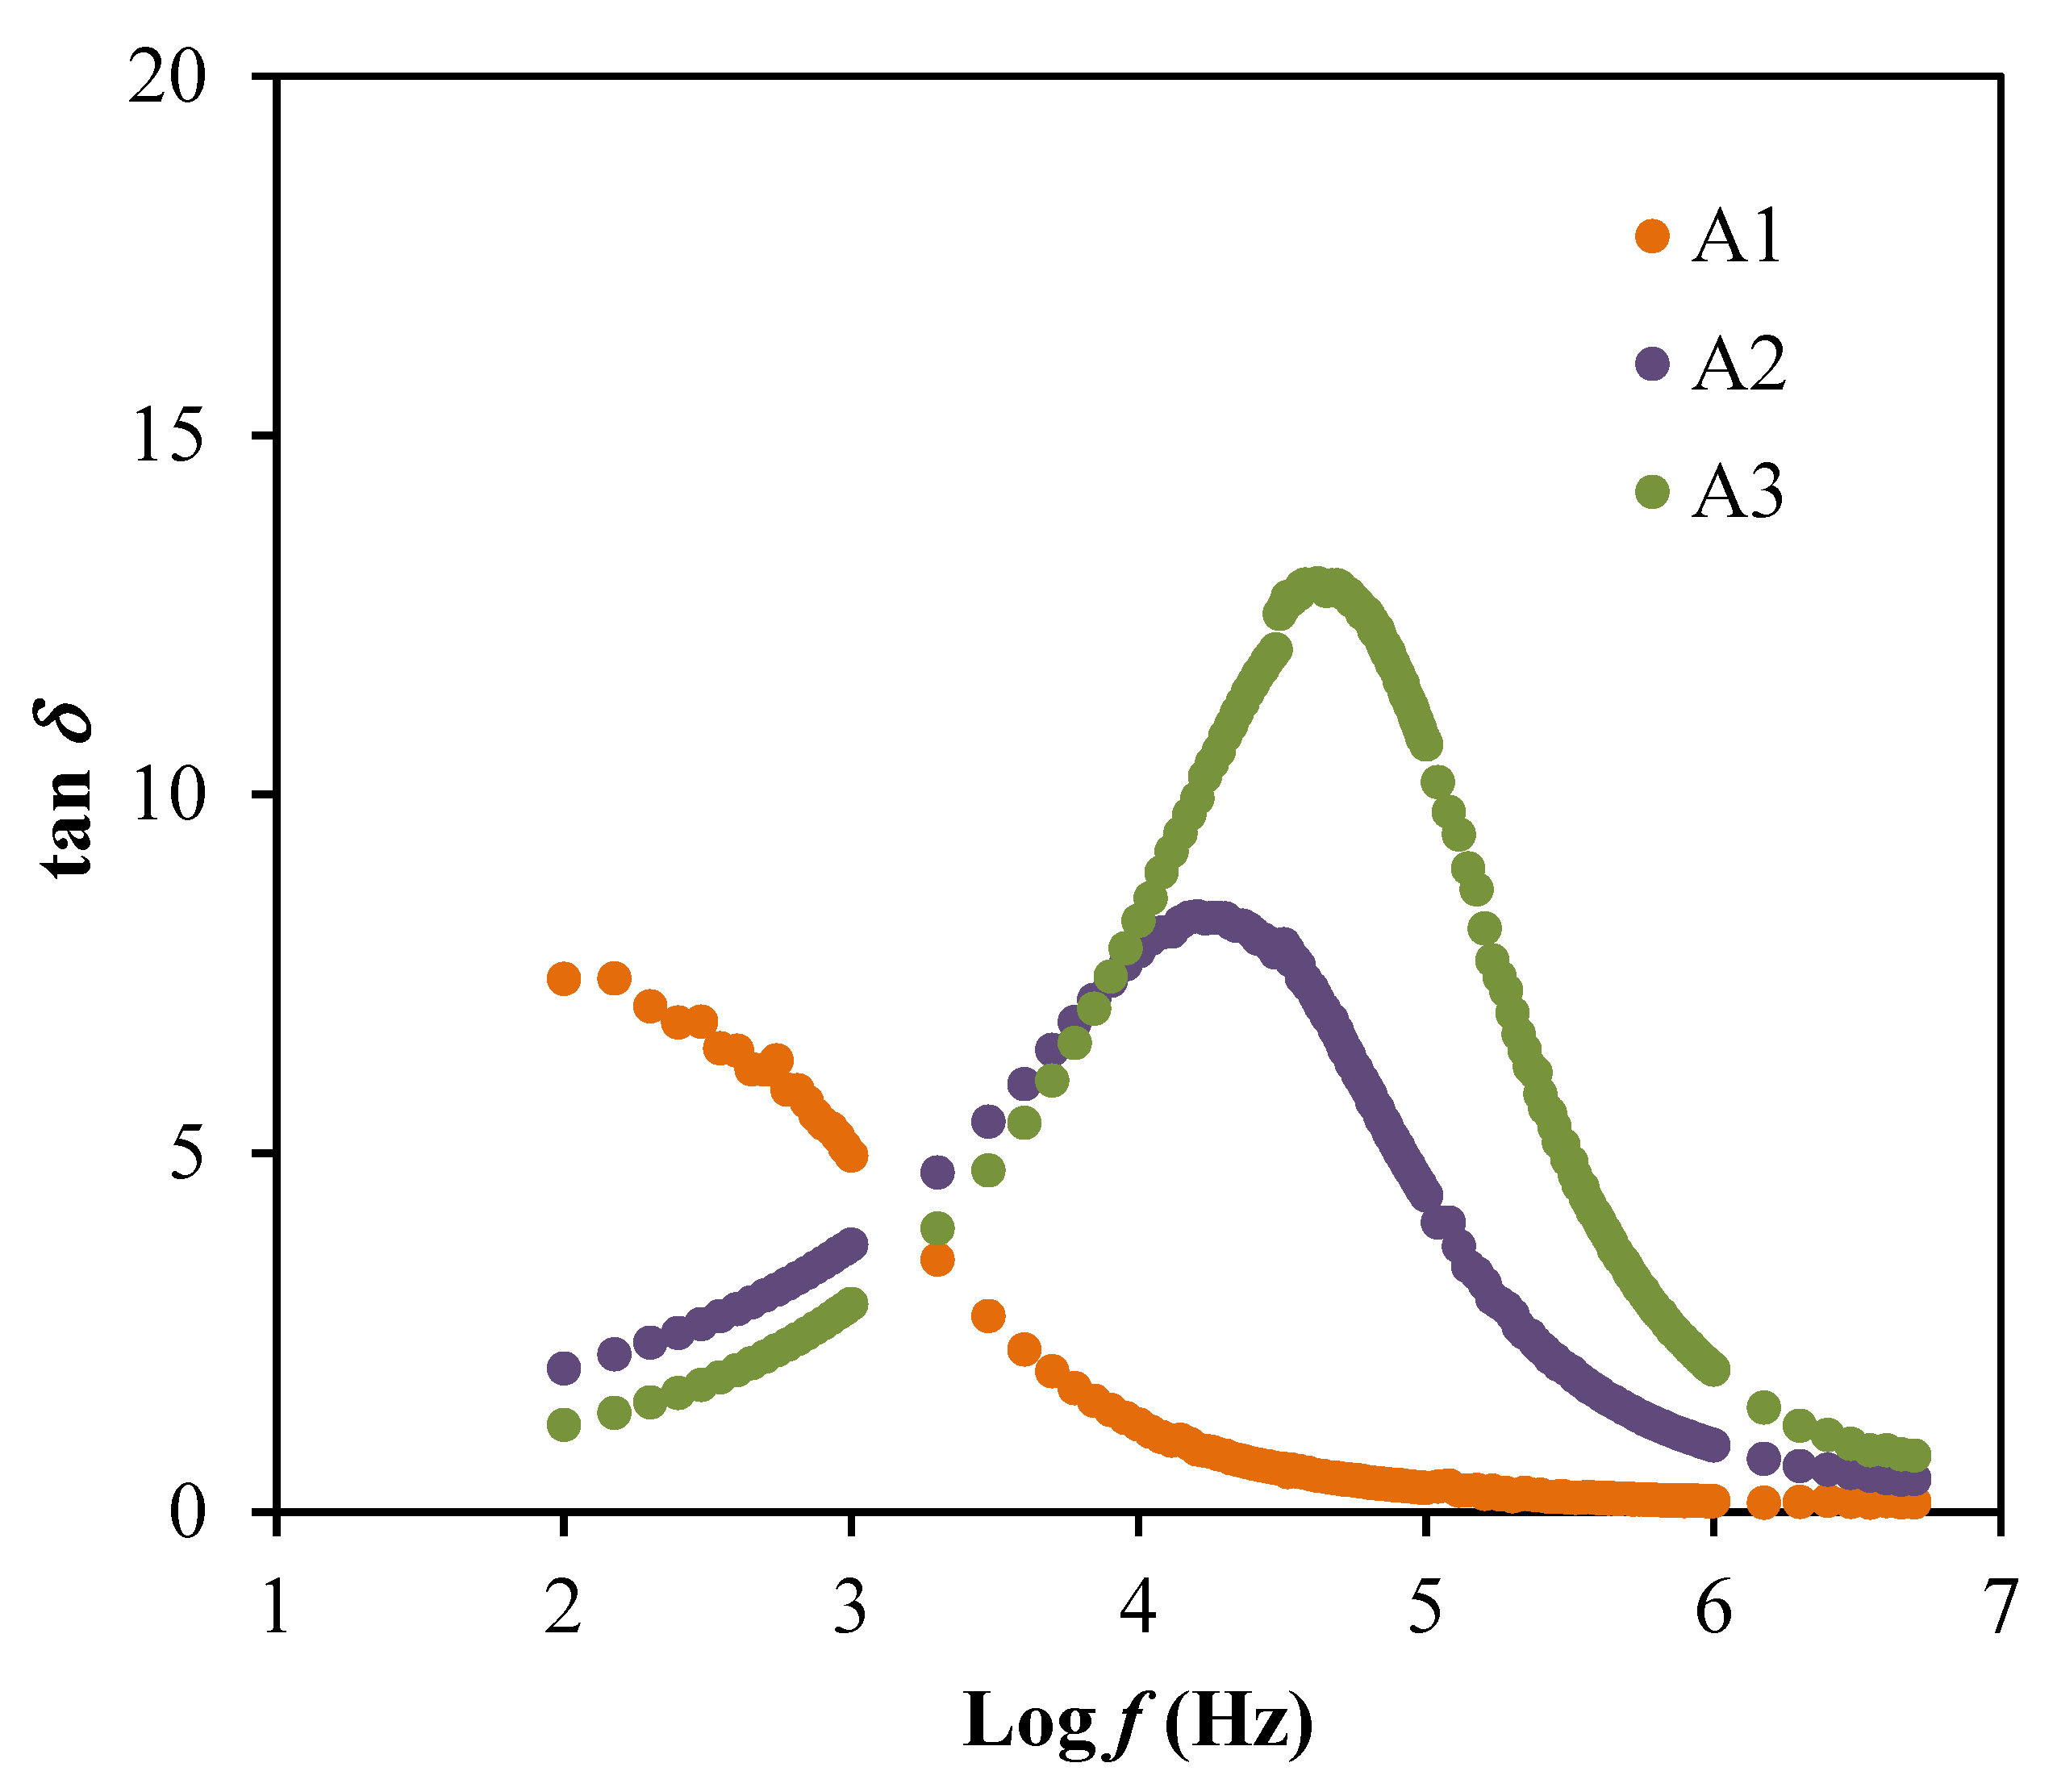
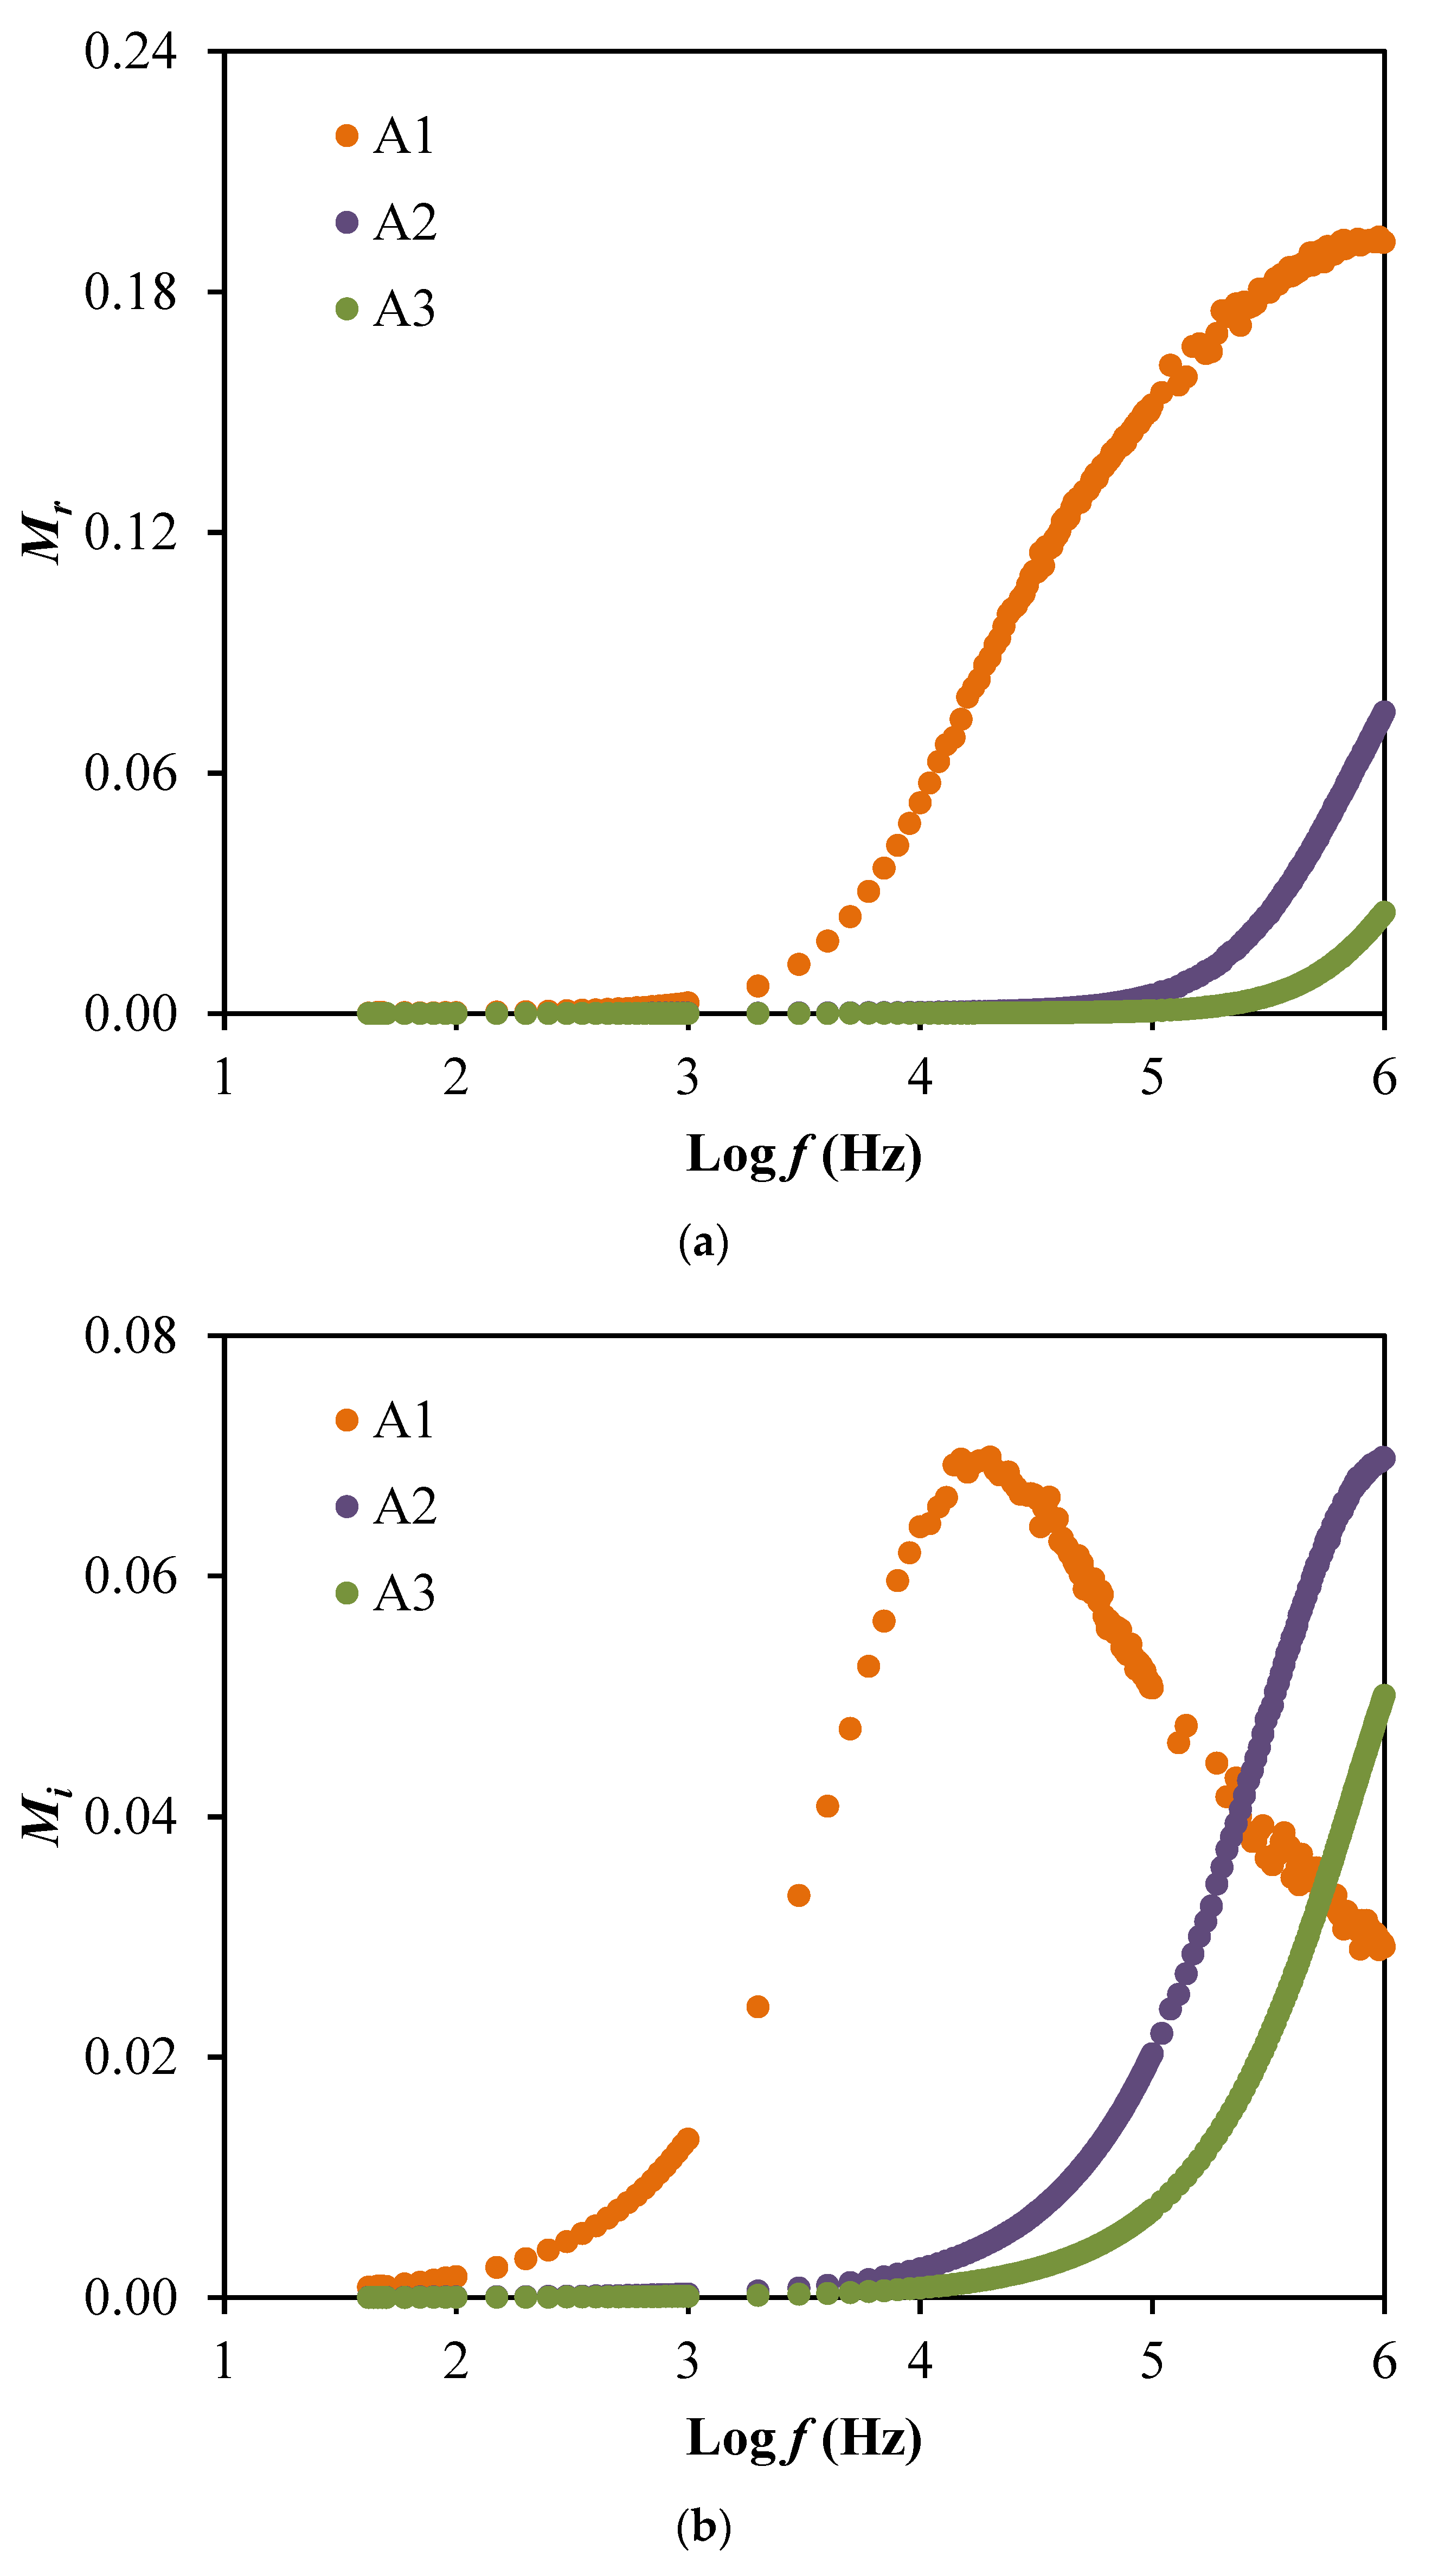
3.2. Dielectric and Electric Modulus Studies
3.3. Transport Study
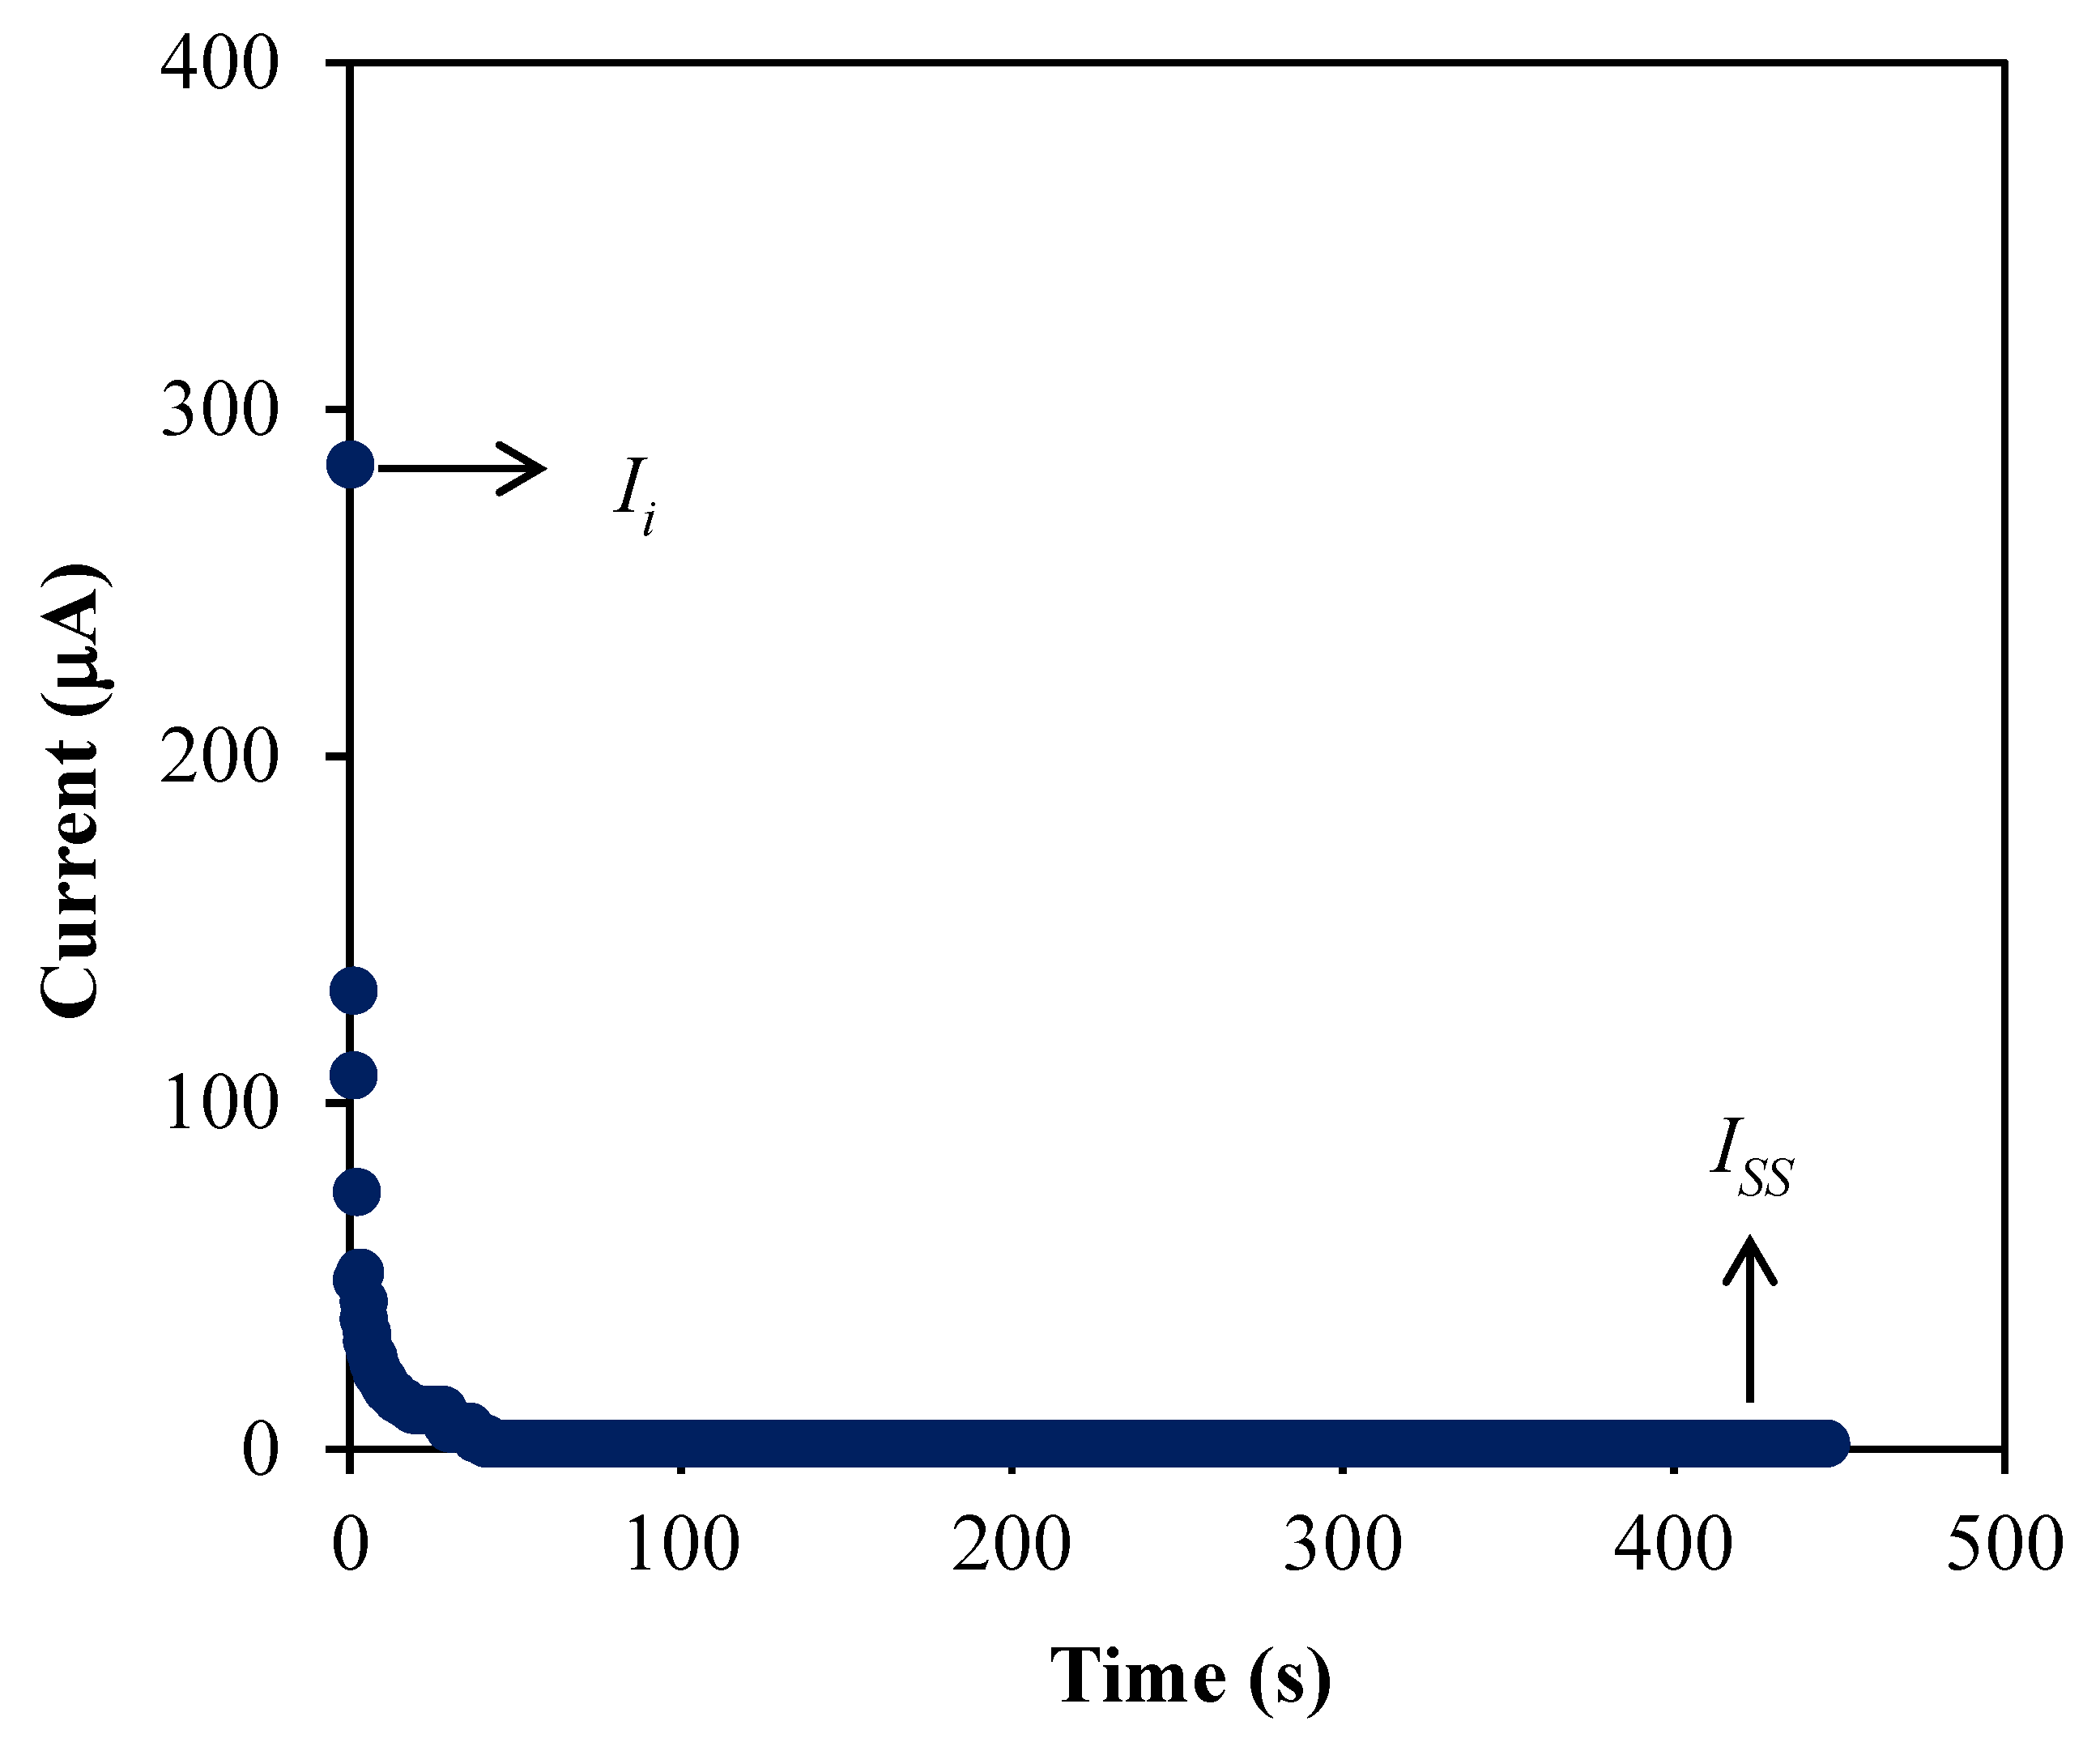
3.4. Transference Number Measurement (TNM)
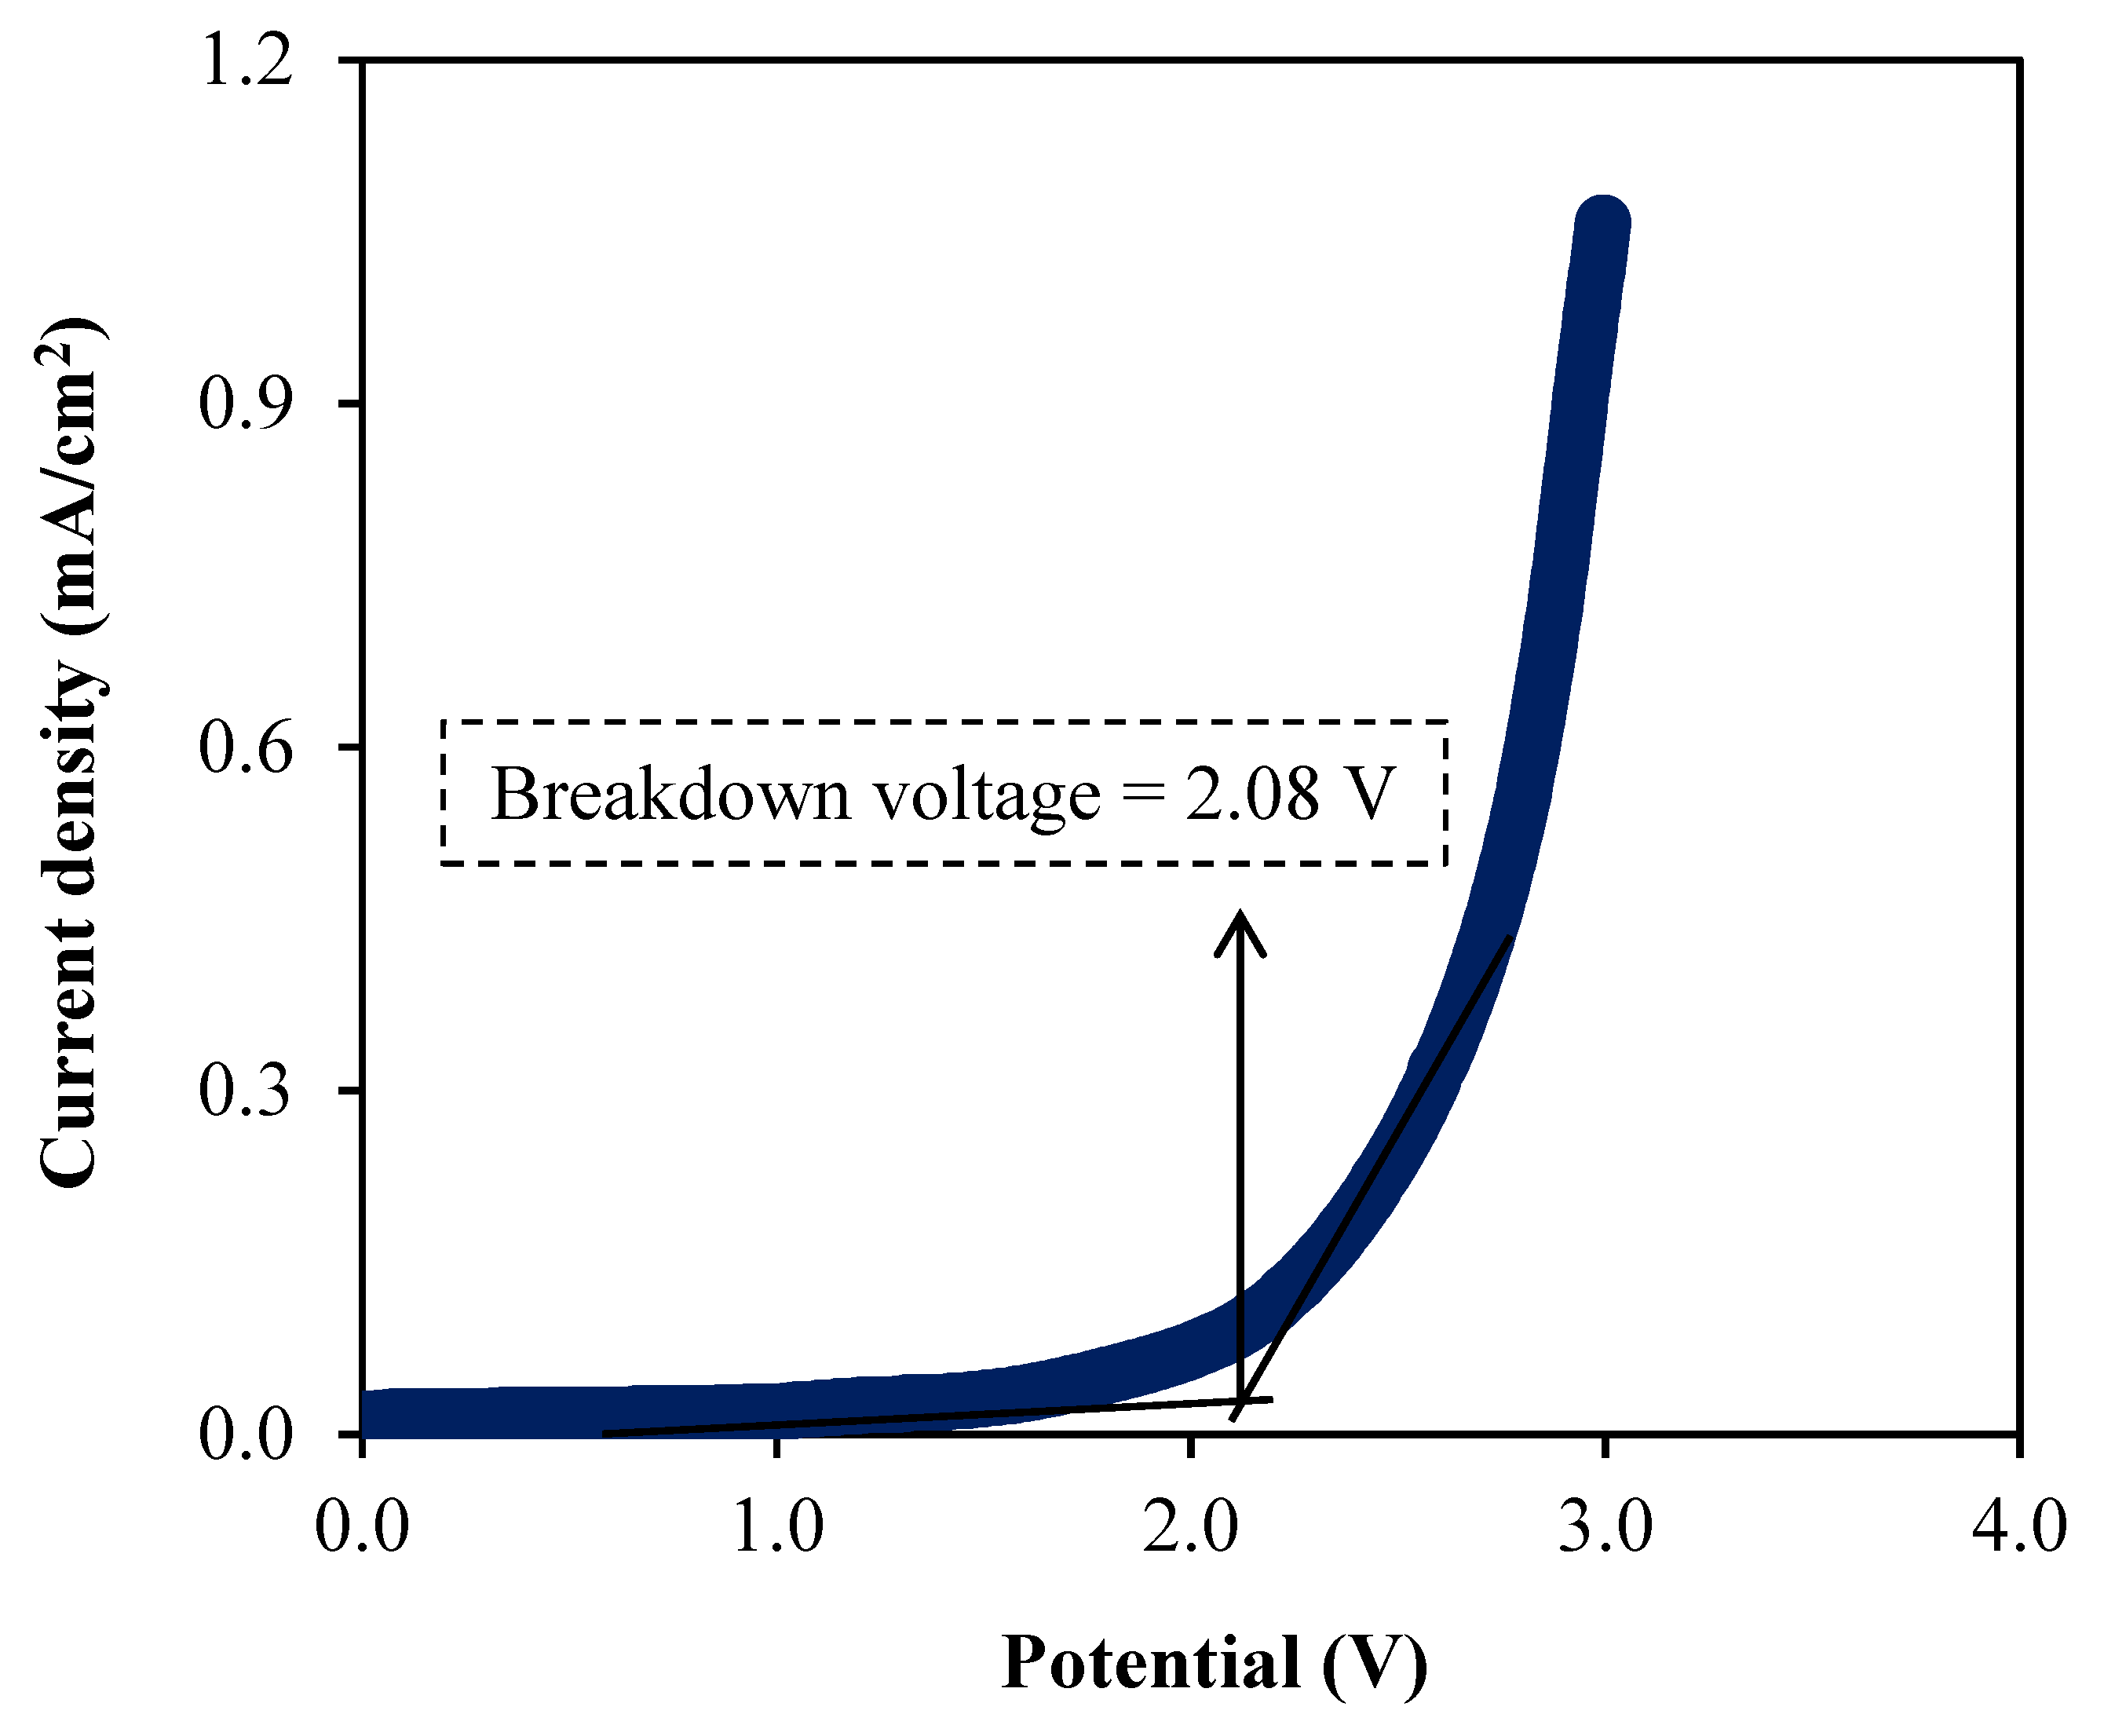
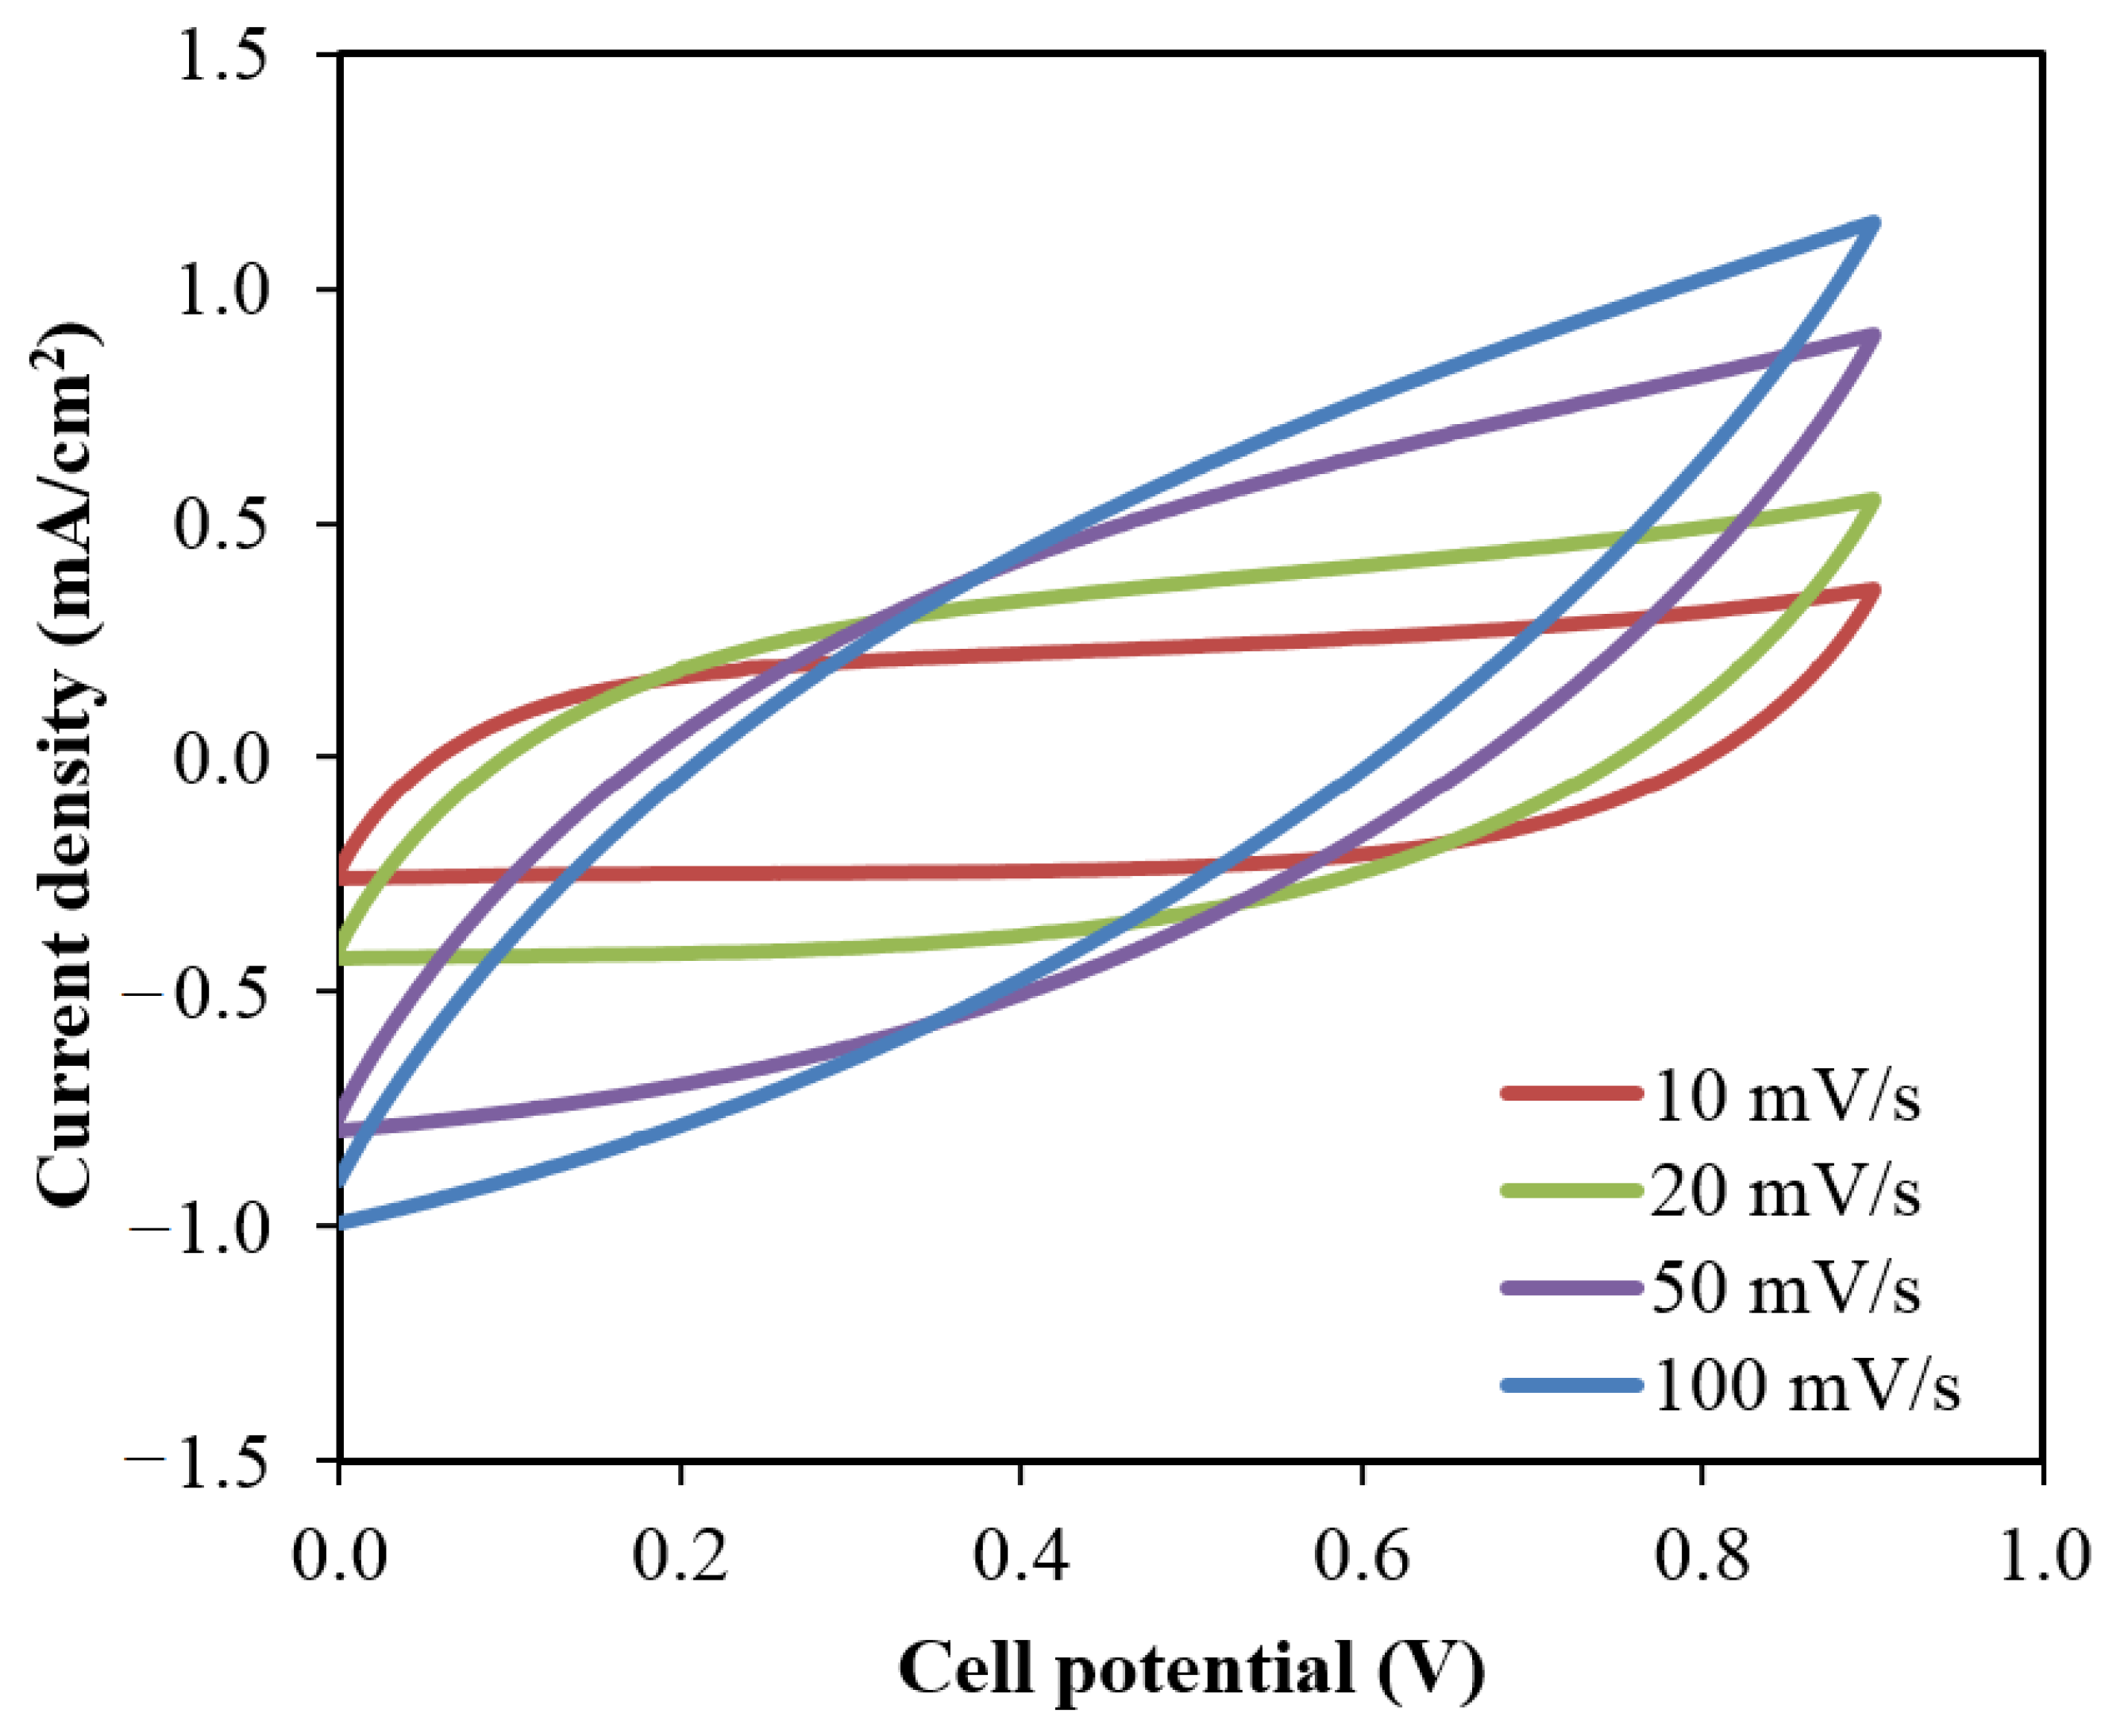
3.5. Linear Sweep Voltammetry (LSV) Study
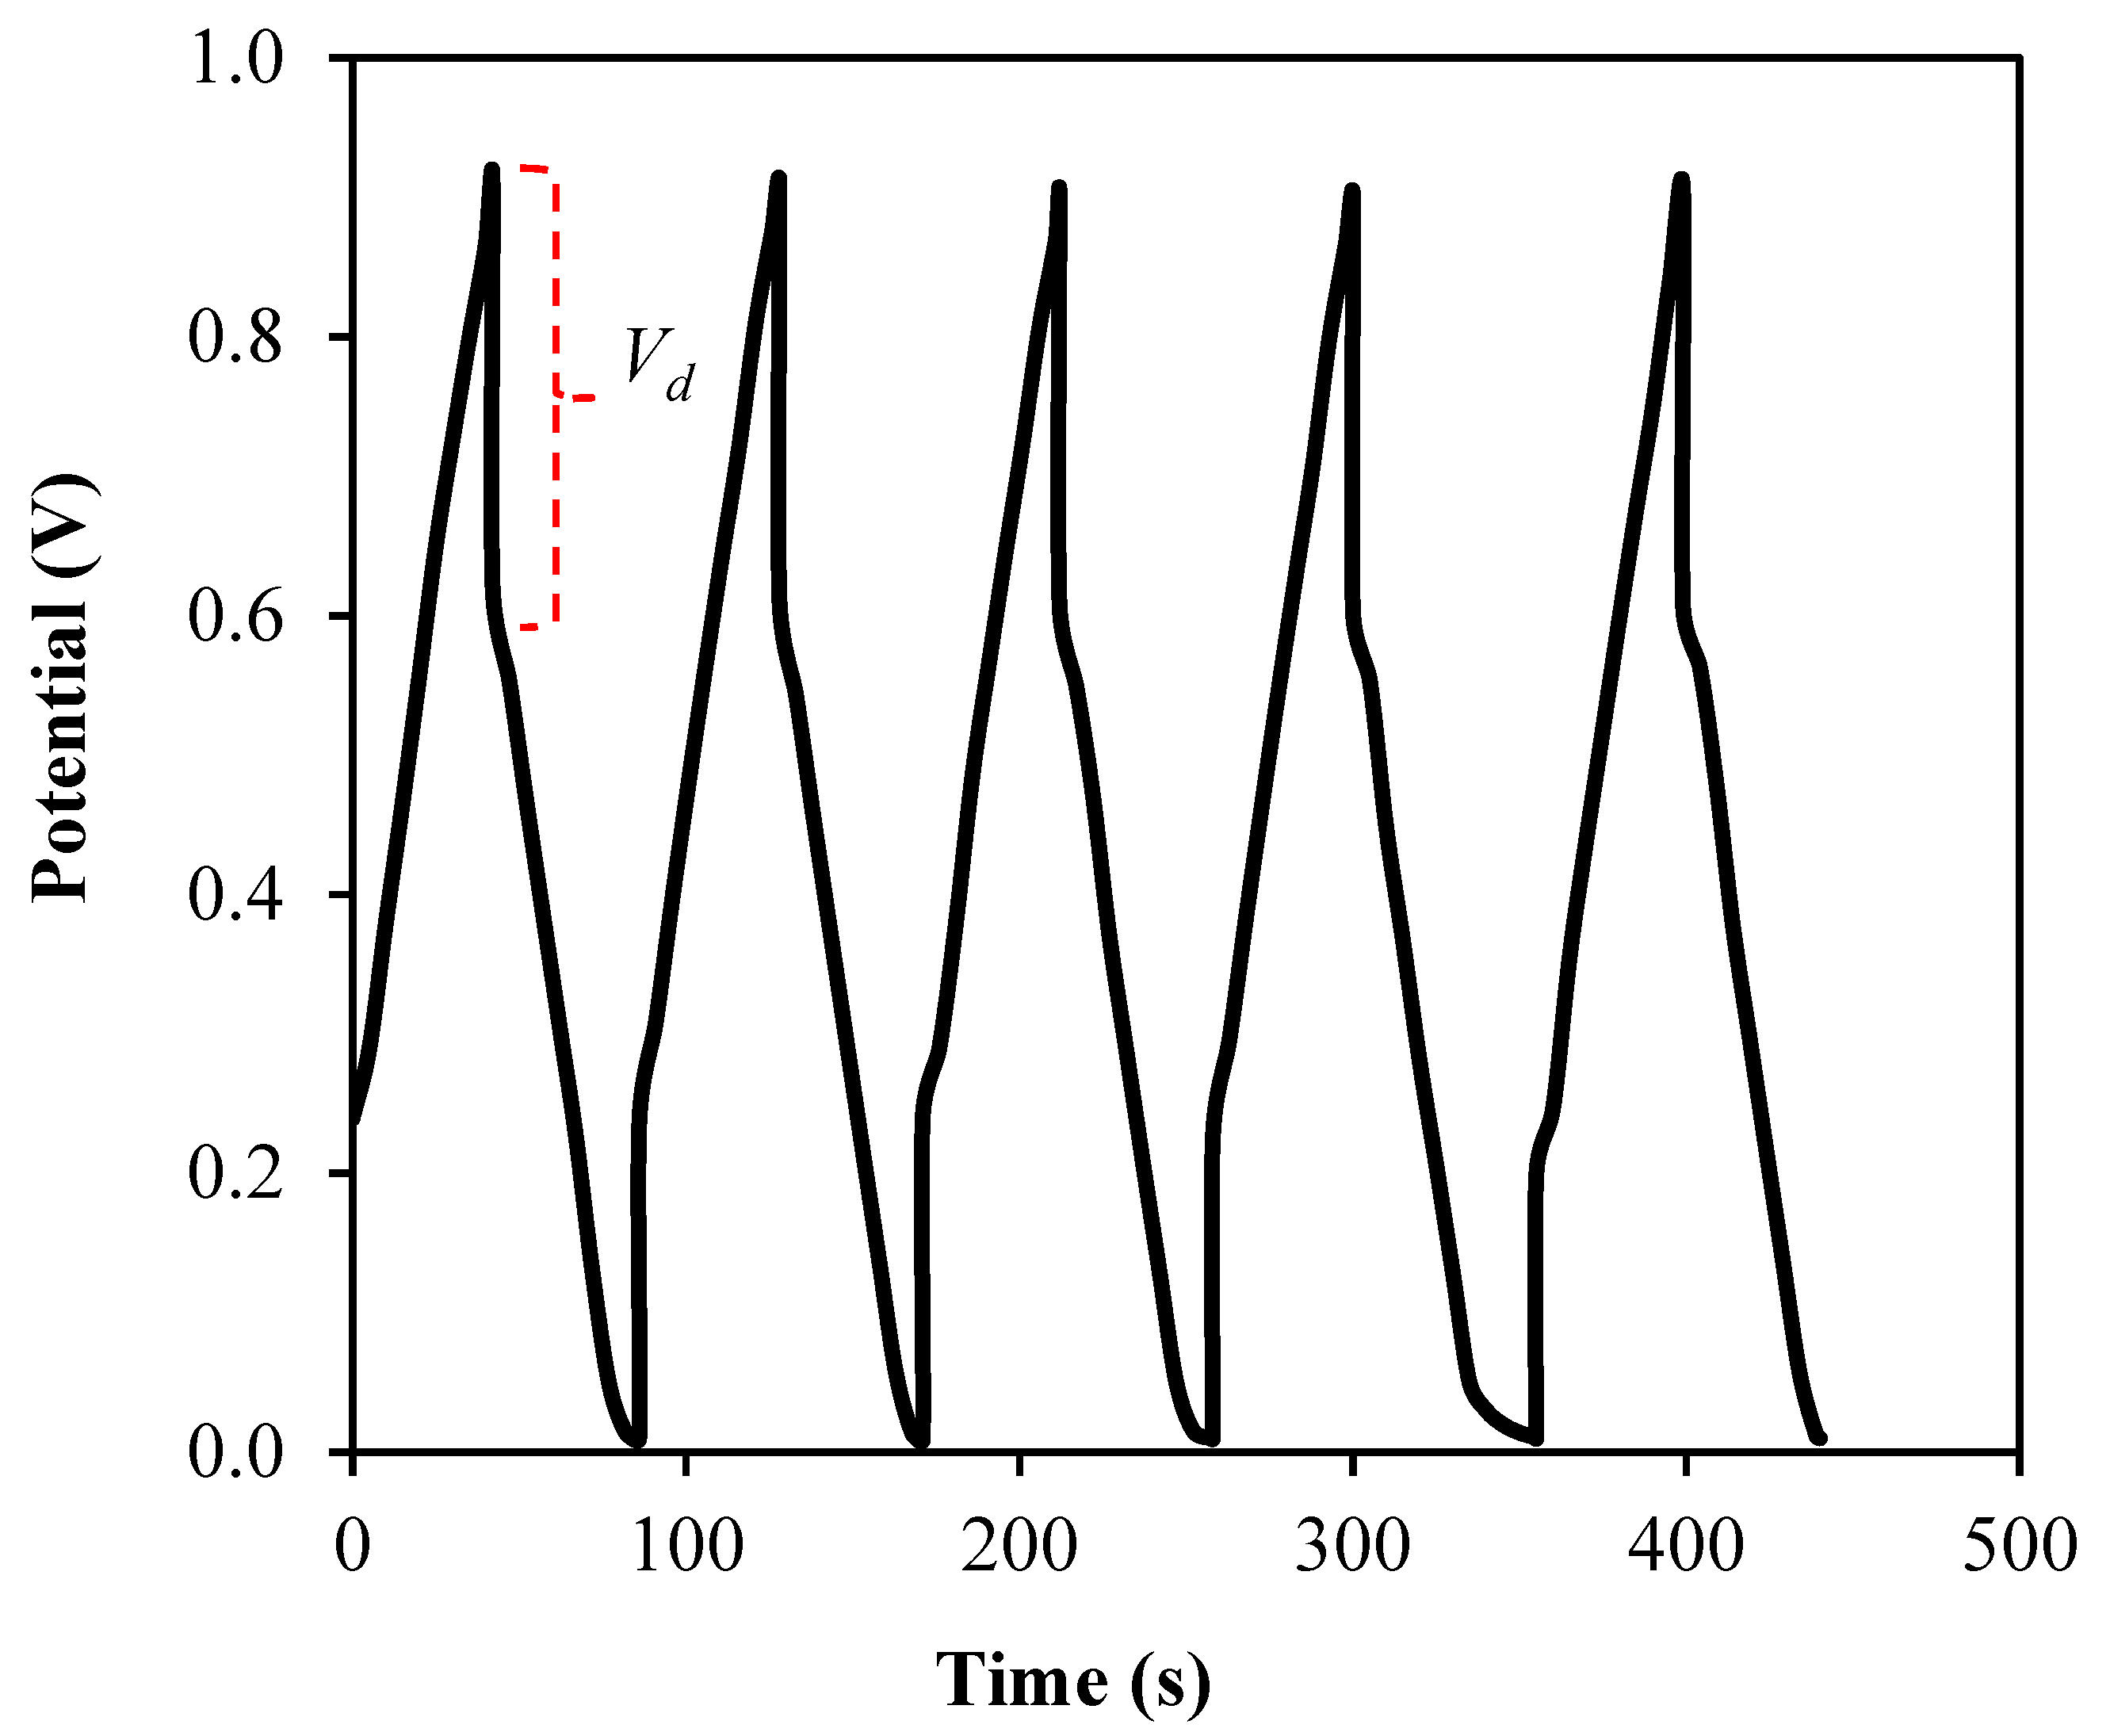
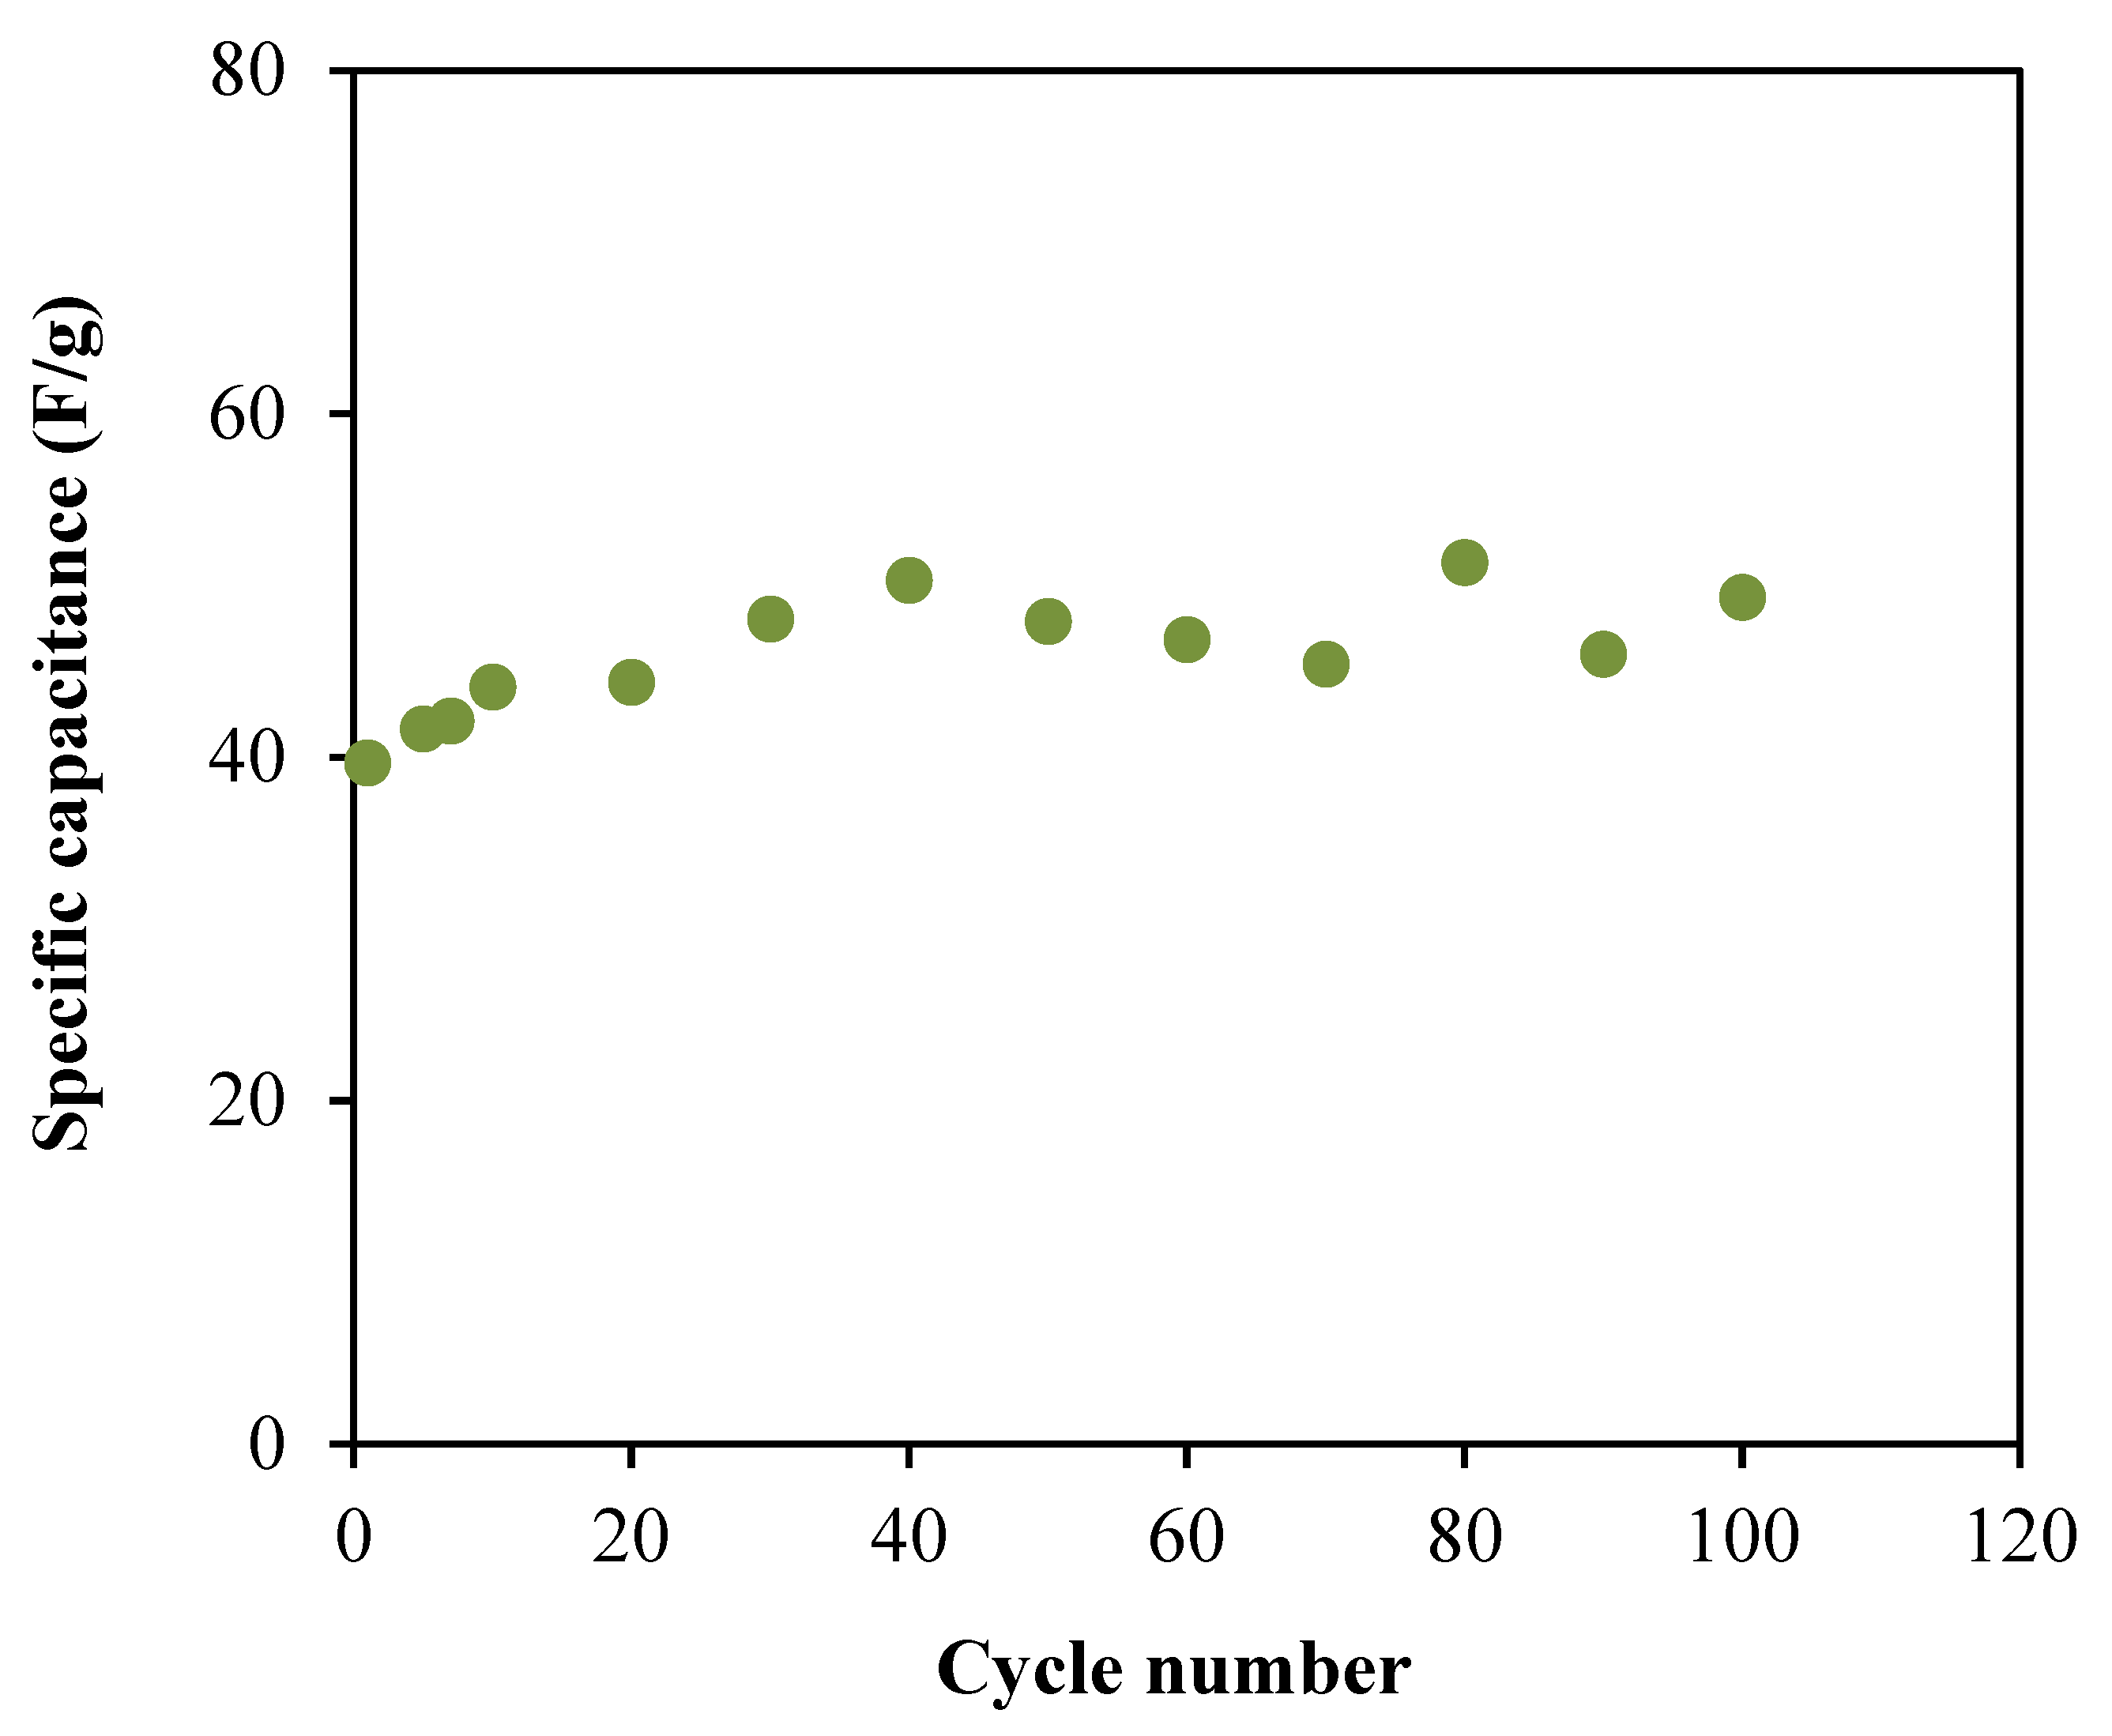
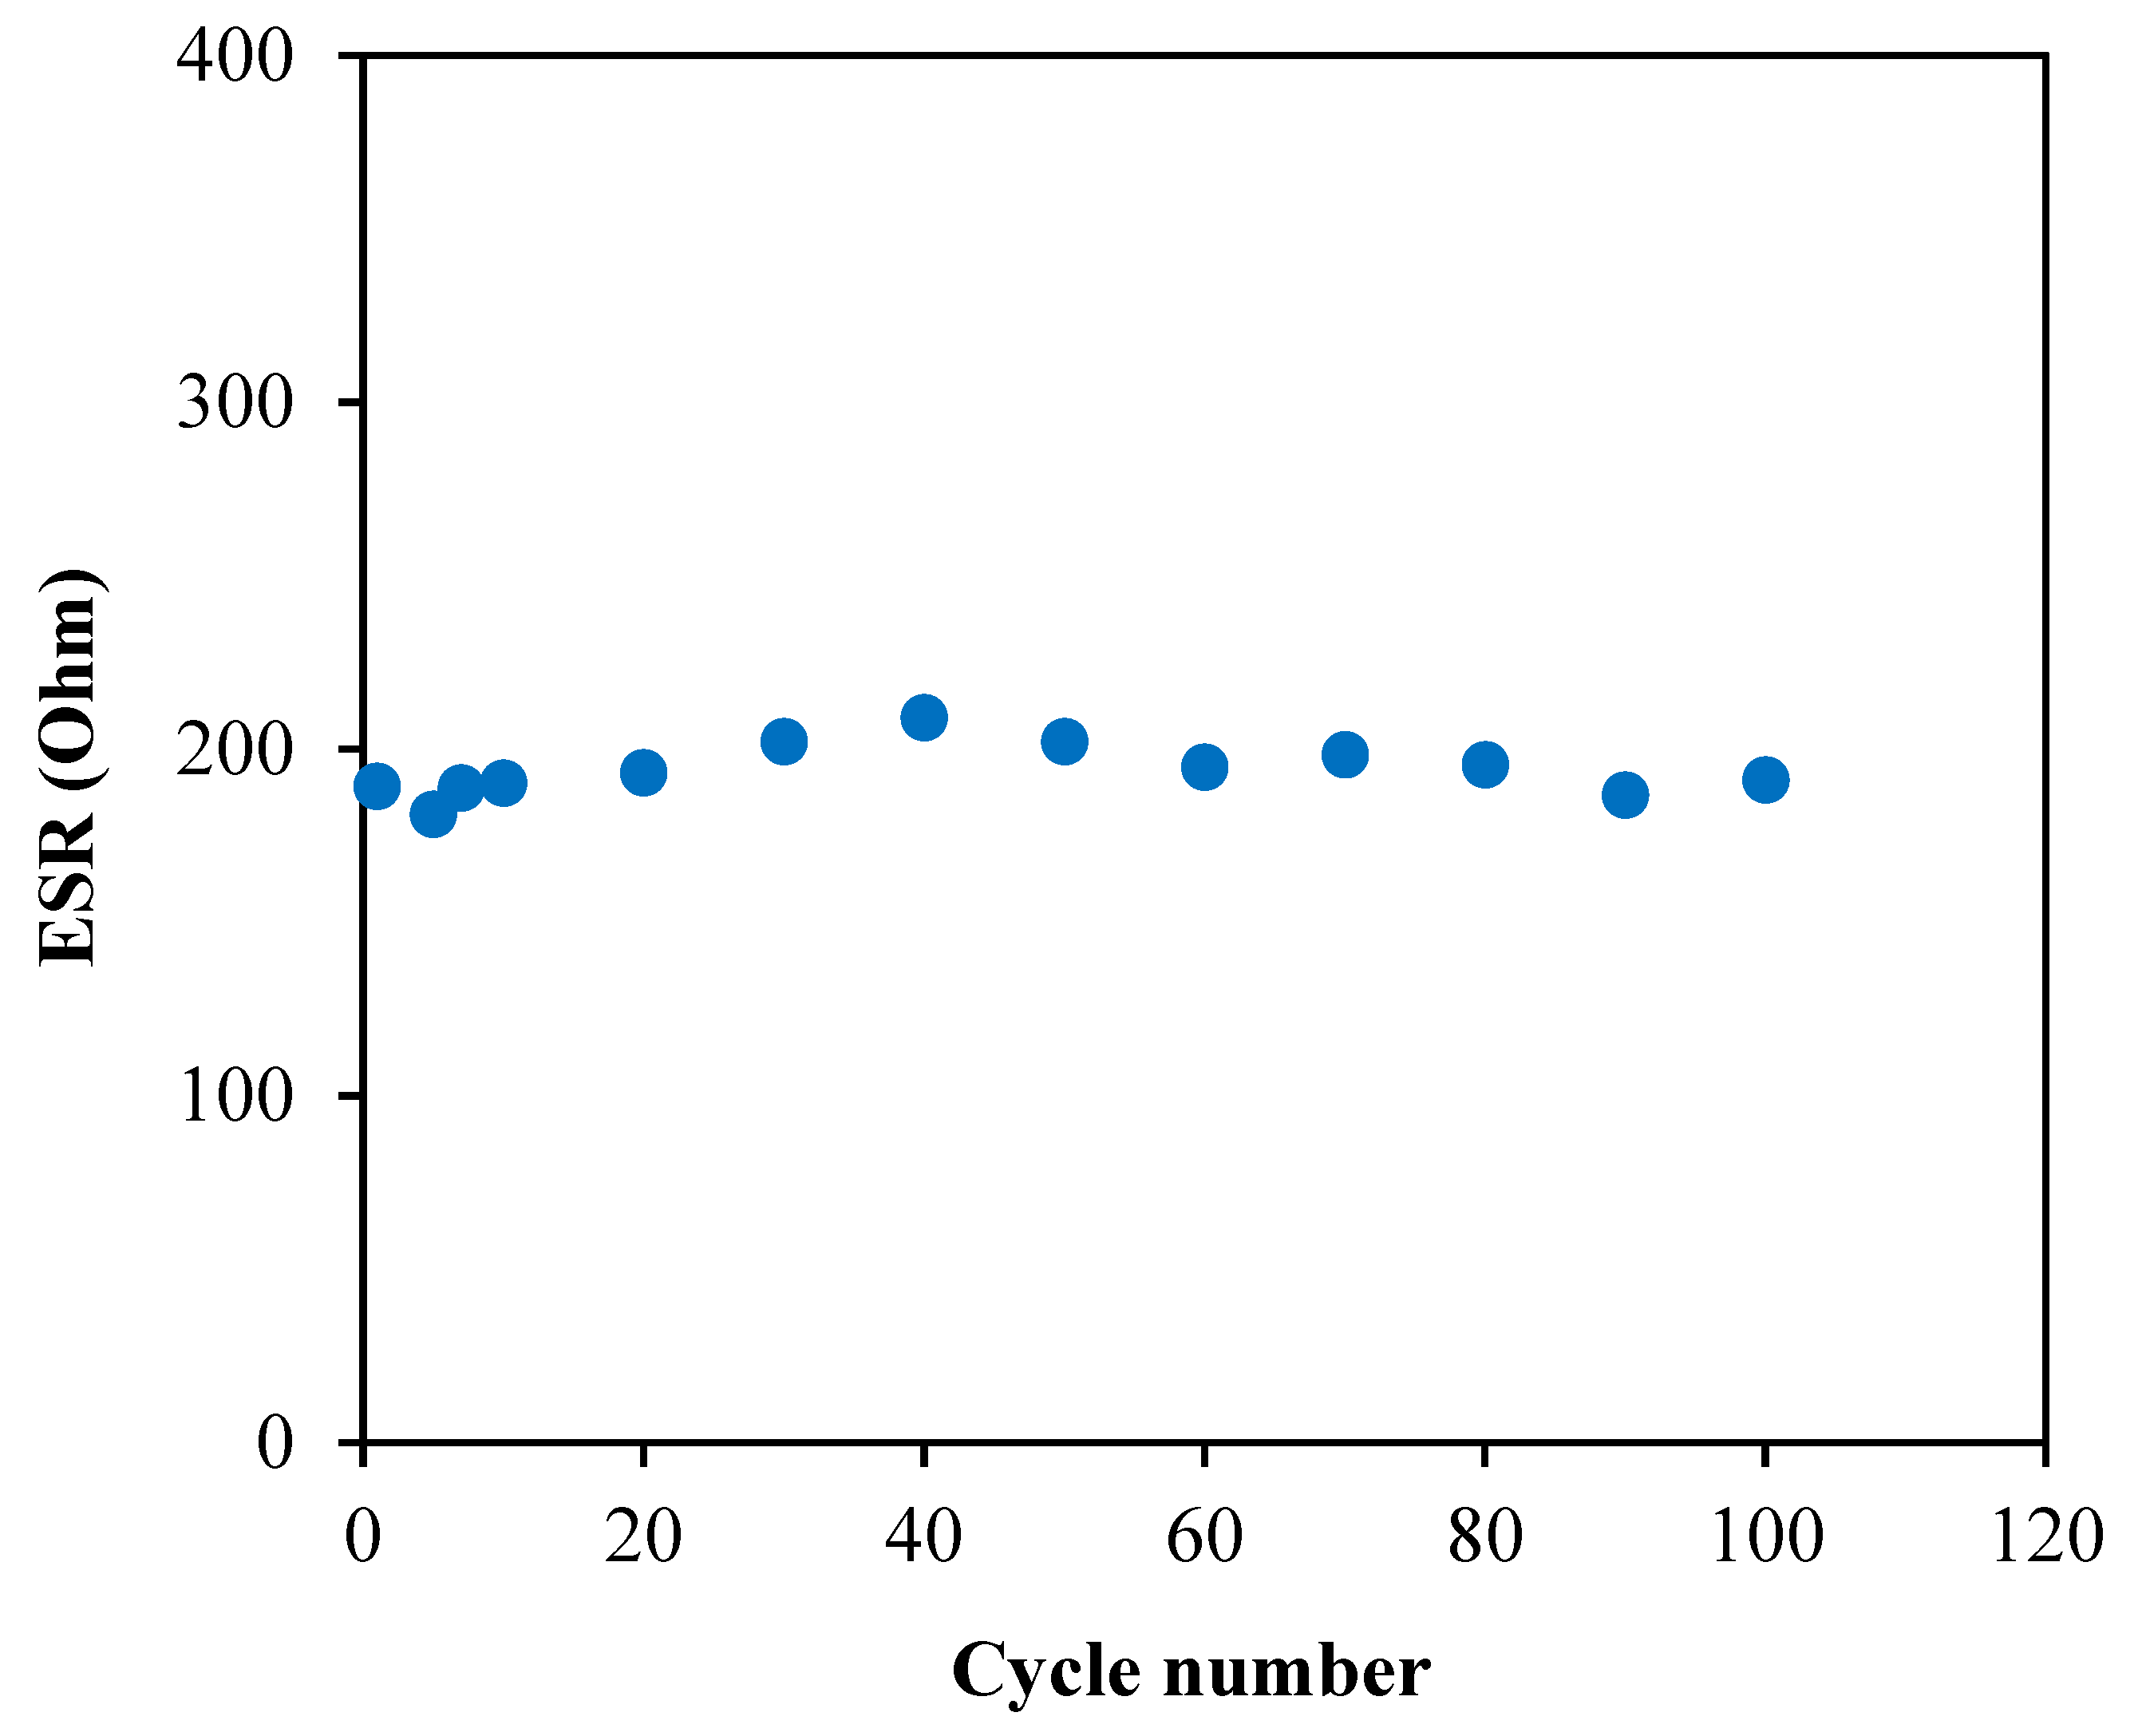
3.6. Characterization of the EDLC
4. Conclusions
Author Contributions
Funding
Acknowledgments
Conflicts of Interest
References
- Bella, F.; Lamberti, A.; Scalia, A.; Bianco, S.; Tresso, E.; Pirri, C.F.; Gerbaldi, C. A flexible and portable powerpack by solid-state supercapacitor and dye-sensitized solar cell integration. J. Power Sources 2017, 359, 311–321. [Google Scholar] [CrossRef]
- Tooming, T.; Thomberg, T.; Kurig, H.; Jänes, A.; Lust, E. High power density supercapacitors based on the carbon dioxide activated d-glucose derived carbon electrodes and 1-ethyl-3-methylimidazolium tetrafluoroborate ionic liquid. J. Power Sources 2015, 280, 667–677. [Google Scholar] [CrossRef]
- Inagaki, M.; Konno, H.; Tanaike, O. Carbon materials for electrochemical capacitors. J. Power Sources 2010, 195, 7880–7903. [Google Scholar] [CrossRef]
- Zhang, D.; Zhang, X.; Chen, Y.; Yu, P.; Wang, C.; Ma, Y. Enhanced capacitance and rate capability of graphene/polypyrrole composite as electrode material for supercapacitors. J. Power Sources 2011, 196, 5990–5996. [Google Scholar] [CrossRef]
- Pell, W.G.; Conway, B.E. Peculiarities and requirements of asymmetric capacitor devices based on combination of capacitor and battery-type electrodes. J. Power Sources 2004, 136, 334–345. [Google Scholar] [CrossRef]
- Wang, H.; Lin, J.; Shen, Z.X. Polyaniline (PANi) based electrode materials for energy storage and conversion. J. Sci. Adv. Mater. Devices 2016, 1, 225–255. [Google Scholar] [CrossRef]
- Vettori, M.H.P.B.; Franchetti, S.M.M.; Contiero, J. Structural characterization of a new dextran with a low degree of branching produced by Leuconostoc mesenteroides FT045B dextransucrase. Carbohydr. Polym. 2012, 88, 1440–1444. [Google Scholar] [CrossRef]
- Siddiqui, N.N.; Aman, A.; Silipo, A.; Qader, S.A.U.; Molinaro, A. Structural analysis and characterization of dextran produced by wild and mutant strains of Leuconostoc mesenteroides. Carbohydr. Polym. 2014, 99, 331–338. [Google Scholar] [CrossRef]
- Aziz, S.B.; Hamsan, M.H.; Kadir, M.F.Z.; Karim, W.O.; Abdullah, R.M. Development of polymer blend electrolyte membranes based on chitosan: Dextran with high ion transport properties for EDLC application. Int. J. Mol. Sci. 2019, 20, 1–26. [Google Scholar] [CrossRef]
- Sarwat, F.; Ahmed, N.; Aman, A.; Qader, S.A.U. Optimization of growth conditions for the isolation of dextran producing Leuconostoc spp. from indigenous food sources. Pak. J. Pharm. Sci. 2013, 26, 793–797. [Google Scholar] [PubMed]
- Aziz, S.B.; Hamsan, M.H.; Kadir, M.F.Z.; Woo, H.J. Design of Polymer Blends Based on Chitosan: POZ with Improved Dielectric Constant for Application in Polymer Electrolytes and Flexible Electronics. Adv. Polym. Technol. 2020, 2020, 1–10. [Google Scholar] [CrossRef]
- Stepniak, I.; Galinski, M.; Nowacki, K.; Wysokowski, M.; Jakubowska, P.; Bazhenov, V.V.; Leisegang, T.; Ehrlich, H.; Jesionowski, T. A novel chitosan/sponge chitin origin material as a membrane for supercapacitors-preparation and characterization. RSC Adv. 2016, 6, 4007–4013. [Google Scholar] [CrossRef]
- Zulkifli, A.M.; Said, N.I.A.M.; Aziz, S.B.; Hisham, S.; Shah, S.; Bakar, A.A.; Abidin, Z.H.Z.; Tajuddin, H.A.; Sulaiman, L.; Brza, M.A.; et al. Electrochemical characteristics of phthaloyl chitosan based gel polymer electrolyte for dye sensitized solar cell application. Int. J. Electrochem. Sci. 2020, 15, 7434–7447. [Google Scholar] [CrossRef]
- Khiar, A.S.A.; Puteh, R.; Arof, A.K. Characterizations of chitosan-ammonium triflate (NH 4CF 3so 3) complexes by FTIR and impedance spectroscopy. Phys. Status Solidi Appl. Mater. Sci. 2006, 203, 534–543. [Google Scholar] [CrossRef]
- Dueramae, I.; Okhawilai, M.; Kasemsiri, P.; Uyama, H.; Kita, R. Properties enhancement of carboxymethyl cellulose with thermo-responsive polymer as solid polymer electrolyte for zinc ion battery. Sci. Rep. 2020, 10, 1–12. [Google Scholar] [CrossRef]
- Moniha, V.; Alagar, M.; Selvasekarapandian, S.; Sundaresan, B.; Boopathi, G. Conductive bio-polymer electrolyte iota-carrageenan with ammonium nitrate for application in electrochemical devices. J. Non. Cryst. Solids 2018, 481, 424–434. [Google Scholar] [CrossRef]
- Parameswaran, V.; Nallamuthu, N.; Devendran, P.; Nagarajan, E.R.; Manikandan, A. Electrical conductivity studies on Ammonium bromide incorporated with Zwitterionic polymer blend electrolyte for battery application. Phys. B Condens. Matter 2017, 515, 89–98. [Google Scholar] [CrossRef]
- Bakar, N.Y.A.; Muhamaruesa, N.H.M.; Aniskari, N.A.B.; Isa, M.I.N.M. Electrical Studies of Carboxy Methycellulose-Chitosan Blend Biopolymer Doped Dodecyltrimethyl Ammonium Bromide Solid Electrolytes. Am. J. Appl. Sci. 2015, 12, 40–46. [Google Scholar] [CrossRef]
- Gong, S.D.; Huang, Y.; Cao, H.J.; Lin, Y.H.; Li, Y.; Tang, S.H.; Wang, M.S.; Li, X. A green and environment-friendly gel polymer electrolyte with higher performances based on the natural matrix of lignin. J. Power Sources 2016, 307, 624–633. [Google Scholar] [CrossRef]
- Yusof, Y.M.; Shukur, M.F.; Illias, H.A.; Kadir, M.F.Z. Conductivity and electrical properties of corn starch-chitosan blend biopolymer electrolyte incorporated with ammonium iodide. Phys. Scr. 2014, 89, 1–10. [Google Scholar] [CrossRef]
- Zainol, N.H.; Osman, Z.; Othman, L.; Md. Isa, K.B. Transport and Morphological Properties of Gel Polymer Electrolytes Containing Mg(CF3SO3)2. Adv. Mater. Res. 2013, 686, 137–144. [Google Scholar] [CrossRef]
- Syahidah, S.N.; Majid, S.R. Ionic liquid-based polymer gel electrolytes for symmetrical solid-state electrical double layer capacitor operated at different operating voltages. Electrochim. Acta 2015, 175, 184–192. [Google Scholar] [CrossRef]
- Liang, S.; Huang, Q.; Liu, L.; Yam, K.I. Microstructure and molecular interaction in glycerol plasticized chitosan/poly(vinyl alcohol) blending films. Macromol. Chem. Phys. 2009, 210, 832–839. [Google Scholar] [CrossRef]
- Shukur, M.F.; Hamsan, M.H.; Kadir, M.F.Z. Investigation of plasticized ionic conductor based on chitosan and ammonium bromide for EDLC application. Mater. Today Proc. 2019, 17, 490–498. [Google Scholar] [CrossRef]
- Asnawi, A.S.F.M.; Aziz, S.B.; Nofal, M.; Abdulwahid, R.T.; Kadir, M.F.Z.; Hamsan, M.H.; Brza, M.A.; Yusof, Y.M.; Abdilwahid, R.T. Glycerolized Li + Ion Conducting Chitosan-Based Polymer Electrolyte for Energy Storage EDLC Device Applications with Relatively High Energy Density. Polymers 2020, 12, 1433. [Google Scholar] [CrossRef]
- Hamsan, H.M.; Aziz, S.; Kadir, M.F.Z.; Brza, M.A.; Karim, W. The study of EDLC device fabricated from plasticized magnesium ion conducting chitosan based polymer electrolyte. Polym. Test. 2020, 106714. [Google Scholar] [CrossRef]
- Yusof, Y.M.; Kadir, M.F.Z. Electrochemical characterizations and the effect of glycerol in biopolymer electrolytes based on methylcellulose-potato starch blend. Mol. Cryst. Liq. Cryst. 2016, 627, 220–233. [Google Scholar] [CrossRef]
- Kadir, M.; Salleh, N.; Hamsan, M.; Aspanut, Z.; Majid, N.; Shukur, M. Biopolymeric electrolyte based on glycerolized methyl cellulose with NH4Br as proton source and potential application in EDLC. Ionics 2018, 24, 1651–1662. [Google Scholar] [CrossRef]
- Brza, M.A.; Aziz, S.B.; Anuar, H.; Al Hazza, M.H.F. From green remediation to polymer hybrid fabrication with improved optical band gaps. Int. J. Mol. Sci. 2019, 20, 3910. [Google Scholar] [CrossRef]
- Asnawi, A.S.F.M.; Aziz, S.B.; Nofal, M.M.; Yusof, Y.M.; Brevik, I. Metal Complex as a Novel Approach to Enhance the Amorphous Phase and Improve the EDLC Performance of Plasticized Proton Conducting Chitosan-Based Polymer Electrolyte. Membranes 2020, 10, 132. [Google Scholar] [CrossRef]
- Kadir, M.; Hamsan, M. Green electrolytes based on dextran-chitosan blend and the effect of NH4SCN as proton provider on the electrical response studies. Ionics 2018, 24, 2379–2398. [Google Scholar] [CrossRef]
- Mazuki, N.F.; Abdul Majeed, A.P.P.; Nagao, Y.; Samsudin, A.S. Studies on ionics conduction properties of modification CMC-PVA based polymer blend electrolytes via impedance approach. Polym. Test. 2020, 81, 106234. [Google Scholar] [CrossRef]
- Gohel, K.; Kanchan, D.K. Ionic conductivity and relaxation studies in PVDF-HFP:PMMA-based gel polymer blend electrolyte with LiClO 4 salt. J. Adv. Dielectr. 2018, 8, 1850005. [Google Scholar] [CrossRef]
- Misenan, M.; Khiar, A. Conductivity, Dielectric And Modulus Studies of Methylcellulose-NH 4 TF Polymer. Eurasian J. Biol. Chem. Sci. J. 2018, 1, 59–62. [Google Scholar]
- Ramya, C.S.; Selvasekarapandian, S.; Savitha, T.; Hirankumar, G.; Baskaran, R.; Bhuvaneswari, M.S.; Angelo, P.C. Conductivity and thermal behavior of proton conducting polymer electrolyte based on poly (N-vinyl pyrrolidone). Eur. Polym. J. 2006, 42, 2672–2677. [Google Scholar] [CrossRef]
- Teo, L.P.; Buraidah, M.H.; Nor, A.F.M.; Majid, S.R. Conductivity and dielectric studies of Li2SnO3. Ionics 2012, 18, 655–665. [Google Scholar] [CrossRef]
- Aziz, S.B.; Marif, R.B.; Brza, M.A.; Hamsan, M.H.; Kadir, M.F.Z. Employing of Trukhan model to estimate ion transport parameters in PVA based solid polymer electrolyte. Polymers 2019, 11, 1694. [Google Scholar] [CrossRef]
- Abarna, S.; Hirankumar, G. Electrical, dielectric and electrochemical studies on new Li ion conducting solid polymer electrolytes based on polyethylene glycol p-tert-octylphenyl ether. Polym. Sci. Ser. A 2017, 59, 660–668. [Google Scholar] [CrossRef]
- Guan, K.H.; Farhana, N.K.; Omar, F.S.; Saidi, N.M.; Bashir, S.; Ramesh, S.; Ramesh, K. Influence of tetraglyme towards magnesium salt dissociation in solid polymer electrolyte for electric double layer capacitor. J. Polym. Res. 2020, 27, 1–9. [Google Scholar] [CrossRef]
- Lee, D.K.; Allcock, H.R. The effects of cations and anions on the ionic conductivity of poly[bis(2-(2-methoxyethoxy)ethoxy)phosphazene] doped with lithium and magnesium salts of trifluoromethanesulfonate and bis(trifluoromethanesulfonyl)imidate. Solid State Ionics 2010, 181, 1721–1726. [Google Scholar] [CrossRef]
- Sengwa, R.J.; Dhatarwal, P. Predominantly chain segmental relaxation dependent ionic conductivity of multiphase semicrystalline PVDF/PEO/LiClO4 solid polymer electrolytes. Electrochim. Acta 2020, 338, 135890. [Google Scholar] [CrossRef]
- Yahya, M.Z.A.; Arof, A.K. Effect of oleic acid plasticizer on chitosan-lithium acetate solid polymer electrolytes. Eur. Polym. J. 2003, 39, 897–902. [Google Scholar] [CrossRef]
- Mohamed, A.S.; Shukur, M.F.; Kadir, M.F.Z.; Yusof, Y.M. Ion conduction in chitosan-starch blend based polymer electrolyte with ammonium thiocyanate as charge provider. J. Polym. Res. 2020, 27. [Google Scholar] [CrossRef]
- Rani, M.S.A.; Ahmad, A.; Mohamed, N.S. A comprehensive investigation on electrical characterization and ionic transport properties of cellulose derivative from kenaf fibre-based biopolymer electrolytes. Polym. Bull. 2018, 75, 5061–5074. [Google Scholar] [CrossRef]
- Asnawi, A.; Azli, A.; Hamsan, M.; Kadir, M.; Yusof, Y. Electrical And Infrared Spectroscopic Analysis Of Solid Polymer Electrolyte Based On Polyethylene Oxide And Graphene Oxide Blend. Malaysian J. Anal. Sci. 2020, 24, 682–697. [Google Scholar]
- Ramly, K.; Isa, M.I.N.; Khiar, A.S.A. Conductivity and dielectric behaviour studies of starch/PEO+ x wt-%NH 4 NO 3 polymer electrolyte. Mater. Res. Innov. 2011, 15, s82–s85. [Google Scholar] [CrossRef]
- Aziz, S.B.; Abdullah, R.M.; Kadir, M.F.Z.; Ahmed, H.M. Non suitability of silver ion conducting polymer electrolytes based on chitosan mediated by barium titanate (BaTiO3) for electrochemical device applications. Electrochim. Acta 2019, 296, 494–507. [Google Scholar] [CrossRef]
- Pawlicka, A.; Tavares, F.C.; Dörr, D.S.; Cholant, C.M.; Ely, F.; Santos, M.J.L.; Avellaneda, C.O. Dielectric behavior and FTIR studies of xanthan gum-based solid polymer electrolytes. Electrochim. Acta 2019, 305, 232–239. [Google Scholar] [CrossRef]
- Aziz, S.B.; Abdullah, R.M. Crystalline and amorphous phase identification from the tanδ relaxation peaks and impedance plots in polymer blend electrolytes based on [CS:AgNt]x:PEO(x-1) (10 ≤ x ≤ 50). Electrochim. Acta 2018, 285, 30–46. [Google Scholar] [CrossRef]
- Idris, N.H.; Senin, H.B.; Arof, A.K. Dielectric spectra of LiTFSI-doped chitosan/PEO blends. Ionics 2007, 13, 213–217. [Google Scholar] [CrossRef]
- Fuzlin, A.F.; Rasali, N.M.J.; Samsudin, A.S. Effect on Ammonium Bromide in dielectric behavior based Alginate Solid Biopolymer electrolytes. IOP Conf. Ser. Mater. Sci. Eng. 2018, 342, 1–8. [Google Scholar] [CrossRef]
- Arof, A.K.; Amirudin, S.; Yusof, S.Z.; Noor, I.M. A method based on impedance spectroscopy to determine transport properties of polymer electrolytes. Phys. Chem. Chem. Phys. 2014, 16, 1856–1867. [Google Scholar] [CrossRef] [PubMed]
- Fadzallah, I.A.; Noor, I.M.; Careem, M.A.; Arof, A.K. Investigation of transport properties of chitosan-based electrolytes utilizing impedance spectroscopy. Ionics 2016, 22, 1635–1645. [Google Scholar] [CrossRef]
- Yusof, Y.M.; Shukur, M.F.; Hamsan, M.H.; Jumbri, K.; Kadir, M.F.Z. Plasticized solid polymer electrolyte based on natural polymer blend incorporated with lithium perchlorate for electrical double-layer capacitor fabrication. Ionics 2019, 25, 5473–5484. [Google Scholar] [CrossRef]
- Pritam; Arya, A.; Sharma, A.L. Dielectric relaxations and transport properties parameter analysis of novel blended solid polymer electrolyte for sodium-ion rechargeable batteries. J. Mater. Sci. 2019, 54, 7131–7155. [Google Scholar] [CrossRef]
- Shukur, M.F.; Ithnin, R.; Kadir, M.F.Z. Ionic conductivity and dielectric properties of potato starch-magnesium acetate biopolymer electrolytes: The effect of glycerol and 1-butyl-3-methylimidazolium chloride. Ionics 2016, 22, 1113–1123. [Google Scholar] [CrossRef]
- Chai, M.N.; Isa, M.I.N. Novel Proton Conducting Solid Bio-polymer Electrolytes Based on Carboxymethyl Cellulose Doped with Oleic Acid and Plasticized with Glycerol. Sci. Rep. 2016, 6, 1–7. [Google Scholar] [CrossRef]
- Rani, M.S.A.; Ahmad, A.; Mohamed, N.S. Influence of nano-sized fumed silica on physicochemical and electrochemical properties of cellulose derivatives-ionic liquid biopolymer electrolytes. Ionics 2018, 24, 807–814. [Google Scholar] [CrossRef]
- Shukur, M.F.; Ithnin, R.; Kadir, M.F.Z. Protonic Transport Analysis of Starch-Chitosan Blend Based Electrolytes and Application in Electrochemical Device. Mol. Cryst. Liq. Cryst. 2014, 603, 52–65. [Google Scholar] [CrossRef]
- Rama Mohan, K.; Achari, V.B.S.; Rao, V.V.R.N.; Sharma, A.K. Electrical and optical properties of (PEMA/PVC) polymer blend electrolyte doped with NaClO4. Polym. Test. 2011, 30, 881–886. [Google Scholar] [CrossRef]
- Francis, K.A.; Liew, C.W.; Ramesh, S.; Ramesh, K.; Ramesh, S. Ionic liquid enhanced magnesium-based polymer electrolytes for electrical double-layer capacitors. Ionics 2016, 22, 919–925. [Google Scholar] [CrossRef]
- Sampathkumar, L.; Christopher Selvin, P.; Selvasekarapandian, S.; Perumal, P.; Chitra, R.; Muthukrishnan, M. Synthesis and characterization of biopolymer electrolyte based on tamarind seed polysaccharide, lithium perchlorate and ethylene carbonate for electrochemical applications. Ionics 2019, 25, 1067–1082. [Google Scholar] [CrossRef]
- Aziz, S.B.; Hadi, J.M.; Elham, E.M.; Abdulwahid, R.T.; Saeed, S.R.; Marf, A.S.; Karim, W.O.; Kadir, M.F.Z. The study of plasticized amorphous biopolymer blend electrolytes based on polyvinyl alcohol (PVA): Chitosan with high ion conductivity for energy storage electrical double-layer capacitors (EDLC) device application. Polymers 2020, 12, 1938. [Google Scholar] [CrossRef] [PubMed]
- Shuhaimi, N.E.A.; Alias, N.A.; Majid, S.R.; Arof, A.K. Electrical Double Layer Capacitor With Proton Conducting Κ-Carrageenan–Chitosan Electrolytes. Funct. Mater. Lett. 2009, 1, 195–201. [Google Scholar] [CrossRef]
- Lee, J.S.M.; Briggs, M.E.; Hu, C.C.; Cooper, A.I. Controlling electric double-layer capacitance and pseudocapacitance in heteroatom-doped carbons derived from hypercrosslinked microporous polymers. Nano Energy 2018, 46, 277–289. [Google Scholar] [CrossRef]
- Bandaranayake, C.M.; Weerasinghe, W.A.D.S.S.; Vidanapathirana, K.P.; Perera, K.S. A Cyclic Voltammetry study of a gel polymer electrolyte based redox-capacitor. Sri Lankan J. Phys. 2016, 16, 19–27. [Google Scholar] [CrossRef]
- Kadir, M.F.Z.; Arof, A.K. Application of PVA-chitosan blend polymer electrolyte membrane in electrical double layer capacitor. Mater. Res. Innov. 2013, 15, S217–S220. [Google Scholar] [CrossRef]
- Fattah, N.F.A.; Ng, H.M.; Mahipal, Y.K.; Numan, A.; Ramesh, S.; Ramesh, K. An approach to solid-state electrical double layer capacitors fabricated with graphene oxide-doped, ionic liquid-based solid copolymer electrolytes. Materials 2016, 9, 450. [Google Scholar] [CrossRef]
- Muchakayala, R.; Song, S.; Wang, J.; Fan, Y.; Bengeppagari, M.; Chen, J.; Tan, M. Development and supercapacitor application of ionic liquid-incorporated gel polymer electrolyte films. J. Ind. Eng. Chem. 2018, 59, 79–89. [Google Scholar] [CrossRef]
- Aziz, S.B.; Hamsan, M.H.; Abdullah, R.M.; Kadir, M.F.Z. A promising polymer blend electrolytes based on chitosan: Methyl cellulose for EDLC application with high specific capacitance and energy density. Molecules 2019, 24, 2503. [Google Scholar] [CrossRef]
- Yusof, Y.M.; Majid, N.A.; Kasmani, R.M.; Illias, H.A.; Kadir, M.F.Z. The Effect of Plasticization on Conductivity and Other Properties of Starch/Chitosan Blend Biopolymer Electrolyte Incorporated with Ammonium Iodide. Mol. Cryst. Liq. Cryst. 2014, 603, 73–88. [Google Scholar] [CrossRef]
- Kwon, Y.H.; Kumar, S.; Bae, J.; Seo, Y. CVD-graphene for low equivalent series resistance in rGO/CVD-graphene/Ni-based supercapacitors. Nanotechnology 2018, 29. [Google Scholar] [CrossRef] [PubMed]
- Shukur, M.F.; Ithnin, R.; Kadir, M.F.Z. Electrical characterization of corn starch-LiOAc electrolytes and application in electrochemical double layer capacitor. Electrochim. Acta 2014, 136, 204–216. [Google Scholar] [CrossRef]
- Mazuki, N.; Abdul Majeed, A.P.P.; Samsudin, A.S. Study on electrochemical properties of CMC-PVA doped NH4Br based solid polymer electrolytes system as application for EDLC. J. Polym. Res. 2020, 27, 1–13. [Google Scholar] [CrossRef]
- Aziz, S.B.; Hamsan, M.H.; Brza, M.A.; Kadir, M.F.Z.; Muzakir, S.K.; Abdulwahid, R.T. Effect of glycerol on EDLC characteristics of chitosan:methylcellulose polymer blend electrolytes. J. Mater. Res. Technol. 2020, 9, 8355–8366. [Google Scholar] [CrossRef]
- Lim, C.S.; Teoh, K.H.; Liew, C.W.; Ramesh, S. Capacitive behavior studies on electrical double layer capacitor using poly (vinyl alcohol)-lithium perchlorate based polymer electrolyte incorporated with TiO2. Mater. Chem. Phys. 2014, 143, 661–667. [Google Scholar] [CrossRef]


| Glycerol (wt.%) | Designation |
|---|---|
| 12 | A1 |
| 28 | A2 |
| 42 | A3 |
| Electrolyte | CPE1 (F) | CPE2 (F) | |
|---|---|---|---|
| A1 | 3.00 × 10⁵ | 5.00 × 10⁻¹⁰ | 5.88 × 10⁻⁷ |
| A2 | 5.80 × 10³ | 2.50 × 10⁻⁹ | 5.56 × 10⁻⁶ |
| A3 | 2.00 × 10³ | 3.33 × 10⁻⁹ | 6.06 × 10⁻⁶ |
| Electrolyte | (S cm−1) |
|---|---|
| A1 | 5.14 × 10⁻⁸ |
| A2 | 2.66 × 10⁻⁶ |
| A3 | 7.71 × 10⁻⁶ |
| Electrolyte | p2 | k2 (F−1) | ||
|---|---|---|---|---|
| A1 | 0.38 | 1.70 × 10⁶ | 4.76 | 2.65 × 10⁻⁴ |
| A2 | 0.49 | 1.80 × 10⁵ | 10.64 | 5.89 × 10⁻⁶ |
| A3 | 0.60 | 1.65 × 10⁵ | 12.72 | 4.86 × 10⁻⁶ |
| Electrolyte | n (cm−3) | μ (cm2V−1s−1) | D (cm2s−1) |
|---|---|---|---|
| A1 | 5.20 × 10¹⁹ | 6.17 × 10⁻⁹ | 1.58 × 10⁻¹⁰ |
| A2 | 2.32 × 10²¹ | 7.14 × 10⁻⁹ | 1.83 × 10⁻¹⁰ |
| A3 | 5.50 × 10²¹ | 8.75 × 10⁻⁹ | 2.25 × 10⁻¹⁰ |
| Scan Rate (mV/s) | Specific Capacitance (F/g) |
|---|---|
| 100 | 4.18 |
| 50 | 8.46 |
| 20 | 17.15 |
| 10 | 24.46 |
Publisher’s Note: MDPI stays neutral with regard to jurisdictional claims in published maps and institutional affiliations. |
© 2020 by the authors. Licensee MDPI, Basel, Switzerland. This article is an open access article distributed under the terms and conditions of the Creative Commons Attribution (CC BY) license (http://creativecommons.org/licenses/by/4.0/).
Share and Cite
Asnawi, A.S.F.M.; Aziz, S.B.; Saeed, S.R.; Yusof, Y.M.; Abdulwahid, R.T.; Al-Zangana, S.; Karim, W.O.; Kadir, M.F.Z. Solid-State EDLC Device Based on Magnesium Ion-Conducting Biopolymer Composite Membrane Electrolytes: Impedance, Circuit Modeling, Dielectric Properties and Electrochemical Characteristics. Membranes 2020, 10, 389. https://doi.org/10.3390/membranes10120389
Asnawi ASFM, Aziz SB, Saeed SR, Yusof YM, Abdulwahid RT, Al-Zangana S, Karim WO, Kadir MFZ. Solid-State EDLC Device Based on Magnesium Ion-Conducting Biopolymer Composite Membrane Electrolytes: Impedance, Circuit Modeling, Dielectric Properties and Electrochemical Characteristics. Membranes. 2020; 10(12):389. https://doi.org/10.3390/membranes10120389
Chicago/Turabian StyleAsnawi, Ahmad S. F. M., Shujahadeen B. Aziz, Salah R. Saeed, Yuhanees M. Yusof, Rebar T. Abdulwahid, Shakhawan Al-Zangana, Wrya O. Karim, and Mohd. F. Z. Kadir. 2020. "Solid-State EDLC Device Based on Magnesium Ion-Conducting Biopolymer Composite Membrane Electrolytes: Impedance, Circuit Modeling, Dielectric Properties and Electrochemical Characteristics" Membranes 10, no. 12: 389. https://doi.org/10.3390/membranes10120389
APA StyleAsnawi, A. S. F. M., Aziz, S. B., Saeed, S. R., Yusof, Y. M., Abdulwahid, R. T., Al-Zangana, S., Karim, W. O., & Kadir, M. F. Z. (2020). Solid-State EDLC Device Based on Magnesium Ion-Conducting Biopolymer Composite Membrane Electrolytes: Impedance, Circuit Modeling, Dielectric Properties and Electrochemical Characteristics. Membranes, 10(12), 389. https://doi.org/10.3390/membranes10120389