Article

Hydrological and Hydrodynamic Modeling for Flash Flood and Embankment Dam Break Scenario: Hazard Mapping of Extreme Storm Events

1
Department of Surveying Engineering, Faculty of Engineering, Al al-Bayt University, Mafraq 25113, Jordan
2
Department of Geographic Information Systems and Remote Sensing, Faculty of Earth and Environmental Sciences, Al al-Bayt University, Mafraq 25113, Jordan
3
Department of Civil Engineering, Faculty of Engineering, Al al-Bayt University, Mafraq 25113, Jordan
4
Secretary General of Arab Union for Astronomy & Space Sciences, Amman 11953, Jordan
5
Department of Applied Physics and Astronomy, College of Sciences, University of Sharjah, Sharjah 27272, United Arab Emirates
*
Author to whom correspondence should be addressed.
Sustainability 2023, 15(3), 1758; https://doi.org/10.3390/su15031758
Submission received: 7 December 2022 / Revised: 12 January 2023 / Accepted: 13 January 2023 / Published: 17 January 2023

Abstract

:
Simulation of dam breach scenarios can help in the preparation of emergency action plans for real dam breaks or flash flooding events. The purpose of this study was to identify flood-prone areas in the Al Wala Valley in the governorate of Madaba in Jordan through analysis of the Al Wala Dam. Modelling of dam breaches was conducted under two scenarios: a Clear Day scenario and a Probable Maximum Flood (PMF) scenario. The former scenario does not address the various dam failure modes; rather, it addresses the formation and development of a breach as a result of structural failures like the sliding of dam blocks in the case of a concrete dam or piping failures in the case of embankment dams. The PMF scenarios, however, simulate unsteady flow in pipes and overtopping failure via consideration of runoff hydrography. In the PMF scenario, flood-prone areas can be identified by in-depth analysis of data from previous extreme rainfall events. The related hydrologic and hydraulic data can then be modelled using intensity-duration-frequency curves applied to an hour-by-hour simulation to discover the areas most at risk of flooding in the future. In the present study, data were collected from inlet of flow to Al Wala Valley on 10 January 2013. The collected data, which included rainfall and discharge data, were fed to the HEC-HMS software in order to calibrate the hydrological parameters of the watershed of the Al Wala Dam. Additionally, the HEC-RAS tool was employed to determine the breach outflow hydrography and hydraulic conditions across various critical downstream locations, which were determined by use of dynamic flood wave-routing models. The simulations revealed that, in the case of the Clear Day scenario, downstream inundation would cover an area of 5.262 km2 in the event of a pipe failure. However, in the event of a six-hour storm, a twelve-hour storm, and a twenty-four-hour storm, the flooded area would rise to 6.837 km2, 8.518 km2, and 9.390 km2, respectively. In the event of an overtopping failure, 13.171 km2 would be inundated, according to the Clear Day scenario. On the other hand, in the event of a six-hour storm, a twelve-hour storm, and a twenty four-hour storm, the flooded area would rise to 13.302 km2, 14.249 km2, and 14.594 km2, respectively.

1. Introduction

Though new challenges emerge to threaten our everyday life, such as climate change and threats to sustainable development [1,2], dams remain a mainstay of architectural innovation. The benefits of such structures are not merely economic [3,4], as they have been long used for irrigation, flood control, hydropower generation, and provision of water for various human uses [5]. However, despite their usefulness [6], dams are highly contentious around the world in regards to considerations of health and safety of the downstream communities. As many dams around the world withhold large quantities of water, floods caused by their failures have historically resulted in catastrophic life losses [7,8], not to mention property, infrastructure, and ecological damages resulting from flood events [9,10]. Whilst normal precipitation run-off floods can be foreseen and warnings given, the extent of sudden dam breach floods is impossible to predict or prepare for following routine procedures. Indeed, the damage such floods are capable of inflicting points to glaring oversights in our current forecasting and response systems. Considering that flooding impacts about 70 million people around the globe each year, with a further 800 million individuals living in areas susceptible to flooding risk, a better-developed Emergency Response Plan (ERP) is urgently needed to prevent damages and loss of life. With 1.47 billion individuals, representing 19% of the world population, directly exposed to substantial threats during flood events of one-hundred-year return period [11], the question becomes: what can we do to protect them?
In order to minimize these risks, we must first understand their causes. Climate-induced failures are a growing problem in a warming world [12]. As is customary in most dam studies, flood hydrography is employed to determine the main features of the body of the dam, including its height, width, slope, and ancillary structures in the case of earthen dams [13]. However, recent hydrographical dam flood analysis has shown a rise in the curve associated with the changing climate [14], with subsequent effects on the structural integrity of dams [15]. In some scenarios, flood water cannot be contained by the spillway of a dam, and therefore it discharges systematically over the dam crest to form a breach on the dike. Over time, depending on dam dike resistance [12], such a breach can develop into partial or total failure of the structural integrity of the dam. This kind of dam failure is anticipated to become more common because heatwaves and heavy precipitation events are increasing in frequency and severity throughout the world in general, and in Jordan, in particular, as evidenced by historical data obtained from the Ministry of Water and Irrigation (MWI), Jordan, and the Jordanian Meteorological Department (JMD). Accordingly, it is necessary for researchers to consider these changes, at both the local and national scales [16], when assessing the flood risks of dams [13,17]. A study [18] that was conducted in 2008 predicted site-scale climate scenarios in various locations in Jordan for the period of 2011–2099. Using a statistical downscaling model from coarse GCM products to refine the forecasting results, the study concluded that extreme events such as droughts, flash floods, intense rain storms, and snowstorms will become more frequent in Jordan in the future. Influenced by precipitation yields, local peak intensities, and spatiotemporal scales [19], the convective components of a heavy precipitation event may deliver large quantities of rain in specific areas and timeframes and lead to widespread pluvial and urban flash flooding [20,21]. In this context, the flash floods have been responsible for some of the most catastrophic meteorological events that have occurred in Mediterranean areas [22], triggering landslides, debris flows, erosion, and various other geomorphic responses [23,24].
For effective response to the threat of flash floods, efficient operation of surface water systems for flood control must be ensured and sustained. This operation may be supported by the use of recent hydrological and hydrodynamic simulation models, whereby research can develop qualitative insight into the risks posed by flooding. These models employ varying parameters that include watershed properties and rainfall patterns and quantities to develop hydrographical depictions of discharge rates at discrete time steps [25] in terms of four major factors: peak, volume, duration, and shape [26]. Due to their high capabilities for performing comprehensive hydrological analysis, the hydrographical models have been employed in a broad range of applications, including flood forecasting [27], streamflow prediction [28], and quantification of climate change factors [29], in addition to studies of other spatially distributed properties such as land use effects on surface and ground water quantity and quality and watershed function [30].
The hydrographical models were originally developed as lumped models by which water flow rates within catchments were estimated without division or specification [31]. However, they soon came into conflict with more advanced distribution models, which produced more accurate factoring of spatial variabilities of hydrological processes in watershed analysis [32]. Recent versions of the hydrography model have, hence, resorted to Digital Elevation Models (DEMs) to support their spatial structures [33]. Models such as SHE and TOPMODEL have been adapted to process new types of data, such as those used in [34]. Meanwhile, various other innovations have allowed researchers to utilize remotely sensed and GIS data in analysis as well [35]. Examples of these innovations are the European Hydrological System Model (MIKE-SHE) [36], the Hydrological Engineering Center Hydrological Modeling System [37], the Soil and Water Assessment Tool (SWAT) [38], the Topography-based Hydrological Model (TOPMODEL) [39], and the Hydrological Simulation Program-Fortran (HSPF) [40]. Amidst the variety of hydrological models for runoff prediction, however, one model stands out: HEC-HMS. It is the most popular and accurate system for spatiotemporal catchment response predictions, both in short- and long-term evaluations. Its capability to facilitate analysis of various soil and climate conditions has proven invaluable to researchers across the globe [41]. It is a practical and streamlined system that uses a lower number of input parameters and input data than comparable systems and can be applied on catchments to predict flooding on an unprecedented scale. However, this streamlining is endowed with modelling limitations, especially in simulation of flow velocity and depth for large-scale watershed flooding events [42]. In order to compensate for these shortcomings, hydrodynamic models may be resorted to as alternative means of flood hydrography, depth, and velocity assessment. These models calculate open channel flow using the solutions to Saint-Venant’s equations, which treat the channel systems as either one- or two-dimensional systems. Amongst the most popular hydrodynamic models are the Lisflood-FP (one-dimensional (1D) and two-dimensional (2D) models), the Water Quality Analysis Simulation Program (WASP), CE-QUALW2, the Environmental Fluid Dynamics Code (EFDC), EPDRIV1, Hydrologic Engineering Center-River Analysis System (HEC-RAS), MIKE11 (1D model), MIKE21 (2D model), and SOBEK [43]. While these models are equally competent, by coupling hydrodynamic models with any of the aforementioned hydrologic models, researchers could generate highly accurate floodplain simulations by combining the fluxes at every time step (Hoch et al., 2019). Combination efforts have resulted in a dramatic increase in efficiency over decades of developing computation power, and they have been successfully applied in a number of studies around the world in recent years [44]. As different models are employed in floodplain mapping by flow simulation, it seems that those models should be combined to integrate the physical drivers of each simulated inundation condition [44].
While there exists a large number of published studies on extreme rainfall and flood events worldwide that identified risk factors by using hydrodynamic models, few studies exist that linked flood risks around dams to local, climate change-induced, heavy rainfall events. It is hoped that this paper expands the existing knowledge on this topic through the evaluation of dam-break floodwater hydrography and the study of downstream flow routing of the Al Wala Dam through 2D dam-breach inundation simulations and downstream vulnerability assessments conducted under three extreme rainfall storm events. This study was conducted to uncover the potential impact of peak inflows and subsequent flood inundation in the hypothetical scenario of a dam break using the HEC-HMS and HEC-RAS, with special attention paid to inundation depths, potential areas of disruption, and potential impacts on downstream communities in this event. The watershed of the Al Wala Dam was physically represented using a HEC-HMS, semi-distributed basin model [45] with an assortment of hydrologic elements combined in a dendritic network to accurately simulate runoff processes. Curve number (CN) methods were employed to generate inflow hydrographs for a number of return periods. A mapping extension of HEC-RAS that includes a comprehensive list of procedures, tools, and utilities was used to document the results appropriately [46]. A 2D model was deemed to be the option best capable of accurately informing a detailed animation of local flood wave progression in multiple directions. This choice, subsequently, informed the use of 2D HEC-RAS, whose GIS interface solves unsteady flow equations based on the dimensions of the stream and its floodplain via the finite method [47].
In this research, we simulate the dam breach hydrodynamics and identify flood-prone areas downstream of the Al Wala dam. The simulation is done using two scenarios: the first is the dam breach on a clear day where only the dam storage flows down and simulates the movement of water and the flood plain mapping. The other scenario simulates the dam breach on a rainy day, where the dam storage combined with extreme rainfall event flooding is simulated, and the flood prone areas downstream the dam are mapped. In the scenario of the rainy day, three extreme events are used: 100-year return period 6-h storm, 100-year return period 12-h storm, and 100-year return period 24-h storm.

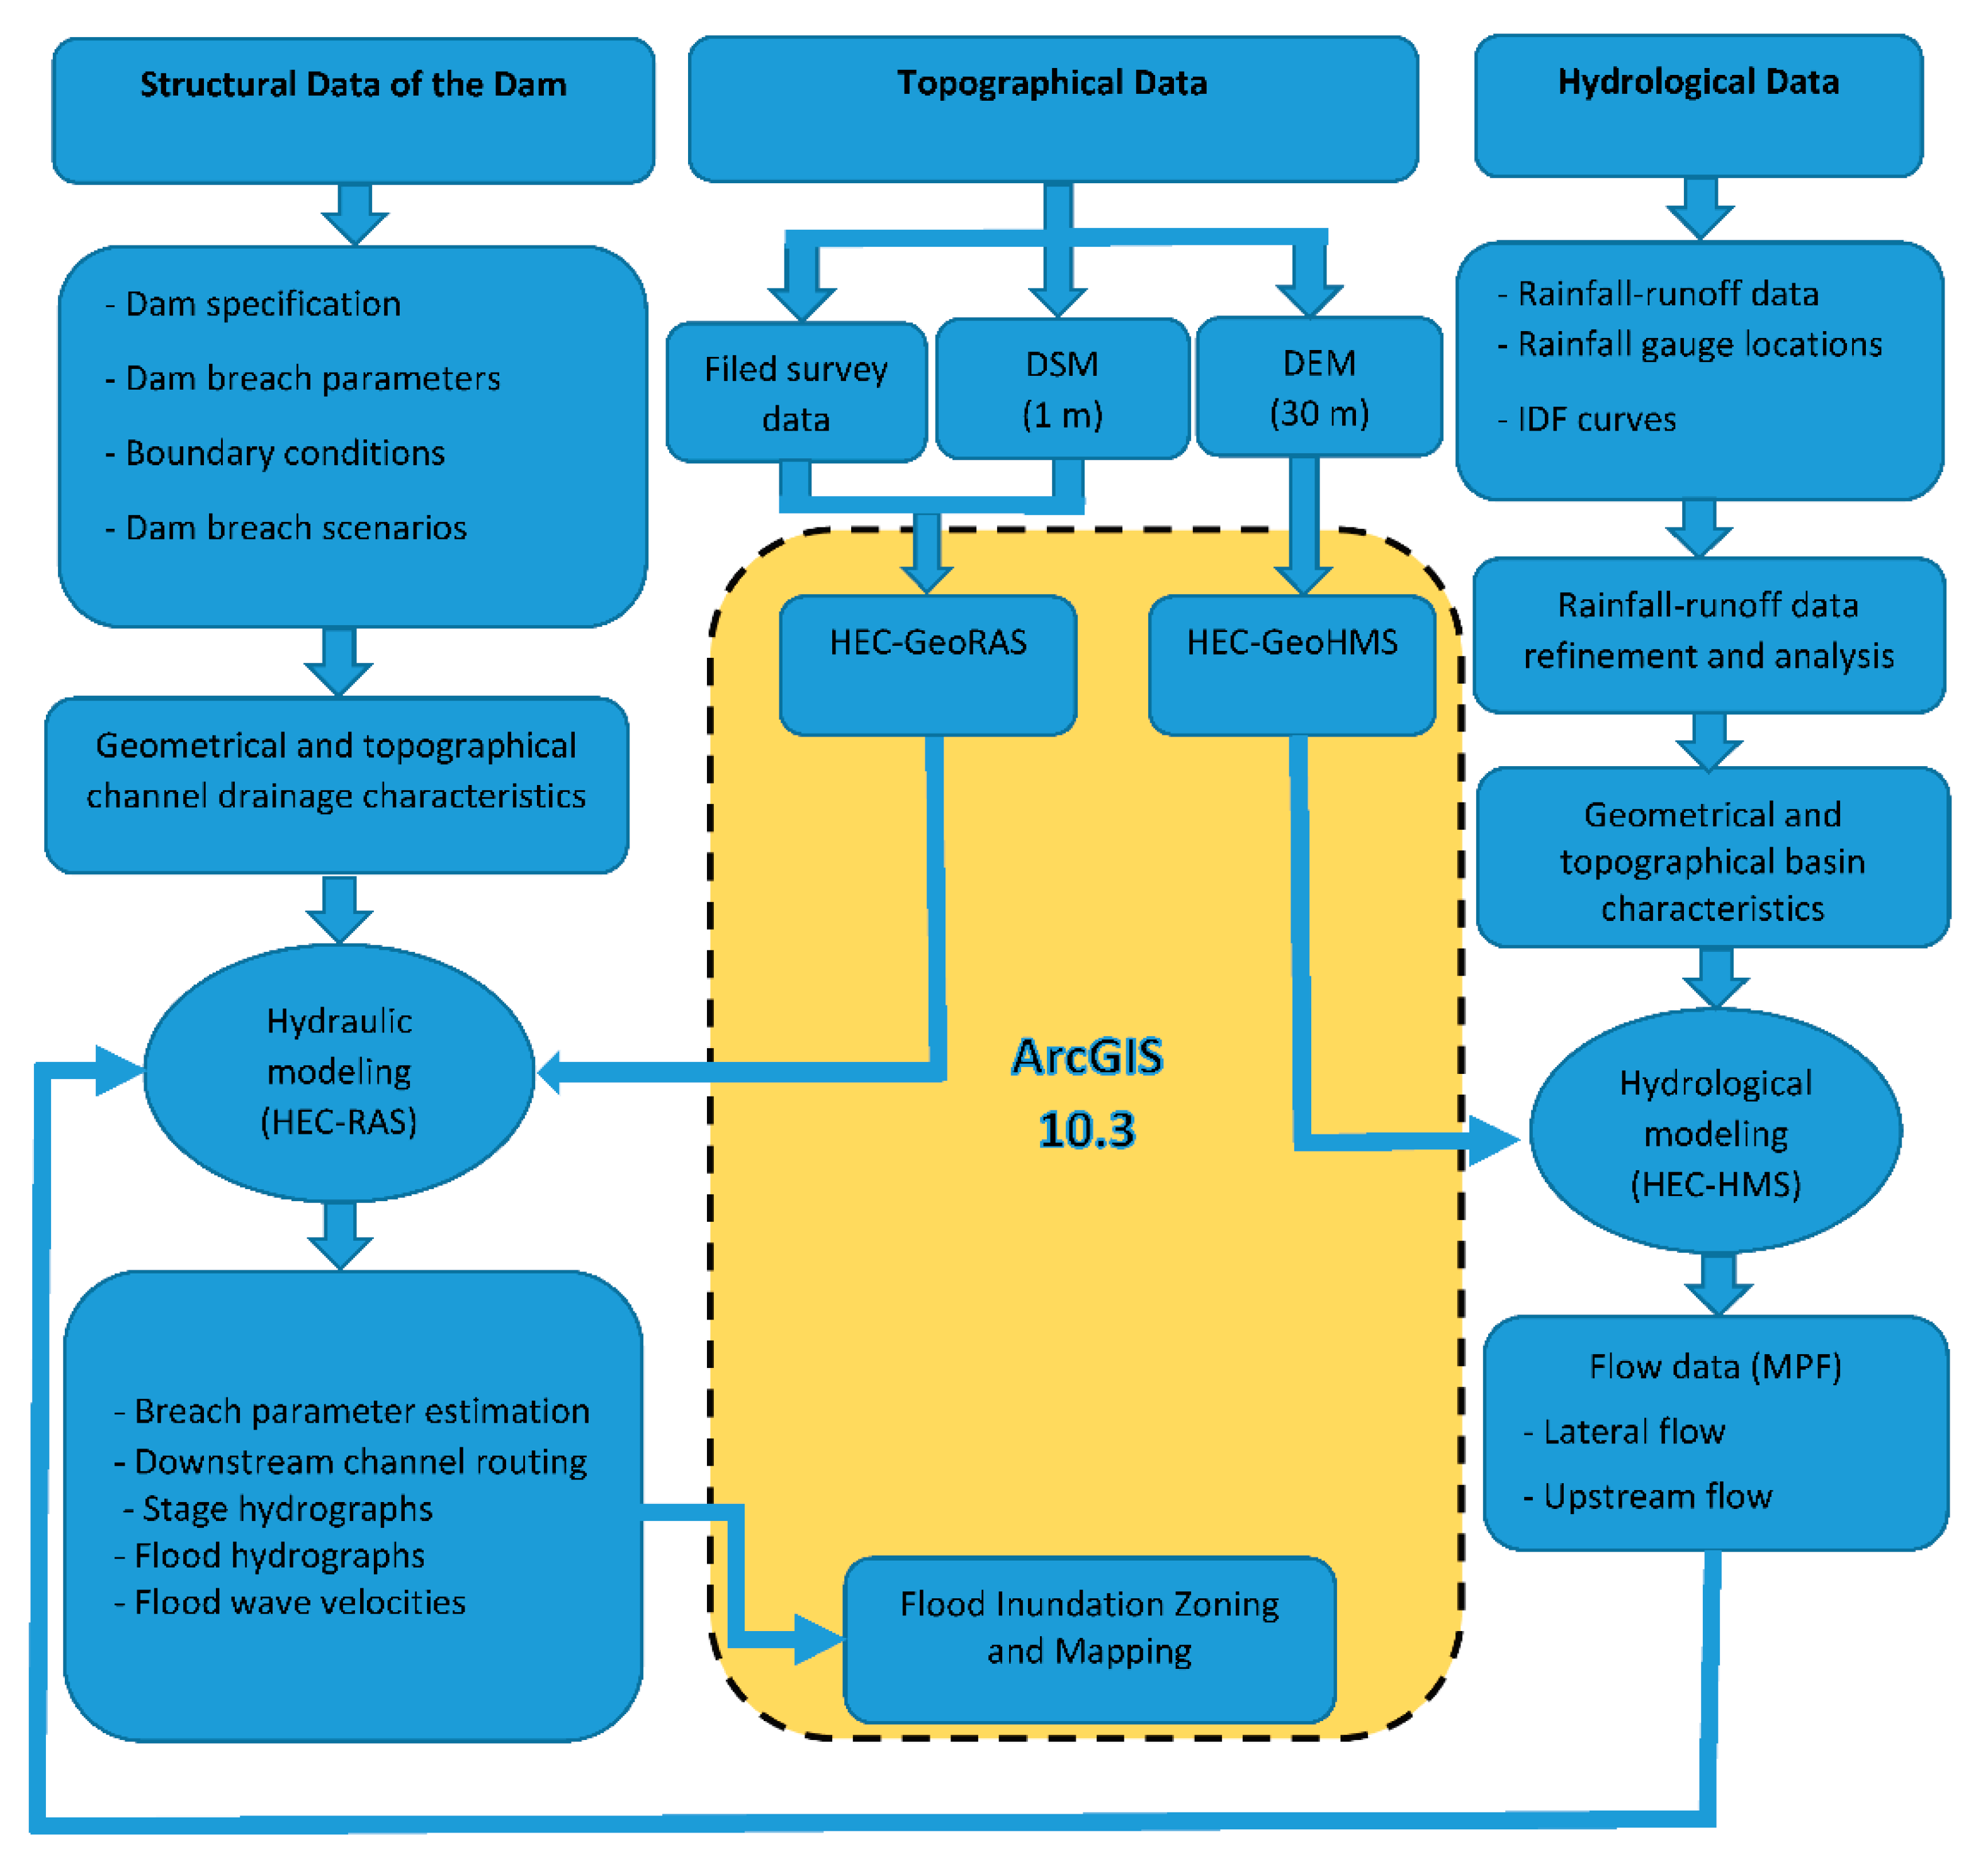
2. Materials and Methods
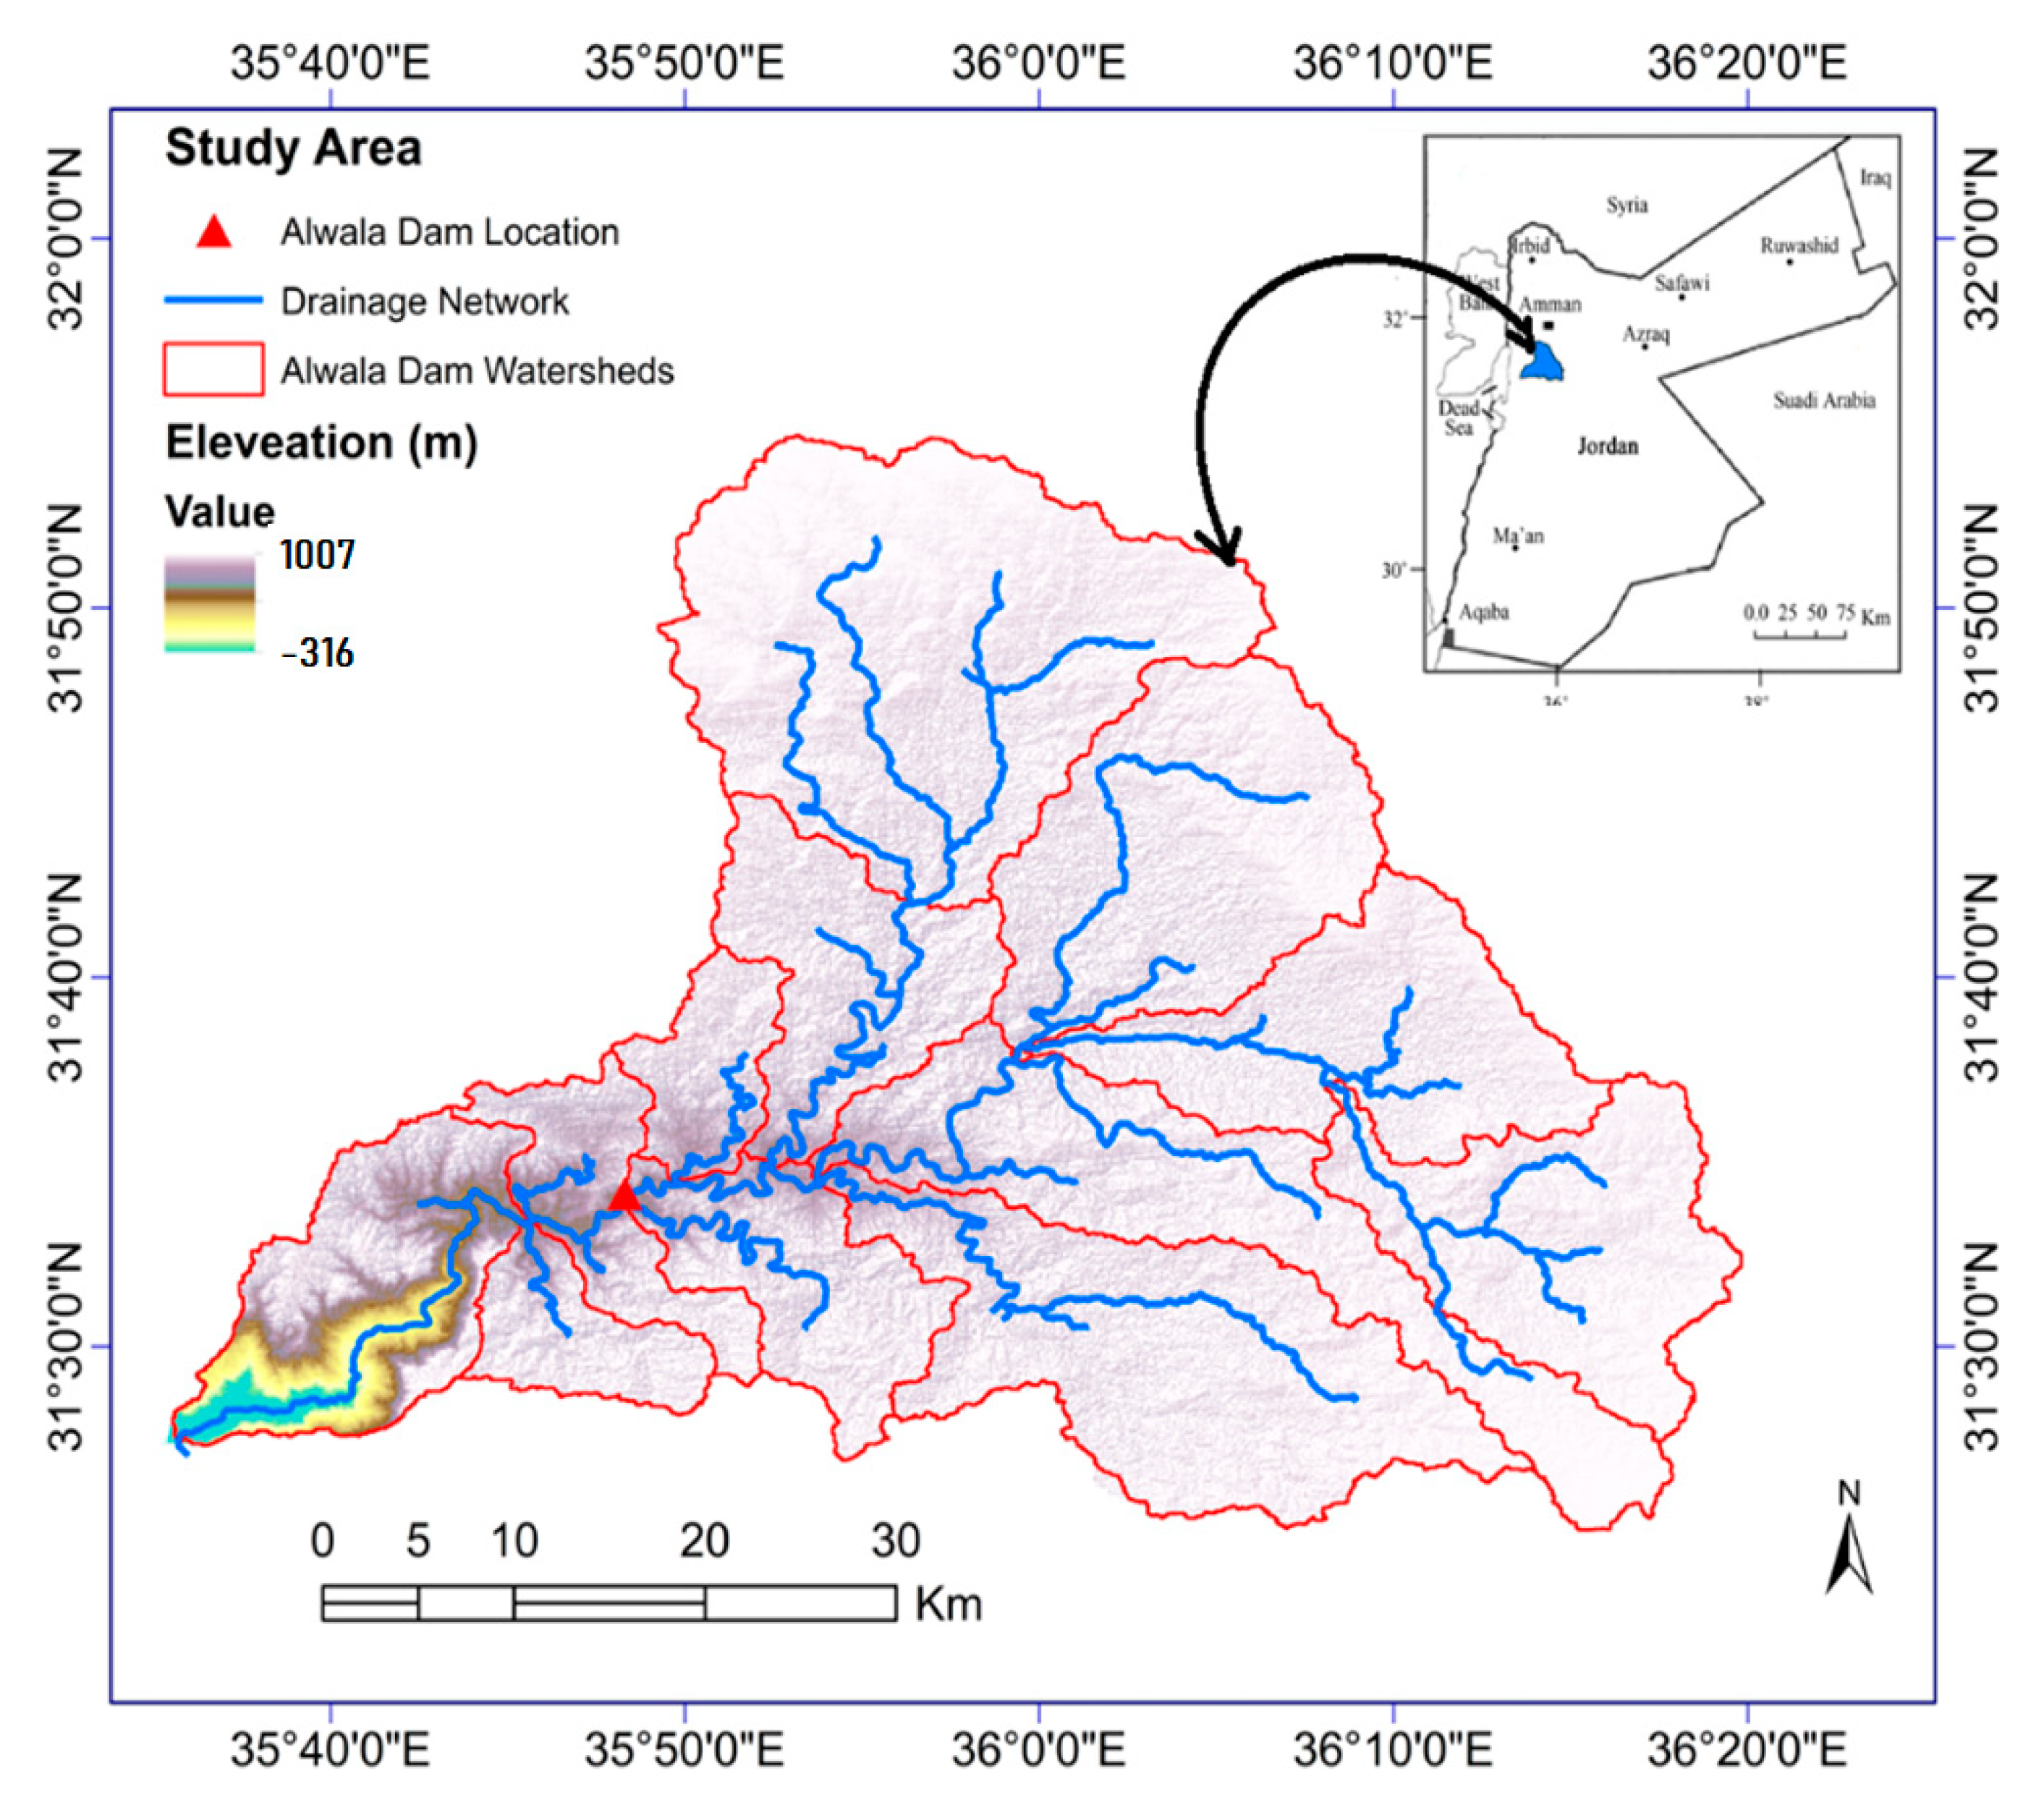
2.1. Study Area

The Al Wala basin lies in the middle of Jordan (Figure 1). It stretches over an area of 1900 km2 and is characterized by a topographically level plain in the east and steep slopes in the west. Altitudes vary across this area and range from 316 m below mean sea level in the areas adjacent to the eastern shoreline of the Dead Sea to 1007 m above mean sea level (amsl) in the eastern plains. With such a large degree of topographical relief, the western basin, which lies downstream of the Al Wala Dam, is exposed to a high risk of flash floods, with high soil erosion and runoff velocities that are proportional to the degree of sloping in the area. The study area (Figure 1) was drawn using data extracted from satellite images taken by the Shuttle Radar Topography Mission (SRTM) that were downloaded from the International Agriculture Research Consortium for Spatial Information Shuttle Radar Topographic Mission on 26 December 2018 [48].
The study area has an arid Mediterranean climate that is characterized by seasonal variations in mean monthly air temperatures, which usually range from 6 °C in January (winter) to 22 °C in August (summer). The mean annual air temperature is most often 15.0 °C. In addition, the annual rainfall depth varies from 100–200 mm in the Al Wala basin. However, the relatively high rainfall depths are characteristic of the northwesterly parts of this basin. In the west part of this basin, the mean annual potential evaporation rates are at their lowest at 1600 mm/year, compared to 2000 mm/year in the east part. The highest mean annual potential evaporation rate, however, is 2200 mm/year, which is usually recorded at the outlet of this basin, near the Dead Sea. There are several wadis (valleys) that drain into this outlet. They run from the eastern, northeastern, and northern highlands to the lowlands of the Jordan Valley.
Regarding agricultural activities, the Al Wala watershed is dominated largely by highland crops, with certain trees grown in its irrigated parts and cereals such as wheat and barley grown where irrigation water is not widely available. For the purpose of this study, an area lying in the western part of Al Wala Valley and stretching over 2100 km2 from the dam to the Dead Sea was considered.
Since November 2002, the Al Wala Dam, which is a roller-compacted concrete (RCC) dam, has served to recharge groundwater in Al Wala Valley, around 40 km south of Madaba and 40 km east of the Dead Sea. This dam has a height of 52 m and a storage capacity of 9.3 million cubic meters (MCM). As the rainfall rate drops rapidly eastward, subject to aerographic effects, the hydrological and related watershed processes are impacted as a result. A peak flow of 751 m3/s was recorded at the outlet of the Al Wala watershed on 24 October 2000. Indeed, October has been cited as the most hazardous month in terms of flash floods in this area. It is the month in which 11 of 16 flash flood events (Qmax > 100 m3/s) were recorded. Additionally, three peak flow surges in excess of 500 m3/s were recorded in this watershed.

2.2. Flooding Simulation Scenarios

In order to compile the available physical and meteorological data for digital floodplain delineation and for creation of a model for flood inundation, two scenarios were considered: a Clear Day scenario and a Rainy Day scenario. The Clear Day scenario may be considered when dam failure is unrelated to capacity factors. In this scenario, the water storage of the dam remains within the expected levels, though integrity of the structure deteriorates, regardless of the effects of external factors such as slope failure (slumping), as a result of static or earthquake loading or a piping (internal erosion) problem. The Rainy Day scenario, on the other hand, suits an environment in which wet weather conditions cause the water volume to rise above the design volume and, even, to the maximum capacity of the dam. This scenario is often a far more deadly scenario than the Clear Day scenario because it involves a huge volume of overflowing floodwater that is released as a result of a breach in integrity of the dam due to limited spillway capacity or spillway blockage and/or dam failure. In this study, both scenarios were considered in order to allow for taking suitable precautions against flooding events and to establish ERP in the case of a flooding event.
The method followed in this study to achieve its goals consisted of three major steps (Figure 2). First, the HEC-HMS was employed for hydrologic modeling and determination of the topographical upstream watershed parameters on the basis of simulated rainfall-runoff models of catchment responses in previous heavy rainfall events in the area. Based on this information, a basin and meteorological model was created with controlled specifications and imported from HEC-HMS 4.8 for use as a background map file. Flood hydrographs were drawn for the Al Wala Dam by further simulations of rainfall-runoff transformation over a hundred-year period of flooding.
The second major step involved an analysis of breaks or breaches of the dam using a 1D hydraulic model (HEC-RAS), which was employed to model subsequent flood hydrographs, peak flow, and the flood arrival time. Parameters of the breach itself, such as its physical characteristics (depth, width, and sloping angles) and chronological development (Wahl, 1998), were determined through an option in HEC-RAS called Inline Structure. Meanwhile, to route the outflow hydrographs of the breach, dynamic flood wave routing was complemented by rainfall IDF results, whose data described the history, durations, and average recurrence intervals (ARI) of the rain storms in the area. Lastly, in order to correctly simulate this scenario, accurate topographical information and data on hydraulic structures, flow, and boundary conditions were needed. The LIDAR data were, therefore, used for generating a high-resolution surface for analysis of avulsion hazard potentials on a gravel-bedded stream. The water surface produced by HEC-RAS was exported to ArcGIS 10.3 for processing. It was overlaid on shape file of the land use map of the area to accurately predict inundation extents on the land. Figure 2 demonstrates the logic of this research method, which is described in detail in subsequent sections.

2.3. Digital Elevation Models

Two separate topographical datasets were employed in this study: a coarse-resolution Digital Elevation Model (DEM) for hydrological modeling and a fine-resolution DSM for floodplain inundation mapping. The DEM used for the hydrological model should appropriately maintain the topographical terrain characteristics in order to offer the hydrological and morphological parameters. However, the models’ complexity raises the requirements for computing power, processing speed, file size, data storage, and cost (i.e., for higher spatial resolution). On the other hand, the digital surface models (DSM) data must have fine resolution to offer better clarity of the floodplain downstream, as well as of small streams, bridges, and other constrained conduits of flow that may drastically affect results. Digital Elevation Model data are fundamental for defining topographical parameters in watershed delineation, including the slope lengths and shapes, and hydrological parameters, including flow direction and accumulation, stream networks, and maximum flow lengths. These data were obtained from 1-arc second grid spacing of 30 m DEM obtained from SRTM [48] that was downloaded in ‘geotiff’ image format in decimal degrees and WGS84 datum. This DEM was then projected to the UTM coordinate system zone 36N using ArcMap 10.8 (Figure 3). Though SRTM maps the whole Earth, data are missing in some regions of the world due to a variety of factors, such as lack of contrast in the radar image, presence of water, and high atmospheric interference. Thus, the SRTM-DEM was pre-processed in order to compensate for the void pixels by using the Hydrology Toolbox in ArcGIS 10.8. The Fill function was employed to fill the sinks in the surface raster image to remove imperfections from the DEM and, accordingly, avoid potential related errors [49]. As a result, a high-accuracy terrain model was developed to use in computing the most accurate flow rate and flow speed possible and obtain the highest resolution possible so as to use these data in determining watershed geometry and drainage patterns in the study area and, subsequently, in developing hydrological models.
Additionally, a base geometric image of the downstream drainage network was needed for hydraulic modelling. This sort of image can be developed using field survey data or remotely sensed data. The former method has been customary for this kind of study for many years because it makes it possible to accurately survey an area for topographical data. However, it is a time-consuming and tedious process. For this reason, recent studies have shifted to the use of remote-sensing data owing to the fact that remote sensing can provide relevant data for hydraulic modeling in an efficient and cost-effective way [2,50]. As a result, the researchers managed fine-resolution DSM-based LiDAR data from the Royal Jordanian Geographic Center (RJGC) that were generated from raw, ground point elevation data that had been collected at an average spatial density of 2366 point samples/m2 using airborne LiDAR technology. These data were then processed to exclude non-terrain surface points (e.g., vegetation) and man-made structures. A DEM of 1 m spatial resolution was used for 1D HEC-RAS modeling. Then, it was developed via spatial processing of LiDAR raster files in ArcGIS 10.3. After processing of these files into a working dataset, the LiDAR topographical data were merged into a unified DEM, thus reducing errors before filtration through specific commands in the pix4D mapper. This terrain mask was computed based on the classified point groups [51]. After ensuring that the raster files have no elevation values, corrections can usually be made by use of local and regional topography [52]. The results of this processing are shown in Figure 4.

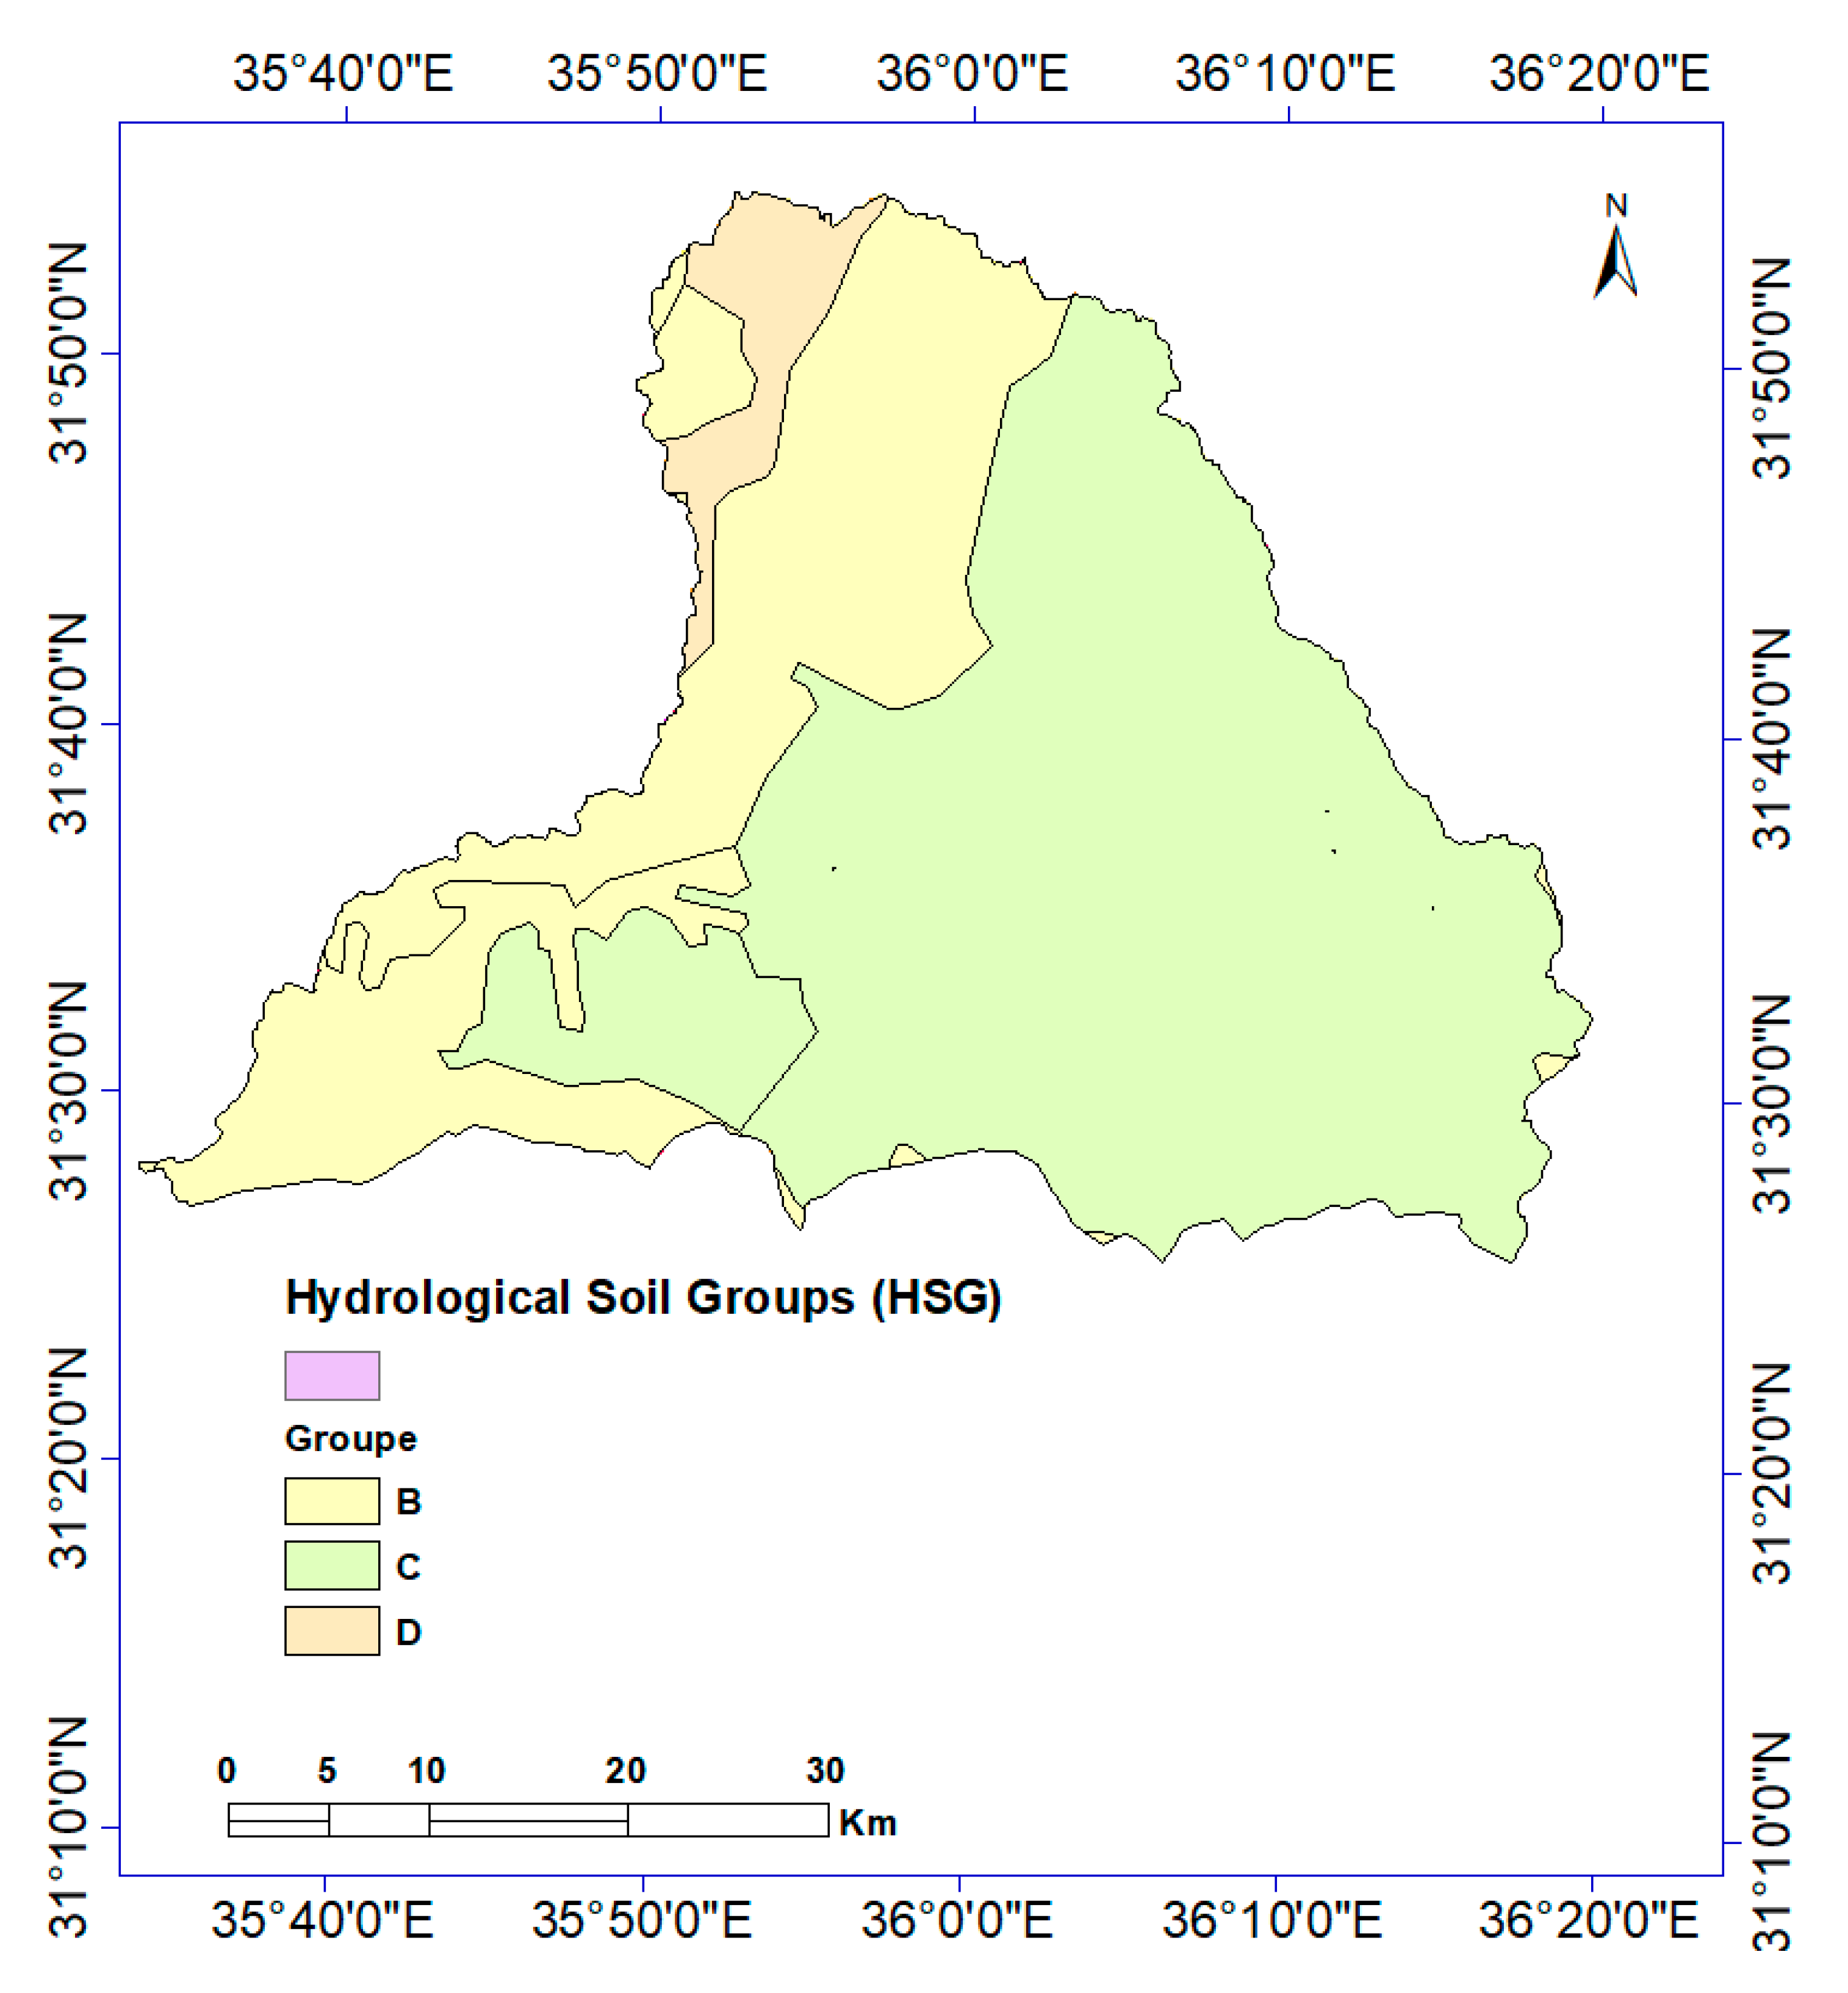
2.4. Land Use and Soil Maps

Several ecological and infrastructural factors influence the infiltration characteristics and storage capacity of the dam and the runoff behavior. Stitch maps that were produced in ArcMap from high-resolution satellite images of Google Earth Professional (v. 7.1.2) at a visual altitude of 200 m [53] allowed for manual classification of land cover and land use within the Al Wala watershed (Figure 5) and identification of vegetation cover and densities alongside human settlements. A Google Earth image of the study area taken in the year 2015 was obtained and compared with topographic maps of 1:20,000 scale for the Madaba Governorate. Using field verification to evaluate the accuracy of the results, corrections were made to a soil map of the area produced through a detailed study of this governorate, which was conducted by the Ministry of Agriculture, Jordan, in 1993. The resultant soil map constituted the basis of the soil profiles used in this research.
After correction of these data, they were combined to produce the land use map (Figure 5) that was employed in the simulations in this study. Analysis of this map revealed that 47% of the watershed area was open rangeland and bare soil. Regarding agricultural activity, irrigated agriculture covered about 38% of the land within this watershed. Urbanization was higher in the north-westerly parts of the watershed than in the remaining areas. Overall, the urbanized parts of the watershed covered 7% of the total area. On the other hand, the downstream area of the watershed is characterized by a lower population density than the upstream area, and the settlements and bare soil are the main land use and land cover, respectively, in the area [54].
In the aforementioned study of the Ministry of Agriculture, three levels of soil maps were created. The soil map that was the most relevant for this study is the Level 1 map, in which eight soil types were identified in the Al Wala watershed. These eight soil types were classified according to soil texture for use in the SCS curve number method SCS-CN as shown in Figure 6. These classifications were then related to their hydrological groups based on permeability and infiltration, as determined by the US Soil Conservation Service (SCS). The eight soil types complied with four groups: A through D in Figure 6 [55,56].

2.5. Runoff Curve Number

Data on land cover and use and hydrological soil groups [55] were employed in spatial calculations to determine the gridded runoff curve number (CN). The maps and soil information were input into ArcMap for CN grid generation using the HEC-GeoHMS extension tool. Specific codes were applied to each soil type in the study area to determine the hydrologic soil group. The generated hydrologic soil groups, in addition to information on land covers and uses within the Al Wala watershed, allowed for a new map to be generated. Overlaying the information of both maps enabled comparison. A CN ‘look-up’ table with appropriate CN values, ranging from 0 to 100 was extracted from this merged map to describe the runoff potential. A high CN value indicates high runoff potential, and vice versa. These values aligned with the values listed in the standard SCS curve number tables [55], with consideration of the Antecedent Moisture Conditions (AMC). Since the Al Wala watershed is frequently exposed to arid conditions, the attribute tables and their themes were employed to calculate the CNII values for each grid.
Afterwards, the CN information and the physiographical characteristics of the study area were transformed into estimates of the hydrological parameters of the Al Wala watershed for rainfall–runoff modeling. The SCS method was employed to compute historic runoff events under storm conditions, considering the initial abstraction of rainfall, land use, and AMC of the governorate of Madaba. As a result of these transformations, a CN-grid map was created as illustrated in Figure 7. The land covers and infrastructures were assigned roughness coefficients according to [57] and standardized as illustrated in [58]. Those estimated coefficients were input into a 2D HEC-RAS hydrodynamic model to produce a hydraulic roughness at reach scale with different roughness values assigned to the channel and the floodplain of the valley. It was deemed that this data management and processing would help in developing further insight into vegetative roughness throughout the floodplains of the Al Wala watershed.

2.6. Hydrological Data

In the current study, historical records of rainfall data for the study area since 1971 were obtained from the Ministry of Water and Irrigation (MWI), Jordan, and JMD. Twenty-six gauges were used by these departments. The researchers tested these data for consistency over the period 2010–2020. The tests showed that all but five of these gauges lacked quality and regularity in their hourly reports (Table 1). A maximum average annual rainfall rate was recorded within the study watershed at Mushaqqar station, whereas a minimum average rainfall rate was recorded outside of this watershed at the South Shuna station (Table 1). For analysis of the spatial distribution of rainfall within and around the Al Wala watershed [59], rainfall rate estimates were calculated by HEC-HMS for the areas covered by each of these 26 rainfall stations.
No records of runoff measurements in the Al Wala watershed were available in MWI. Nonetheless, this ministry and the Dams Directorate in Jordan Valley Authority could provide comprehensive daily measurements of the water level and volume in the reservoir and inflow and outflow quantities for the time period extending from November 2010 to December 2020. The contour map of the study area as provided by [60] was employed to develop the following regression equations:
H = 4.603 A 4 + 29.82 A 3 + 69.36 A 2 + 82.81 A
V = 13.3 A 1.364
where
  • H: water surface elevation above the upstream bed level of the dam, equal to 484.9 m amsl;
  • A: reservoir water surface area in km2;
  • V: reservoir storage volume in MCM.
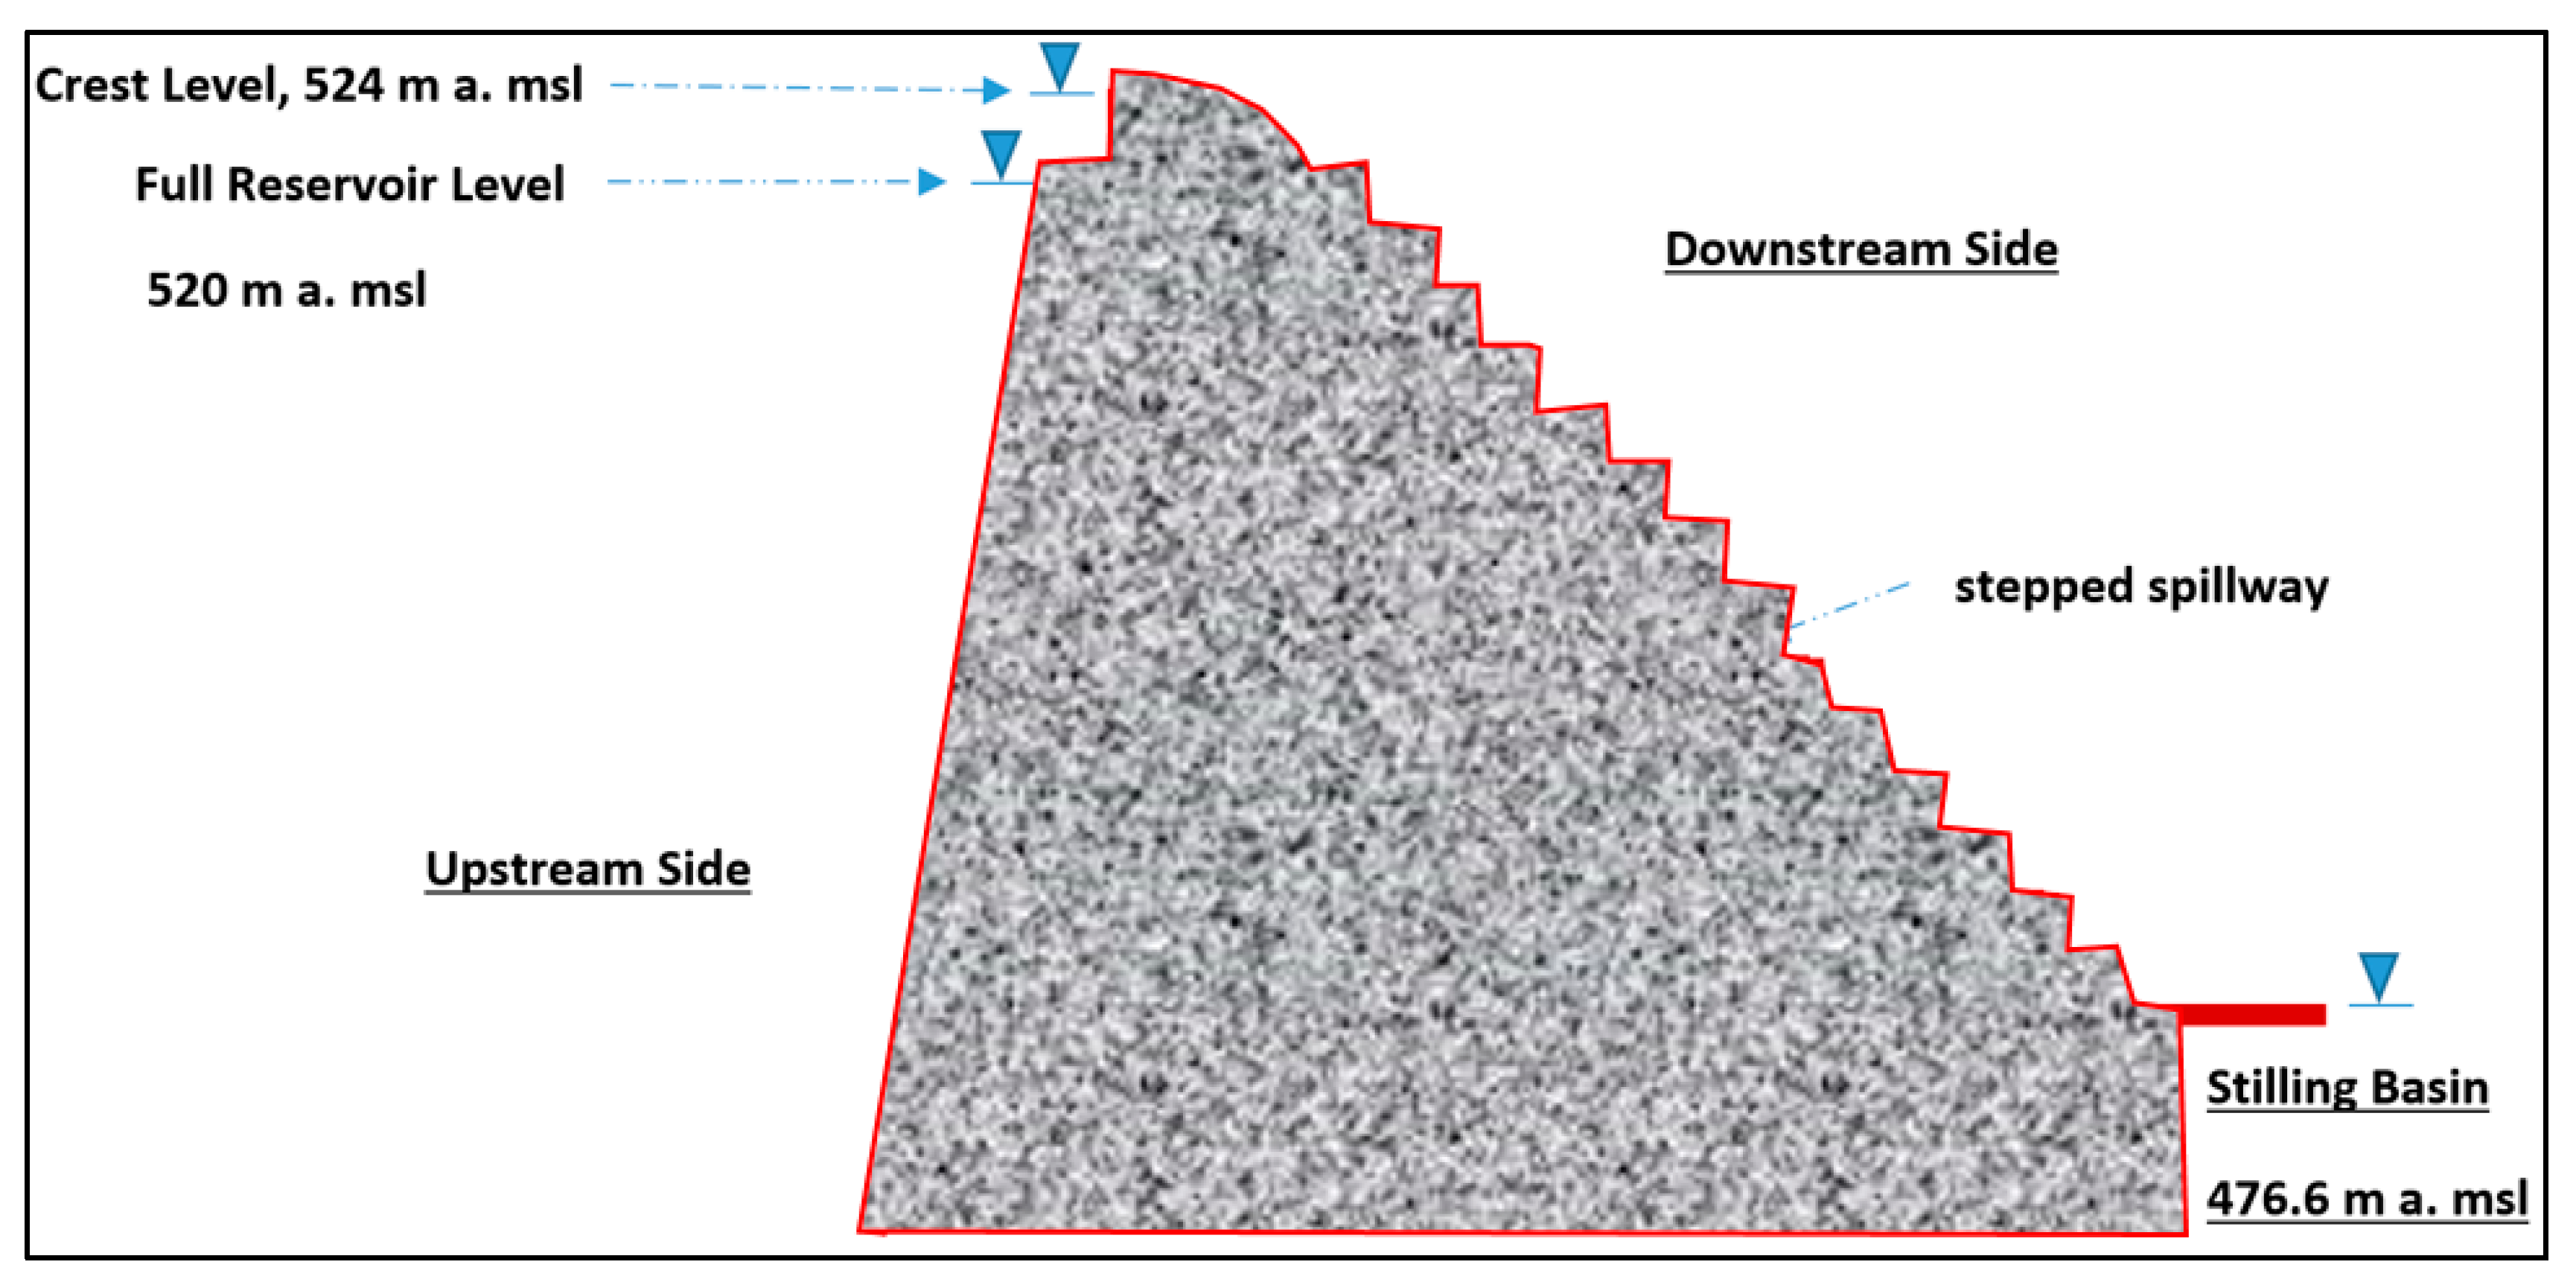
These regression equations can be employed to calculate the maximum capacity of the reservoir and the volume-height relation for the Al Wala Dam. The daily levels of water in this dam were used in the generation of daily inflow hydrographs for specific wet weather days. These hydrographs can be employed in the calibration and validation of the hydrological model.
This study also used IDF maps, which contain a variety of statistical information about the country, because of their coverage of the Al Wala watershed. Rainfall data collected at 50 Autographic Rain Gauging Stations in the period 1983–2011 were managed and employed in the analysis. These maps report recurrence intervals and duration of rainfall in minutes, as well as maximum rainfall intensities in mm/h. They were used alongside independent data collected at gauging stations as early as 1963. Those independent data were intended to account for inconsistent representations in the data collected at the 50 Autographic Rain Gauging Stations [61]. As such, rainfall intensities for six-hour, twelve-hour, and twenty-four-hour time periods were obtained from the isohyetal IDF maps for return period of 100 year to be used in hydrological modeling. The rainfall intensity values reported at the five gauge sites are listed in Table 1.

2.7. Al Wala Dam

The Al Wala Dam is located in the Al Wala Valley, about 40 km south of Amman. Its construction took three years, and it was finished in 2002. It was built using RCC in its center, surrounded by non-homogenous, earth fill abutments that are structured as a zoned earth dike with a watertight clay core. This dam lies at an altitude of 524 m amsl and has a height of 52 m and a total length of 380 m. It has a crest length of 480 m and a width of 8 m. It proved capable of storing 9.3 MCM following its construction. This storage capacity was increased in 2020 to 25 MCM. The spillway of the dam has a width of 105 m and channel drainage capacity of around 2020 m3/s.
The upstream recharge of the Al Wal Dam consists of argillaceous colluvium and wadi alluvium. Meanwhile, the downstream areas consist of alluvial material built up from the resting of the valley on sand filter mats, which protect the crumble, colluvial, and marl foundations of the dam (Figure 8). Limestone ripraps, whose material density guarantees mechanical stability and strength, protect the embankments and contribute to the total volume of this dam, which amounts to 1,418,810 m3. A temporary tunnel-type diversion gallery has a length of 373 m and a diameter of 7 m. Furthermore, it has a discharging capacity of 484 m3/s in the event of a flood and is connected through a tulip-type spillway to a stepped dissipation basin having a volume of 1770 km3. As water pours from the dam, it is utilized in irrigation of crops in Al Wala and Al-Hidan valleys. It recharges the underground wells in these two valleys with about 5 MCM of water every year. The sections of the dam, both before and following its construction, are depicted in Figure 8. The major features and geometric data of the Al Wala Dam are provided in Table 2.

3. Modeling and Simulation

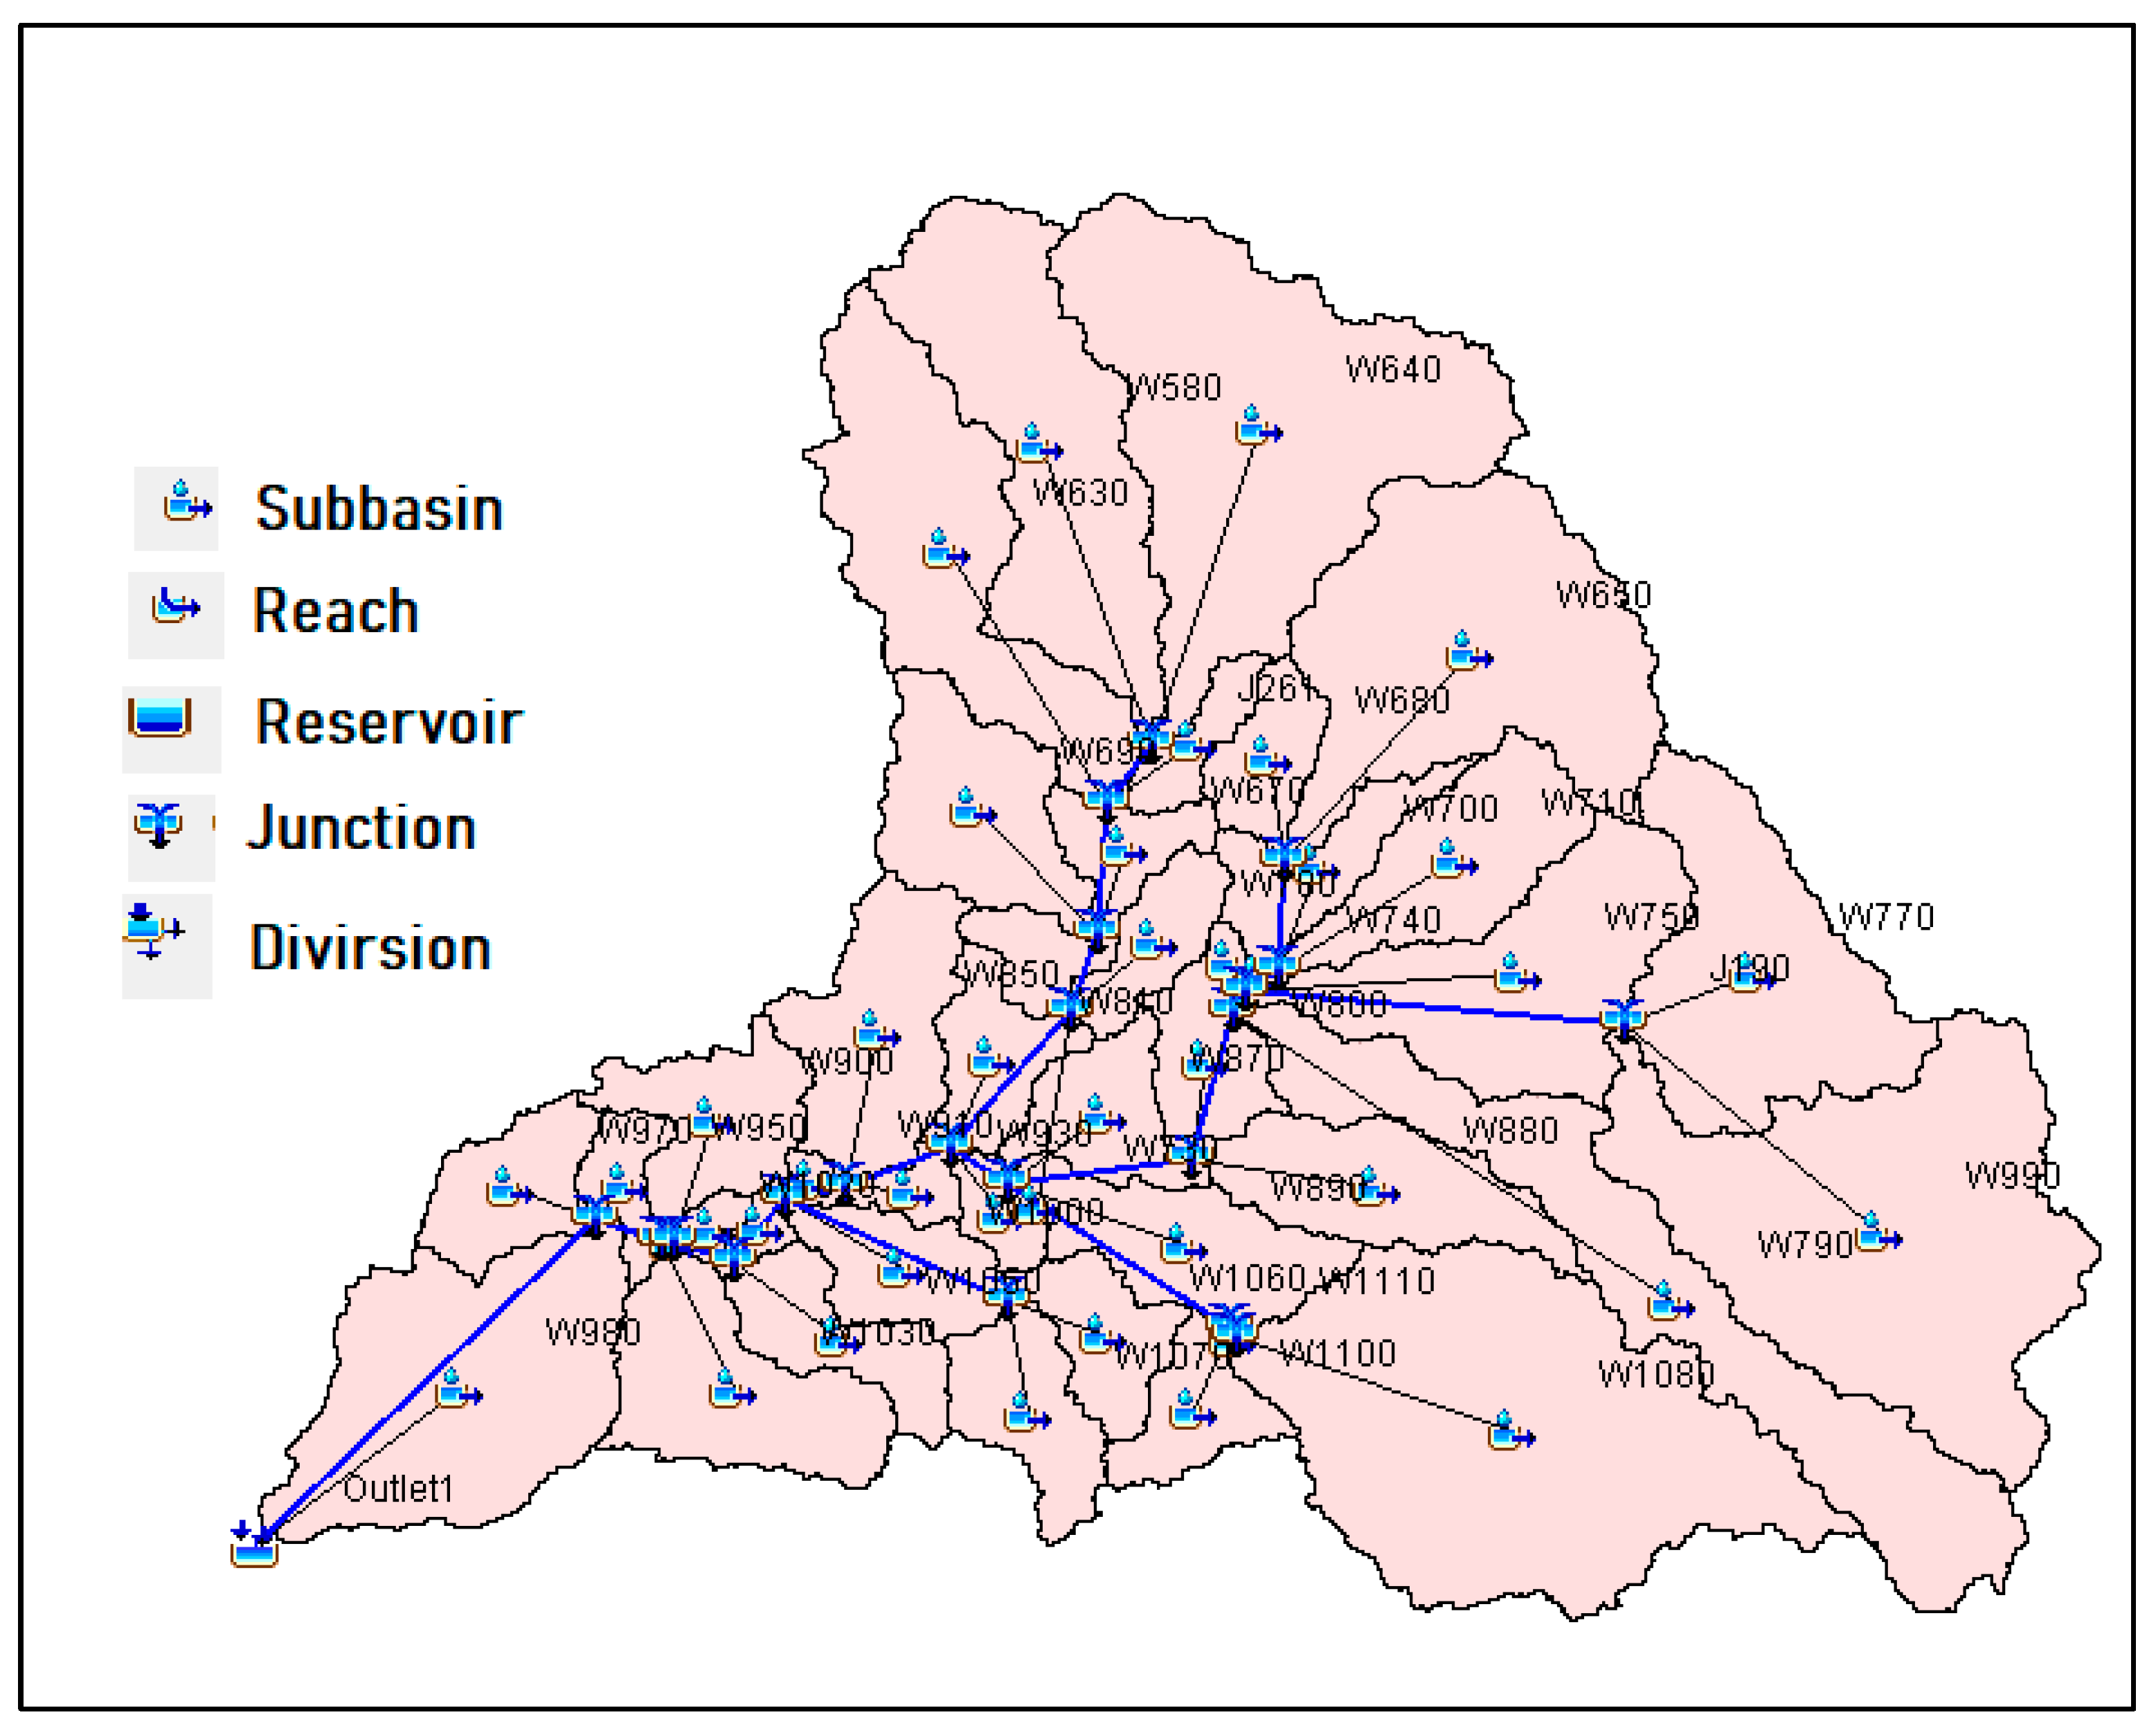
3.1. Rainfall Runoff Modeling

The HEC-HMS may be used for rainfall-runoff modeling. As with any physically based and conceptually semi-distributed model, this system performs hydrological simulations. Models should be chosen based on a number of factors, primarily including their intended purposes, availability of suitable data, and experience of the researcher [62]. Detailed account on rainfall-runoff models in the HEC-HMS may be found in the user’s manual [63]. Different datasets are demanded by the HEC-HMS, including DEMs, weather data, data on soil type(s), and land use data. In the case of the current study, details on these data have been provided in Section 2.3, Section 2.4, Section 2.5 and Section 2.6.
The ArcHydro extension of ArcGIS allowed for determination of the physical characteristics of the Al Wala watershed, including the stream network and the sub-basins and their boundaries and areas. This ArcGIS extension allows for visualization of spatial information, hydrological modeling, and spatial analysis that generate inputs for direct use in the HEC-HMS for further hydrological modeling. This modeling system (HEC-HMS) was employed in simulation of the runoff patterns in the Al Wala watershed. During this process, the watershed was divided into nine sub-basins as shown in Figure 9.
There are three primary components of the HEC-HMS: the basin model, the meteorological model, and control specifications. The basin model performs processing of the physical data of the catchment area, whereas the meteorology model performs processing of meteorological data such as the precipitation, evapotranspiration, and snowmelt data. A variety of methodological methods are also included in the HEC-HMS, including six historical and synthetic precipitation methods, two evapotranspiration methods, and one snowmelt method.
Stream flow simulation requires careful decisions to be made on the model type to employ and the time periods to simulate in terms of the start and end dates and the computation time steps. For the purposes of this study, a loss-rate method titled the Soil Conservation Service (SCS) Curve Number (CN) method was selected. This model can calculate the volume of streamflow accurately, taking into consideration watershed characteristics like soil types, land covers and uses, hydrologic conditions, and previous moisture conditions [64]. The calculations in this method are based on the following equation [55]:
Q = P 0.2 S 2 P + 0.8 S , P 0.02 S < 0 0 , P < 0.2 S
where
  • Q: the accumulated runoff volume or rainfall excess (mm);
  • P: the accumulated precipitation (mm);
  • S: the maximum soil water retention, which is given by the following equation:
S = 25400 CN 254
where CN is the curve number.
In this equation, the maximum soil water retention (S) is mapped to the curve number, which is representative of the runoff potential of the land cover that is mainly affected by three broad variables: soil properties, land cover classifications, and hydrological surface conditions. The loss-rate model (SCS-CN) that describes direct flow includes the transformation of precipitation into surface runoff. In the event of a lack of base flow in the area, no base flow model is needed. However, in the case of any transformation method, the lag time must be specified and included in the calculations. This can be achieved using Equation (5), which describes the relation between the time of concentration (Tc), given by Giandotti’s [65] formula in Equation (4), and the lag time (Tlag):
T l a g = 0.6 T c
T c = 4 A + 1 · 5 L 0.8 H
where
  • Tlag: lag time;
  • Tc: time of concentration;
  • A: watershed area (km2);
  • L: length of the main channel (km);
  • H: difference between the mean elevation of the basin and the elevation of the outlet (m).
The HEC-HMS provides options for automated calibration and manual calibration. In order to calibrate the HEC-HMS model and verify the accuracy of its outcomes, single rainfall-runoff flooding events that took place on three dates (7 March 2014; 22 October 2015; and 4 January 2018) were employed. The calibration process involved use of various CNs in the model that was simulated by HEC-HMS. During this process, parameter values were manually tested for optimal assimilation of the observed and simulated values. The results of this calibration work were tested using various performance metrics, which included the coefficient of determination (R2) and the Nash-Sutcliffe model efficiency coefficient [31].
Efficiency of the streamflow model was evaluated using the Nash-Sutcliffe model efficiency coefficient (Ef), which is given by the following equation:
E f = 1 q i q ^ i 2 q i q = 2
where
  • qi: the observed streamflow;
  • q ^ i : simulated streamflow;
  • q = : mean value of the observed streamflow.
Another model performance evaluation metric is R2, which is obtained by squaring the coefficient of correlation between the observed runoff (O) and the simulated runoff (S) according to the following equation [37]:
R 2 = ( Q O b s q = o b s ) 2 ( Q s i m q = s i m ) 2 ( Q O b s q = o b s ) 2
where
  • Qobs = observed runoff;
  • Qsim = simulated runoff.

3.2. Simulation Models of Dam Failure Mechanisms

Analysis of dam overtopping and pipe failure breaches requires knowledge of the geometrical characteristics of the breach, such as its final bottom width, final bottom elevation, side slopes, formation time, and initial reservoir elevation prior to breach formation. To estimate the values of these parameters, regression analysis of the dam height, dam materials, water surface elevation, and storage volume can be performed. This analysis was conducted in this study using HEC-RAS, which offers a variety of regression model types to choose from. Review of the literature on the regression model types suggested that Froehlich’s regression is the most recent regression method and fits the purpose of this study the best [66]. In this method, 74 earthen, zoned earthen, earthen with core wall (e.g., clay), and rockfall datasets are considered to produce average estimates of breach width, side slopes, and failure time using a number of equations. Regression analysis according to this method disclosed that water height and volume in the dam at the time of the hypothesized breach ranged from 3.05 to 92.96 m and 0.0139 to 660.0 × 10⁶ m3, respectively. In fact, the height of the water in the dam was lower than 30 m 93% of the time and lower than 18 m 81% of the time. Meanwhile, the water volume was less than 25 × 106 m3 86% of the time and lower than 15 × 106 m3 82% of the time. According to predictions of this analysis, the average side slopes are estimated at 1.0 H/1.0 V for the overtopping failures and at 0.7 H/1.0 V for the piping and seepage failures. The average breach width (m) is calculated using Equation (9), while the breach formation time (s) is computed using Equation (10):
B a v e   = 0.27 K O   V W 0.32   H b 0.04
t f = 63.2 V W g h b 2
where
  • Bave: average breach width (m);
  • Ko: constant (1.3 for overtopping failures and 1.0 for piping failures);
  • Vw: reservoir volume (m3) at the time of failure;
  • Hb: height of the final breach (m);
  • g: gravitational acceleration (9807 m/s2);
  • tf: breach formation time (s).

3.3. Hydraulic Model Analysis

The HEC-RAS can perform flood analysis. It has been employed for this purpose by many researchers in the field [45,46,47]. In the effort to simulate a dam break scenario using this software, the present study considered the following variables: geometric features of the valley downstream the dam; morphology of the area; hydraulic characteristics of the valley, including its roughness, contractions, and expansions; areas of interest for flood wave impact assessment; and initial and boundary conditions of the 2D routing area, which were drawn from flow and level hydrographs. The upstream boundary conditions of inflow and portable maximum flood (PMF) hydrographs that were obtained from HEC-HMS estimations and the DEMs that were extracted from LIDAR images were imported into HEC-RAS for computation. Having also defined various regions for HEM-RAS to recognize, such as the reservoir as a ‘storage area’ and the dam as a ‘weir’, a large mesh model of the downstream valley was constructed. It consisted of 106,241 cells of 1 m × 1 m dimensions each. This large mesh was intended for detailed representation of the valley for subsequent analysis. Parameters of various sizes were also demanded by HEC-HMS to correctly resolve this mesh map.
The HEC-RAS was designed to solve both the 2D Full Saint-Venant equation and the 2D diffusion wave equations. In this respect, Equations (11) and (12) approximate diffusion waves of a shallow water model [58].
H t · β + q = 0
w h e r e : β = ( R H ) 5 3 n H 1 2
where H is the water surface elevation; t is time; ∇ is the vector of the partial derivate operators given by ∇ = (∂/∂x, ∂/∂y); β is the momentum coefficient; ∇H represents the surface elevation gradient; q denotes a source/sink flux term; R is the hydraulic radius; and n stands for the empirically derived Manning’s n coefficient.
For solving downstream flood wave propagation, this study employed a HEC-RAS 2D flow model, which can use the whole set of Saint-Venant equations or the 2D diffusion wave (DW) equations in order to solve this problem. The 2D DW equations proved to be highly successful in dam break analysis and prediction (e.g., [67,68]); they can simulate inundation depths and the arrival time of dam-break flows with a high degree of accuracy. Use of the Saint-Venant equations was possible. However, the researchers preferred the 2D DW equations for their well-established computational efficiency [67], in addition to their stability and reasonable running times [67,68,69].
Since the reservoir of the Al Wala Dam is wide and shallow, level pool routing was selected as an appropriate method for inflow flood hydrography routing. The downstream area was connected to the reservoir via the SA/2D area connection, which actually represents the body of the dam. Surface roughness, on the other hand, was determined by Manning’s values, which were extrapolated from remote sensing data and classified according to various types of land covers to provide for a realistic simulation of characteristics of the water flow around buildings, greenhouses, fences, and vegetation [70].
Of additional importance to the simulation is the boundary condition, which should be selected such that it will match the actual site conditions to accurately describe downstream floodwaters. For the purposes of this study, an inflow hydrograph upstream boundary condition was selected, drawing upon results of simulation of the aforementioned six-, twelve-, and twenty-four-hour storm scenarios over a return period of 100 years using HEC-HMS. In other respects, several assumptions were made in the simulation process. For instance, the initial water level of the reservoir was presumed to be equal to elevation of the spillway (that is, 520 m amsl), which is relatively substantial level, corresponding to a water volume of 25 MCM, relative to the large volume of water associated with the flood. Therefore, it is likely that size of the flood wave is much affected by the water present in the reservoir during the initial formation of the breach. Normal depth (friction slope value = 0.0004) and the time series of the opening of the dam gate in the inline structure are given as downstream boundary conditions. As well, the spillway gate was assumed to be kept open by 0.1 m, while the sluice gate was presumed to be entirely closed.

4. Results and Discussion

4.1. Rainfall Runoff Modeling

In the present study, a rainfall-runoff model produced event-based simulations that were calibrated using three single-flood events that occurred in the Al Wala watershed in March 2014, January 2015, and October 2018. These three flood events were chosen because they were the three highest recorded peak discharge events, with more than one flow peak in an individual rainstorm (Figure 10), that occurred in this watershed during the period 2010–2020. The mean total streamflow for each day was used as the unit of measurement of total flood magnitude before being input to HEC-HMS for simulation purposes. The inputs to HEC-HMS also encompassed the daily streamflow data, to provide an overall view of the streamflow behavior in the Al Wala watershed as an example of a watershed in an arid area [60].
An initial model setup was implemented to simulate daily timescales using measurable physical watershed attributes like topography, land use, and slope. Then, calibration was performed manually using three variables: initial abstraction (Ia), CN, and the Muskingum routing coefficient, after being tuned to best complement the observed streamflow data. Following this, statistical comparison between the simulated and observed hourly runoff hydrographs allowed for holistic analysis of model performance. In this respect, Figure 11 displays scatter plots of the observed and simulated monthly discharges for the calibration and validation periods. These scatter plots disclose that the simulation is fairly accurate. The high R2 value associated with the calibration periods (R2 = 0.885, NSE = 0.871) and the validation periods (R2 = 0.817, NSE = 0.768) indicate satisfactory model performance for the purpose of the present study (Figure 11). Comparison also revealed that high peaks of streamflow are predicted to a reasonable accuracy, though underestimations occurred. Hydrograph shapes and peak timings, on the other hand, correlated well with the observed data. Additionally, it was found that the model estimates of the physical parameters (DEM, soil type, and land use) can be reliably used in calibration.
After calibration of the HEC-HMS model and verifying its performance, simulations of hypothetical storm events were made in an effort to obtain hydrographical data. Over a return period of 100 years, corresponding to a 1% exceedance probability, storm durations of 6, 12, and 24 h were selected, with intensity durations of 15 min for the six- and twelve-hour storms and 1 h for the twenty-four-hour storm. The runoff hydrograph for the peak discharges of different storm durations of the 100-year return period is displayed in Figure 12. Table 3 lists the simulated peak discharges (m3/s) of the Al Wala Dam over the return period.
The time to peak (i.e., lag time) in hours, which was calculated using Equation (5), was found to be 10.44 h. For storm duration scenarios of 6 h, 12 h, and 24 h, the time to peak is half the design storm duration in hours plus the lag time, so the time of peak discharge is ((6/2) + 10.44 = 13.44 h) for the hypothesized storm duration of 6 h and 16.44 h ((12/2) + 10.44) for the hypothesized storm duration of 12 h. These theoretical values are compared with the simulated values in Table 3.

4.2. Flood Hydrograph and Floodplain Mapping
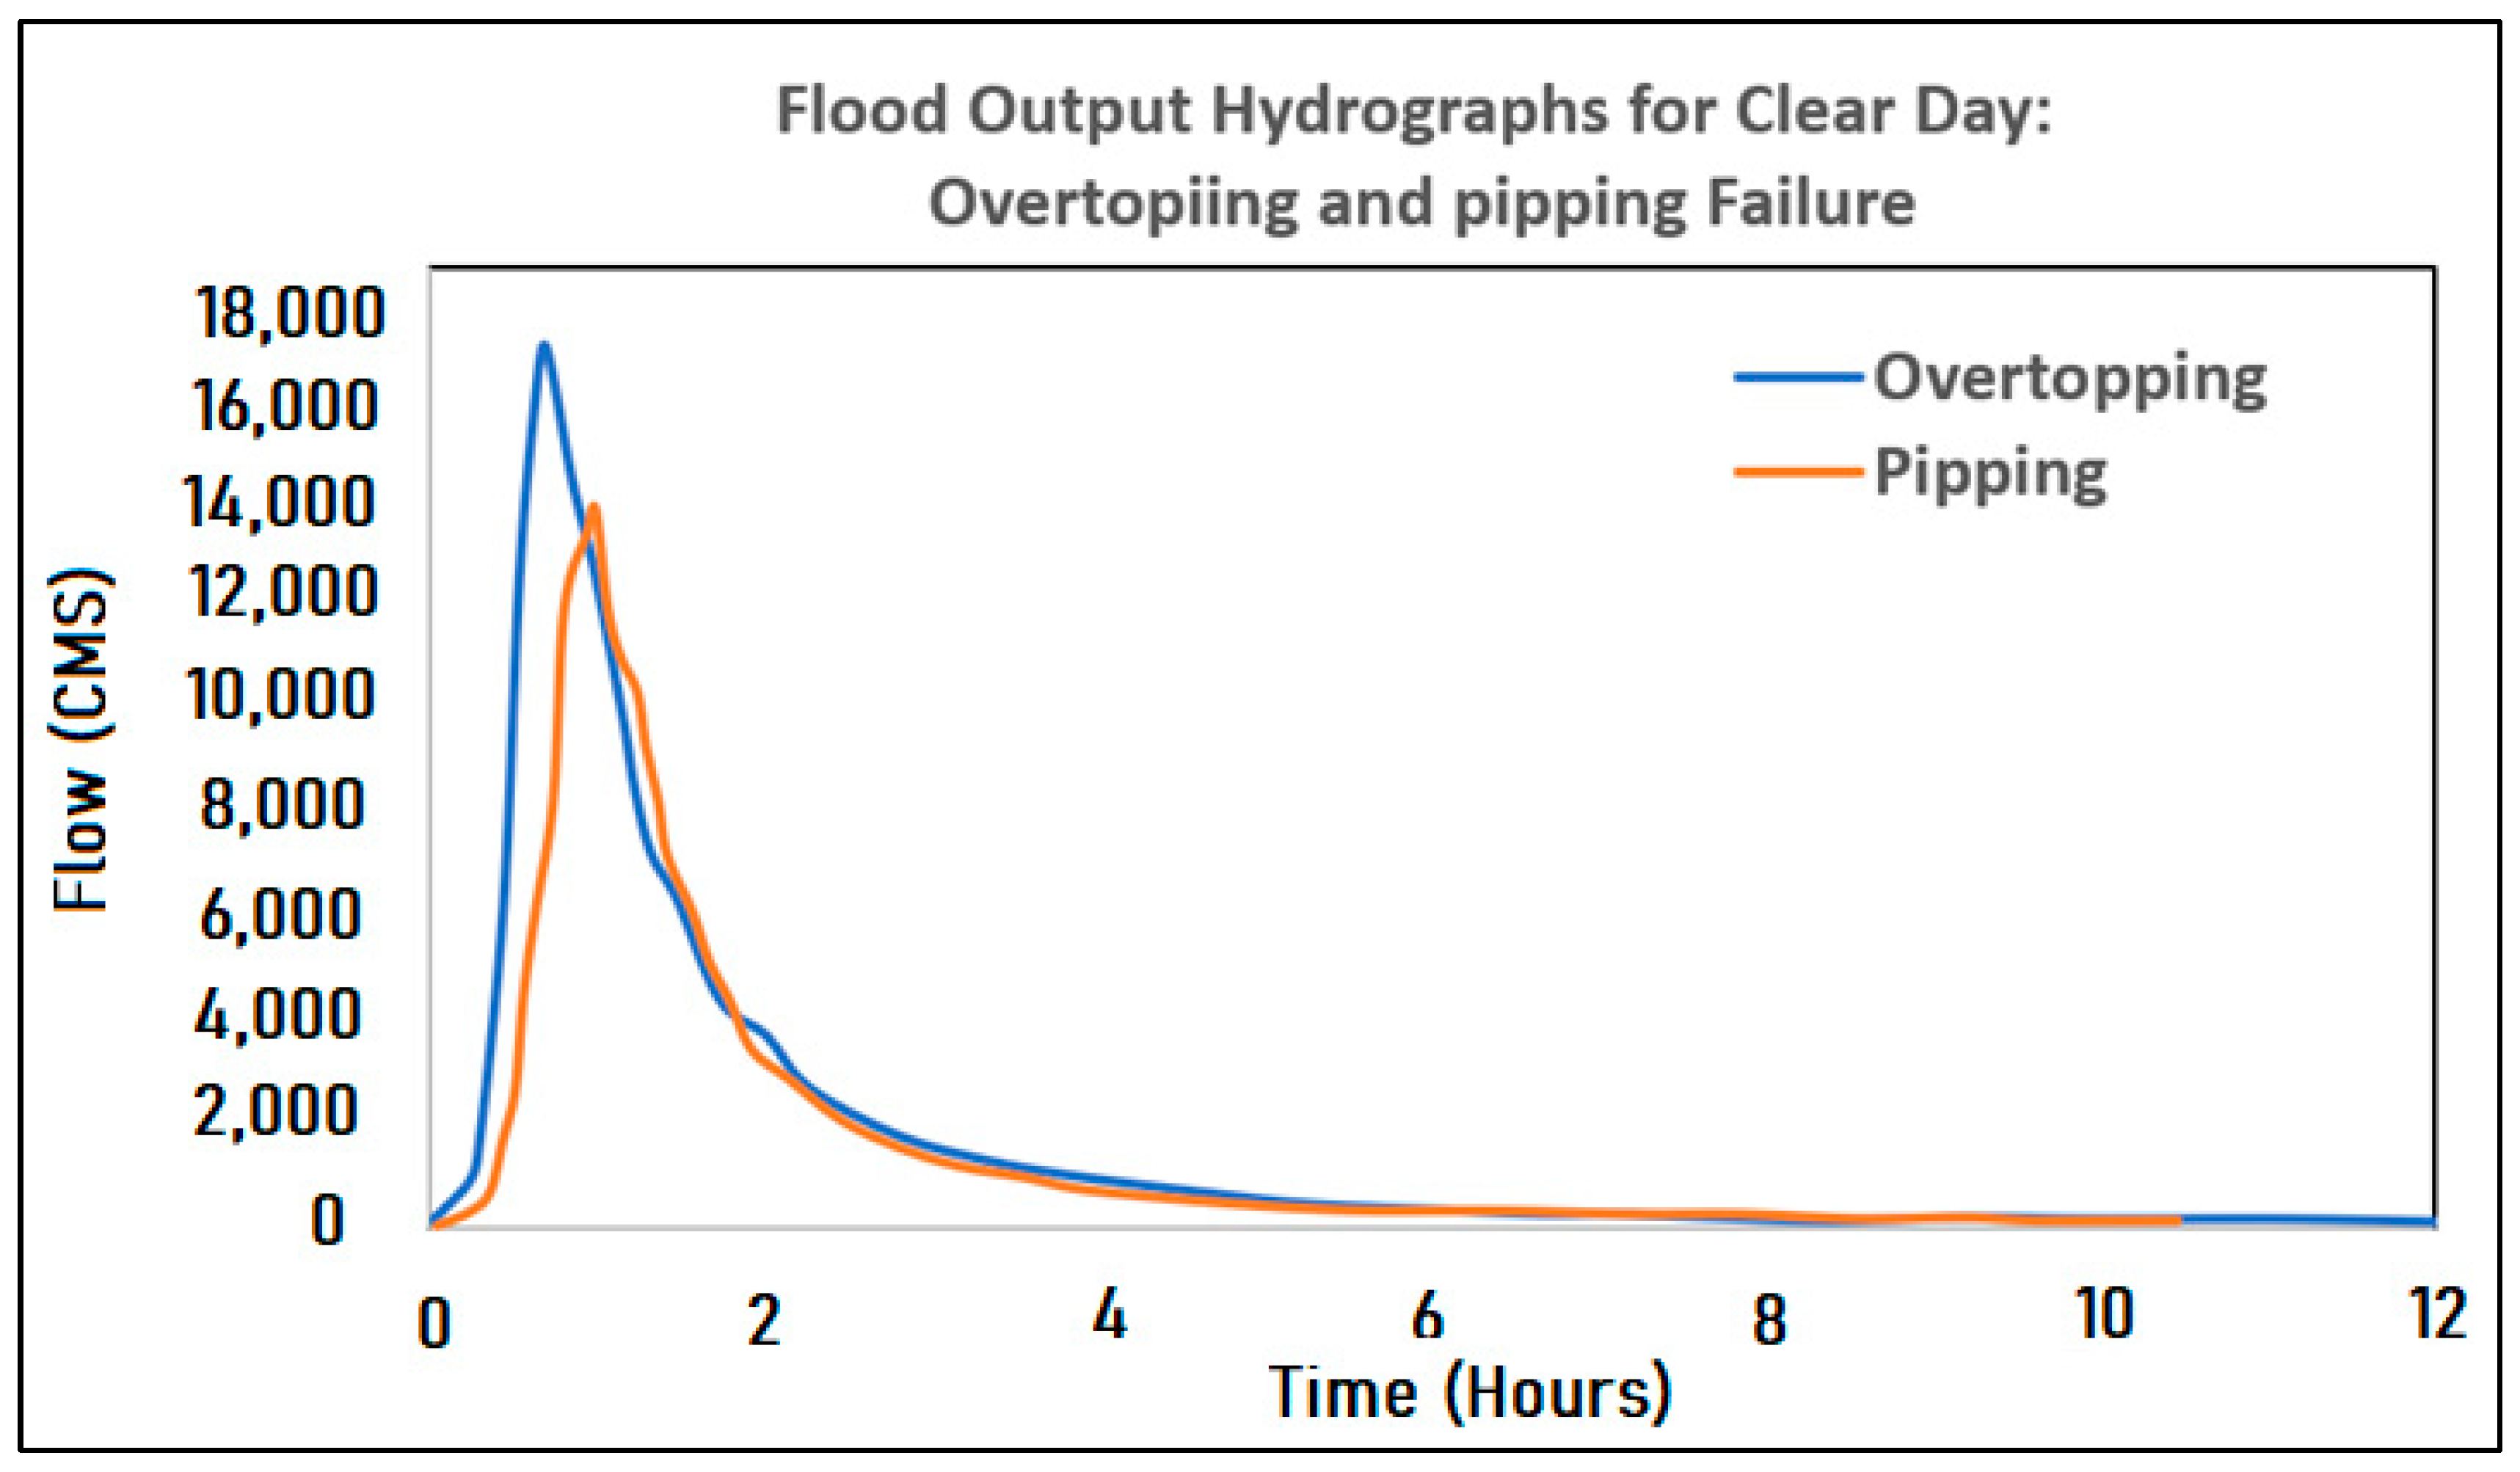
Outflow Hydrographs

The HEC RAS was used to model outflow hydrographs following dam failure for both the piping mechanism and the overtopping mechanism. The results of the break parameter computation are shown in Table 4. The purpose is to establish a relationship between outflow discharge and the establishment of break times.
Outflow hydrographs for clear day piping and overtopping failures downstream of the dam are depicted in Figure 13. The results demonstrate that the amplitude of peak flow is quite large immediately downstream of the dam and progressively diminishes further downstream. For pipe failure, the peak flow rate is observed to be 12,980 m3/s directly downstream of the dam, while for overtopping failure, the peak flow rate is observed to be 16,489 m3/s directly downstream of the dam. The data show that the peak flow in the downstream zone diminishes progressively as the time rises. Peak flow values are greater in overtopping failure than in pipe failure at all stations.
To assess the likelihood of piping and overtopping failures for Rain days in the case of overloading of the reservoir, two-dimensional, unsteady flow simulations were performed in HEC-RAS 6.1 for a stretch of 35 km downstream the Al Wala Dam. A detailed flood map was generated by using the RAS mapper feature of the HEC-RAS software considering potential floodplains with recurrence interval of 100 years and the aforementioned storm durations of 6, 12, and 24 h. In all, six combinations of scenarios were presented in the resulting flood hazard maps (Figure 14, Figure 15, Figure 16 and Figure 17) that include potential flood extent layers and inundation boundary layers. These flood inundation distribution maps, which drew on data produced by hydraulic simulations, revealed that vegetated parts of the watershed, which are covered by herbaceous crops, orchards, trees, and grass, were the parts most at risk of flooding. It is, accordingly, anticipated that, in the event of dam break, the floodwater will cause substantial damage to the agricultural, and other green, lands and significantly affect the economy of the downstream areas and the livelihoods of the people who live there.
In the case of the Clear Day scenario, the simulations disclosed that in the event of a piping failure, downstream inundation will cover an area of 5.262 km2 (Figure 14 and Figure 15). However, the inundated area will increase to 6.837 km2 in the case of a six-hour storm; 8.518 km2 in the case of a twelve-hour storm; and 9.390 km2 under the conditions of a twenty-four-hour storm (Figure 16). As to overtopping failure, inundation according to the Clear Day scenario will cover an area of 13.171 km2 (Figure 14 and Figure 15). The inundated area will increase to 13.302 km2 in the case of a six-hour storm; 14.249 km2 in the case of a twelve-hour storm; and 14.594 km2 under the condition of twenty-four-hour storm (Figure 17). It can be noticed that the variation in inundated areas in the case of overtopping failure coupled with Probable Maximum Flood (PMF) scenarios, likely due to the fact that the inflow outflow hydrographs of reservoir routing are small in comparison with overtopping failure dam breach flood flow. Figure 17 depicts the small difference between flooded areas in the case of overtopping failure coupled with Probable Maximum Flood (PMF).
Similarly, flood depths in near the Al Wala Valley Park, 5 km downstream of the Al Wala Dam, were modelled. The simulation findings reveal that the highest flood depth is 24.48 m in the event of a Clear Day pipe failure, rising to 25.85 m during a six-hour storm, 28.31 m during a twelve-hour storm, and 30.77 m during a twenty-four-hour storm. The flood depth will be 32.25 m in the case of overtopping failure under the Clear Day scenario. This depth will rise to 33.56 m during a six-hour storm, 34.16 m during a twelve-hour storm, and 34.63 m during a twenty-four-hour storm. The high values of the flood width are due to a deep and narrow valley path with higher vegetation density. The flood peaks within the study watershed were found to be inconsistent in both failure types. However, simulations unveiled that the overtopping failure results in higher peak flows at all locations than the piping failure. In the overtopping failure, water flows at a very high speed all over the watershed, estimated at 10–9 m/s, corresponding to a flow rate of 10,000–16,000 m3/s. Water flowing at such high speed can destroy anything it encounters, especially when factoring in the altitude difference of 800–900 m between the dam and its farthest downstream areas close to the Dead Sea. Consequently, overtopping failure is a more serious failure than the piping failure in both investigated scenarios.

5. Conclusions

In view of the fact that dam breaches are a serious threat to contemporary societies, this study sought to contribute to a further understanding of these processes through simulations of breaches in the Al Wala Dam in Jordan using the HEC-RAS modeling software. In recent years, climate change has caused an increase in precipitation, a decrease in relative humidity, and a rise in temperature across the region. A flood occurred in this study area as a result of a strong rainstorm that occurred on the mountain slopes in a short period of time. The study area features moderate to extremely steep slopes due to the catchment’s inability to control flow, resulting in high-speed runoff generation. Flood hydrographs for the Al Wala Dam catchment were generated using the HEC-HMS model. At the Al Wala dam site, the flood hydrograph data reveal a peak discharge of about 349.2, 438.4, and 588.9 m3/s. The HEC-RAS modeling approach was utilized to determine flood wave propagation as a result of a thunderstorm scenario by computing the water level of preceding floods. The HEC-HMS peak discharge results for the watershed were used as input to the HEC-RAS to model the water depths and flood route. Using the study area’s LIDAR-based DSM, the flood drainage geometry and inundated zones were generated.
The simulation model was adjusted to fit the dynamics of a dam breach under piping and overtopping failure scenarios and unsteady flow conditions. Simulation involved routing the floodwater through affected downstream areas to uncover the hydraulic conditions in various locations within the Al Wala watershed. Inundation maps were generated from these data using ArcGIS, providing detailed insight into the characteristics of the floodwater in the submerged areas of the watershed. In the case of the Clear Day scenario, the simulations disclosed, in the event of a piping failure, a peak flow of 12,980 m3/s immediately downstream of the dam. Downstream inundation will cover an area of 5.262 km2. However, for the dam break model simulation for unsteady flow conditions using PMF as flow data for piping failure modes, the area will increase to 6.837 km2 in the case of a six-hour storm; 8.518 km2 in the event of a twelve-hour storm; and 9.390 km2 under the condition of a twenty-four-hour storm. On the other hand, in the Clear Day scenario, the simulations disclosed, in the event of overtopping failure, a peak flow of 16,489 m3/s immediately downstream of the dam. Downstream inundation will cover an area of 13.171 km2. However, for the dam break model simulation for unsteady flow conditions using PMF as flow data for overtopping failure modes, the inundated area will be 13.302 km2 in the event of a six-hour storm; 14.249 km2 in the case of a twelve-hour storm; and 14.594 km2 in the event of twenty-four-hour storm. Likewise, the flood depths a few kilometers downstream of the Al Wala Dam, at the Al Wala Valley Park, were simulated. The simulation results show that the maximum flood depth will be 24.48 m in the event of a Clear Day piping failure and that this increases to 25.85 m under the condition of a six-hour storm; 28.31 m in the case of a twelve-hour storm; and 30.77 m in the event of a twenty-four-hour storm. In the event of overtopping failure under the Clear Day scenario, the flood depth will be 32.25 m. This depth will rise to 33.56 m in the event of a six-hour storm; 34.16 m under the condition of a twelve-hour storm; and 34.63 m in the case of a twenty-four-hour storm.
The breach dimensions, peak discharges, and flood wave characteristics (e.g., flow velocities and water depths) were compared. The comparison pointed out that a highly damaging flood wave is possible under both scenarios (Clear Day scenario and PMF scenario) and that the damage increases in the event of an overtopping dam failure. The results of this study are anticipated to inform prevention of flood disasters. Taking into consideration that dam failures can pose a serious risk for downstream communities, the ability of contemporary society to assess the spatial distribution and intensity of this sort of risk remains imperative in the efforts to prevent economic and ecological damages as well as risk to human life in the future.

Author Contributions

Conceptualization, method, and writing: A.A.-F., A.N.M., S.A. and A.K. Formulation, review, and editing: A.A.-F. and A.N.M. Data collection and processing: A.A.-F., A.N.M. and S.A. All authors have read and agreed to the published version of the manuscript.

Funding

This research was funded by the Scientific Research and Innovation Support Fund, the Ministry of Higher Education and Scientific Research, Jordan (WE1/22/2019).

Institutional Review Board Statement

Not applicable.

Informed Consent Statement

Not applicable.

Data Availability Statement

The data that support the findings of this study are available from the corresponding author, A.A, upon reasonable request.

Conflicts of Interest

The funders had no role in the design of the study; collection and analysis of the data; interpretation of the results; writing of the manuscript; or in the decision to publish the results.

References

  1. Tedla, M.; Cho, Y.; Jun, K. Flood Mapping from Dam Break Due to Peak Inflow: A Coupled Rainfall–Runoff and Hydraulic Models Approach. Hydrology 2021, 8, 89. [Google Scholar] [CrossRef]
  2. Bharath, A.; Shivapur, A.V.; Hiremath, C.G.; Maddamsetty, R. Dam Break Analysis Using HEC-RAS and HEC-GeoRAS: A Case Study of Hidkal Dam, Karnataka State, India. Environ. Chall. 2021, 5, 100401. [Google Scholar] [CrossRef]
  3. Kahraman, C.; Kaya, I. Fuzzy Process Capability Indices for Quality Control of Irrigation Water. Stoch. Environ. Res. Risk Assess. 2008, 23, 451–462. [Google Scholar] [CrossRef]
  4. Liman, H.M.; Nwaerema, P.; Yisa, J. Impact of Climate Variability on Reservoir Based Hydro-Power Generation in Jebba Dam, Niger State, Nigeria. Hydro Sci. Mar. Eng. 2021, 3, 2795. [Google Scholar] [CrossRef]
  5. Rashid, M.U.; Abid, I.; Latif, A. Optimization of Hydropower and Related Benefits Through Cascade Reservoirs for Sustainable Economic Growth. Renew. Energy 2022, 185, 241–254. [Google Scholar] [CrossRef]
  6. Derdous, O.; Djemili, L.; Bouchehed, H.; Tachi, S.E. A GIS Based Approach for the Prediction of the Dam Break Flood Hazard—A Case Study of Zardezas Reservoir ‘Skikda, Algeria’. J. Water Land Dev. 2015, 27, 15–20. [Google Scholar] [CrossRef] [Green Version]
  7. Yi, X. A Dam Break Analysis Using HEC-RAS. J. Water Resour. Prot. 2011, 3, 370–379. [Google Scholar] [CrossRef]
  8. Pellicani, R.; Parisi, A.; Iemmolo, G.; Apollonio, C. Economic Risk Evaluation in Urban Flooding and Instability-Prone Areas: The Case Study of San Giovanni Rotondo (Southern Italy). Geosciences 2018, 8, 112. [Google Scholar] [CrossRef] [Green Version]
  9. Hadjerioua, B.; Witt, A.M.; Stewart, K.M.; Acosta, M.B.; Mobley, M. The Economic Benefits of Multipurpose Reservoirs in the United States-Federal Hydropower Fleet; Office of Scientific and Technical Information (OSTI): Oak Ridge, TN, USA, 2015. [CrossRef] [Green Version]
  10. Winarta, B.; Juwono, P.T.; I Ali, M.; I Ramli, N. Dam Break Studies Using Hydrologic and Hydraulics Model for Chereh Dam, Kuantan, Pahang, Malaysia. In IOP Conference Series: Earth and Environmental Science; IOP Publishing: Bristol, UK, 2019; Volume 366, p. 012036. [Google Scholar] [CrossRef]
  11. Rentschler, J.; Salhab, M.; Jafino, B.A. Flood Exposure and Poverty in 188 Countries. Nat. Commun. 2022, 13, 3527. [Google Scholar] [CrossRef]
  12. Hill, K.A.; Lackmann, G.M. The Impact of Future Climate Change on TC Intensity and Structure: A Downscaling Approach. J. Clim. 2011, 24, 4644–4661. [Google Scholar] [CrossRef]
  13. Nassopoulos, H.; Dumas, P.; Hallegatte, S. Adaptation to an Uncertain Climate Change: Cost Benefit Analysis and Robust Decision Making for Dam Dimensioning. Clim. Change 2012, 114, 497–508. [Google Scholar] [CrossRef]
  14. Keller, L.; Rössler, O.; Martius, O.; Weingartner, R. Comparison of Scenario-neutral Approaches for Estimation of Climate Change Impacts on Flood Characteristics. Hydrol. Process. 2018, 33, 535–550. [Google Scholar] [CrossRef]
  15. Mallakpour, I.; AghaKouchak, A.; Sadegh, M. Climate-Induced Changes in the Risk of Hydrological Failure of Major Dams in California. Geophys. Res. Lett. 2019, 46, 2130–2139. [Google Scholar] [CrossRef] [Green Version]
  16. Ministry of Environment [MoE]. The National Climate Change Policy of the Hashemite Kingdom of Jordan 2013–2020. Sector Strategic Guidance Framework. Retrieved from Ministry of Environment, Hashemite Kingdom of Jordan Website. Available online: http://www.moenv.gov.jo/AR/PDFs/Climate%20change%20policy_PDF.pdf (accessed on 26 June 2022).
  17. Kaspersen, P.S.; Halsnæs, K. Integrated Climate Change Risk Assessment: A Practical Application for Urban Flooding During Extreme Precipitation. Clim. Serv. 2017, 6, 55–64. [Google Scholar] [CrossRef] [Green Version]
  18. Freiwan, M.; Kadioglu, M. Spatial and Temporal Analysis of Climatological Data in Jordan. Int. J. Climatol. 2008, 28, 521–535. [Google Scholar] [CrossRef]
  19. Kahana, R.; Ziv, B.; Enzel, Y.; Dayan, U. Synoptic Climatology of Major Floods in the Negev Desert, Israel. Int. J. Climatol. 2002, 22, 867–882. [Google Scholar] [CrossRef]
  20. Diakakis, M.; Priskos, G.; Skordoulis, M. Public Perception of Flood Risk in Flash Flood Prone Areas of Eastern Mediterranean: The Case of Attica Region in Greece. Int. J. Disaster Risk Reduct. 2018, 28, 404–413. [Google Scholar] [CrossRef]
  21. Farhan, Y.; Anbar, A. Fragile Landscape: Impact and Consequences of May 2014 Flash-flood Disaster in the Aqaba Area, Southern Jordan. Res. J. Environ. Earth Sci. 2014, 6, 451–465. [Google Scholar] [CrossRef]
  22. Llasat, M.C. Floods Evolution in the Mediterranean Region in a Context of Climate and Environmental Change. Cuad. De Investig. Geográfica 2021, 47, 13–32. [Google Scholar] [CrossRef]
  23. Ocakoglu, F.; Gokceoglu, C.; Ercanoglu, M. Dynamics of a Complex Mass Movement Triggered by Heavy Rainfall: A Case Study from NW Turkey. Geomorphology 2002, 42, 329–341. [Google Scholar] [CrossRef]
  24. Shmilovitz, Y.; Morin, E.; Rinat, Y.; Haviv, I.; Carmi, G.; Mushkin, A.; Enzel, Y. Linking Frequency of Rainstorms, Runoff Generation and Sediment Transport Across Hyperarid Talus-pediment Slopes. Earth Surf. Process. Landf. 2020, 45, 1644–1659. [Google Scholar] [CrossRef]
  25. Malone, R.W.; Yagow, G.; Baffaut, C.; Gitau, M.W.; Qi, Z.; Amatya, D.M.; Parajuli, P.B.; Bonta, J.V.; Green, T.R. Parameterization guidelines and considerations for hydrologic models. Trans. ASABE 2015, 58, 1681–1703. [Google Scholar] [CrossRef] [Green Version]
  26. Yue, S.; Ouarda, T.B.M.J.; Bobée, B.; Legendre, P.; Bruneau, P. Approach for Describing Statistical Properties of Flood Hydrograph. J. Hydrol. Eng. 2002, 7, 147–153. [Google Scholar] [CrossRef]
  27. Wijayarathne, D.; Coulibaly, P.; Boodoo, S.; Sills, D. Evaluation of Radar-Gauge Merging Techniques to Be Used in Operational Flood Forecasting in Urban Watersheds. Water 2020, 12, 1494. [Google Scholar] [CrossRef]
  28. Hrachowitz, M.; Savenije, H.H.G.; Bloschl, G.; Mcdonnell, J.J.; Sivapalan, M.; Pomeroy, J.W.; Arheimer, B.; Blume, T.; Clark, M.P.; Ehret, U.; et al. A Decade of Predictions in Ungauged Basins (PUB)—A Review. Hydrol. Sci. J. 2013, 58, 1198–1255. [Google Scholar] [CrossRef]
  29. Singh, S.K.; Marcy, N. Comparison of Simple and Complex Hydrological Models for Predicting Catchment Discharge Under Climate Change. AIMS Geosci. 2017, 3, 467–497. [Google Scholar] [CrossRef]
  30. Cornelissen, T.; Diekkrüger, B.; Giertz, S. A Comparison of Hydrological Models for Assessing the Impact of Land Use and Climate Change on Discharge in a Tropical Catchment. J. Hydrol. 2013, 498, 221–236. [Google Scholar] [CrossRef]
  31. Nash, J.E.; Sutcliffe, J.V. River Flow Forecasting Through Conceptual Models Part I—A Discussion of Principles. J. Hydrol. 1970, 10, 282–290. [Google Scholar] [CrossRef]
  32. Girard, C.; Rinaudo, J.-D.; Pulido-Velazquez, M.; Caballero, Y. An Interdisciplinary Modelling Framework for Selecting Adaptation Measures at the River Basin Scale in a Global Change Scenario. Environ. Model. Softw. 2015, 69, 42–54. [Google Scholar] [CrossRef] [Green Version]
  33. Vieux, B.E.; Gauer, N. Finite-Element Modeling of Storm Water Runoff Using GRASS GIS. Comput.-Aided Civ. Infrastruct. Eng. 1994, 9, 263–270. [Google Scholar] [CrossRef]
  34. Quinn, P.; Beven, K.; Chevallier, P.; Planchon, O. The Prediction of Hillslope Flow Paths for Distributed Hydrological Modelling Using Digital Terrain Models. Hydrol. Process. 1991, 5, 59–79. [Google Scholar] [CrossRef]
  35. Tarboton, D.G. A New Method for the Determination of Flow Directions and Upslope Areas in Grid Digital Elevation Models. Water Resour. Res. 1997, 33, 309–319. [Google Scholar] [CrossRef] [Green Version]
  36. Abbott, M.B.; Bathurst, J.C.; Cunge, J.A.; O’Connell, P.E.; Rasmussen, J. An Introduction to the European Hydrological System—Systeme Hydrologique Europeen, ‘SHE’, 2: Structure of a Physically-based, Distributed Modelling System. J. Hydrol. 1986, 87, 61–77. [Google Scholar] [CrossRef]
  37. Aliye, M.A.; Aga, A.O.; Tadesse, T.; Yohannes, P. Evaluating the Performance of HEC-HMS and SWAT Hydrological Models in Simulating the Rainfall-Runoff Process for Data Scarce Region of Ethiopian Rift Valley Lake Basin. Open J. Mod. Hydrol. 2020, 10, 105–122. [Google Scholar] [CrossRef]
  38. Saade, J.; Atieh, M.; Ghanimeh, S.; Golmohammadi, G. Modeling Impact of Climate Change on Surface Water Availability Using SWAT Model in a Semi-Arid Basin: Case Kalb River Lebanon. Hydrology 2021, 8, 134. [Google Scholar] [CrossRef]
  39. Beven, K.J.; Freer, J. A Dynamic TOPMODEL. Hydrol. Process. 2001, 15, 1993–2011. [Google Scholar] [CrossRef]
  40. Xie, H.; Shen, Z.; Chen, L.; Lai, X.; Qiu, J.; Wei, G.; Dong, J.; Peng, Y.; Chen, X. Parameter Estimation and Uncertainty Analysis: A Comparison Between Continuous and Event-Based Modeling of Streamflow Based on the Hydrological Simulation Program–Fortran (HSPF) Model. Water 2019, 11, 171. [Google Scholar] [CrossRef] [Green Version]
  41. Castro, C.V.; Maidment, D.R. GIS Preprocessing for Rapid Initialization of HEC-HMS Hydrological Basin Models Using Web-based Data Services. Environ. Model. Softw. 2020, 130, 104732. [Google Scholar] [CrossRef]
  42. Martina, M.; Todini, E.; Liu, Z. Preserving the Dominant Physical Processes in a Lumped Hydrological Model. J. Hydrol. 2011, 399, 121–131. [Google Scholar] [CrossRef]
  43. Betrie, G.D.; Van Griensven, A.; Mohamed, Y.A.; Popescu, I.; Mynett, A.E.; Hummel, S. Linking SWAT and SOBEK Using Open Modeling Interface (OpenMI) for Sediment Transport Simulation in the Blue Nile River Basin. Trans. ASABE 2011, 54, 1749–1757. [Google Scholar] [CrossRef]
  44. Lian, Y.; Chan, I.-C.; Singh, J.; Demissie, M.; Knapp, V.; Xie, H. Coupling of Hydrologic and Hydraulic Models for the Illinois River Basin. J. Hydrol. 2007, 344, 210–222. [Google Scholar] [CrossRef]
  45. Tahmasbine, H.; Feyzolahpo, M.; Mumipour, M.; Zakerhosei, F. Rainfall-runoff Simulation and Modeling of Karun River Using HEC-RAS and HEC-HMS Models, Izeh District, Iran. J. Appl. Sci. 2012, 12, 1900–1908. [Google Scholar] [CrossRef] [Green Version]
  46. Weaver, A.C. Reanalysis of Flood of Record Using HEC-2, HEC-RAS, and USGS Gauge Data. J. Hydrol. Eng. 2016, 21, 05016011. [Google Scholar] [CrossRef]
  47. Olasunkanmi, A.; Dan’Azumi, S. Flood Inundation and Hazard Mapping of River Zungur Watershed Using GIS and HEC-RAS Models. Niger. J. Technol. 2018, 37, 1162. [Google Scholar] [CrossRef]
  48. USGS. Shuttle Radar Topography Mission. Available online: https://earthexplorer.usgs.gov (accessed on 26 November 2021).
  49. Al-Fugara, A. Comparison and Validation of the Recent Freely Available DEMs Over Parts of the Earth’s Lowest Elevation Area: Dead Sea, Jordan. Int. J. Geosci. 2015, 6, 1221–1232. [Google Scholar] [CrossRef] [Green Version]
  50. Annis, A.; Nardi, F.; Petroselli, A.; Apollonio, C.; Arcangeletti, E.; Tauro, F.; Belli, C.; Bianconi, R.; Grimaldi, S. UAV-DEMs for Small-Scale Flood Hazard Mapping. Water 2020, 12, 1717. [Google Scholar] [CrossRef]
  51. Silva-Coira, F.; Paramá, J.R.; Ladra, S.; López, J.R.; Gutiérrez, G. Efficient Processing of Raster and Vector Data. PLoS ONE 2020, 15, e0226943. [Google Scholar] [CrossRef]
  52. Stoleriu, C.C.; Urzica, A.; Mihu-Pintilie, A. Improving Flood Risk Map Accuracy Using High-density LiDAR Data and the HEC-RAS River Analysis System: A Case Study from North-eastern Romania. J. Flood Risk Manag. 2019, 13, e12572. [Google Scholar] [CrossRef]
  53. Al-Shalabi, M.; Billa, L.; Pradhan, B.; Mansor, S.; Al-Sharif, A.A.A. Modelling Urban Growth Evolution and Land-use Changes Using GIS Based Cellular Automata and SLEUTH Models: The Case of Sana’a Metropolitan City, Yemen. Environ. Earth Sci. 2012, 70, 425–437. [Google Scholar] [CrossRef]
  54. Al-Bakri, J.T.; Salahat, M.; Suleiman, A.; Suifan, M.; Hamdan, M.R.; Khresat, S.; Kandakji, T. Impact of Climate and Land Use Changes on Water and Food Security in Jordan: Implications for Transcending, The Tragedy of the Commons. Sustainability 2013, 5, 724–748. [Google Scholar] [CrossRef] [Green Version]
  55. SCS. Urban Hydrology for Small Watersheds; Technical Release No. 55; Soil Conservation Service, USDA: Washington, DC, USA, 1986.
  56. Wanielista, M.P. Hydrology and Water Quality Control; John Wiley & Sons: Hoboken, NJ, USA, 1990. [Google Scholar]
  57. Chow, V.T.; Maidment, D.R.; Mays, L.W. Applied Hydrology; McGraw-Hill International Editions: Singapore, 1988; p. 572. [Google Scholar]
  58. Brunner, G. HEC-RAS River Analysis System: Hydraulic Reference Manual, Version 5.0. US Army Corps of Engineers–Hydrologic Engineering Center. 2016, pp. 1–538. Available online: http://www.hec.usace.army.mil/software/hec-ras/documentation/HEC-RAS%205.0%20Reference%20Manual.pdf (accessed on 14 June 2020).
  59. Abushandi, E.; Merkel, B. Modelling Rainfall Runoff Relations Using HEC-HMS and IHACRES for a Single Rain Event in an Arid Region of Jordan. Water Resour. Manag. 2013, 27, 2391–2409. [Google Scholar] [CrossRef]
  60. Howard; Humphreys. Dams on Wadiwala and Wadimujib; Final Report; Minister of Water and Irrigation, Jordan Valley Authority: Amman, Jordan, 1992.
  61. Consulting Engineering Center (CEC)—Sajdi & Partners. Rainfall-Intensity-Duration-Frequency Relationship Manual (IDF Curves) for Jordan; Report; Consulting Engineering Center: Amman, Jordan, 2011. [Google Scholar]
  62. Khatri, H.B.; Jain, M.K.; Jain, S.K. Modelling of Streamflow in Snow Dominated Budhigandaki Catchment in Nepal. J. Earth Syst. Sci. 2018, 127, 100. [Google Scholar] [CrossRef] [Green Version]
  63. Scharfenberg, W.A.; Fleming, M.J. Hydrologic Modeling System HEC-HMS User’s Manual Version 3.5; USACE, Hydrologic Engineering Center: Davis, CA, USA, 2010; p. 318. Available online: https://www.hec.usace.army.mil/software/hec-hms/documentation/HEC-HMS_Users_Manual_3.5.pdf (accessed on 20 June 2020).
  64. Mishra, S.K.; Singh, V.P. Long-term Hydrological Simulation Based on the Soil Conservation Service Curve Number. Hydrol. Process. 2004, 18, 1291–1313. [Google Scholar] [CrossRef]
  65. Giandotti, M. Previsione Delle Piene e Delle, Magre dei Corsi D’acqua; Istituto Poligrafico dello Stato: Rome, Italy, 1934; pp. 107–117. [Google Scholar]
  66. Froehlich, D.C. Embankment Dam Breach Parameters and Their Uncertainties. J. Hydraul. Eng. 2008, 134, 1708–1721. [Google Scholar] [CrossRef]
  67. Cannata, M.; Marzocchi, R. Two-dimensional Dam Break Flooding Simulation: A GIS-embedded Approach. Nat. Hazards 2011, 61, 1143–1159. [Google Scholar] [CrossRef]
  68. USACE HEC-RAS. HEC-RAS River Analysis System, 2D Modeling User’s Manual Version 5.0; US Army Corps of Engineers California USA: Davis, CA, USA, 2016.
  69. Albu, L.-M.; Enea, A.; Iosub, M.; Breabăn, I.-G. Dam Breach Size Comparison for Flood Simulations. A HEC-RAS Based, GIS Approach for Drăcșani Lake, Sitna River, Romania. Water 2020, 12, 1090. [Google Scholar] [CrossRef]
  70. Pilotti, M.; Pilotti, M.; Milanesi, L.; Milanesi, L.; Bacchi, V.; Bacchi, V.; Tomirotti, M.; Tomirotti, M.; Maranzoni, A.; Maranzoni, A. Dam-Break Wave Propagation in Alpine Valley with HEC-RAS 2D: Experimental Cancano Test Case. J. Hydraul. Eng. 2020, 146, 05020003. [Google Scholar] [CrossRef]
Figure 1. Study area location.
Sustainability 15 01758 g001
Figure 2. The study method.
Sustainability 15 01758 g002
Figure 3. Digital Terrain Model based on SRTM image.
Sustainability 15 01758 g003
Figure 4. Lidar-based Digital Terrain Model and the floodplain of the Al Wala Dam.
Sustainability 15 01758 g004
Figure 5. Land use classification in the Al Wala watershed.
Sustainability 15 01758 g005
Figure 6. Soil classification map (hydrological group map) of the Al Wala watershed.
Sustainability 15 01758 g006
Figure 7. Curve number grid map for the study area.
Sustainability 15 01758 g007
Figure 8. Cross-section sketch for water rise in the Al Wala Dam.
Sustainability 15 01758 g008
Figure 9. The model generated by HEC-HMS for the Al Wala watershed.
Sustainability 15 01758 g009
Figure 10. Simulated and observed daily runoff and the observed hyetograph in the Al Wala watershed.
Sustainability 15 01758 g010
Figure 11. Scatter plots of the observed and simulated monthly discharges for the calibration and validation periods.
Sustainability 15 01758 g011
Figure 12. Simulated Hydrographs of Inflow of the Al Wala Watershed routing over the 100-year Return Period with 6, 12, and 24 h storm durations.
Sustainability 15 01758 g012
Figure 13. Outflow hydrographs after dam break for both Overtopping and Pipping Dam breach.
Sustainability 15 01758 g013
Figure 14. Map of the flooded areas associated with the Clear Day scenario of the two types of dam breaches: overtopping and piping.
Sustainability 15 01758 g014
Figure 15. Map of the flooded areas associated with the two types of dam breaches.
Sustainability 15 01758 g015
Figure 16. Map of the flood hazard associated with the piping failure breach.
Sustainability 15 01758 g016
Figure 17. Map of the flooded areas associated with the dam overtopping breach.
Sustainability 15 01758 g017
Table 1. The rainfall rates recorded at five gauge sites.
Station (ID)One-Hundred-Year Rainfall Intensity Records (mm/h)
Six-Hour StormTwelve-Hour Storm Twenty-Four-Hour Storm
AN039.967.765.35
CD0685.34.61
CD079.566.684.79
CD085.633.692.84
CD154.783.251.74
Table 2. Description of the Al Wala Dam.
CharacteristicDescription
LocationMadaba Governorate
River/WadiWadi Wala
Dam typeRCC and earth fill
Height45 m
Length at crest480 m
Width at crest9 m
Body volume25 MCM Fill
Bottom outlet type and diameter2 m × 2 m, steel lined, guard and operation gates
Invert of bottom outlet485.4 m amsl
Discharge at FSL50 m3/s
Draw-off intake levelsLower at El 495, upper at El 505
Crest level524 m amsl
Full reservoir level520 m amsl
Stilling basin level476.6 m amsl
Table 3. Simulated Peak Discharges in the Al Wala Dam over the Return Period.
Storm Event Duration (Hours)Simulated Peak Discharge (m3/s)Time to Peak
(Hours)
6349.213.44
12438.416.45
24588.923.15
Table 4. Dam Break Parameters.
ParametersFailure Mode
PipingOvertopping
Center Station6060
Final Bottom Width (m)1010
Final Bottom Elevation (m)513.9513.9
Left Side Slope 33
Right Side Slope33
Breach Weir Coefficient 1.441.44
Breach Formation Time (hrs.)0.50.5
Piping Coefficient0.55NA
Initial Piping Elevation 530NA
Peak Flow (CMS)16,48912,980
Disclaimer/Publisher’s Note: The statements, opinions and data contained in all publications are solely those of the individual author(s) and contributor(s) and not of MDPI and/or the editor(s). MDPI and/or the editor(s) disclaim responsibility for any injury to people or property resulting from any ideas, methods, instructions or products referred to in the content.

