
COVID-19 Pandemic Development in Jordan—Short-Term and Long-Term Forecasting

 , , , and
Abstract
:1. Introduction
2. Materials and Methods
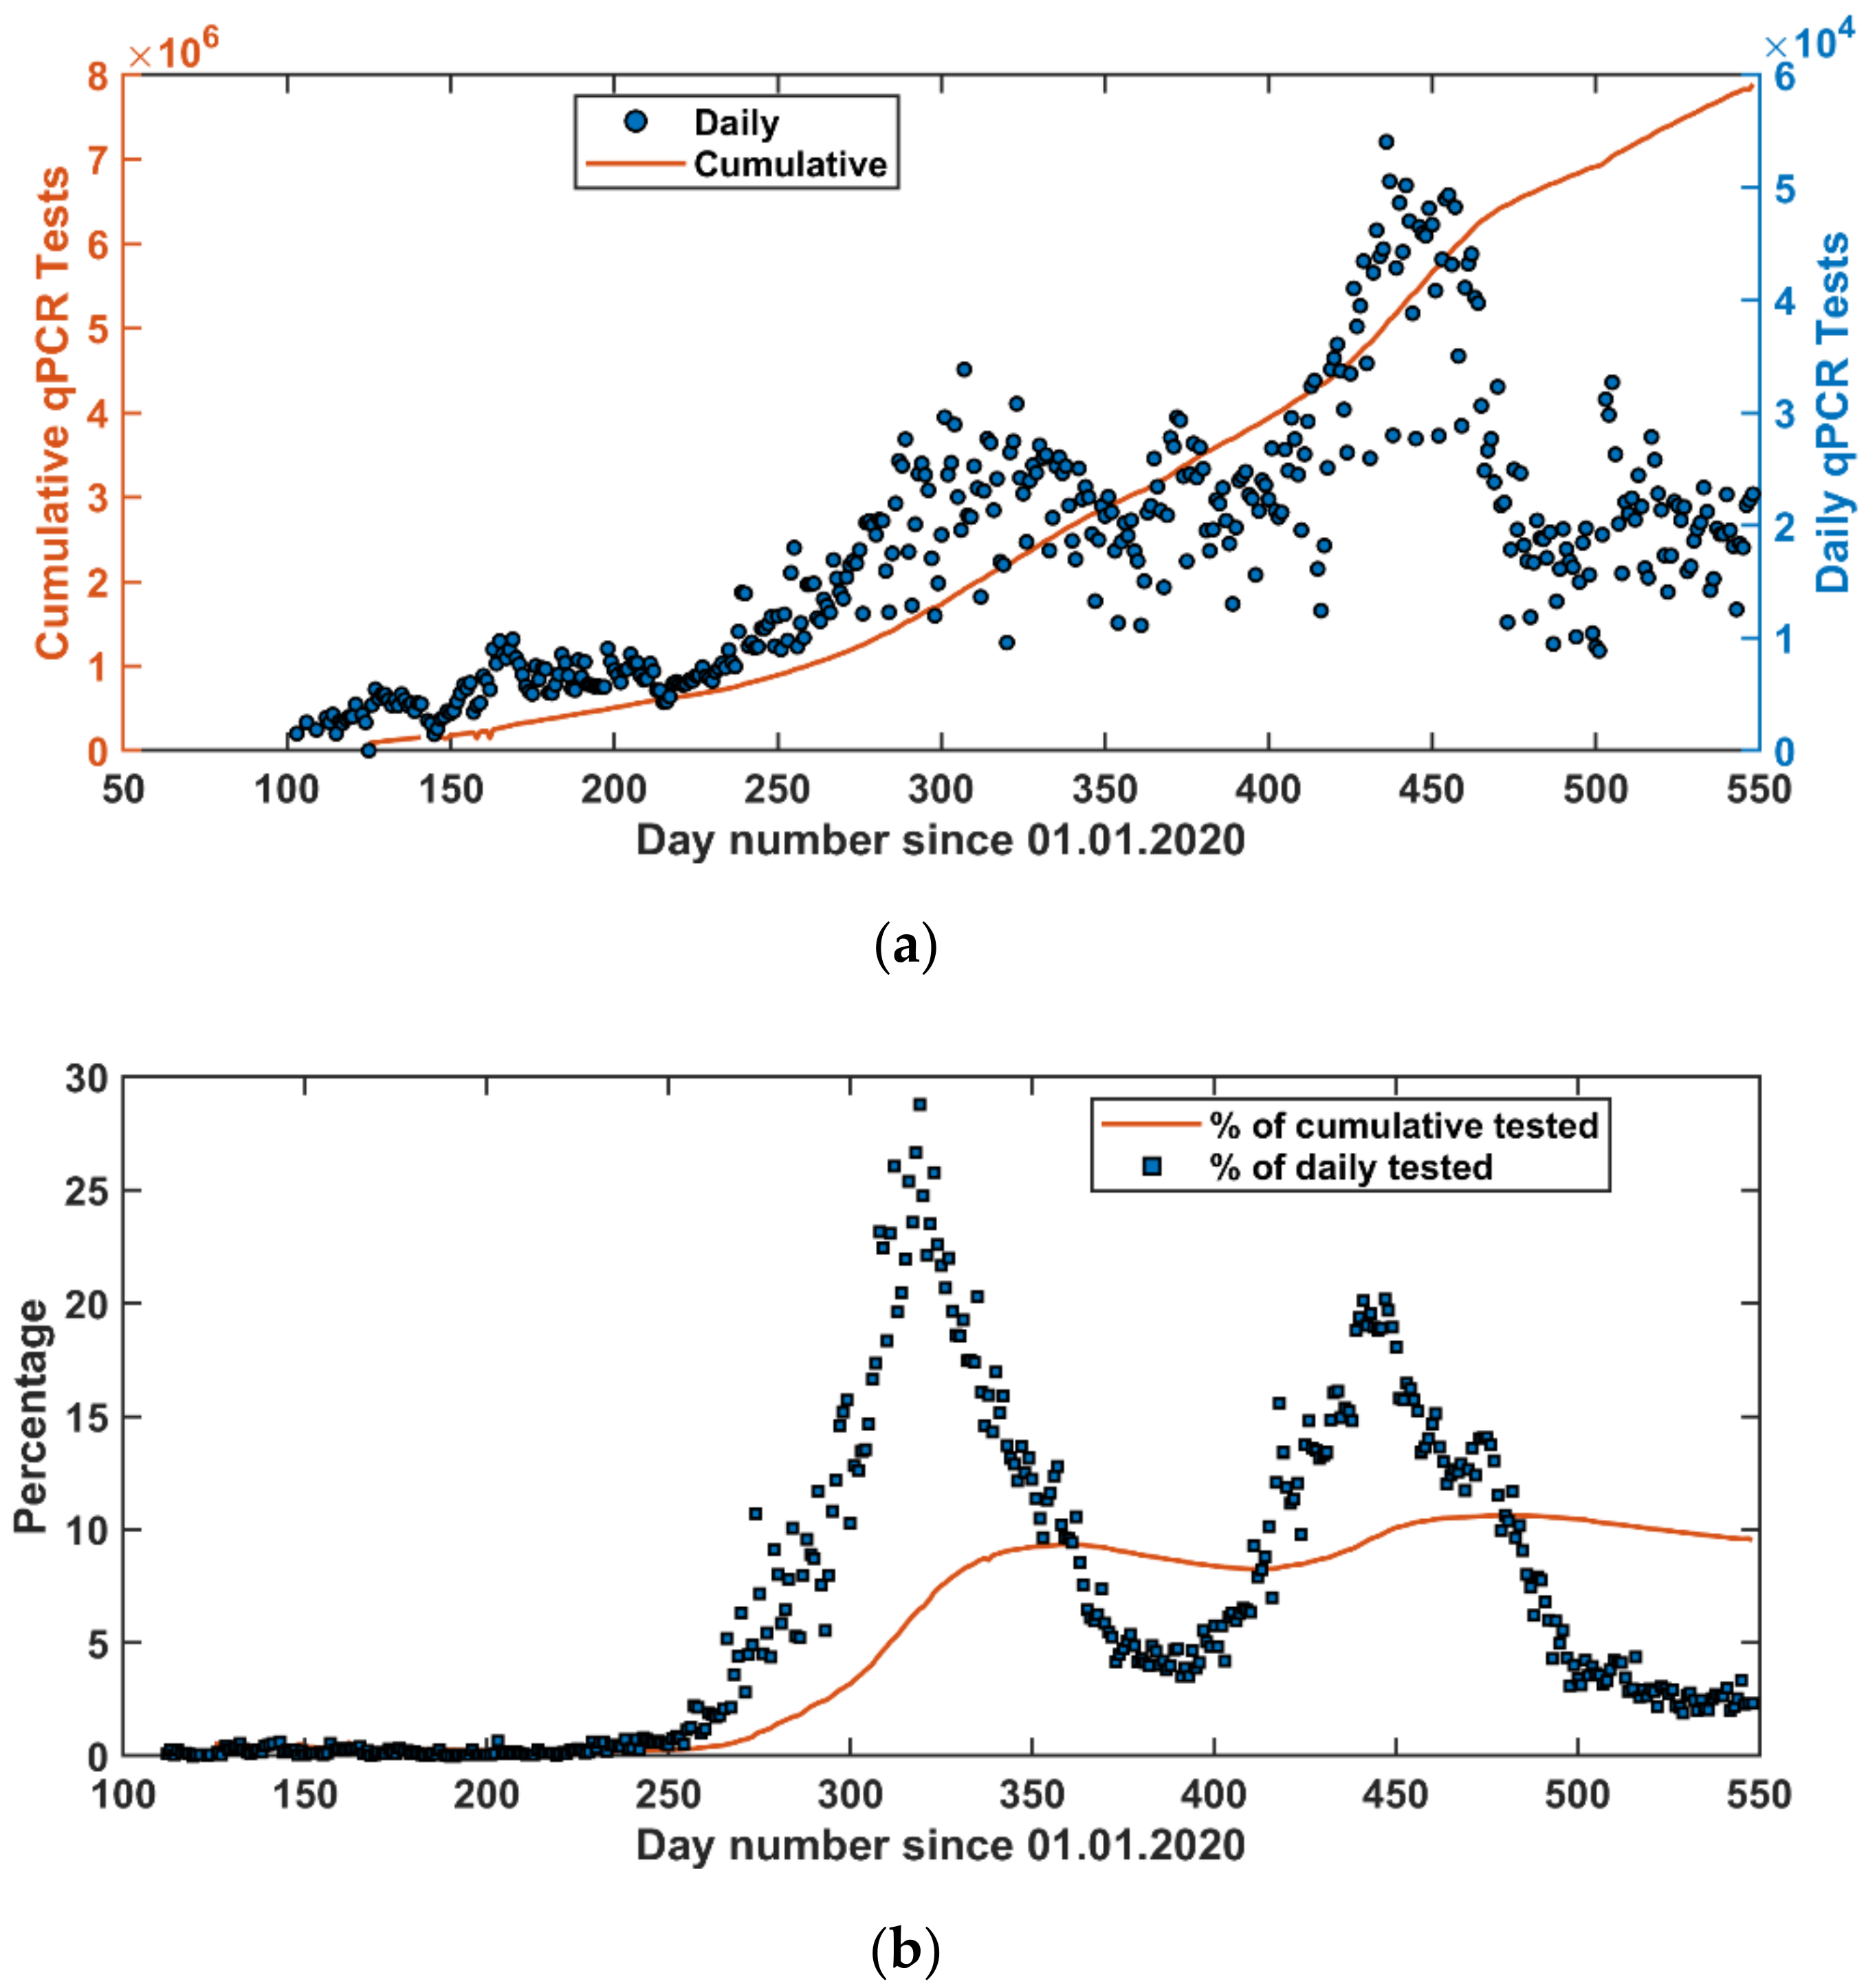
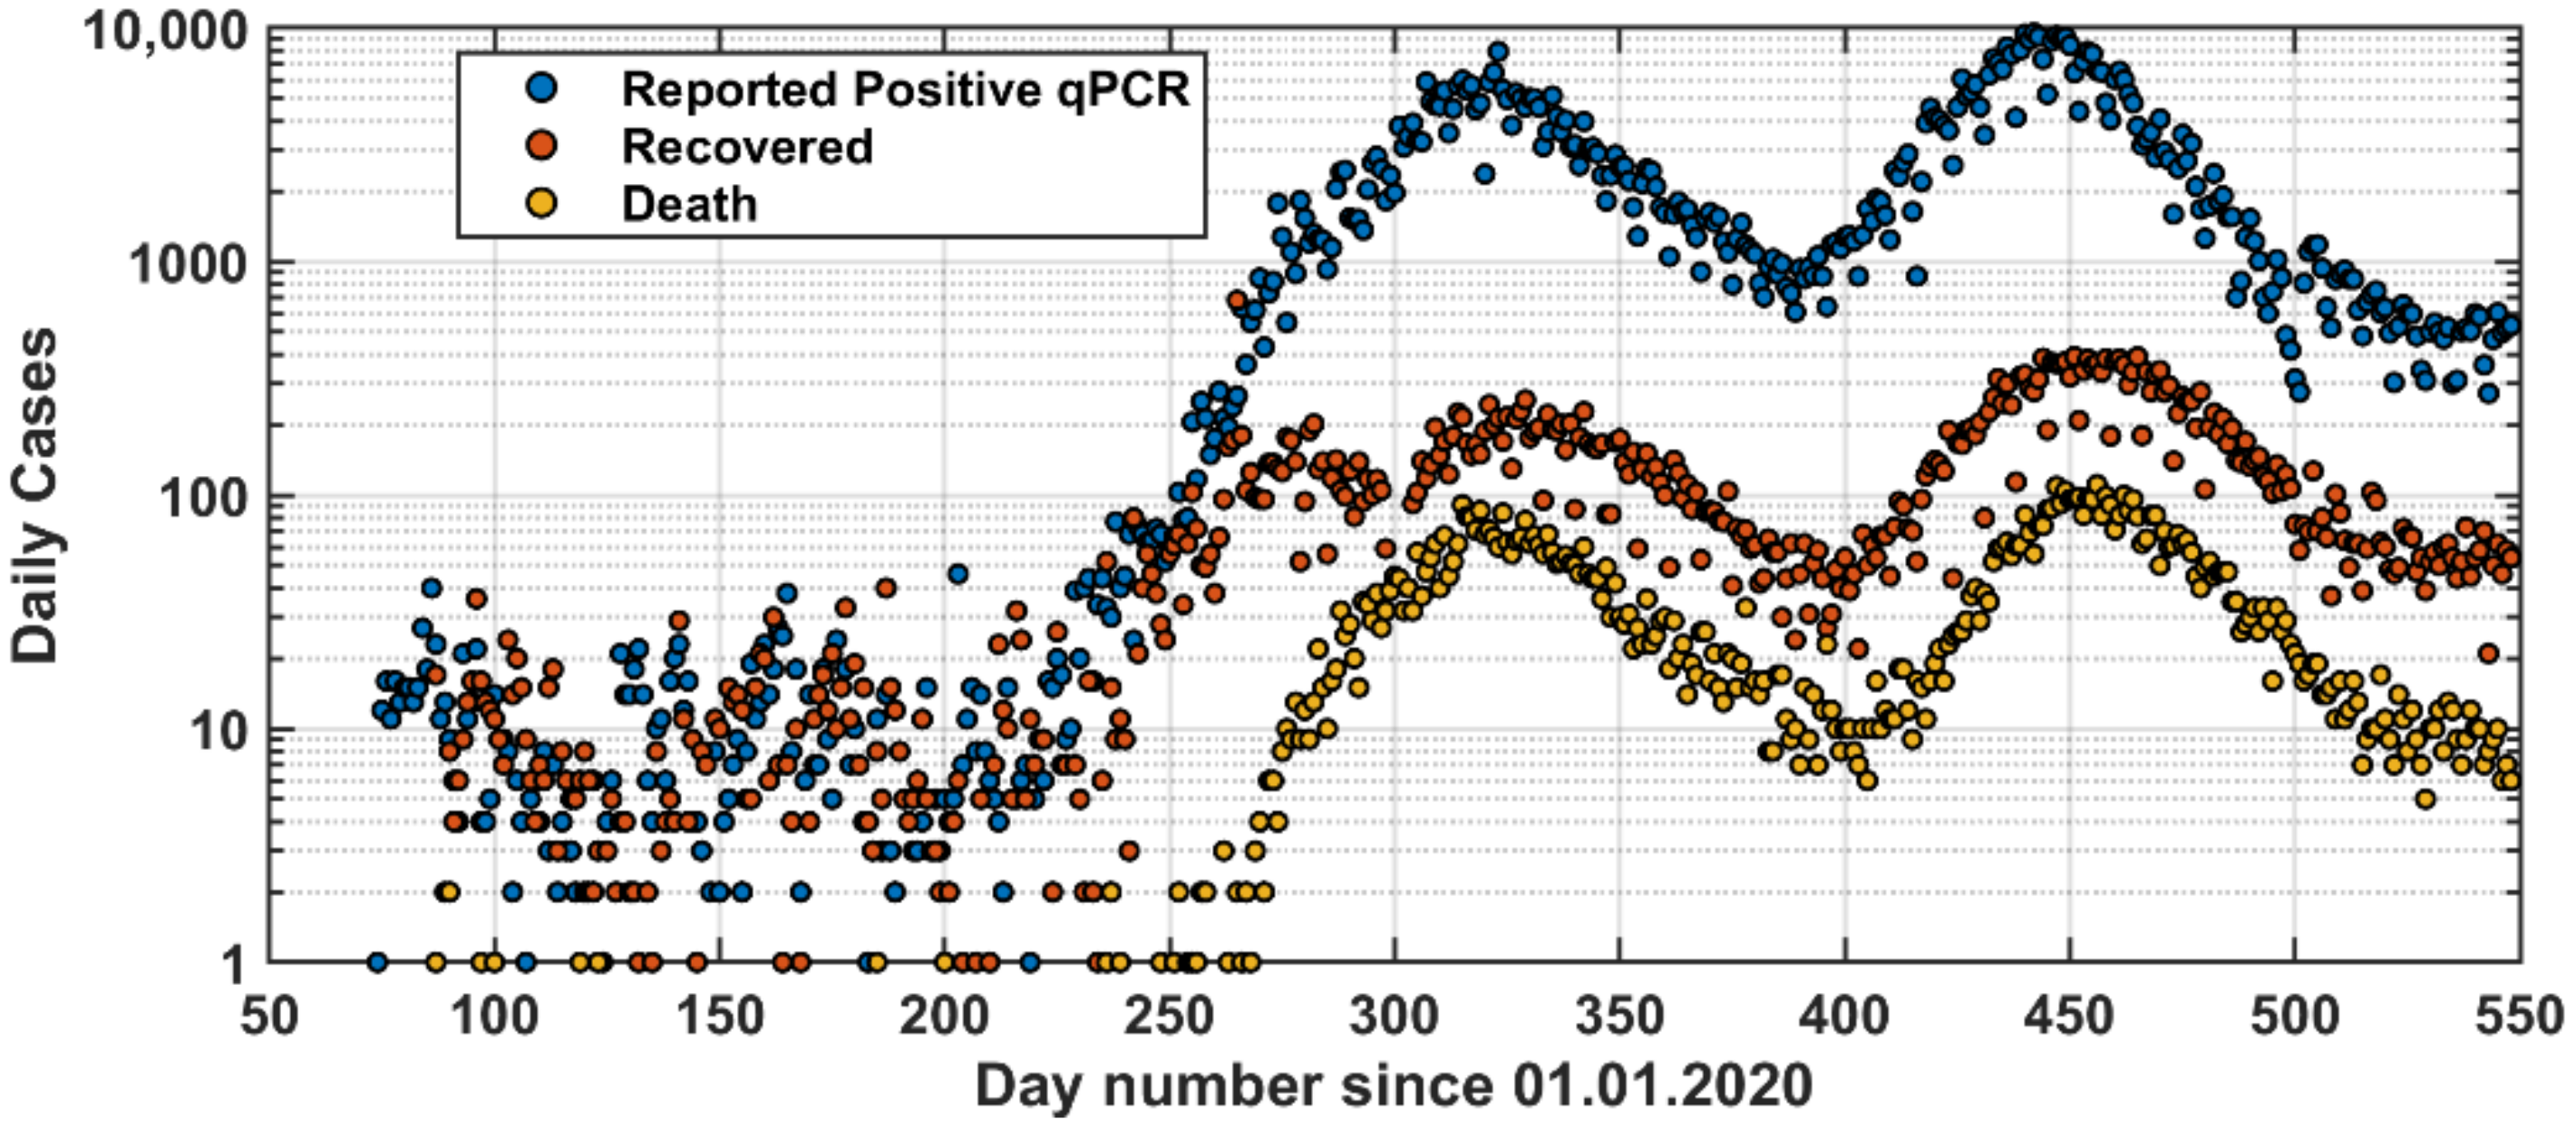
2.1. COVID-19 Data
2.2. Forecast Models for the Postive qPCR Tests
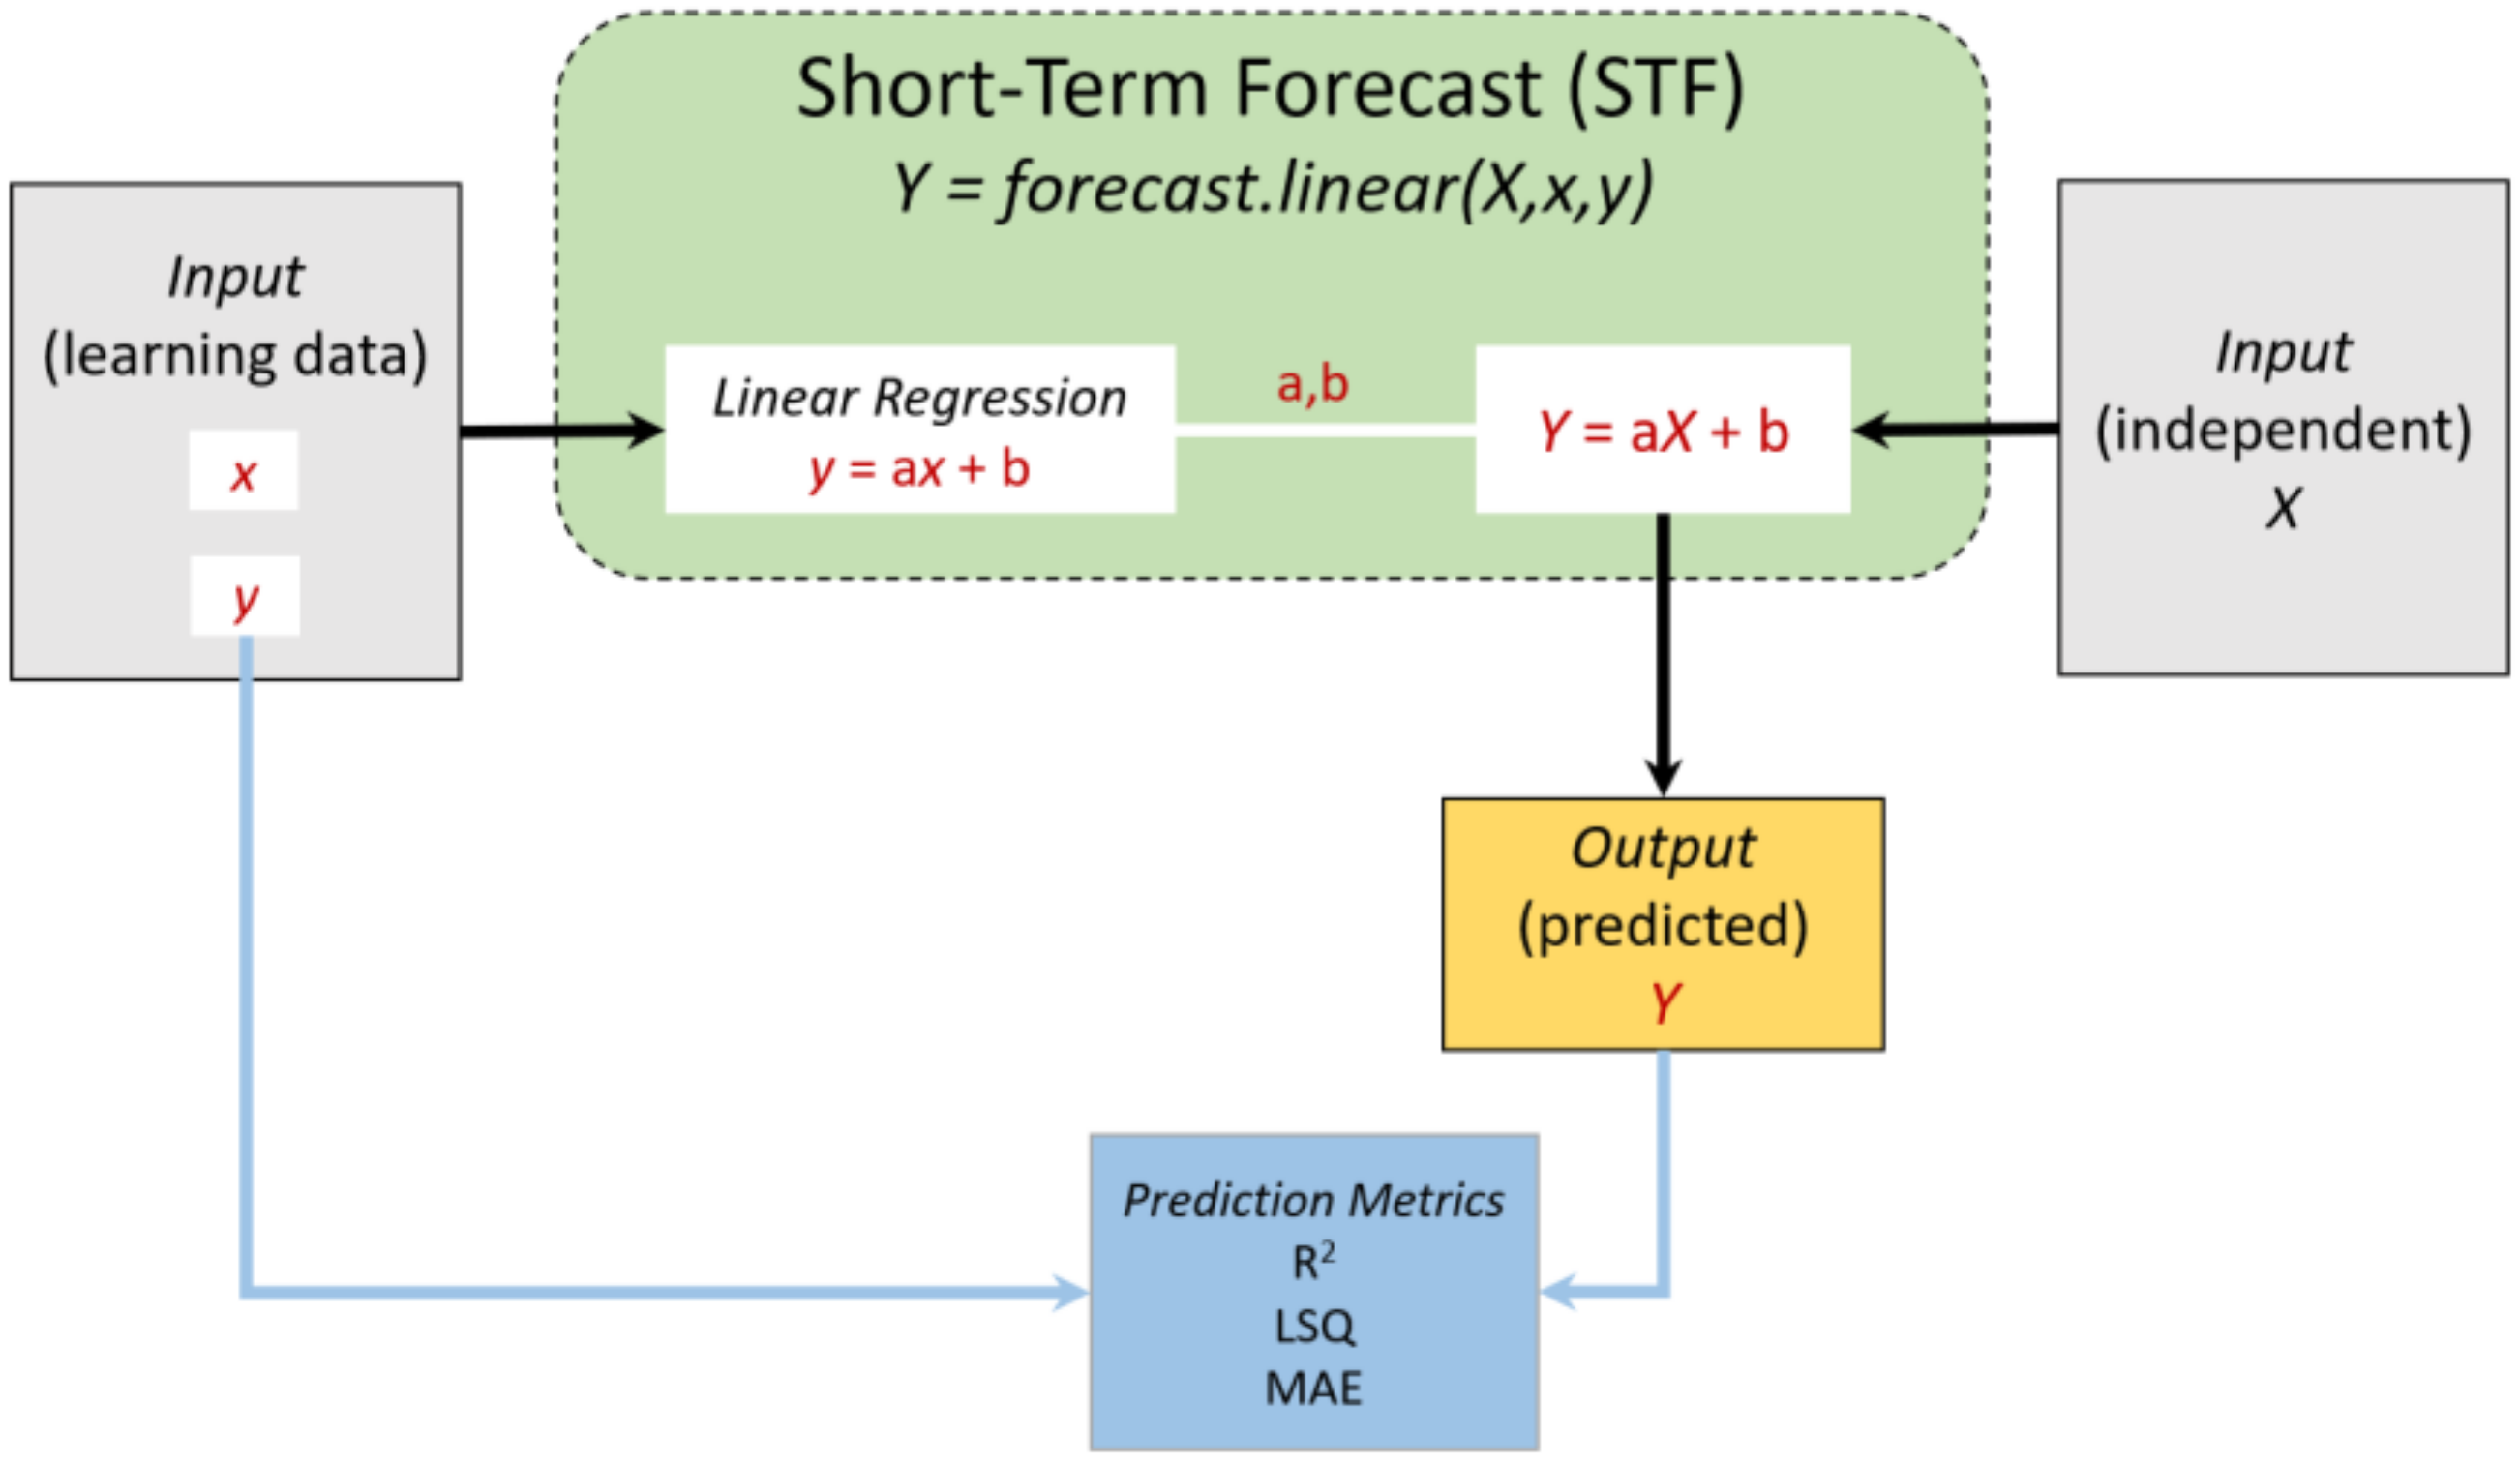
2.2.1. Short-Term Forecast (STF) Model
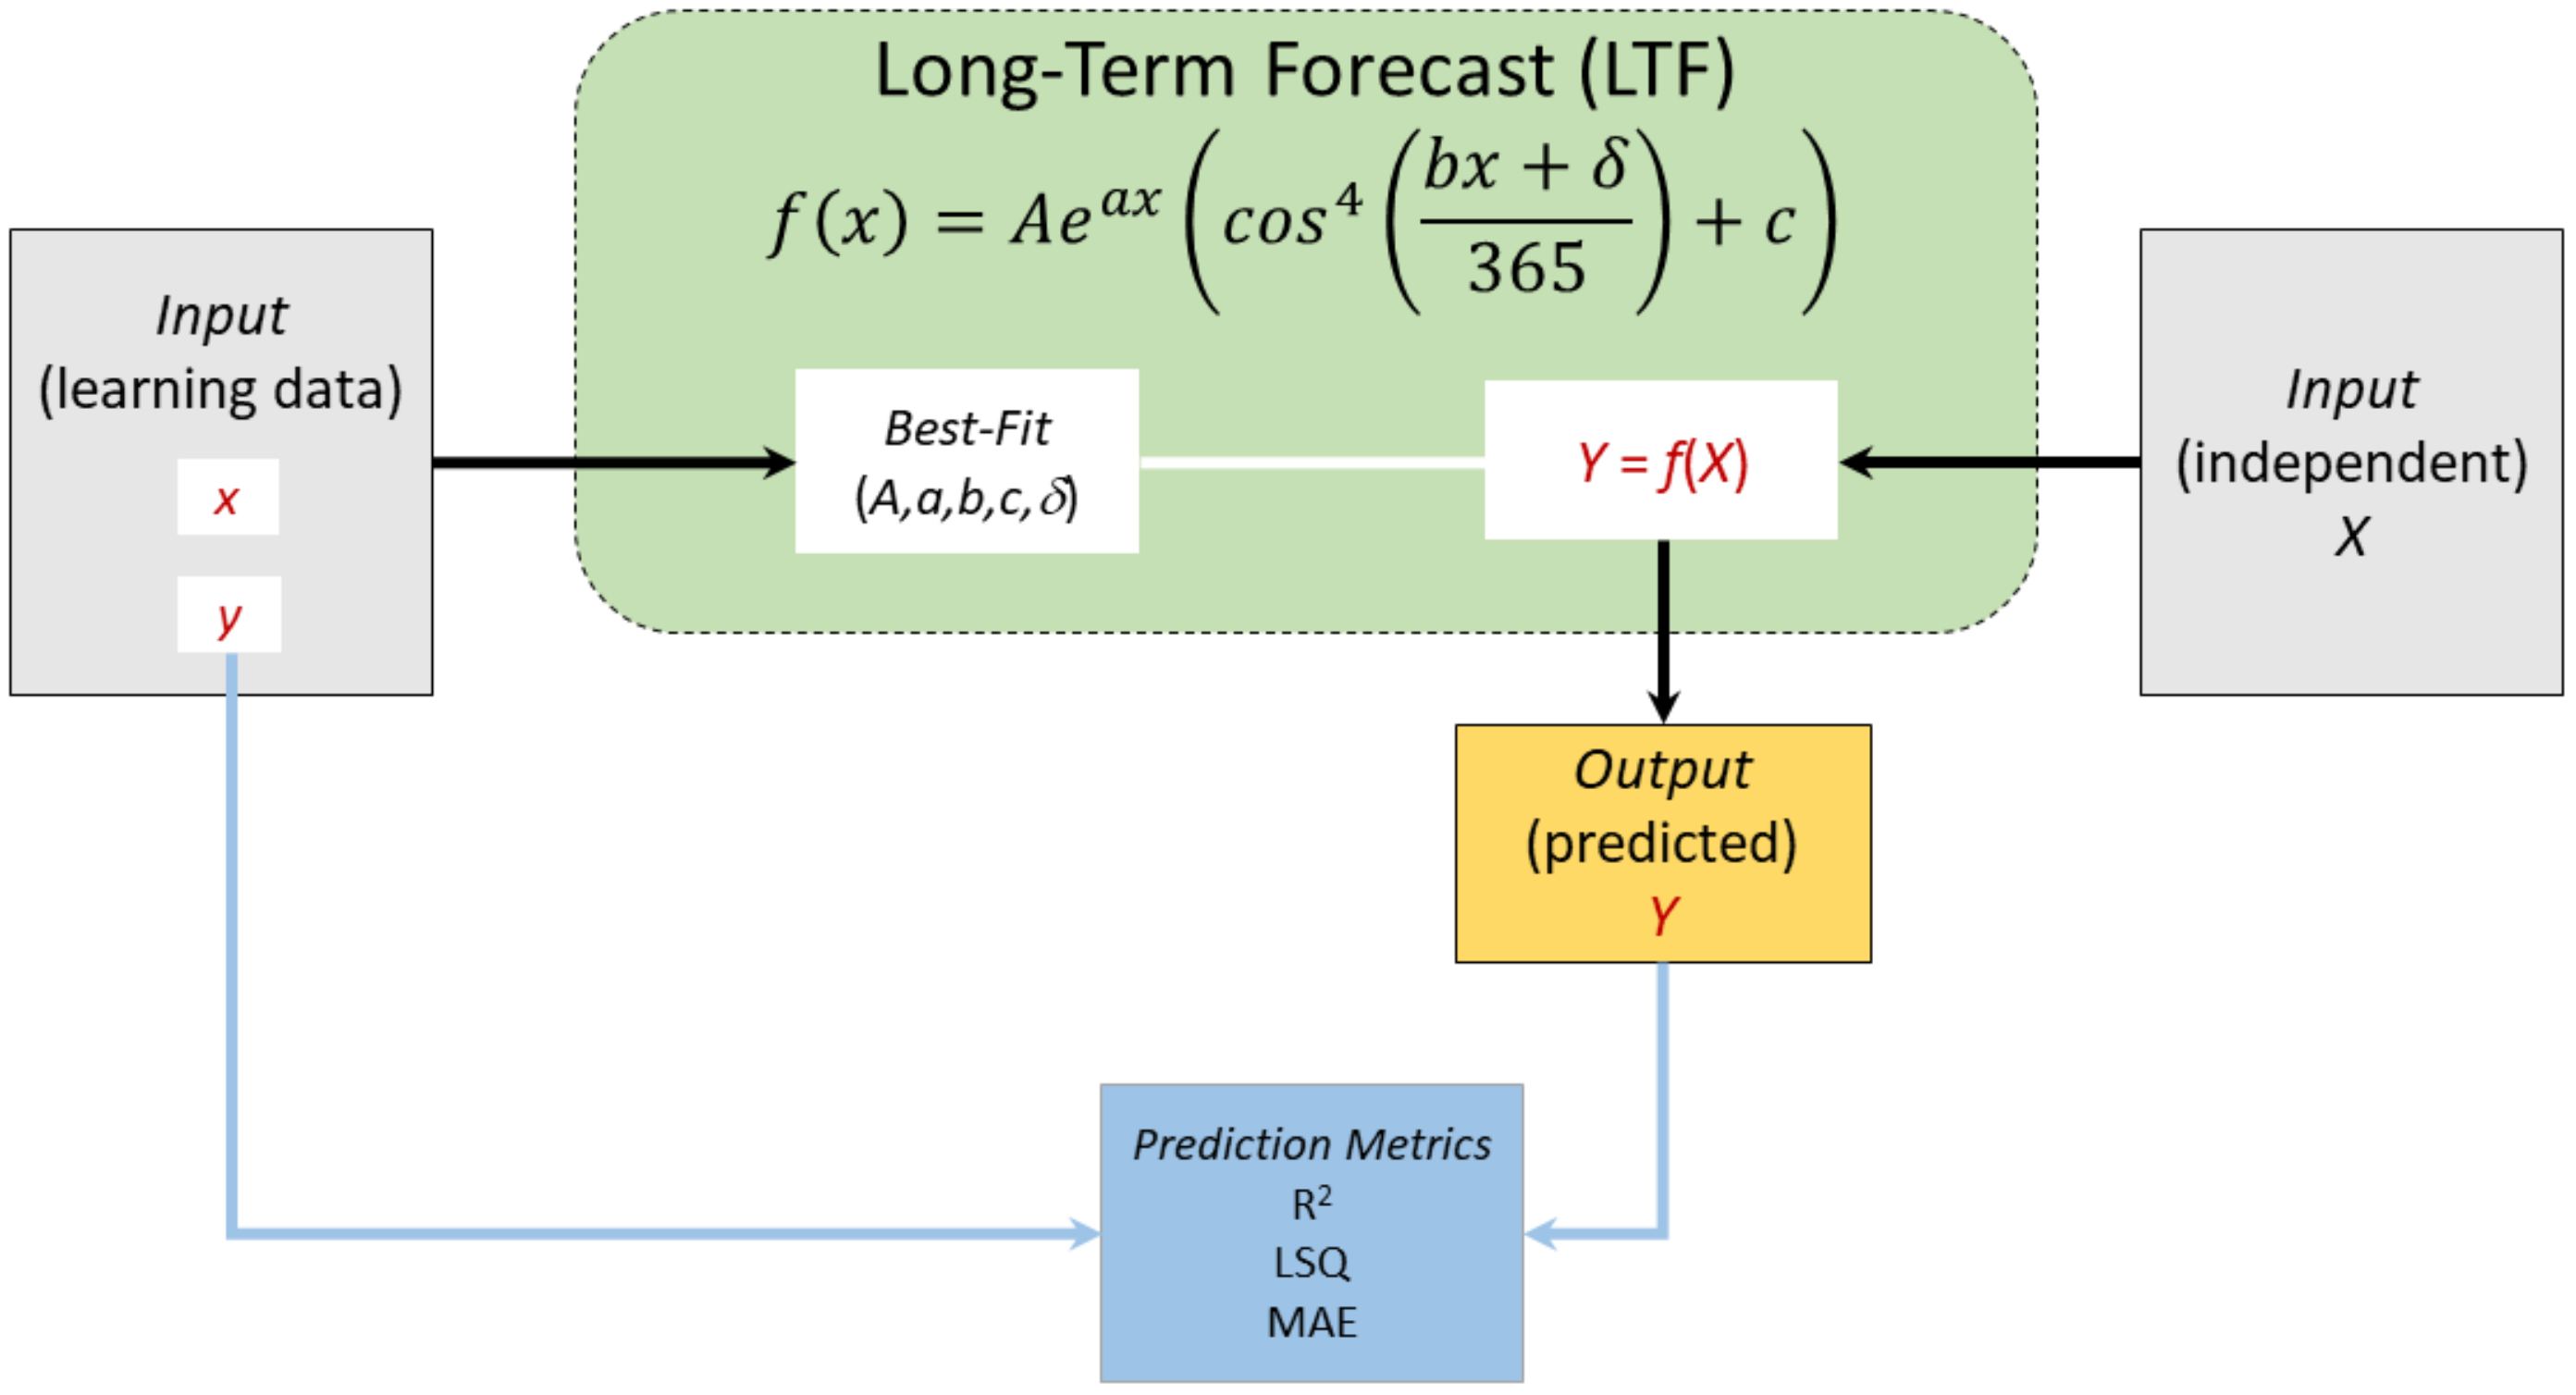
2.2.2. Long-Term Forecast (LTF) Model
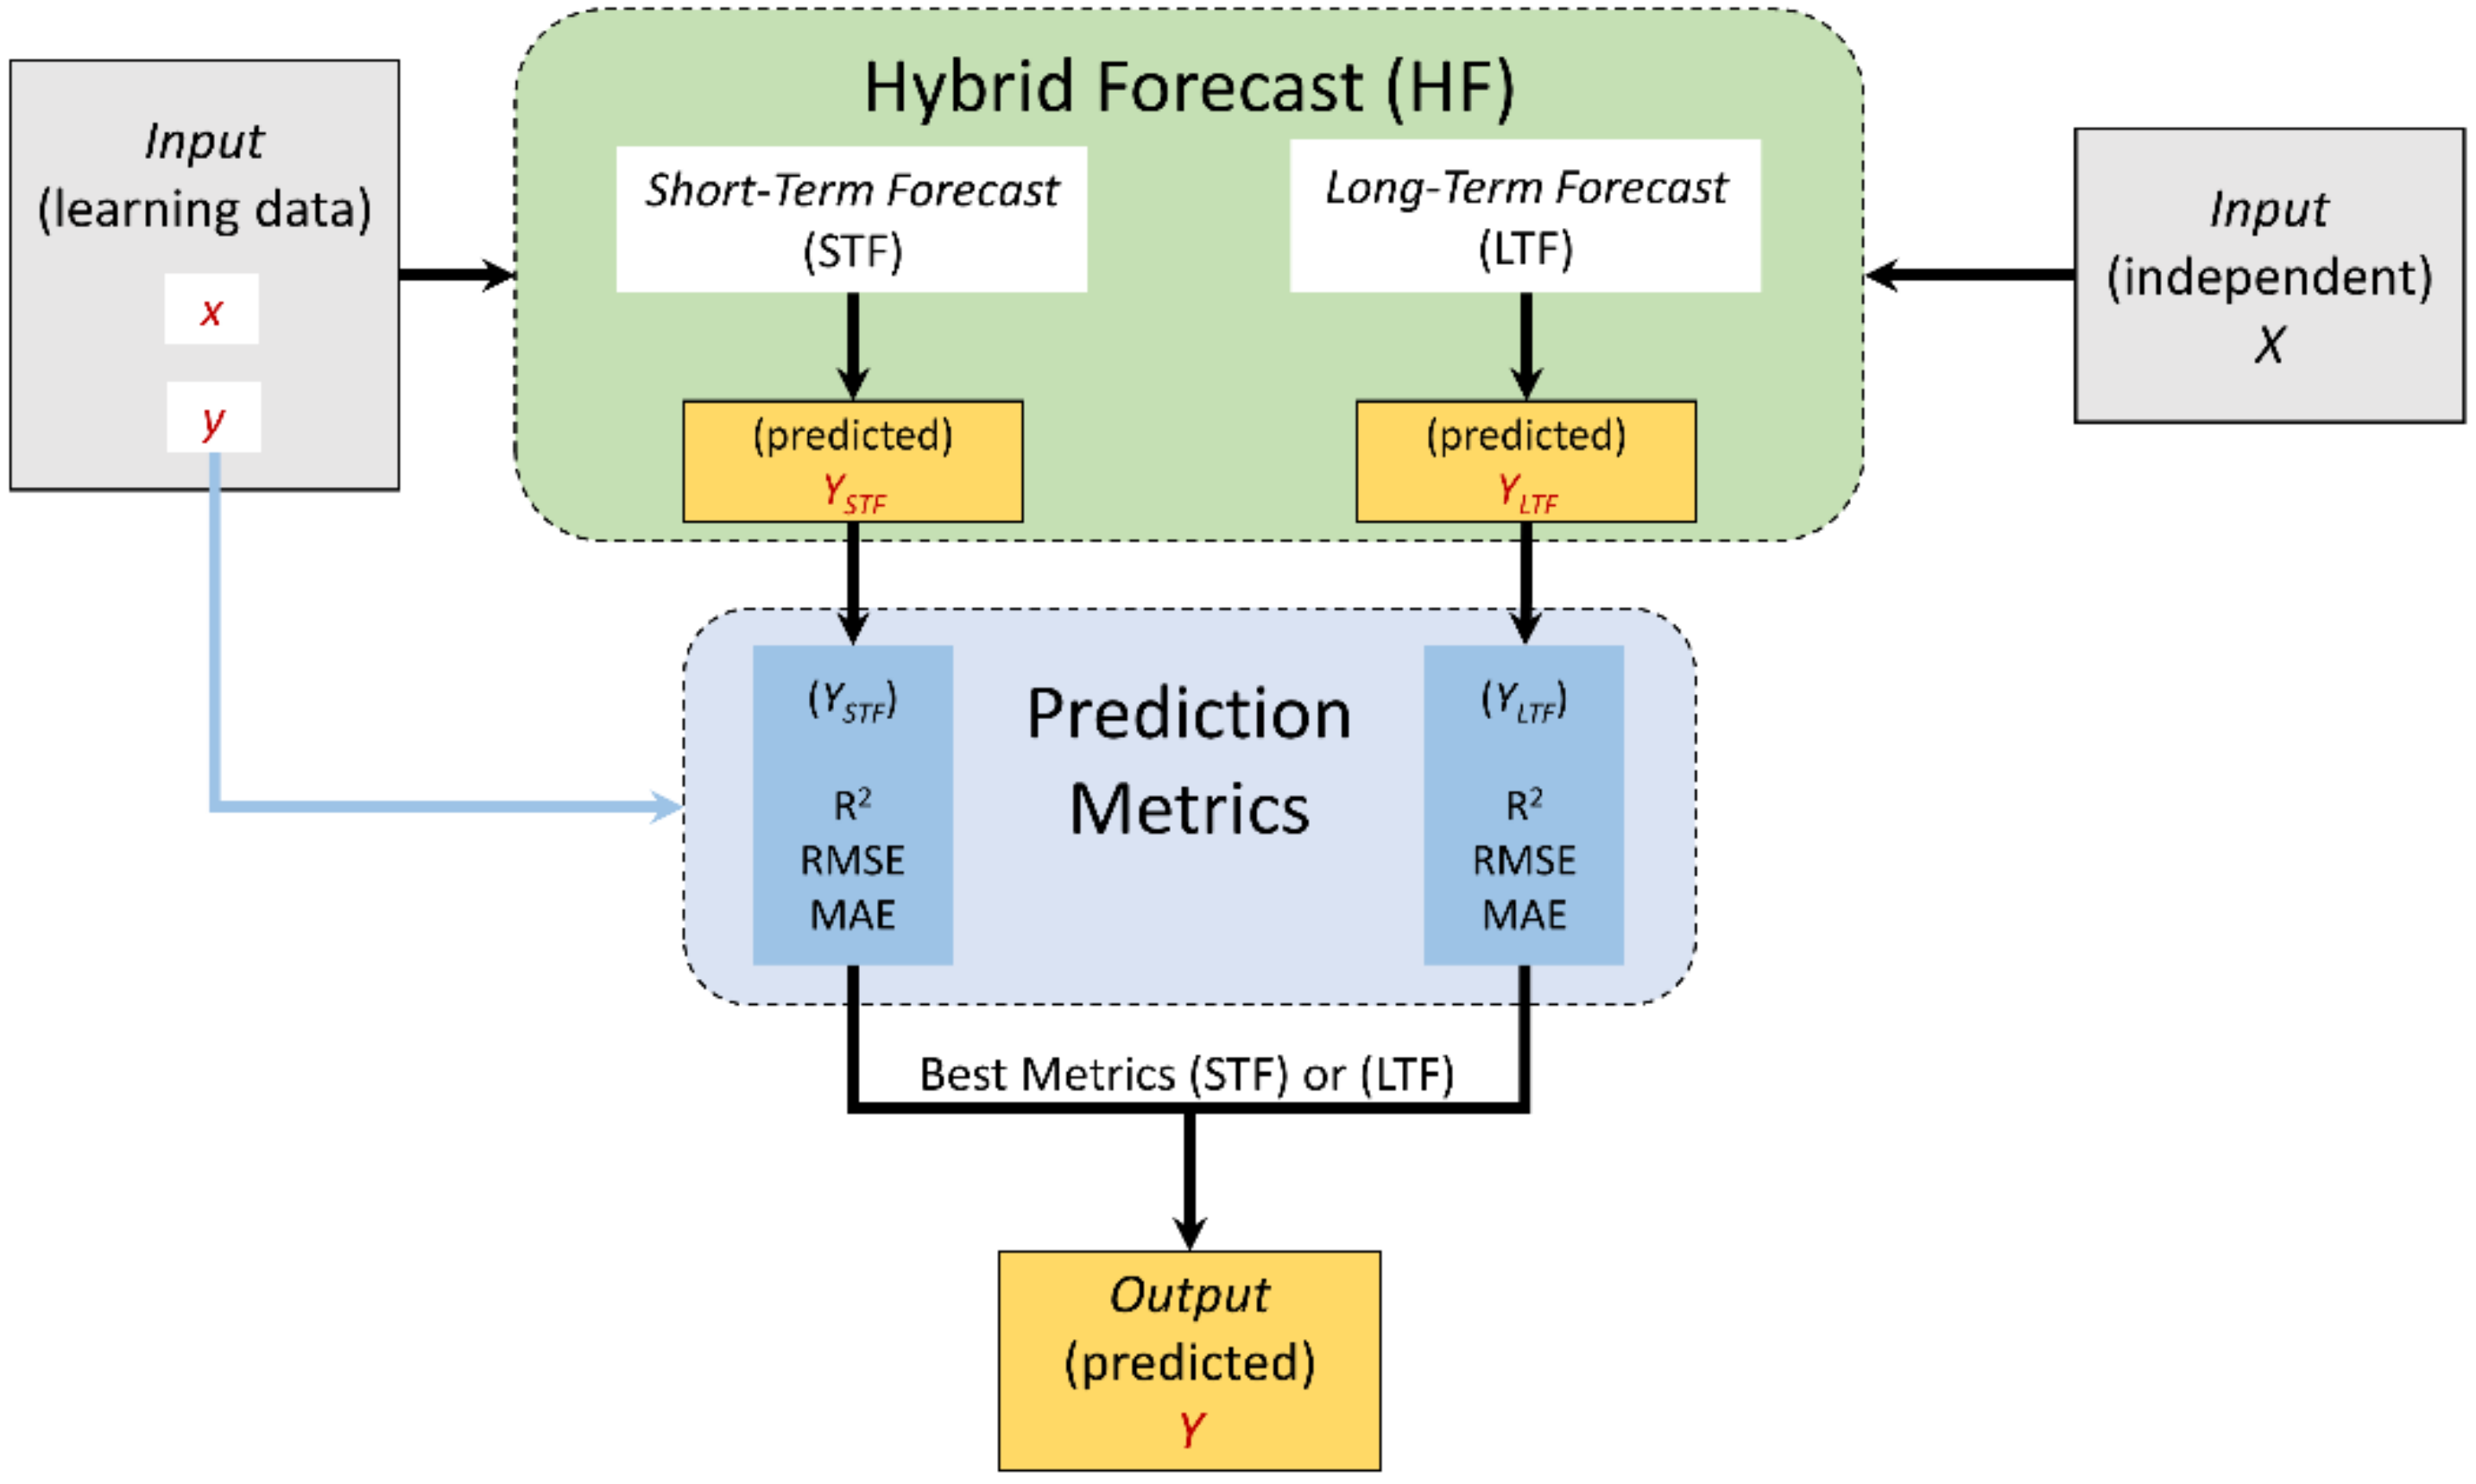
2.2.3. Hybrid Forecast (HF) Model
- During curfew and lockdown periods, the HF is applied.
- During normal life condition periods, the LTF model is applied.
2.2.4. Prediction Metrics
3. Results and Discussion
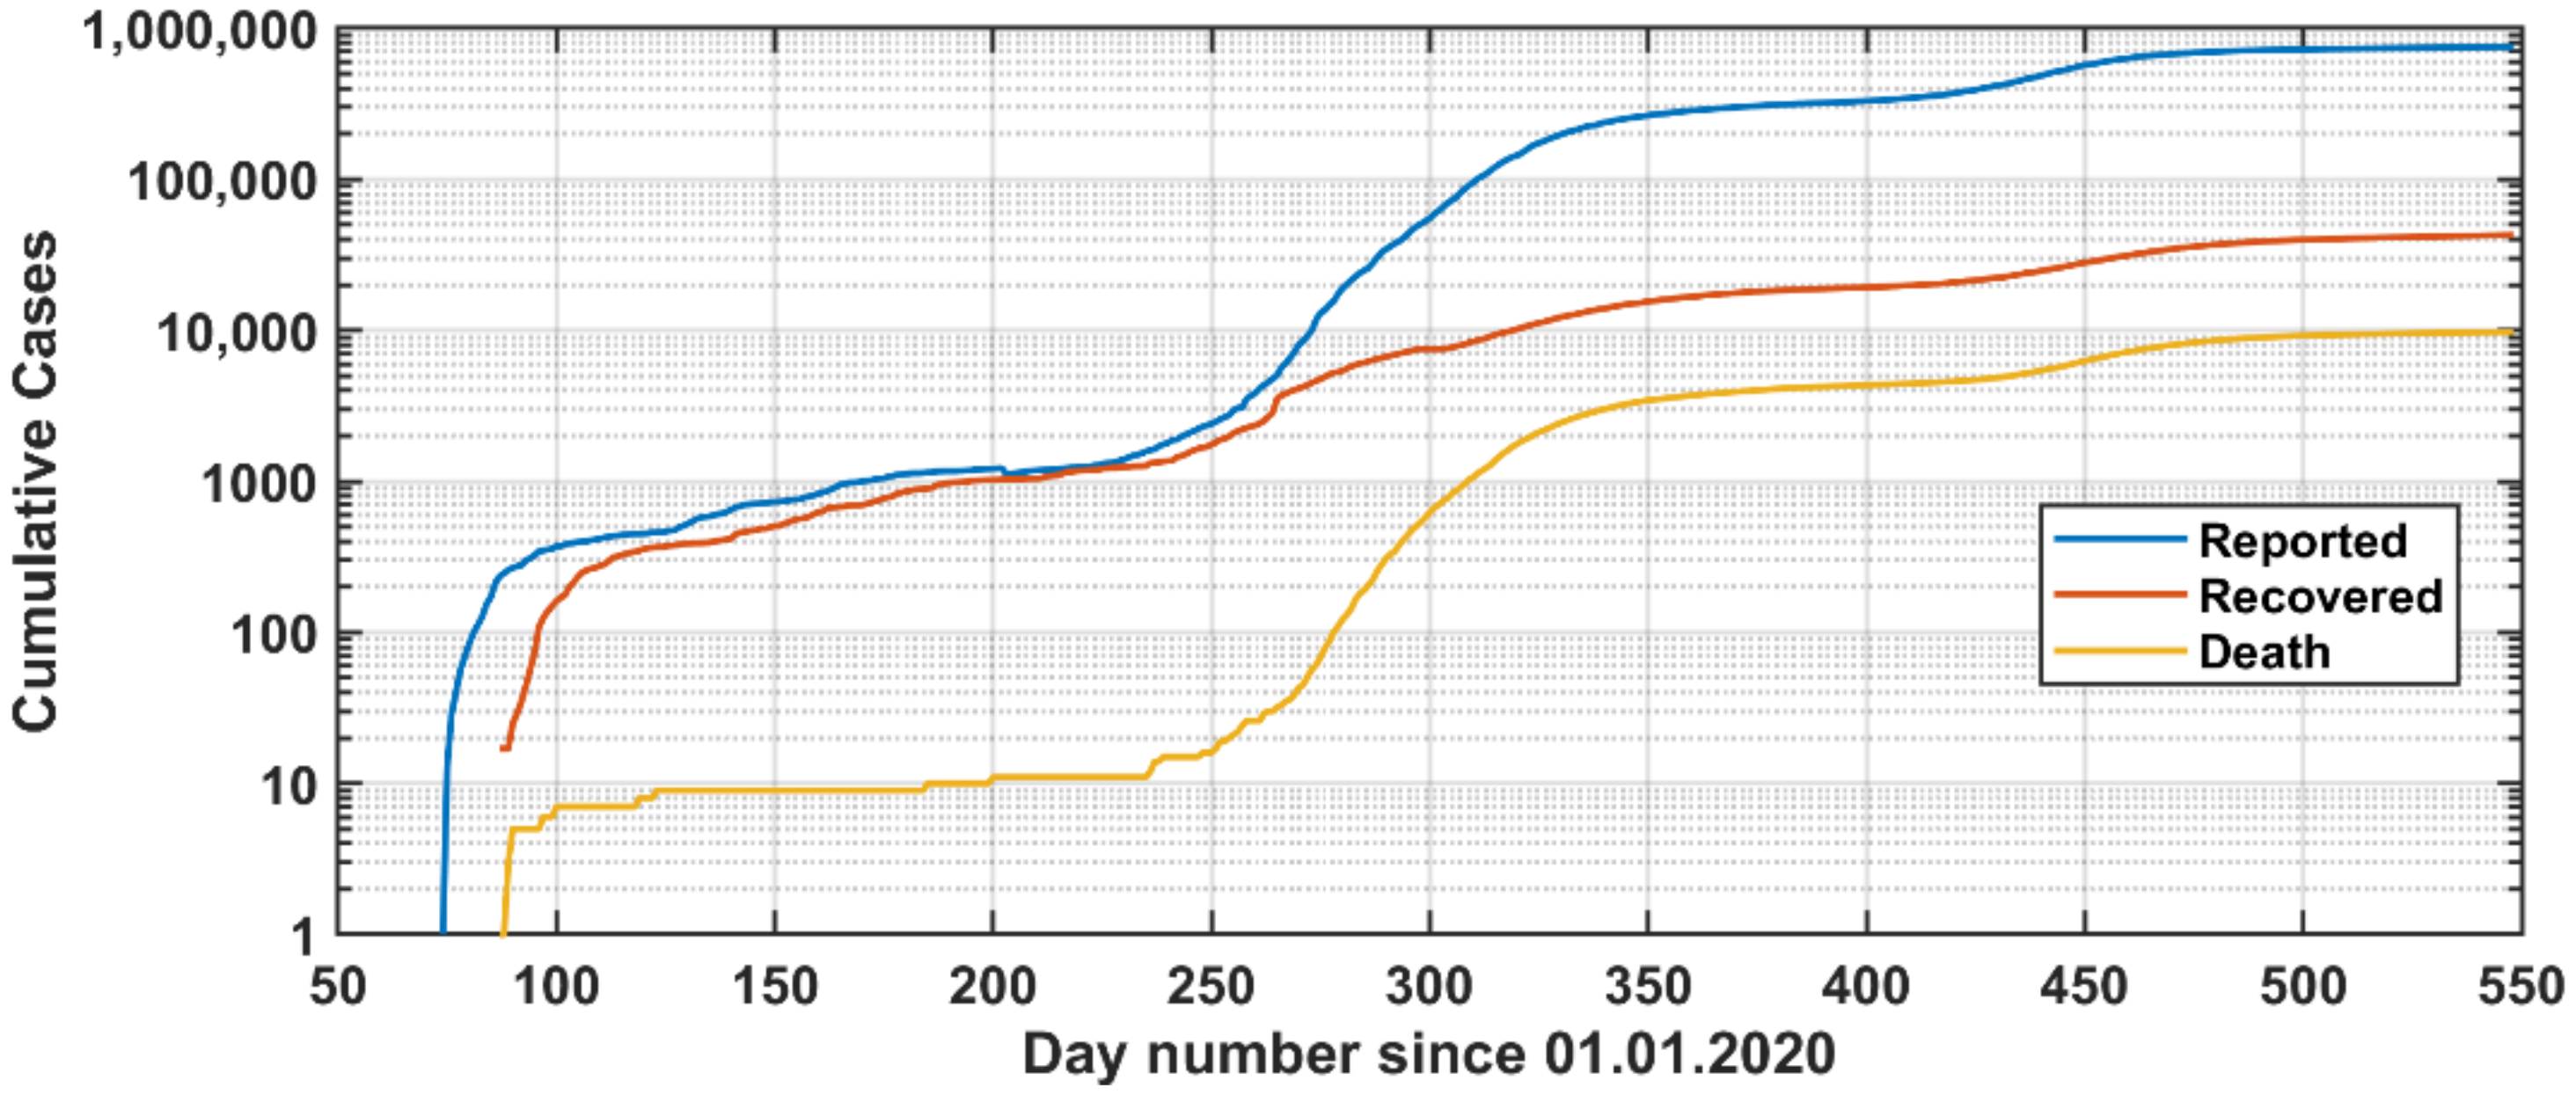
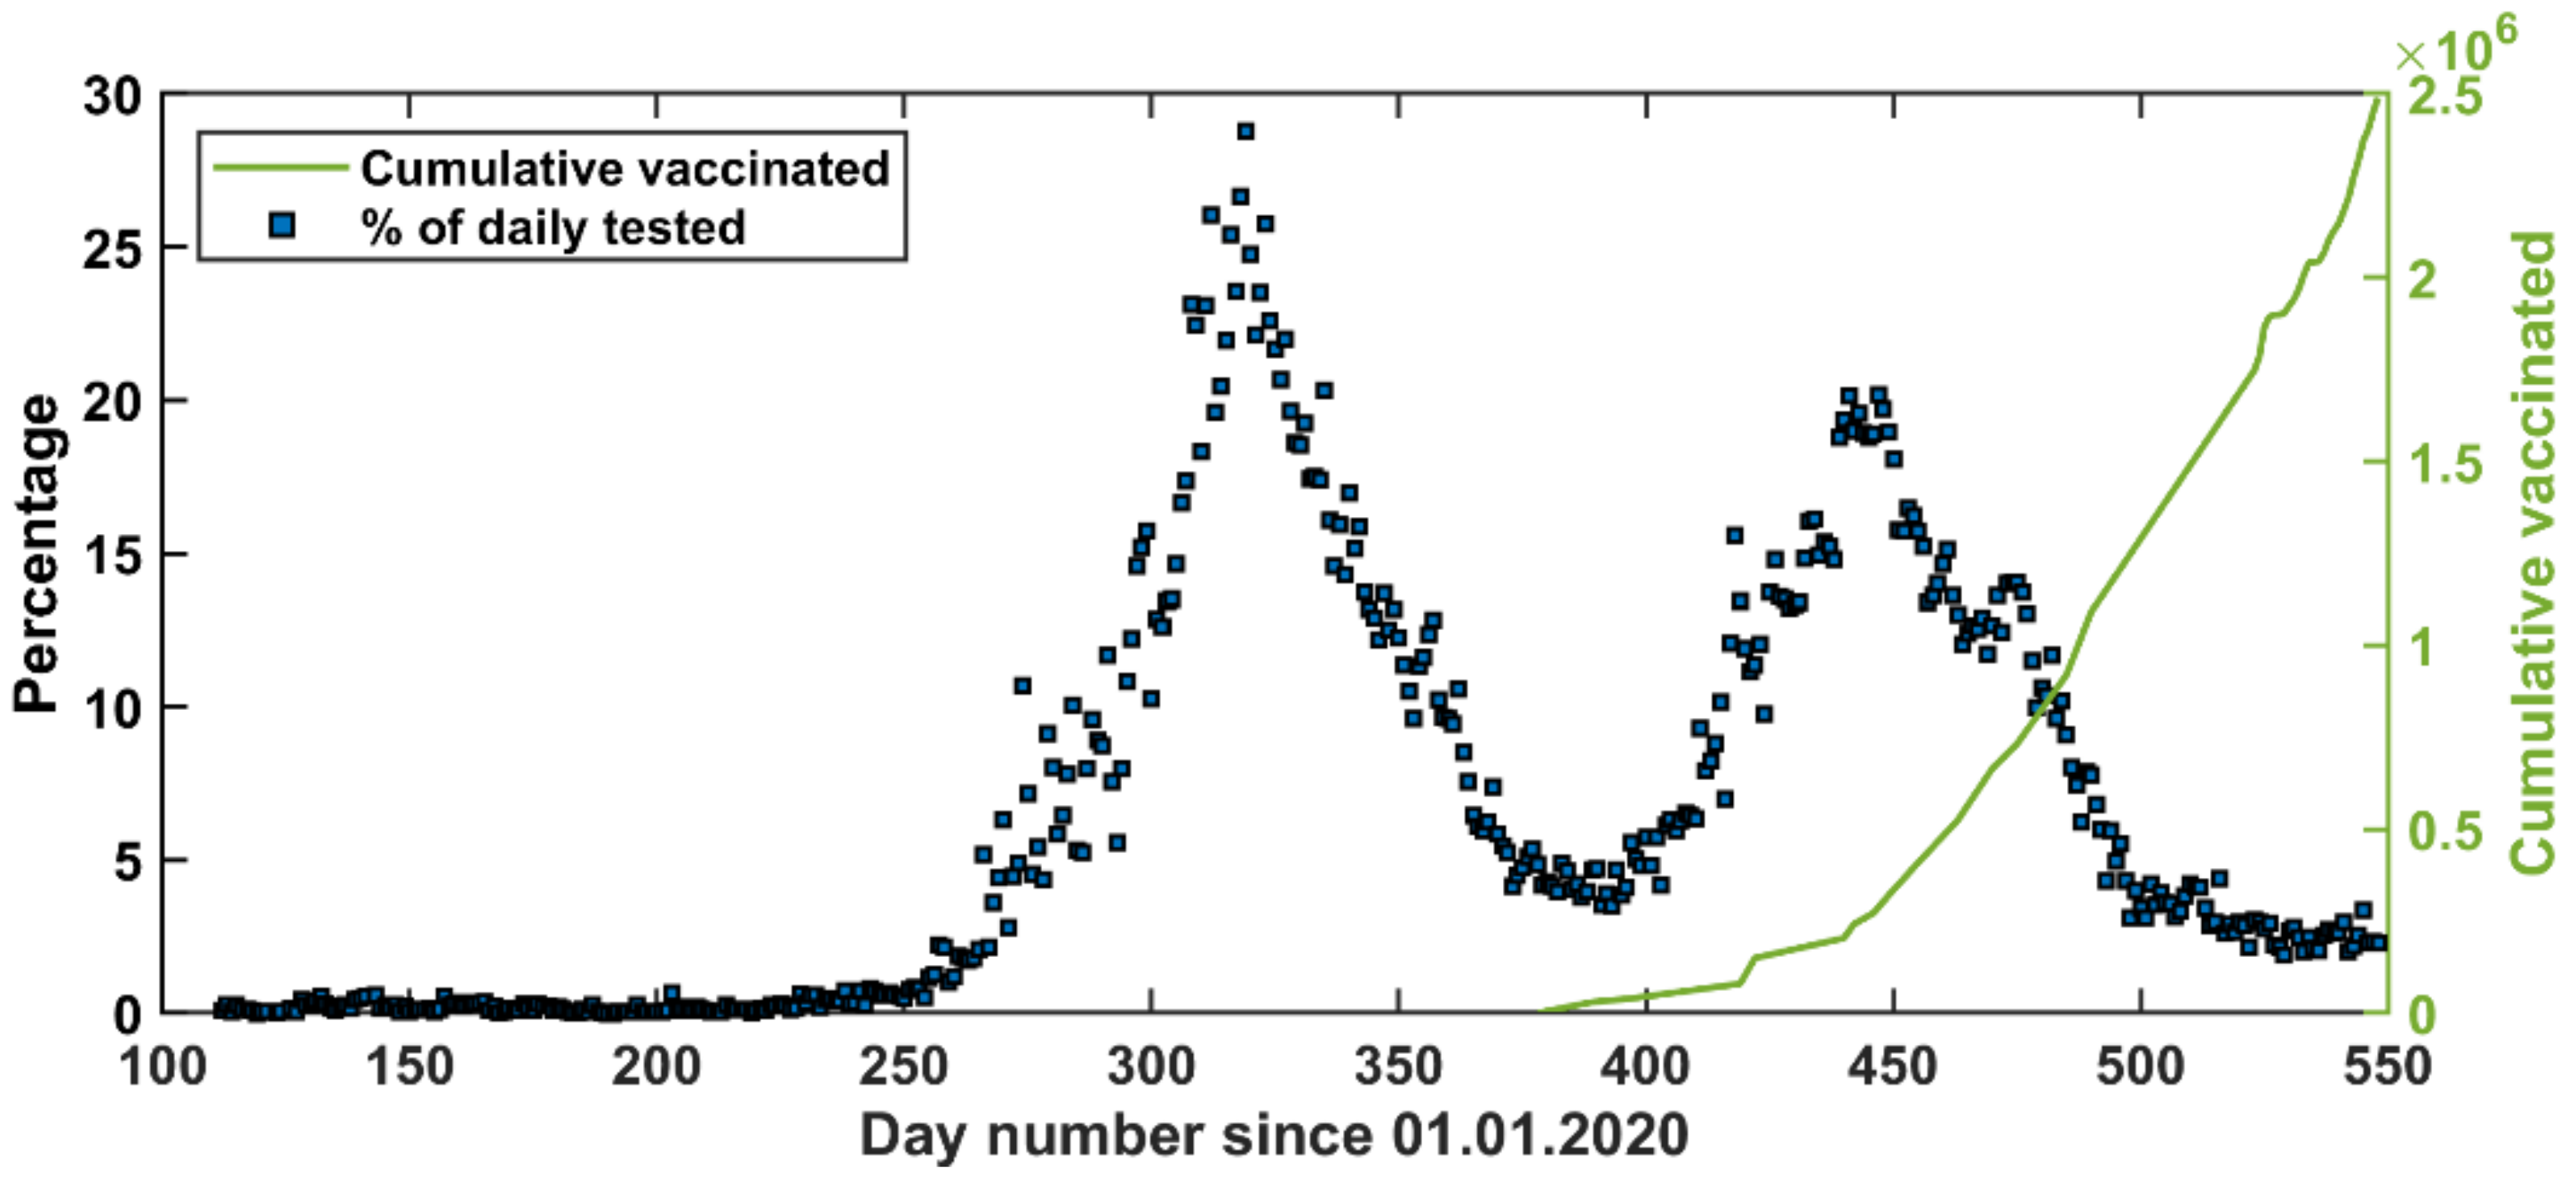
3.1. Overall Description of the COVID-19 Pandemic in Jordan
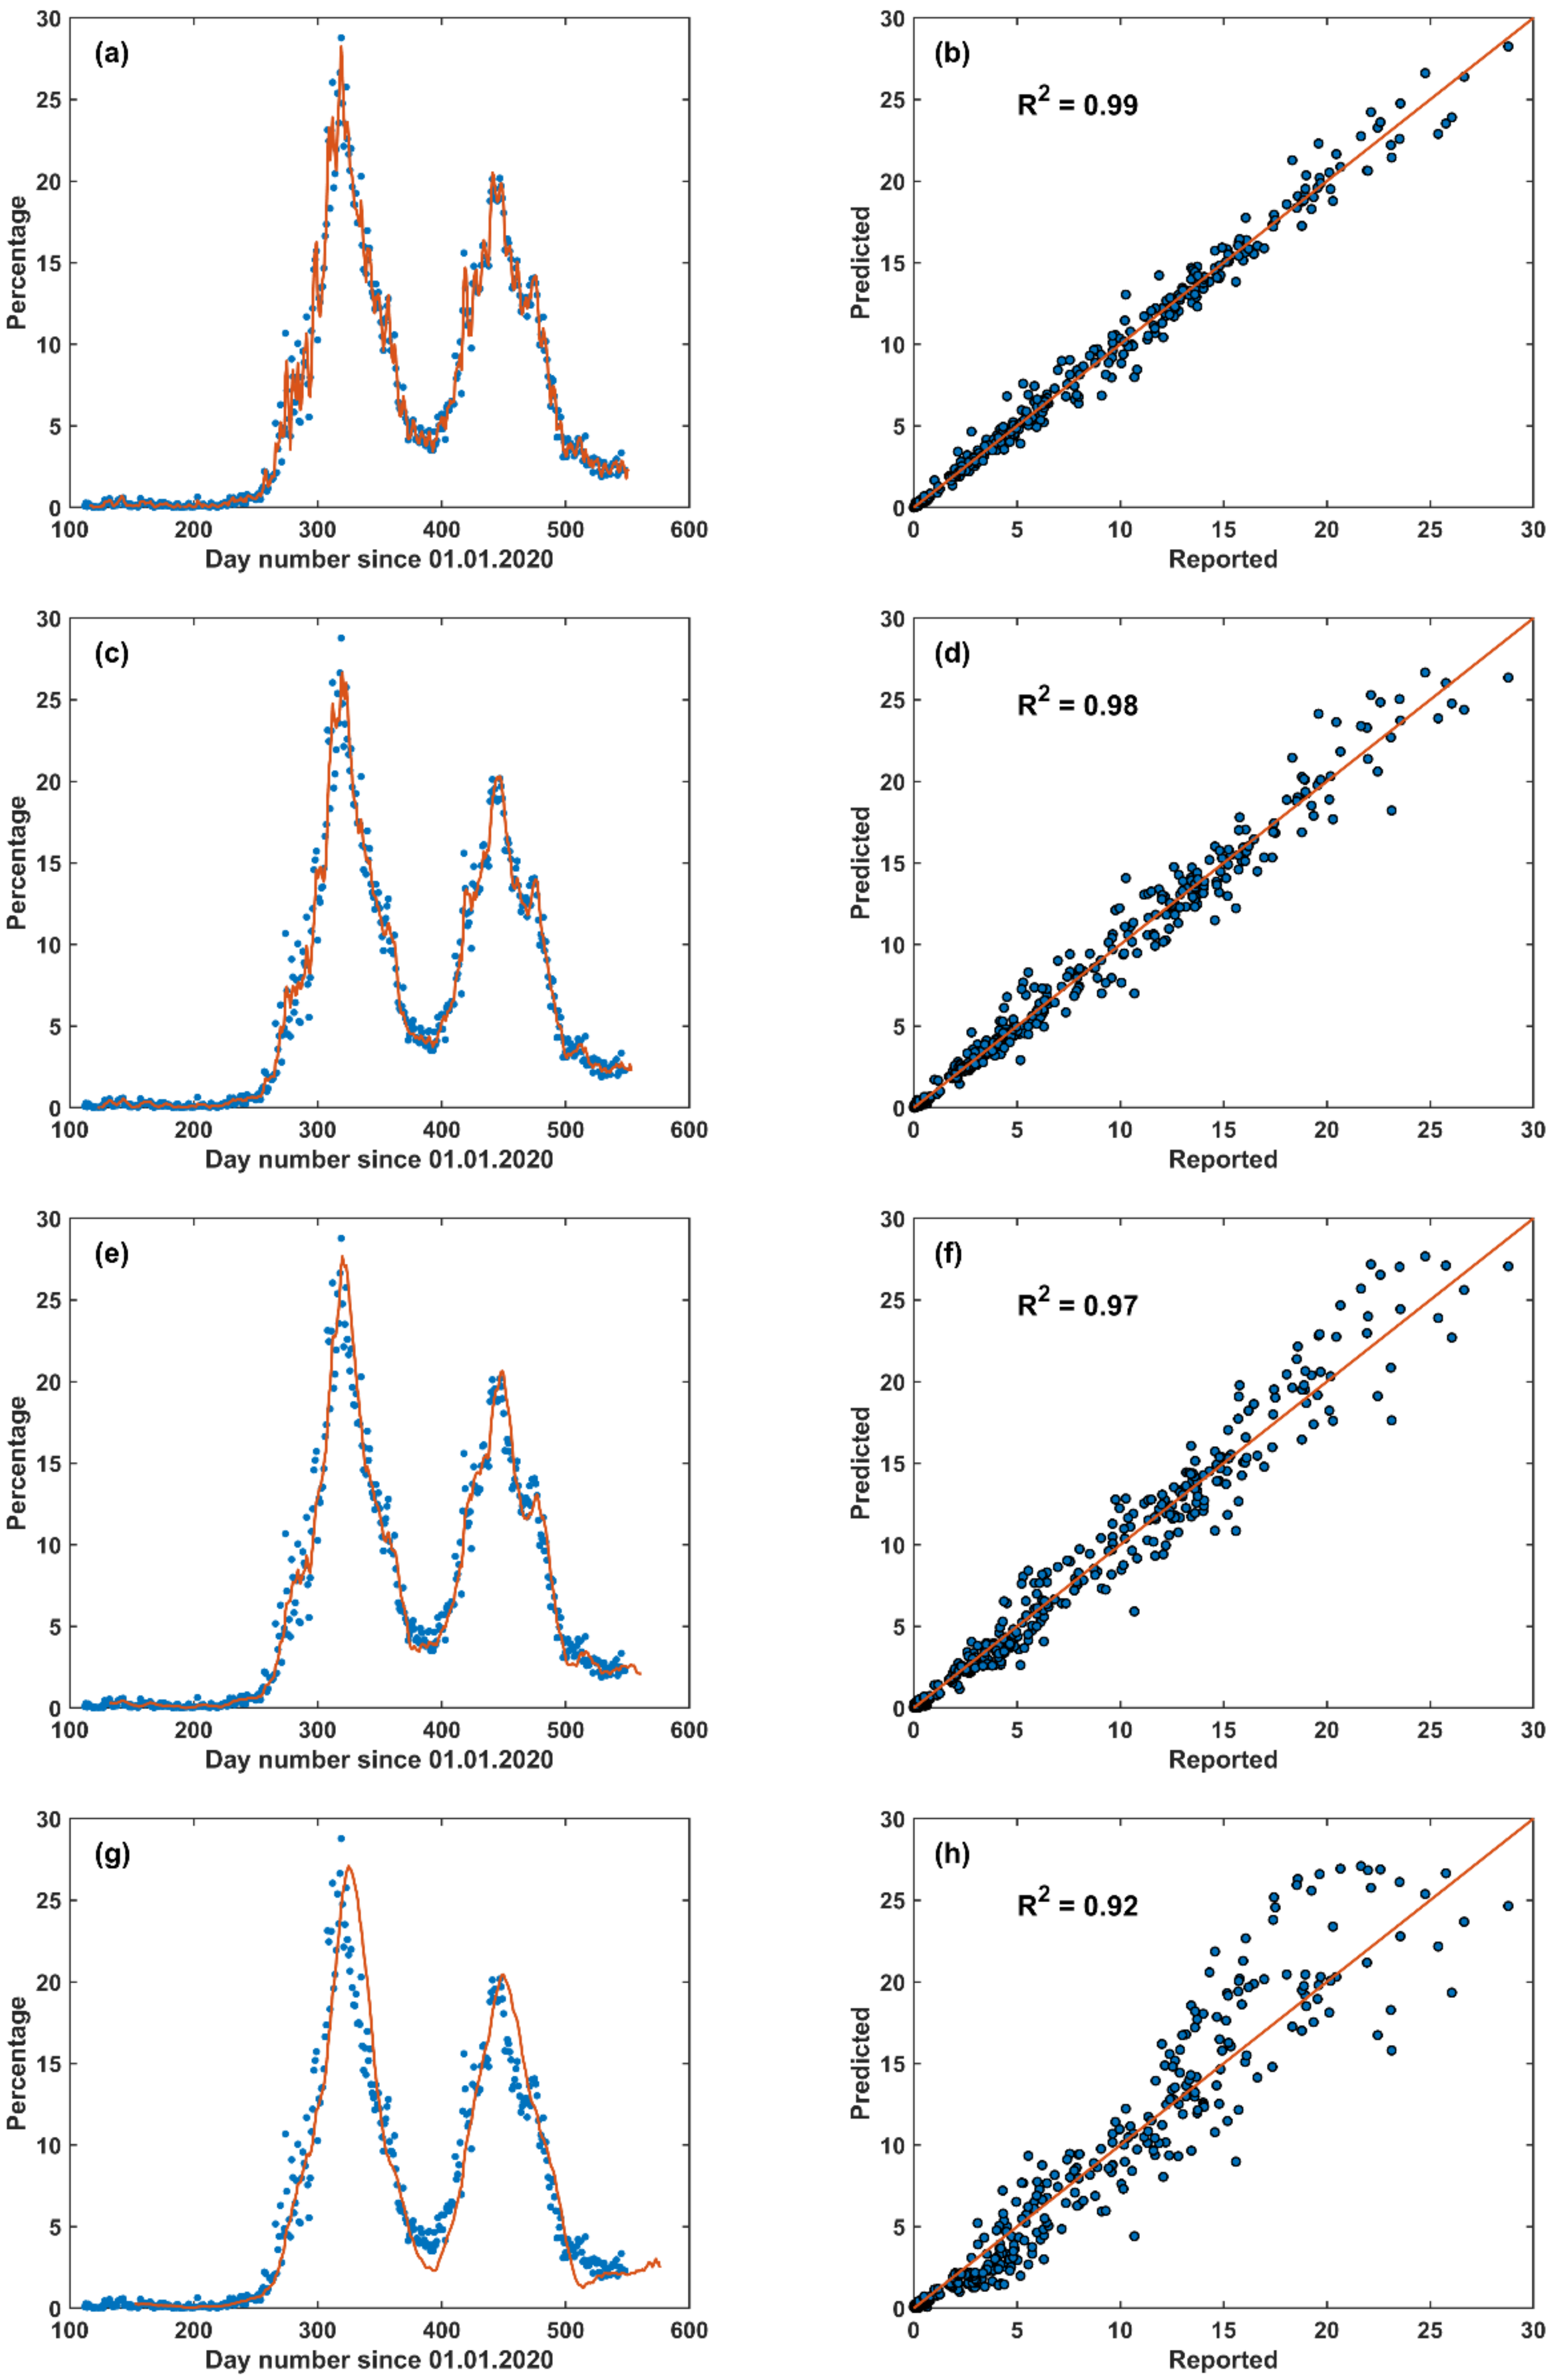
3.2. Short-Term Forecast (STF)
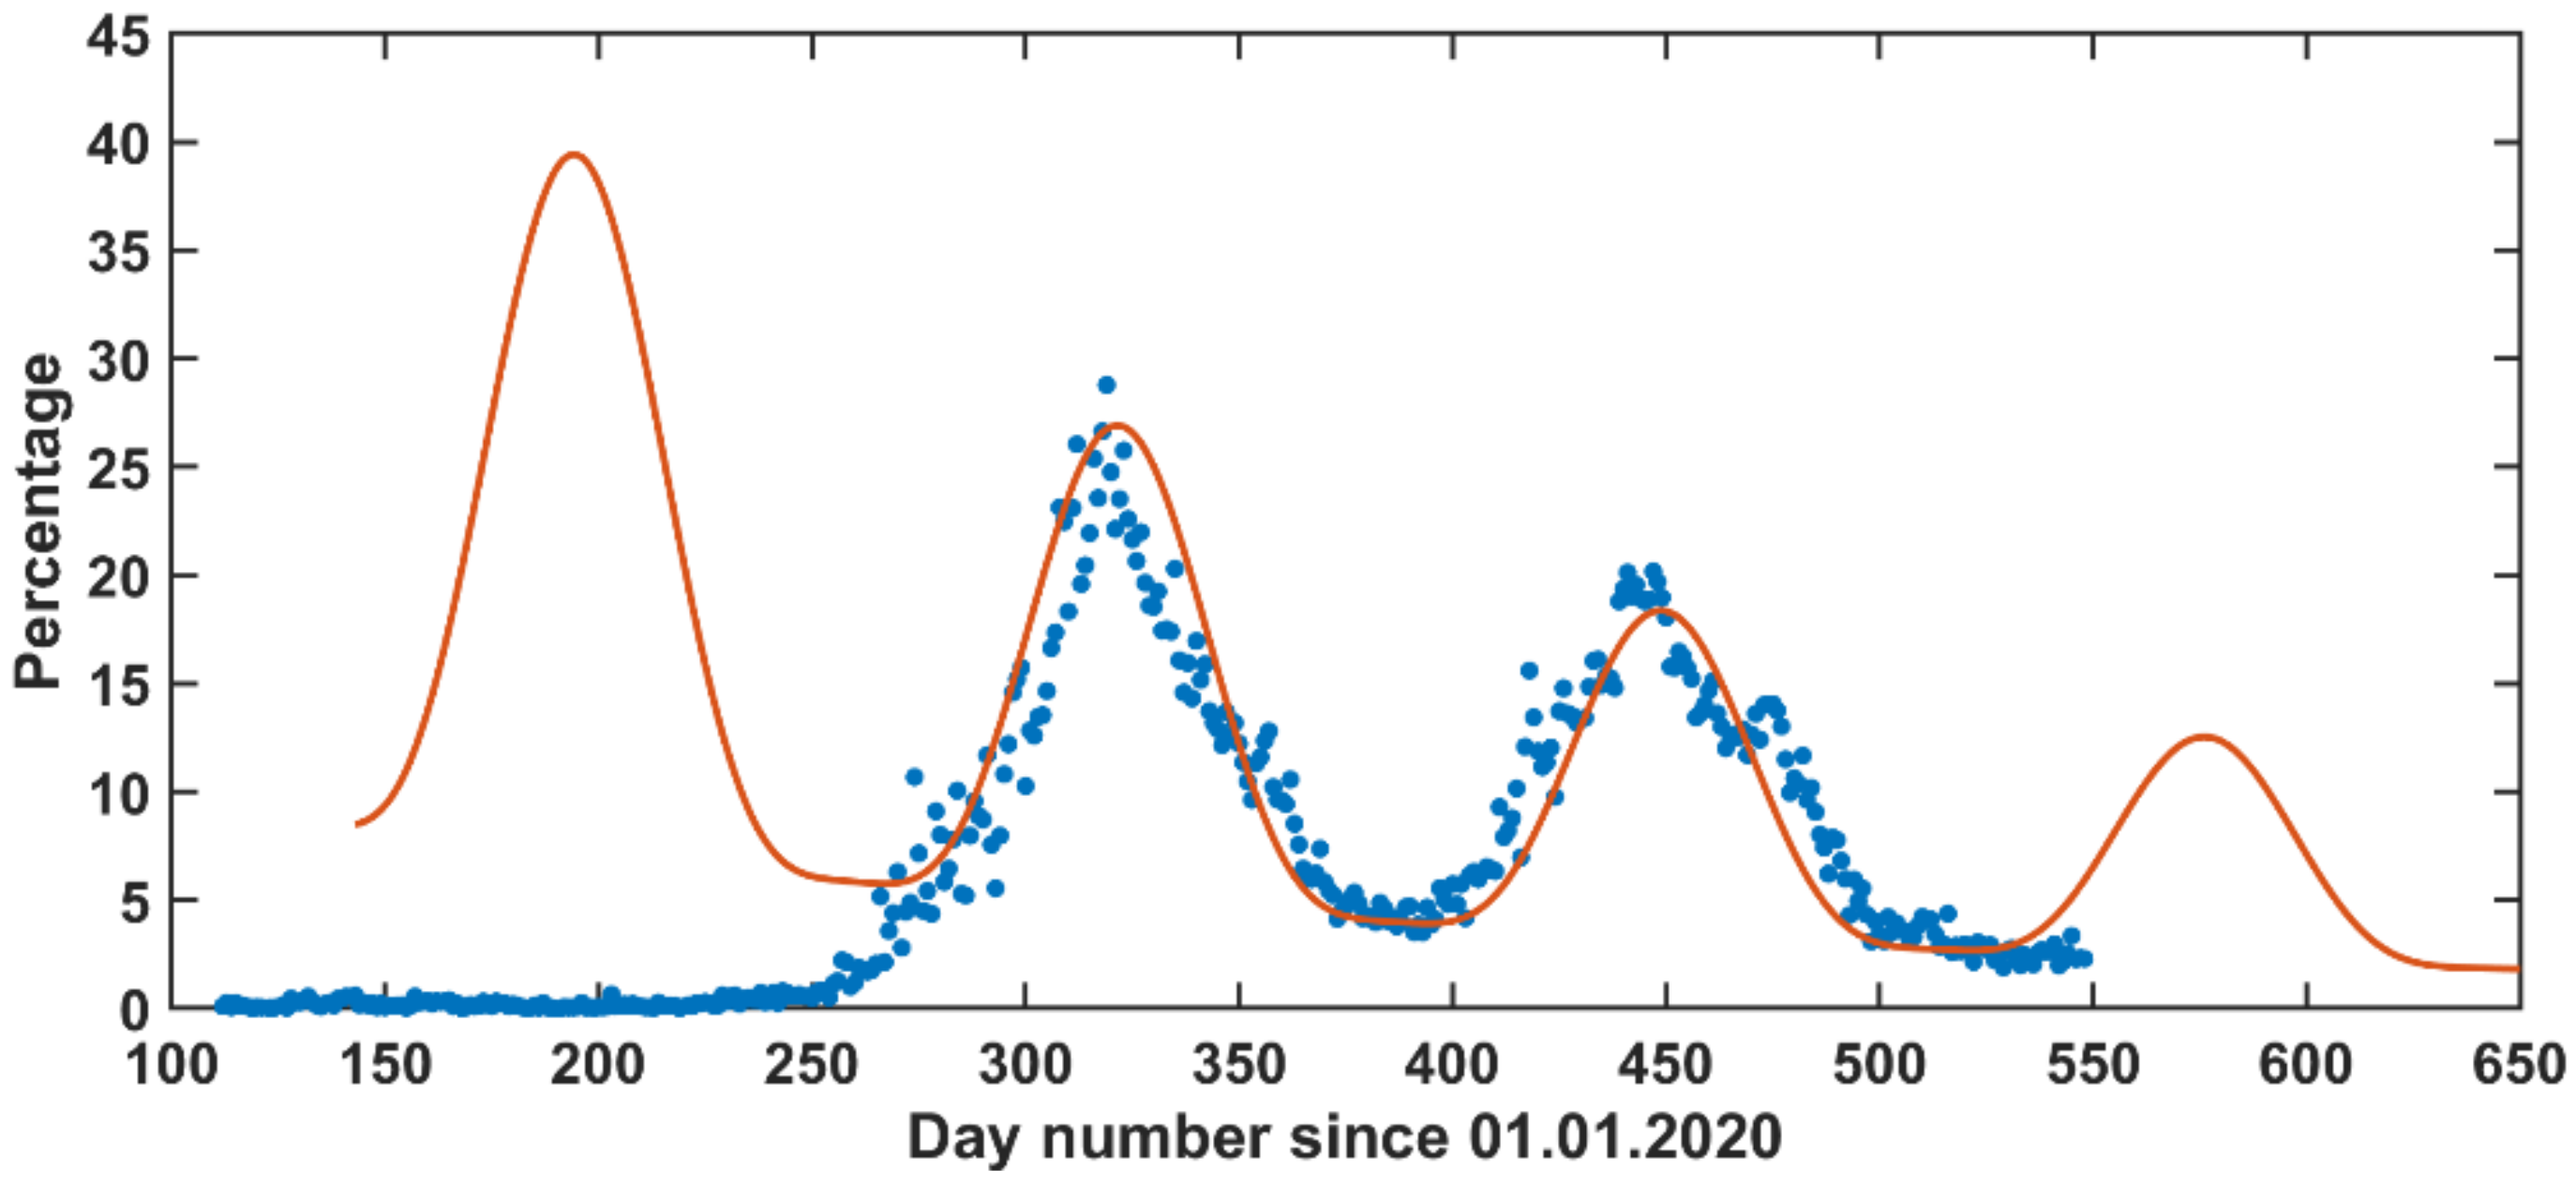
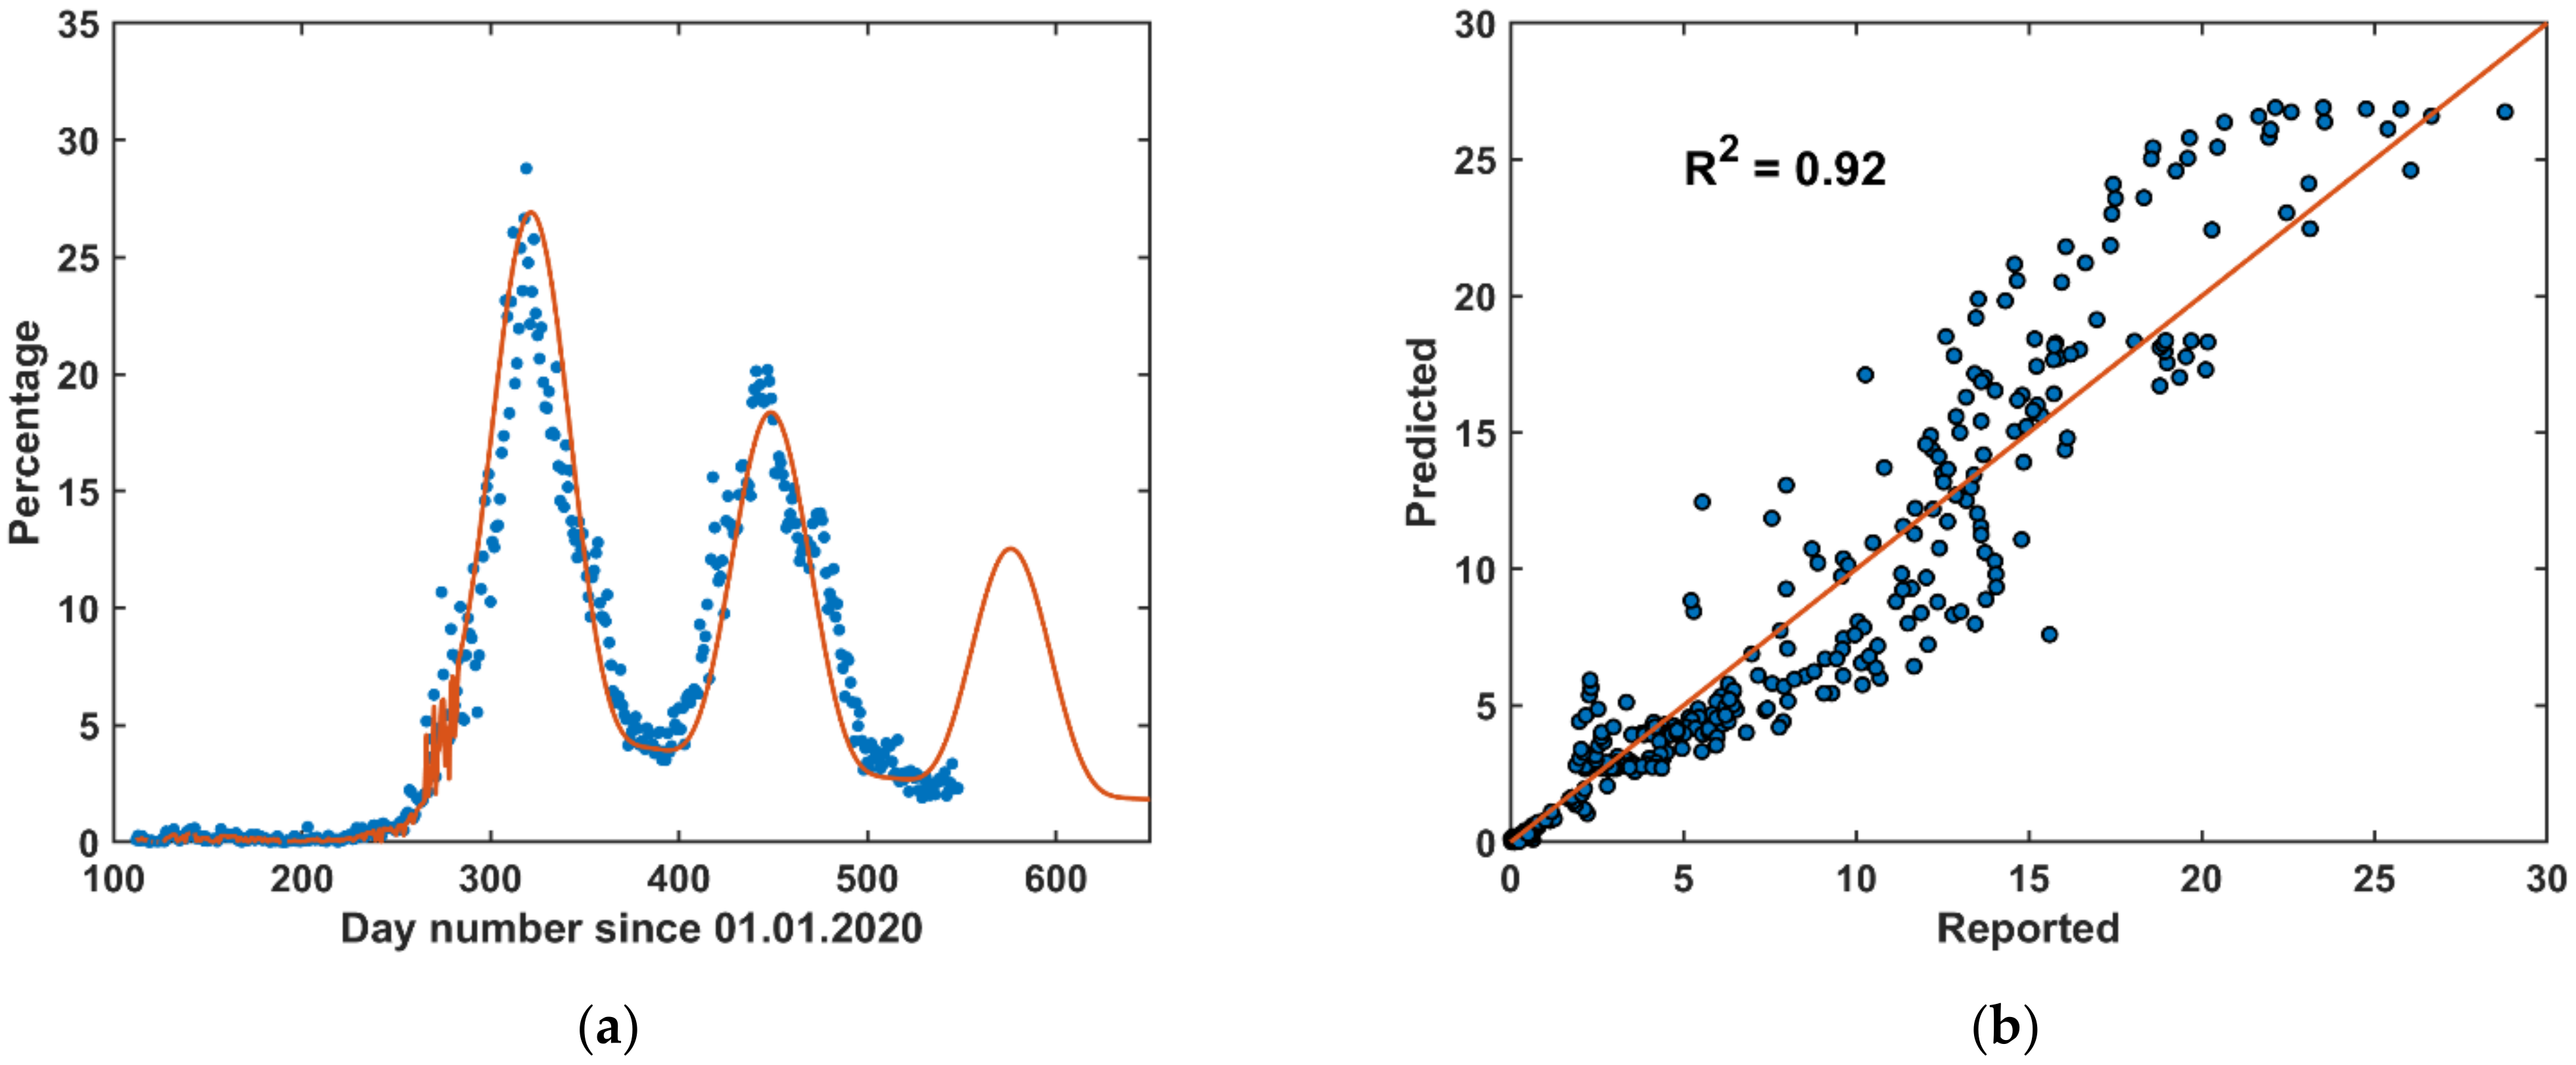
3.3. Long-Term Forecast (LTF)
3.4. Hybrid Forecast (HF)
3.5. Discussion
4. Conclusions
- The first approach, which was a short-term forecast (STF) model, was based on a linear forecast model with the previous ten days as a learning data-base for the upcoming five days forecasting. This short-term approach can cope with sudden daily changes in the pandemic.
- The second approach, which was a long-term forecasting (LTF) model, was based on a mathematical formula that best describes the up-to-date pandemic situations in Jordan. This long-term approach can be utilized to predict the upcoming waves’ occurrence and strength.
- A hybrid approach merging both the STF and the LTF models is the best choice to predict the pandemic.
Supplementary Materials
Author Contributions
Funding
Acknowledgments
Conflicts of Interest
References
- Handelman, G.S.; Kok, H.K.; Chandra, R.V.; Razavi, A.H.; Lee, M.J.; Asadi, H. eDoctor: Machine learning and the future of medicine. J. Intern. Med. 2018, 284, 603–619. [Google Scholar] [CrossRef] [PubMed]
- Sidey-Gibbons, J.A.M.; Sidey-Gibbons, C.J. Machine learning in medicine: A practical introduction. BMC Med. Res. Methodol. 2019, 19, 64. [Google Scholar] [CrossRef] [PubMed] [Green Version]
- Wynants, L.; Van Calster, B.; Collins, G.S.; Riley, R.D.; Heinze, G.; Schuit, E.; Bonten, M.M.J.; Dahly, D.L.; Damen, J.A.; Debray, T.P.A.; et al. Prediction models for diagnosis and prognosis of covid-19: Systematic review and critical appraisal. BMJ 2020, 369, m1328. [Google Scholar] [CrossRef] [Green Version]
- Riley, P.; Riley, A.; Turtle, J.; Ben-Nun, M. COVID-19 deaths: Which explanatory variables matter the most? medRxiv 2020, 1–21. [Google Scholar] [CrossRef]
- Mollalo, A.; Rivera, K.M.; Vahedi, B. Artificial Neural Network Modeling of Novel Coronavirus (COVID-19) Incidence Rates across the Continental United States. Int. J. Environ. Res. Public Health 2020, 17, 4204. [Google Scholar] [CrossRef] [PubMed]
- Li, M.; Zhang, Z.; Cao, W.; Liu, Y.; Du, B.; Chen, C.; Liu, Q.; Uddin, N.; Jiang, S.; Chen, C.; et al. Identifying novel factors associated with COVID-19 transmission and fatality using the machine learning approach. Sci. Total Environ. 2021, 764, 142810. [Google Scholar] [CrossRef] [PubMed]
- Alsayed, A.; Sadir, H.; Kamil, R.; Sari, H. Prediction of Epidemic Peak and Infected Cases for COVID-19 Disease in Malaysia, 2020. Int. J. Environ. Res. Public Health 2020, 17, 4076. [Google Scholar] [CrossRef] [PubMed]
- Aguiar, M.; Ortuondo, E.M.; Van-Dierdonck, J.B.; Mar, J.; Stollenwerk, N. Modelling COVID 19 in the Basque Country from introduction to control measure response. Sci. Rep. 2020, 10, 1–16. [Google Scholar] [CrossRef] [PubMed]
- Kannan, S.; Subbaram, K.; Ali, S.; Kannan, H. The Role of Artificial Intelligence and Machine Learning Techniques: Race for COVID-19 Vaccine. Arch. Clin. Infect. Dis. 2020, 15, e103232. [Google Scholar] [CrossRef]
- Mohamed, S.; Giabbanelli, P.; Alvarez-Lopez, F.; Adly, A.S.; Adly, A.S.; Adly, M.S. Approaches Based on Artificial Intelligence and the Internet of Intelligent Things to Prevent the Spread of COVID-19: Scoping Review. J. Med. Internet Res. 2020, 22, e19104. [Google Scholar] [CrossRef]
- Lalmuanawma, S.; Hussain, J.; Chhakchhuak, L. Applications of machine learning and artificial intelligence for Covid-19 (SARSCoV-2) pandemic: A review. Chaos Solitons Fractals 2020, 139, 110059. [Google Scholar] [CrossRef] [PubMed]
- WHO. Non-Pharmaceutical Public Health Measures for Mitigating the Risk and Impact of Epidemic and Pandemic Influenza. A Checklist for Pandemic Influenza Risk and Impact Management: Building Capacity for Pandemic Response. 2019. Available online: https://www.who.int/publications/i/item/non-pharmaceutical-public-health-measuresfor-mitigating-the-risk-and-impact-of-epidemic-and-pandemic-influenza (accessed on 1 July 2021).
- Porgo, T.V.; Norris, S.L.; Salanti, G.; Johnson, L.F.; Simpson, J.A.; Low, N.; Egger, M.; Althaus, C.L. The use of mathematical modeling studies for evidence synthesis and guideline development: A glossary. Res. Synth. Methods 2019, 10, 125–133. [Google Scholar] [CrossRef] [PubMed] [Green Version]
- Godio, A.; Pace, F.; Vergnano, A. SEIR Modeling of the Italian Epidemic of SARS-CoV-2 Using Computational Swarm Intelligence. Int. J. Environ. Res. Public Health 2020, 17, 3535. [Google Scholar] [CrossRef] [PubMed]
- Parham, P.E.; Michael, E. Outbreak properties of epidemic models: The roles of temporal forcing and stochasticity on pathogen invasion dynamics. J. Theor. Biol. 2011, 271, 1–9. [Google Scholar] [CrossRef] [PubMed] [Green Version]
- Hadid, S.B.; Ibrahim, R.W.; Altulea, D.; Momani, S. Solvability and stability of a fractional dynamical system of the growth of COVID-19 with approximate solution by fractional Chebyshev polynomials. Adv. Differ. Equ. 2020, 338. [Google Scholar] [CrossRef] [PubMed]
- Kumar, S.; Kumar, R.; Momani, S.; Hadid, S. A study on fractional COVID-19 disease model by using Hermite wavelets. Math. Methods Appl. Sci. 2021, 1–17. [Google Scholar] [CrossRef]
- Saidan, M.N.; Shbool, M.A.; Arabeyyat, O.S.; Al-Shihabi, S.T.; Al Abdallat, Y.; Barghash, M.A.; Saidan, H. Estimation of the probable outbreak size of novel coronavirus (COVID-19) in social gathering events and industrial activities. Int. J. Infect. Dis. 2020, 98, 321–327. [Google Scholar] [CrossRef] [PubMed]
- Kheirallah, K.A.; Alsinglawi, B.; Alzoubi, A.; Saidan, M.N.; Mubin, O.; Alorjani, M.S.; Mzayek, F. The Effect of Strict State Measures on the Epidemiologic Curve of COVID-19 Infection in the Context of a Developing Country: A Simulation from Jordan. Int. J. Environ. Res. Public Health 2020, 17, 6530. [Google Scholar] [CrossRef] [PubMed]


| Model | Number of Learning Days | R2 | RMSE | MAE |
|---|---|---|---|---|
| STF | 5 | 0.990 | 0.68 | 0.41 |
| 10 | 0.981 | 0.95 | 0.58 | |
| 15 | 0.975 | 1.09 | 0.69 | |
| 20 | 0.969 | 1.24 | 0.79 | |
| 25 | 0.958 | 1.46 | 0.92 | |
| 30 | 0.947 | 1.68 | 1.06 | |
| 35 | 0.934 | 1.89 | 1.20 | |
| 40 | 0.921 | 2.12 | 1.35 | |
| LTF | first wave onwards | 0.844 | 2.81 | 2.16 |
| HF | 0.919 | 2.15 | 1.35 |
Publisher’s Note: MDPI stays neutral with regard to jurisdictional claims in published maps and institutional affiliations. |
© 2021 by the authors. Licensee MDPI, Basel, Switzerland. This article is an open access article distributed under the terms and conditions of the Creative Commons Attribution (CC BY) license (https://creativecommons.org/licenses/by/4.0/).
Share and Cite
Hussein, T.; Hammad, M.H.; Fung, P.L.; Al-Kloub, M.; Odeh, I.; Zaidan, M.A.; Wraith, D. COVID-19 Pandemic Development in Jordan—Short-Term and Long-Term Forecasting. Vaccines 2021, 9, 728. https://doi.org/10.3390/vaccines9070728
Hussein T, Hammad MH, Fung PL, Al-Kloub M, Odeh I, Zaidan MA, Wraith D. COVID-19 Pandemic Development in Jordan—Short-Term and Long-Term Forecasting. Vaccines. 2021; 9(7):728. https://doi.org/10.3390/vaccines9070728
Chicago/Turabian StyleHussein, Tareq, Mahmoud H. Hammad, Pak Lun Fung, Marwan Al-Kloub, Issam Odeh, Martha A. Zaidan, and Darren Wraith. 2021. "COVID-19 Pandemic Development in Jordan—Short-Term and Long-Term Forecasting" Vaccines 9, no. 7: 728. https://doi.org/10.3390/vaccines9070728
APA StyleHussein, T., Hammad, M. H., Fung, P. L., Al-Kloub, M., Odeh, I., Zaidan, M. A., & Wraith, D. (2021). COVID-19 Pandemic Development in Jordan—Short-Term and Long-Term Forecasting. Vaccines, 9(7), 728. https://doi.org/10.3390/vaccines9070728