Plasmablast, Memory B Cell, CD4+ T Cell, and Circulating Follicular Helper T Cell Responses to a Non-Replicating Modified Vaccinia Ankara Vaccine

 , , , , ,
Abstract
:1. Introduction
2. Materials and Methods
2.1. Study Design
2.2. Immunogenicity Assays
2.3. Analysis Population
2.4. Statistical Analysis
3. Results
3.1. Subject Study Details
3.2. Antibody Responses
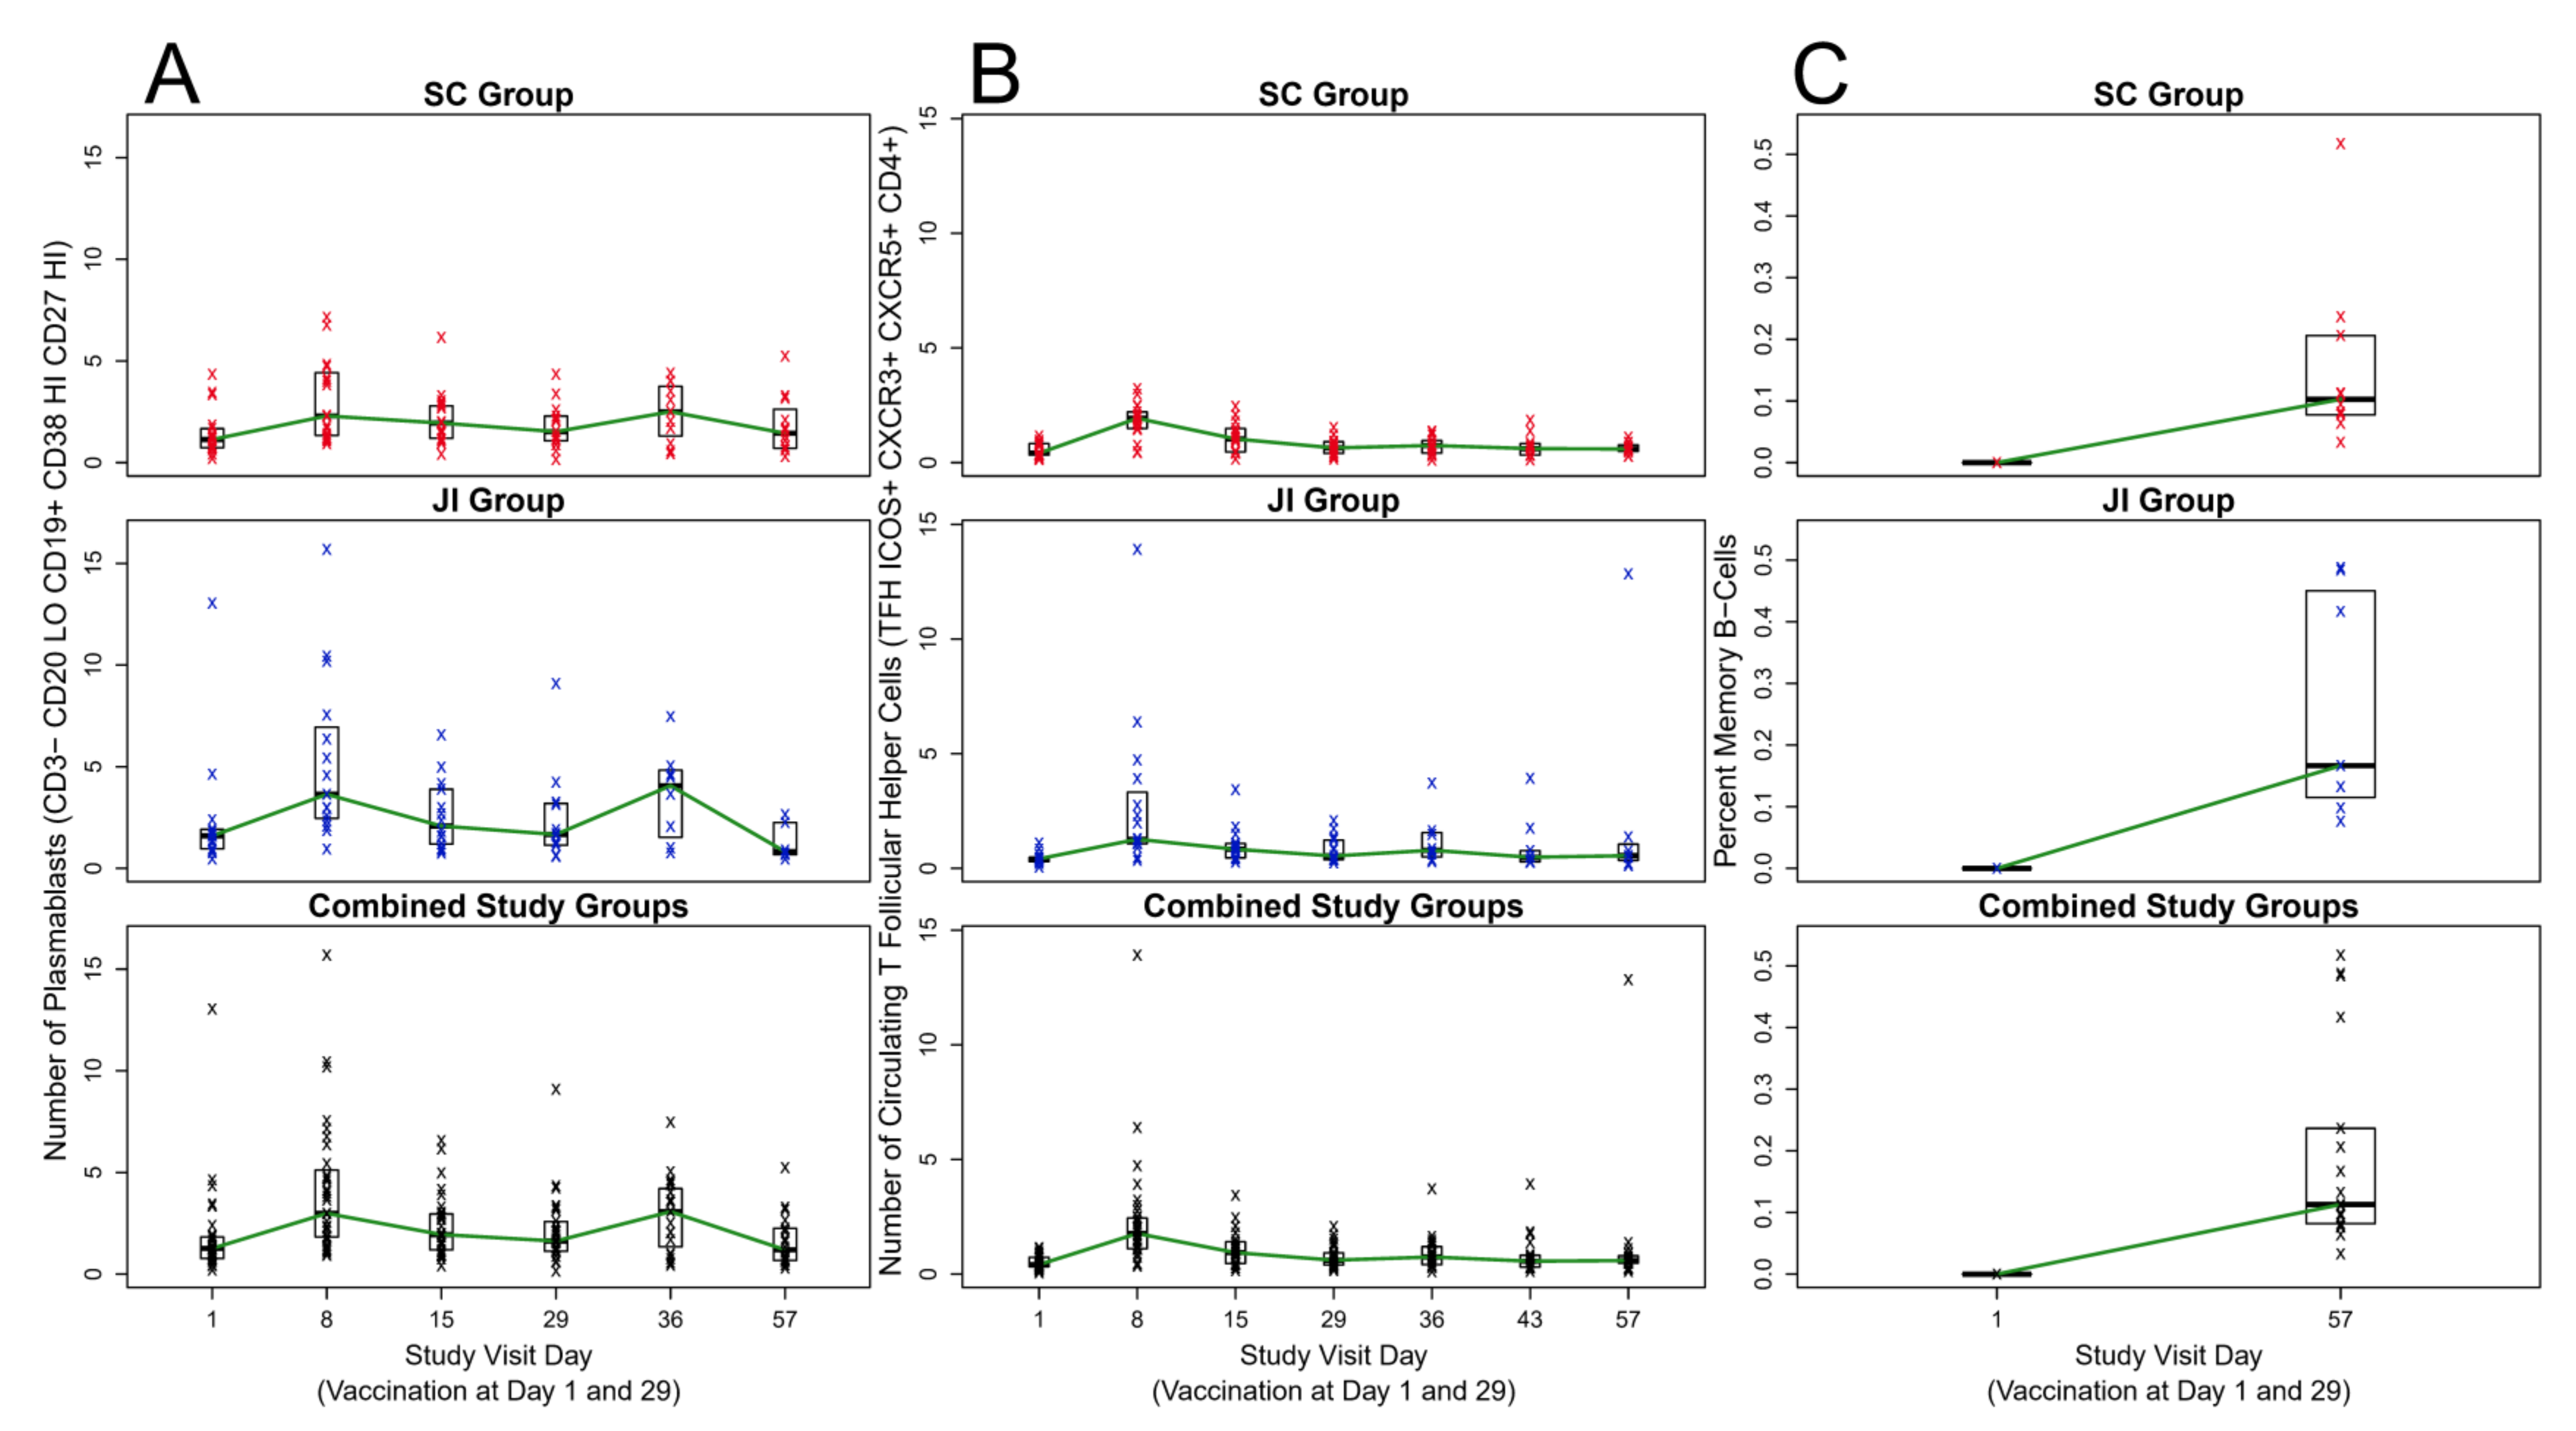
3.3. Plasmablasts (ASCs)
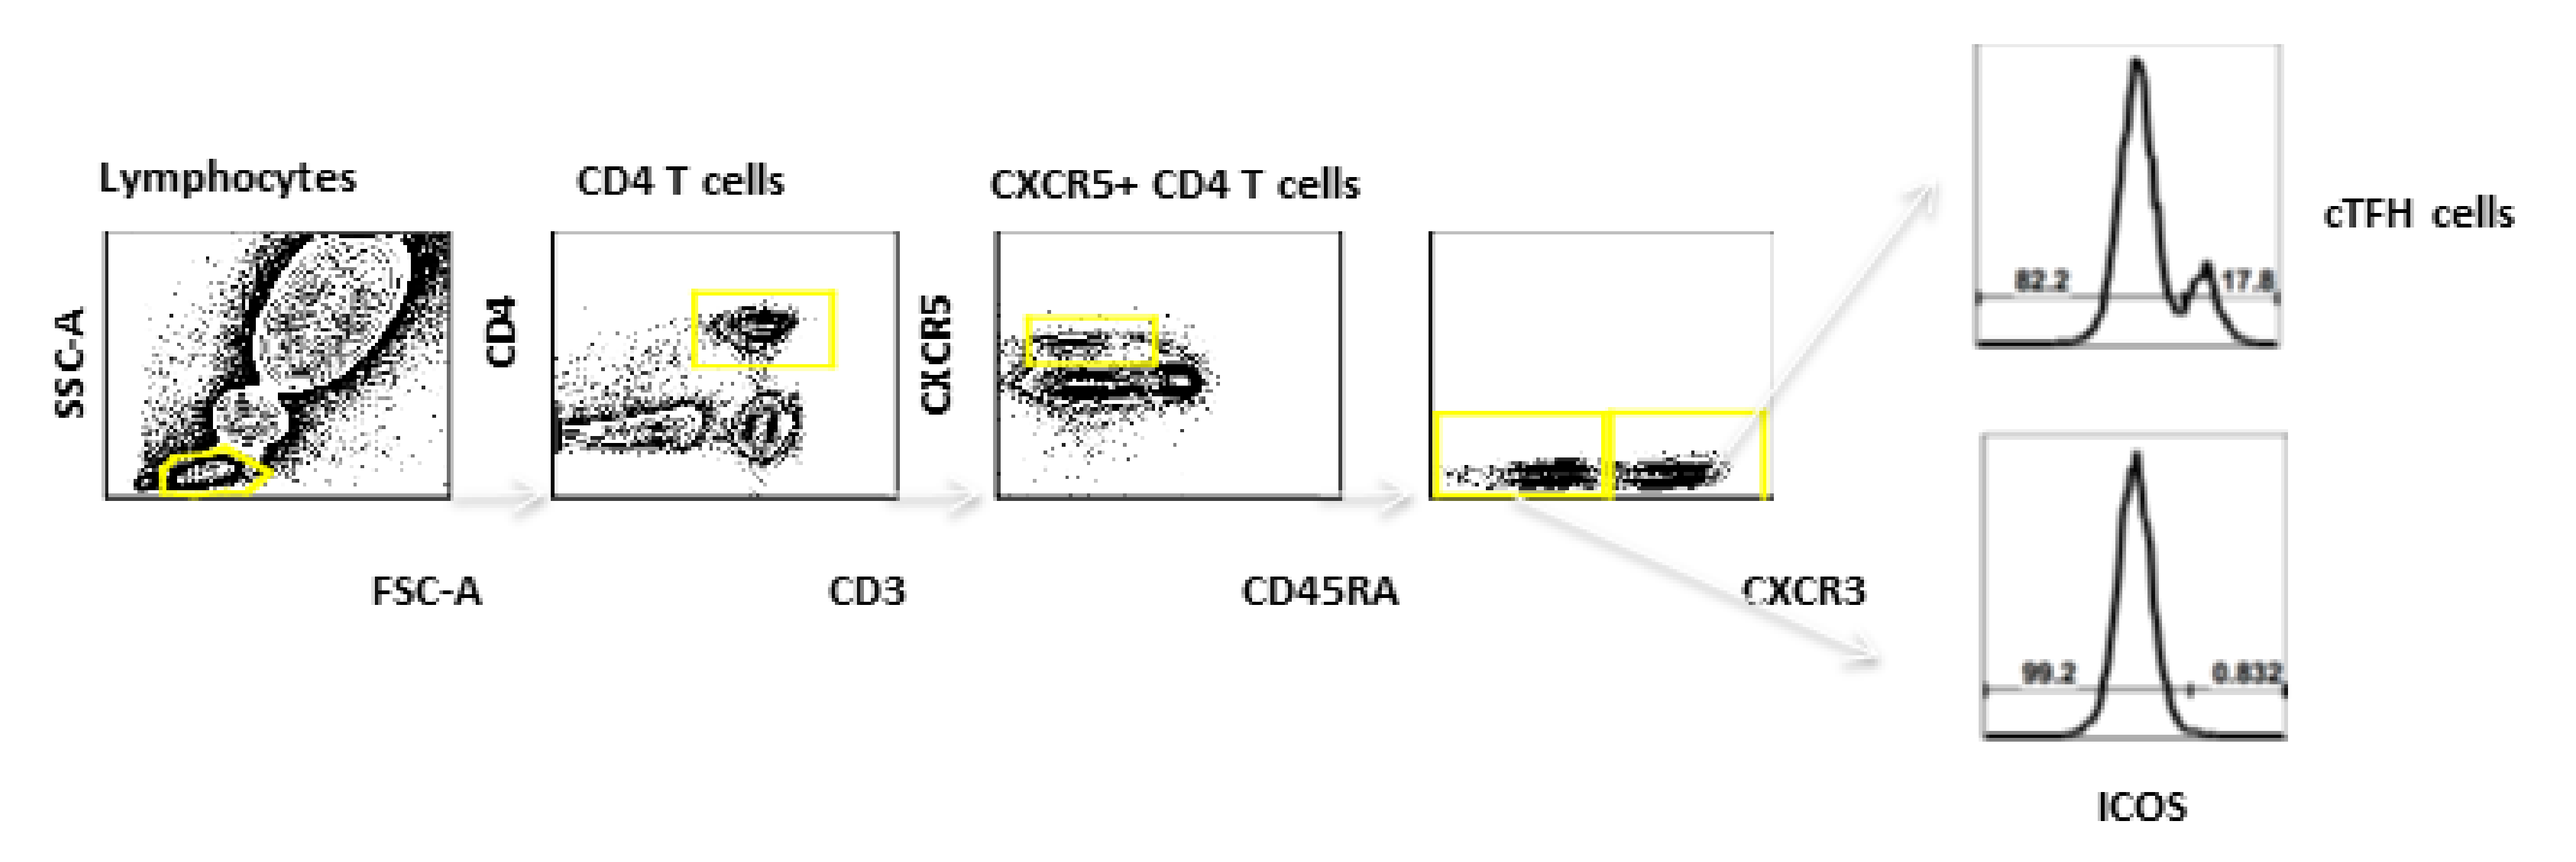
3.4. cTFH Cells
3.5. MBCs
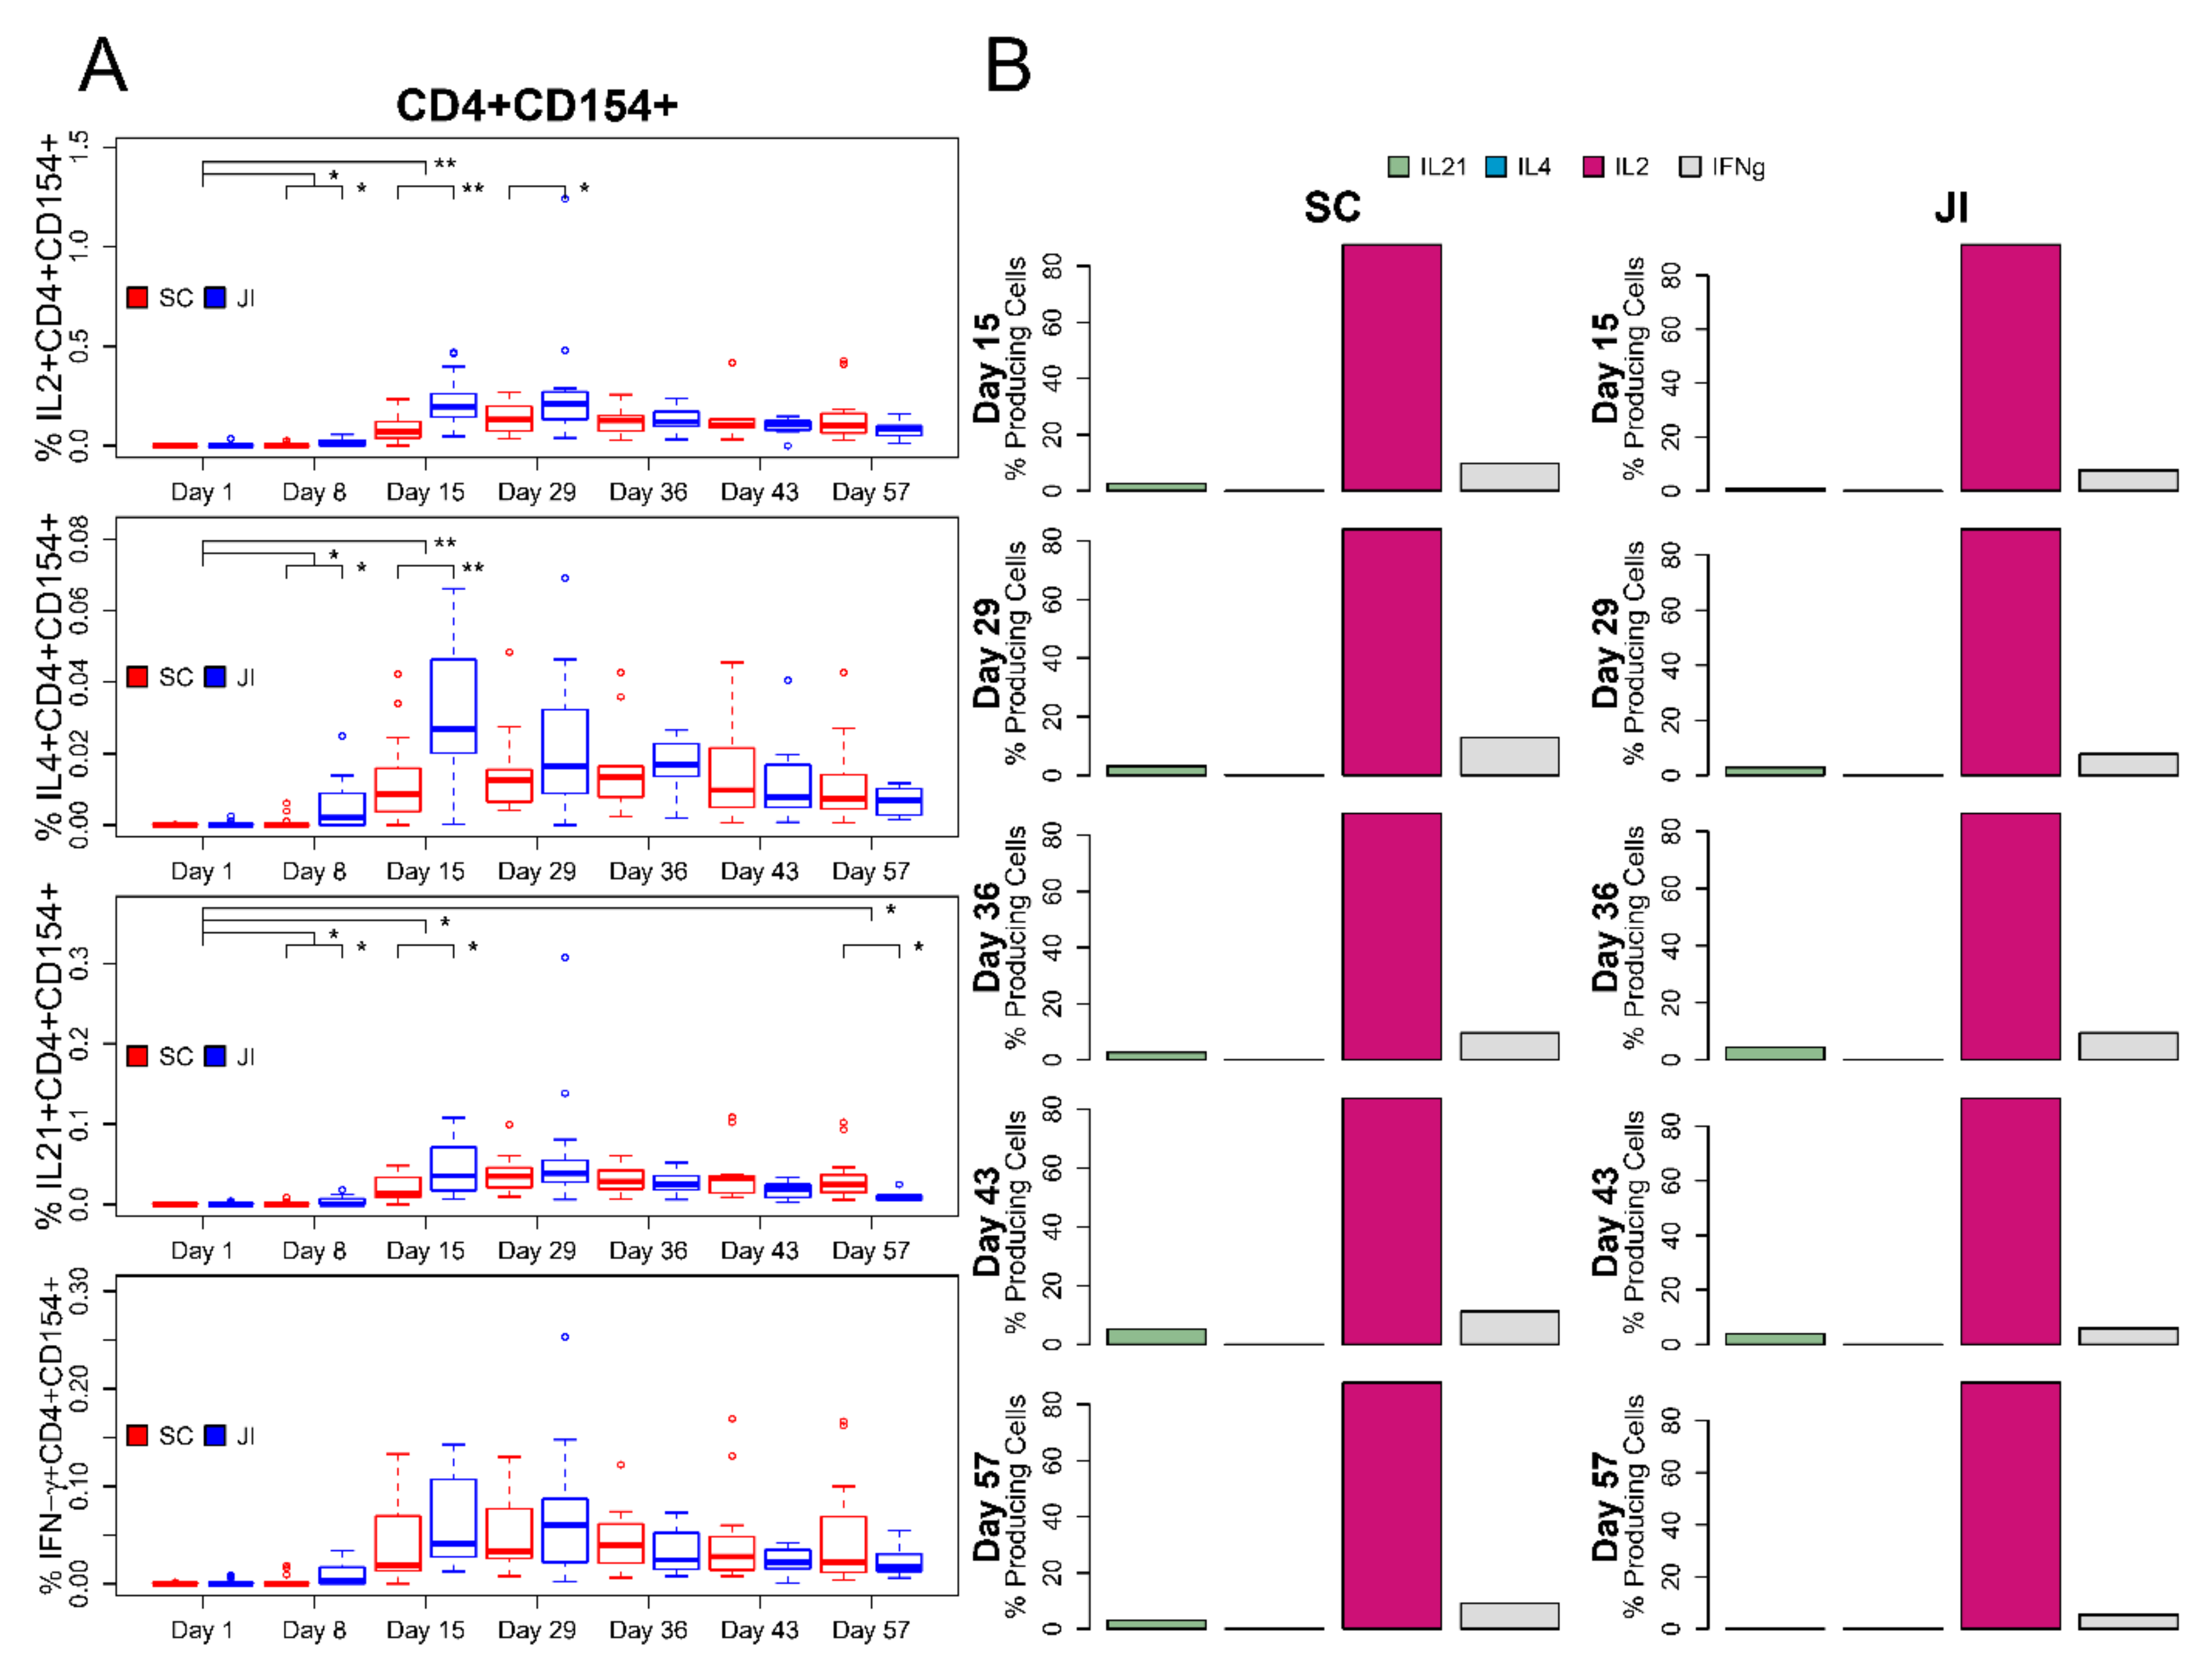
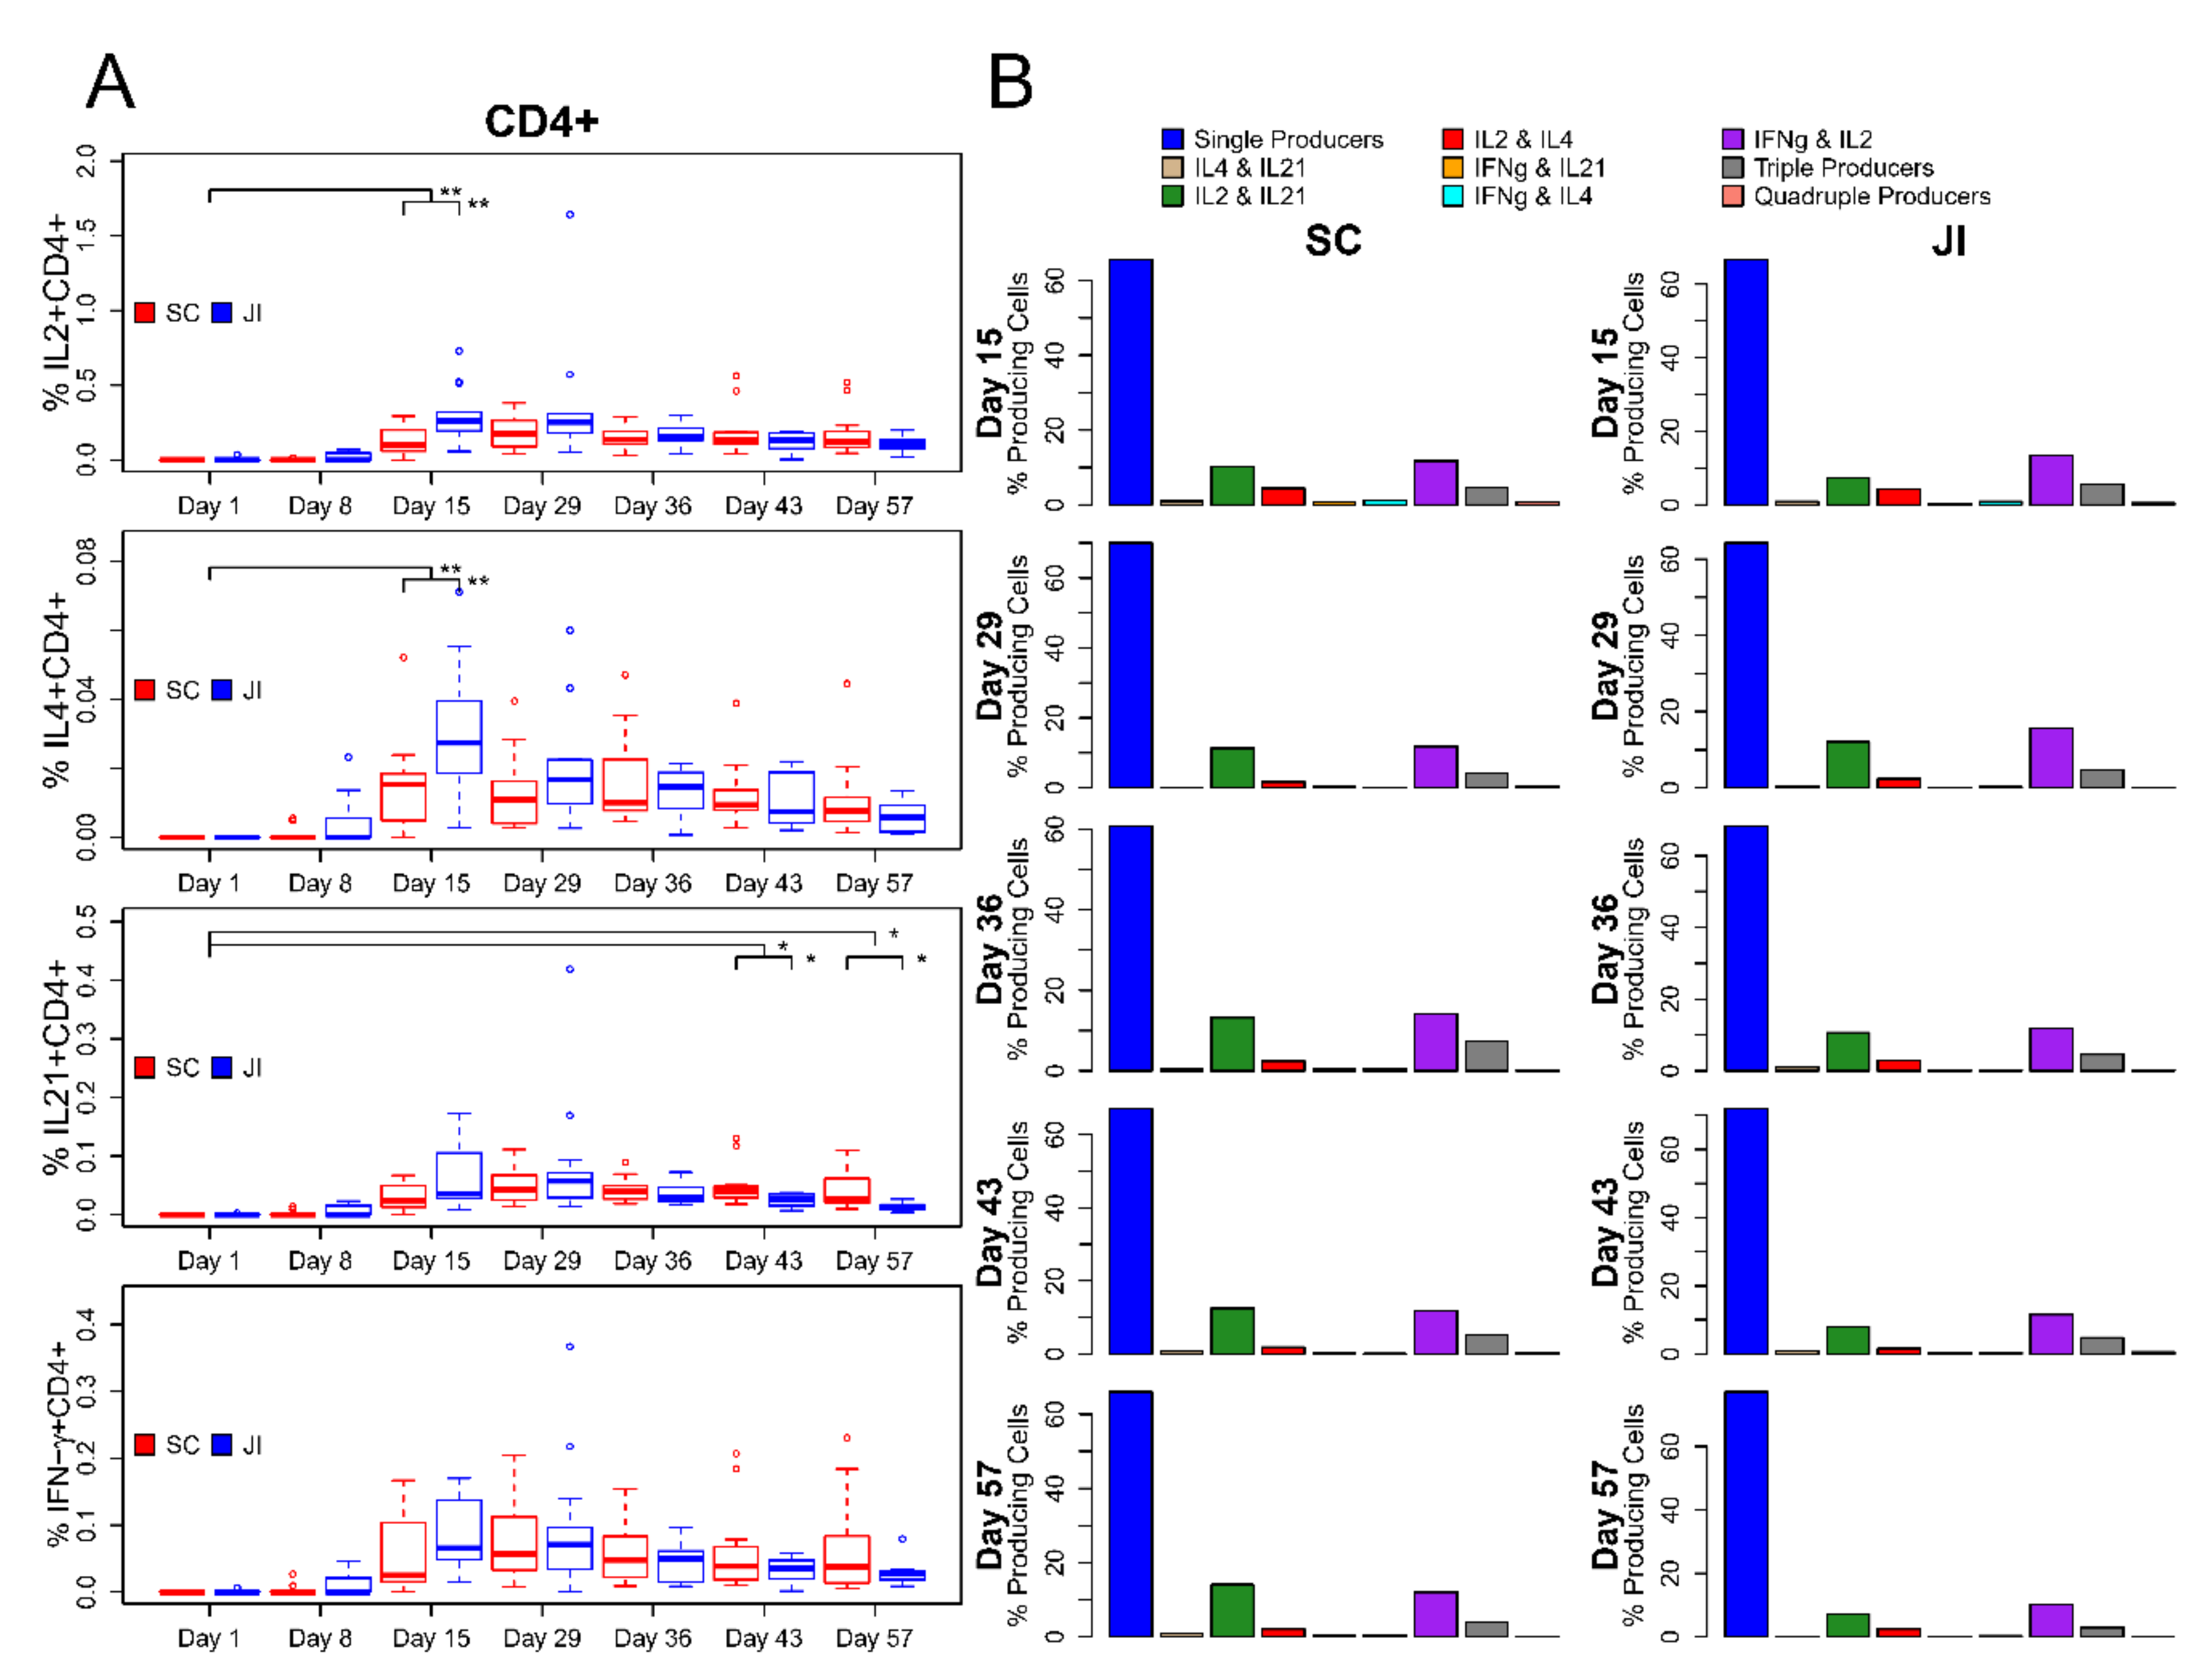
3.6. ICS Assay
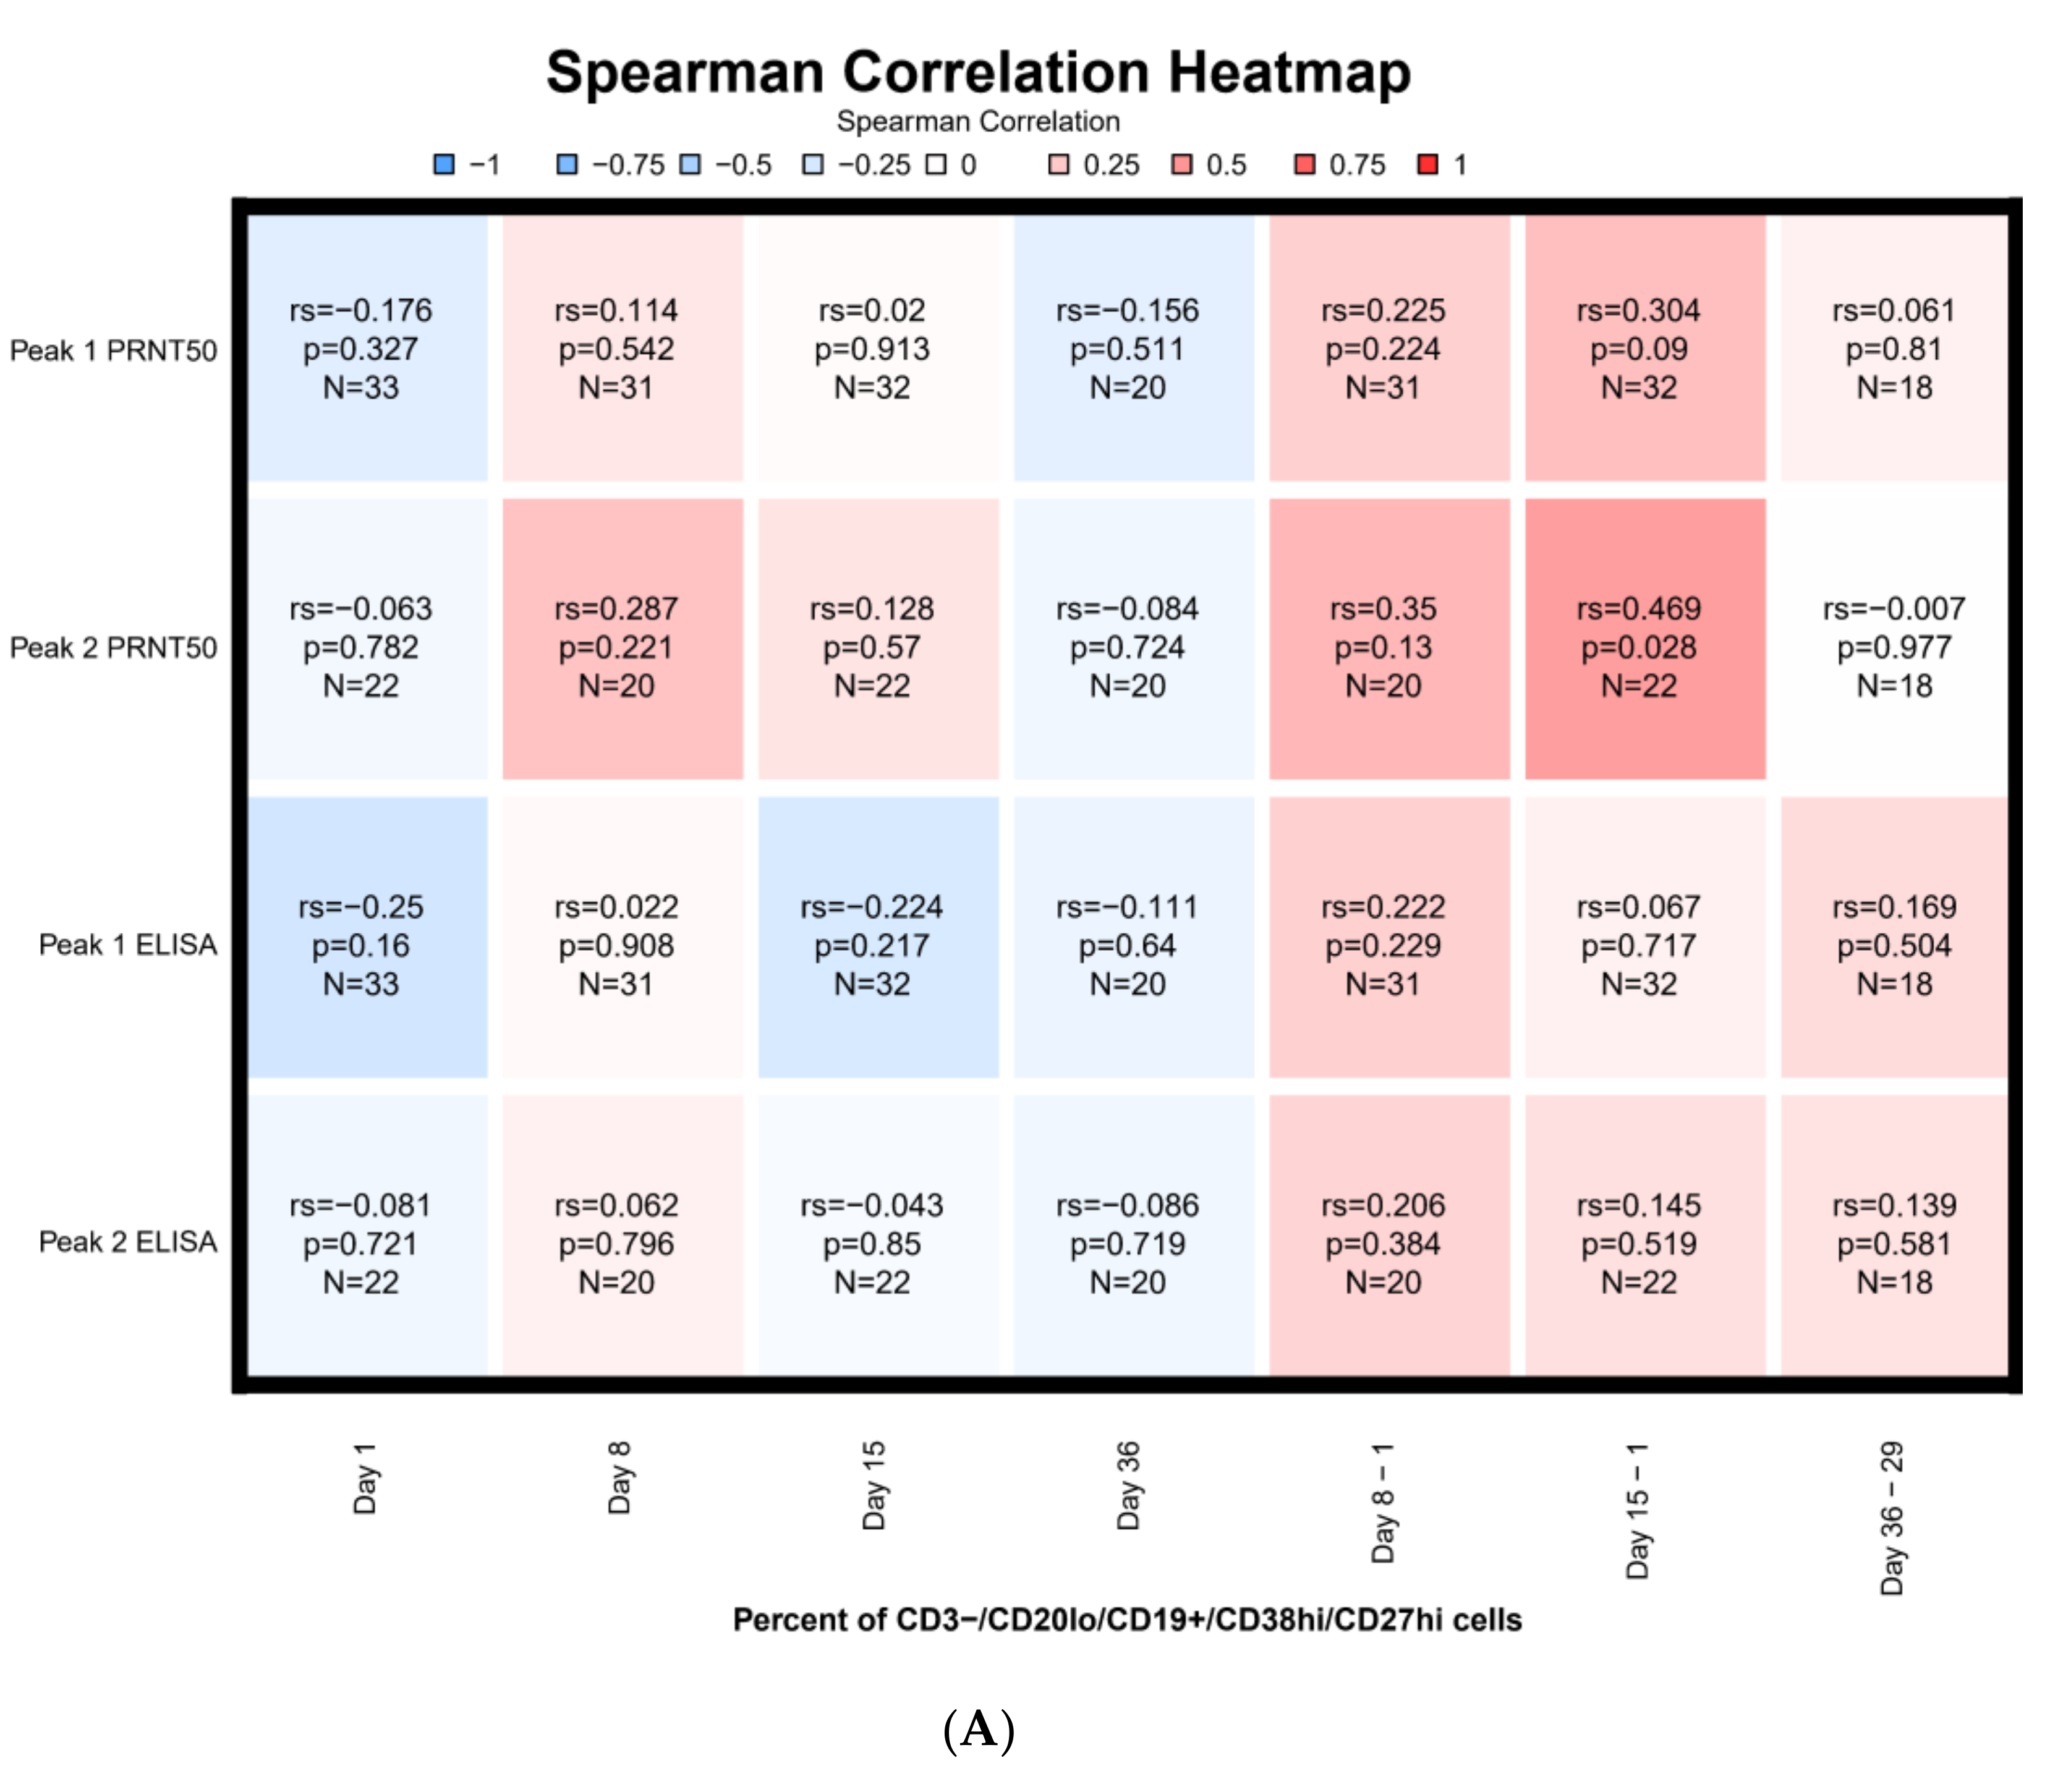
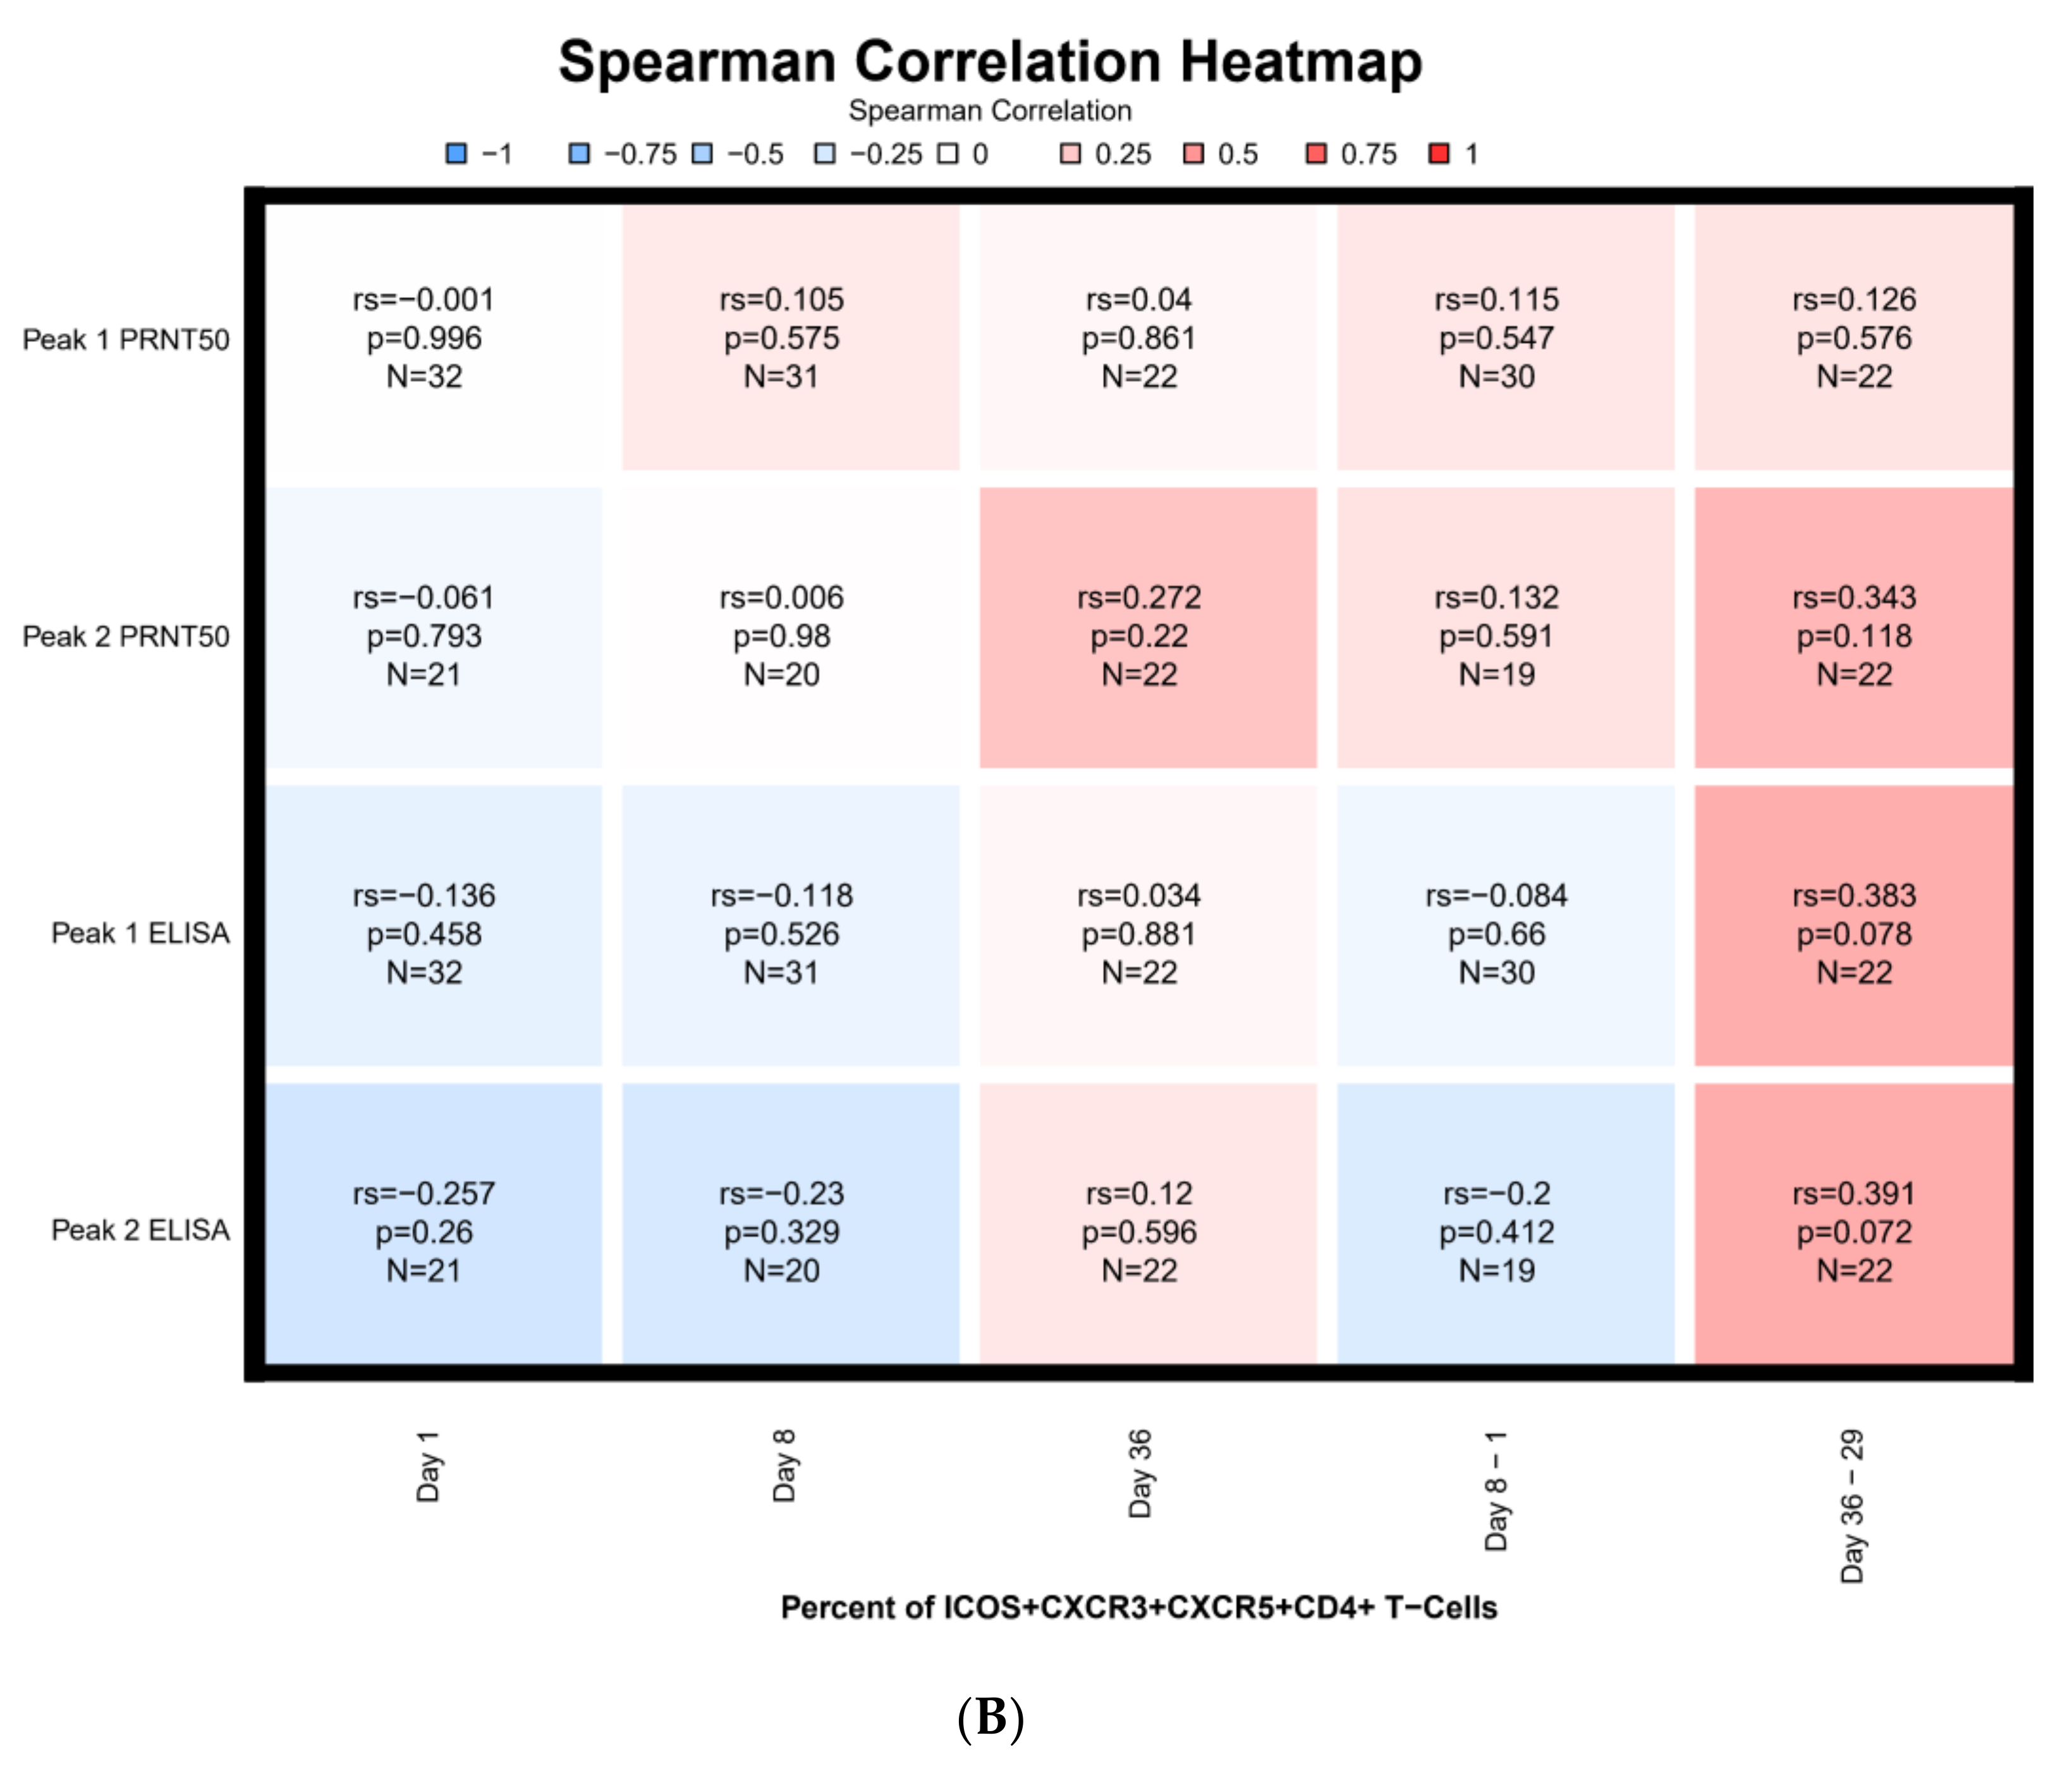
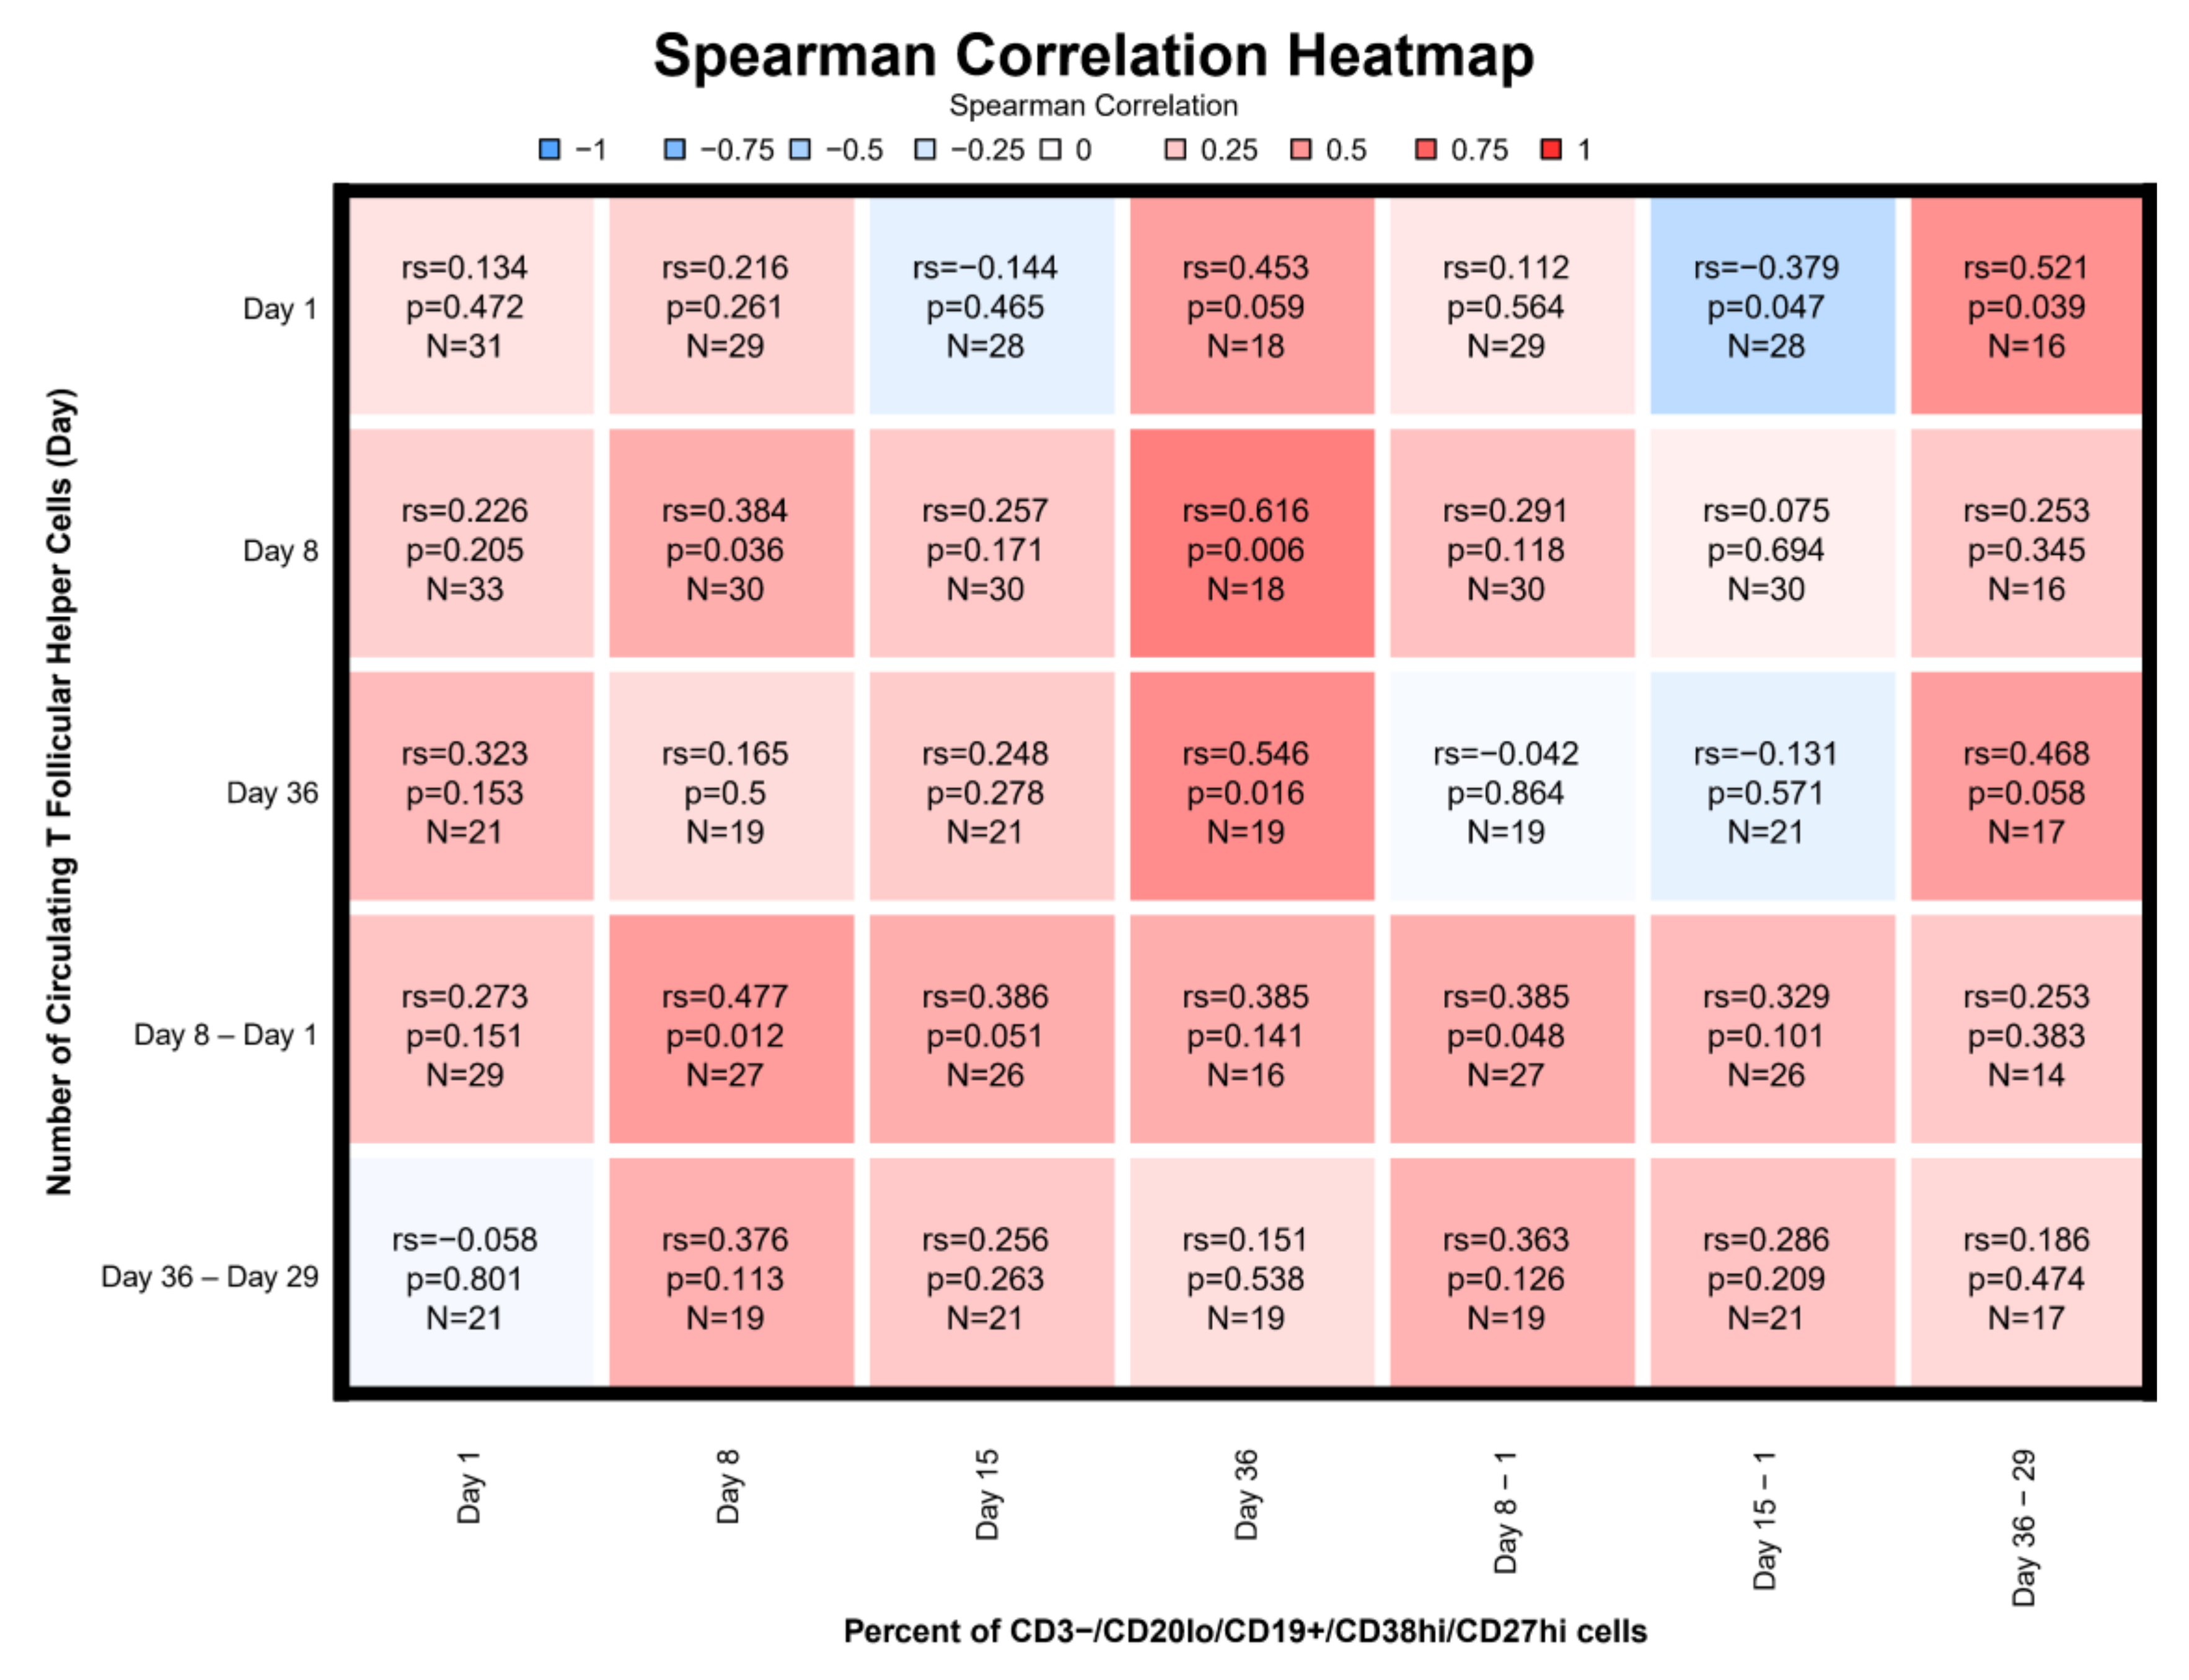
3.7. Correlations
4. Discussion
5. Conclusions
Author Contributions
Funding
Acknowledgments
Conflicts of Interest
Appendix A
Phenotyping Assays
Intracellular Cytokine Staining
Memory B Cells ELISpot Assays
Appendix B

| SC | JI | |
|---|---|---|
| PEAK1 | ||
| n | 18 | 15 |
| Geometric Mean | 20 | 26 |
| Geometric 95% CI | 9–45 | 13–49 |
| PEAK2 | ||
| n | 13 | 9 |
| Geometric Mean | 114 | 219 |
| Geometric 95% CI | 59–221 | 122–395 |
| SC | JI | |
|---|---|---|
| PEAK1 | ||
| n | 18 | 15 |
| Geometric Mean | 200 | 378 |
| Geometric 95% CI | 118–338 | 286–500 |
| PEAK2 | ||
| n | 13 | 9 |
| Geometric Mean | 970 | 2401 |
References
- Fenner, F. Smallpox: Emergence, global spread, and eradication. Hist. Philos. Life Sci. 1993, 15, 397–420. [Google Scholar]
- Henderson, D.A.; Inglesby, T.V.; Bartlett, J.G.; Ascher, M.S.; Eitzen, E.; Jahrling, P.B.; Hauer, J.; Layton, M.; McDade, J.; Osterholm, M.T.; et al. Smallpox as a biological weapon: Medical and public health management. Working Group on Civilian Biodefense. JAMA 1999, 281, 2127–2137. [Google Scholar] [CrossRef]
- Lane, J.M.; Ruben, F.L.; Neff, J.M.; Millar, J.D. Complications of smallpox vaccination, 1968. N. Engl. J. Med. 1969, 281, 1201–1208. [Google Scholar] [CrossRef] [PubMed]
- Grabenstein, J.D.; Winkenwerder, W., Jr. US military smallpox vaccination program experience. JAMA 2003, 289, 3278–3282. [Google Scholar] [CrossRef] [PubMed] [Green Version]
- Von Krempelhuber, A.; Vollmar, J.; Pokorny, R.; Rapp, P.; Wulff, N.; Petzold, B.; Handley, A.; Mateo, L.; Siersbol, H.; Kollaritsch, H.; et al. A randomized, double-blind, dose-finding Phase II study to evaluate immunogenicity and safety of the third generation smallpox vaccine candidate IMVAMUNE. Vaccine 2010, 28, 1209–1216. [Google Scholar] [CrossRef] [PubMed] [Green Version]
- Pittman, P.R.; Hahn, M.; Lee, H.S.; Koca, C.; Samy, N.; Schmidt, D.; Hornung, J.; Weidenthaler, H.; Heery, C.R.; Meyer, T.P.H.; et al. Phase 3 Efficacy Trial of Modified Vaccinia Ankara as a Vaccine against Smallpox. N. Engl. J. Med. 2019, 381, 1897–1908. [Google Scholar] [CrossRef] [PubMed]
- Slifka, M.K.; Antia, R.; Whitmire, J.K.; Ahmed, R. Humoral immunity due to long-lived plasma cells. Immunity 1998, 8, 363–372. [Google Scholar] [CrossRef] [Green Version]
- Crotty, S.; Felgner, P.; Davies, H.; Glidewell, J.; Villarreal, L.; Ahmed, R. Cutting edge: Long-term B cell memory in humans after smallpox vaccination. J. Immunol. 2003, 171, 4969–4973. [Google Scholar] [CrossRef] [Green Version]
- Wyatt, L.S.; Earl, P.L.; Eller, L.A.; Moss, B. Highly attenuated smallpox vaccine protects mice with and without immune deficiencies against pathogenic vaccinia virus challenge. Proc. Natl. Acad. Sci. USA 2004, 101, 4590–4595. [Google Scholar] [CrossRef] [Green Version]
- Bentebibel, S.E.; Lopez, S.; Obermoser, G.; Schmitt, N.; Mueller, C.; Harrod, C.; Flano, E.; Mejias, A.; Albrecht, R.A.; Blankenship, D.; et al. Induction of ICOS+CXCR3+CXCR5+TH cells correlates with antibody responses to influenza vaccination. Sci. Transl. Med. 2013, 5, 176ra132. [Google Scholar] [CrossRef] [Green Version]
- Morita, R.; Schmitt, N.; Bentebibel, S.E.; Ranganathan, R.; Bourdery, L.; Zurawski, G.; Foucat, E.; Dullaers, M.; Oh, S.; Sabzghabaei, N.; et al. Human blood CXCR5(+)CD4(+) T cells are counterparts of T follicular cells and contain specific subsets that differentially support antibody secretion. Immunity 2011, 34, 108–121. [Google Scholar] [CrossRef] [PubMed] [Green Version]
- He, J.; Tsai, L.M.; Leong, Y.A.; Hu, X.; Ma, C.S.; Chevalier, N.; Sun, X.; Vandenberg, K.; Rockman, S.; Ding, Y.; et al. Circulating precursor CCR7(lo)PD-1(hi) CXCR5(+) CD4(+) T cells indicate Tfh cell activity and promote antibody responses upon antigen reexposure. Immunity 2013, 39, 770–781. [Google Scholar] [CrossRef] [Green Version]
- Herati, R.S.; Reuter, M.A.; Dolfi, D.V.; Mansfield, K.D.; Aung, H.; Badwan, O.Z.; Kurupati, R.K.; Kannan, S.; Ertl, H.; Schmader, K.E.; et al. Circulating CXCR5+PD-1+ response predicts influenza vaccine antibody responses in young adults but not elderly adults. J. Immunol. 2014, 193, 3528–3537. [Google Scholar] [CrossRef] [PubMed] [Green Version]
- Matsui, K.; Adelsberger, J.W.; Kemp, T.J.; Baseler, M.W.; Ledgerwood, J.E.; Pinto, L.A. Circulating CXCR5(+)CD4(+) T Follicular-Like Helper Cell and Memory B Cell Responses to Human Papillomavirus Vaccines. PLoS ONE 2015, 10, e0137195. [Google Scholar] [CrossRef] [PubMed] [Green Version]
- Cardeno, A.; Magnusson, M.K.; Quiding-Jarbrink, M.; Lundgren, A. Activated T follicular helper-like cells are released into blood after oral vaccination and correlate with vaccine specific mucosal B-cell memory. Sci. Rep. 2018, 8, 2729. [Google Scholar] [CrossRef] [PubMed]
- Wrammert, J.; Smith, K.; Miller, J.; Langley, W.A.; Kokko, K.; Larsen, C.; Zheng, N.Y.; Mays, I.; Garman, L.; Helms, C.; et al. Rapid cloning of high-affinity human monoclonal antibodies against influenza virus. Nature 2008, 453, 667–671. [Google Scholar] [CrossRef] [Green Version]
- Jackson, L.A.; Frey, S.E.; El Sahly, H.M.; Mulligan, M.J.; Winokur, P.L.; Kotloff, K.L.; Campbell, J.D.; Atmar, R.L.; Graham, I.; Anderson, E.J.; et al. Safety and immunogenicity of a modified vaccinia Ankara vaccine using three immunization schedules and two modes of delivery: A randomized clinical non-inferiority trial. Vaccine 2017, 35, 1675–1682. [Google Scholar] [CrossRef]
- Frey, S.E.; Winokur, P.L.; Salata, R.A.; El-Kamary, S.S.; Turley, C.B.; Walter, E.B., Jr.; Hay, C.M.; Newman, F.K.; Hill, H.R.; Zhang, Y.; et al. Safety and immunogenicity of IMVAMUNE(R) smallpox vaccine using different strategies for a post event scenario. Vaccine 2013, 31, 3025–3033. [Google Scholar] [CrossRef] [Green Version]
- Overton, E.T.; Stapleton, J.; Frank, I.; Hassler, S.; Goepfert, P.A.; Barker, D.; Wagner, E.; von Krempelhuber, A.; Virgin, G.; Meyer, T.P.; et al. Safety and immunogenicity of modified vaccinia Ankara-Bavarian Nordic smallpox vaccine in vaccinia-naive and experienced human immunodeficiency virus-infected individuals: An open-label, controlled clinical Phase II trial. Open Forum Infect. Dis. 2015, 2, ofv040. [Google Scholar] [CrossRef]
- Wrammert, J.; Koutsonanos, D.; Li, G.M.; Edupuganti, S.; Sui, J.; Morrissey, M.; McCausland, M.; Skountzou, I.; Hornig, M.; Lipkin, W.I.; et al. Broadly cross-reactive antibodies dominate the human B cell response against 2009 pandemic H1N1 influenza virus infection. J. Exp. Med. 2011, 208, 181–193. [Google Scholar] [CrossRef]
- Crotty, S.; Aubert, R.D.; Glidewell, J.; Ahmed, R. Tracking human antigen-specific memory B cells: A sensitive and generalized ELISPOT system. J. Immunol. Methods 2004, 286, 111–122. [Google Scholar] [CrossRef] [PubMed]
- Moss, B. Smallpox vaccines: Targets of protective immunity. Immunol. Rev. 2011, 239, 8–26. [Google Scholar] [CrossRef] [PubMed]
- Crotty, S. Follicular helper CD4 T cells (TFH). Annu. Rev. Immunol. 2011, 29, 621–663. [Google Scholar] [CrossRef] [PubMed]
- Priyamvada, L.; Cho, A.; Onlamoon, N.; Zheng, N.Y.; Huang, M.; Kovalenkov, Y.; Chokephaibulkit, K.; Angkasekwinai, N.; Pattanapanyasat, K.; Ahmed, R.; et al. B Cell Responses during Secondary Dengue Virus Infection Are Dominated by Highly Cross-Reactive, Memory-Derived Plasmablasts. J. Virol. 2016, 90, 5574–5585. [Google Scholar] [CrossRef] [PubMed] [Green Version]
- Wrammert, J.; Onlamoon, N.; Akondy, R.S.; Perng, G.C.; Polsrila, K.; Chandele, A.; Kwissa, M.; Pulendran, B.; Wilson, P.C.; Wittawatmongkol, O.; et al. Rapid and massive virus-specific plasmablast responses during acute dengue virus infection in humans. J. Virol. 2012, 86, 2911–2918. [Google Scholar] [CrossRef] [Green Version]
- Geldenhuys, H.D.; Mearns, H.; Foster, J.; Saxon, E.; Kagina, B.; Saganic, L.; Jarrahian, C.; Tameris, M.D.; Dintwe, O.B.; Van Rooyen, M.; et al. A randomized clinical trial in adults and newborns in South Africa to compare the safety and immunogenicity of bacille Calmette-Guerin (BCG) vaccine administration via a disposable-syringe jet injector to conventional technique with needle and syringe. Vaccine 2015, 33, 4719–4726. [Google Scholar] [CrossRef] [Green Version]
- Graham, B.S.; Enama, M.E.; Nason, M.C.; Gordon, I.J.; Peel, S.A.; Ledgerwood, J.E.; Plummer, S.A.; Mascola, J.R.; Bailer, R.T.; Roederer, M.; et al. DNA vaccine delivered by a needle-free injection device improves potency of priming for antibody and CD8+ T-cell responses after rAd5 boost in a randomized clinical trial. PLoS ONE 2013, 8, e59340. [Google Scholar] [CrossRef]
- Gaudinski, M.R.; Houser, K.V.; Morabito, K.M.; Hu, Z.; Yamshchikov, G.; Rothwell, R.S.; Berkowitz, N.; Mendoza, F.; Saunders, J.G.; Novik, L.; et al. Safety, tolerability, and immunogenicity of two Zika virus DNA vaccine candidates in healthy adults: Randomised, open-label, phase 1 clinical trials. Lancet 2018, 391, 552–562. [Google Scholar] [CrossRef] [Green Version]


© 2020 by the authors. Licensee MDPI, Basel, Switzerland. This article is an open access article distributed under the terms and conditions of the Creative Commons Attribution (CC BY) license (http://creativecommons.org/licenses/by/4.0/).
Share and Cite
Anderson, E.J.; Lai, L.; Wrammert, J.; Kabbani, S.; Xu, Y.; Priyamvada, L.; Hill, H.; Goll, J.B.; Jensen, T.L.; Kao, C.; et al. Plasmablast, Memory B Cell, CD4+ T Cell, and Circulating Follicular Helper T Cell Responses to a Non-Replicating Modified Vaccinia Ankara Vaccine. Vaccines 2020, 8, 69. https://doi.org/10.3390/vaccines8010069
Anderson EJ, Lai L, Wrammert J, Kabbani S, Xu Y, Priyamvada L, Hill H, Goll JB, Jensen TL, Kao C, et al. Plasmablast, Memory B Cell, CD4+ T Cell, and Circulating Follicular Helper T Cell Responses to a Non-Replicating Modified Vaccinia Ankara Vaccine. Vaccines. 2020; 8(1):69. https://doi.org/10.3390/vaccines8010069
Chicago/Turabian StyleAnderson, Evan J., Lilin Lai, Jens Wrammert, Sarah Kabbani, Yongxian Xu, Lalita Priyamvada, Heather Hill, Johannes B. Goll, Travis L. Jensen, Carol Kao, and et al. 2020. "Plasmablast, Memory B Cell, CD4+ T Cell, and Circulating Follicular Helper T Cell Responses to a Non-Replicating Modified Vaccinia Ankara Vaccine" Vaccines 8, no. 1: 69. https://doi.org/10.3390/vaccines8010069
APA StyleAnderson, E. J., Lai, L., Wrammert, J., Kabbani, S., Xu, Y., Priyamvada, L., Hill, H., Goll, J. B., Jensen, T. L., Kao, C., Yildirim, I., Rouphael, N., Jackson, L., & Mulligan, M. J. (2020). Plasmablast, Memory B Cell, CD4+ T Cell, and Circulating Follicular Helper T Cell Responses to a Non-Replicating Modified Vaccinia Ankara Vaccine. Vaccines, 8(1), 69. https://doi.org/10.3390/vaccines8010069