
Breakthrough Tick-Borne Encephalitis and Epidemiological Trends in an Endemic Region in Poland: A Retrospective Hospital-Based Study, 1988–2020


Abstract
1. Introduction
2. Materials and Methods
2.1. Study Design and Population
2.2. Definition of TBE
2.3. Data Collection
2.4. Definitions of Vaccination Status
2.5. Statistical Analysis
2.5.1. Vaccine Effectiveness Calculation
2.5.2. Estimation of the Epidemiological Measures
2.6. Ethical Considerations
3. Results
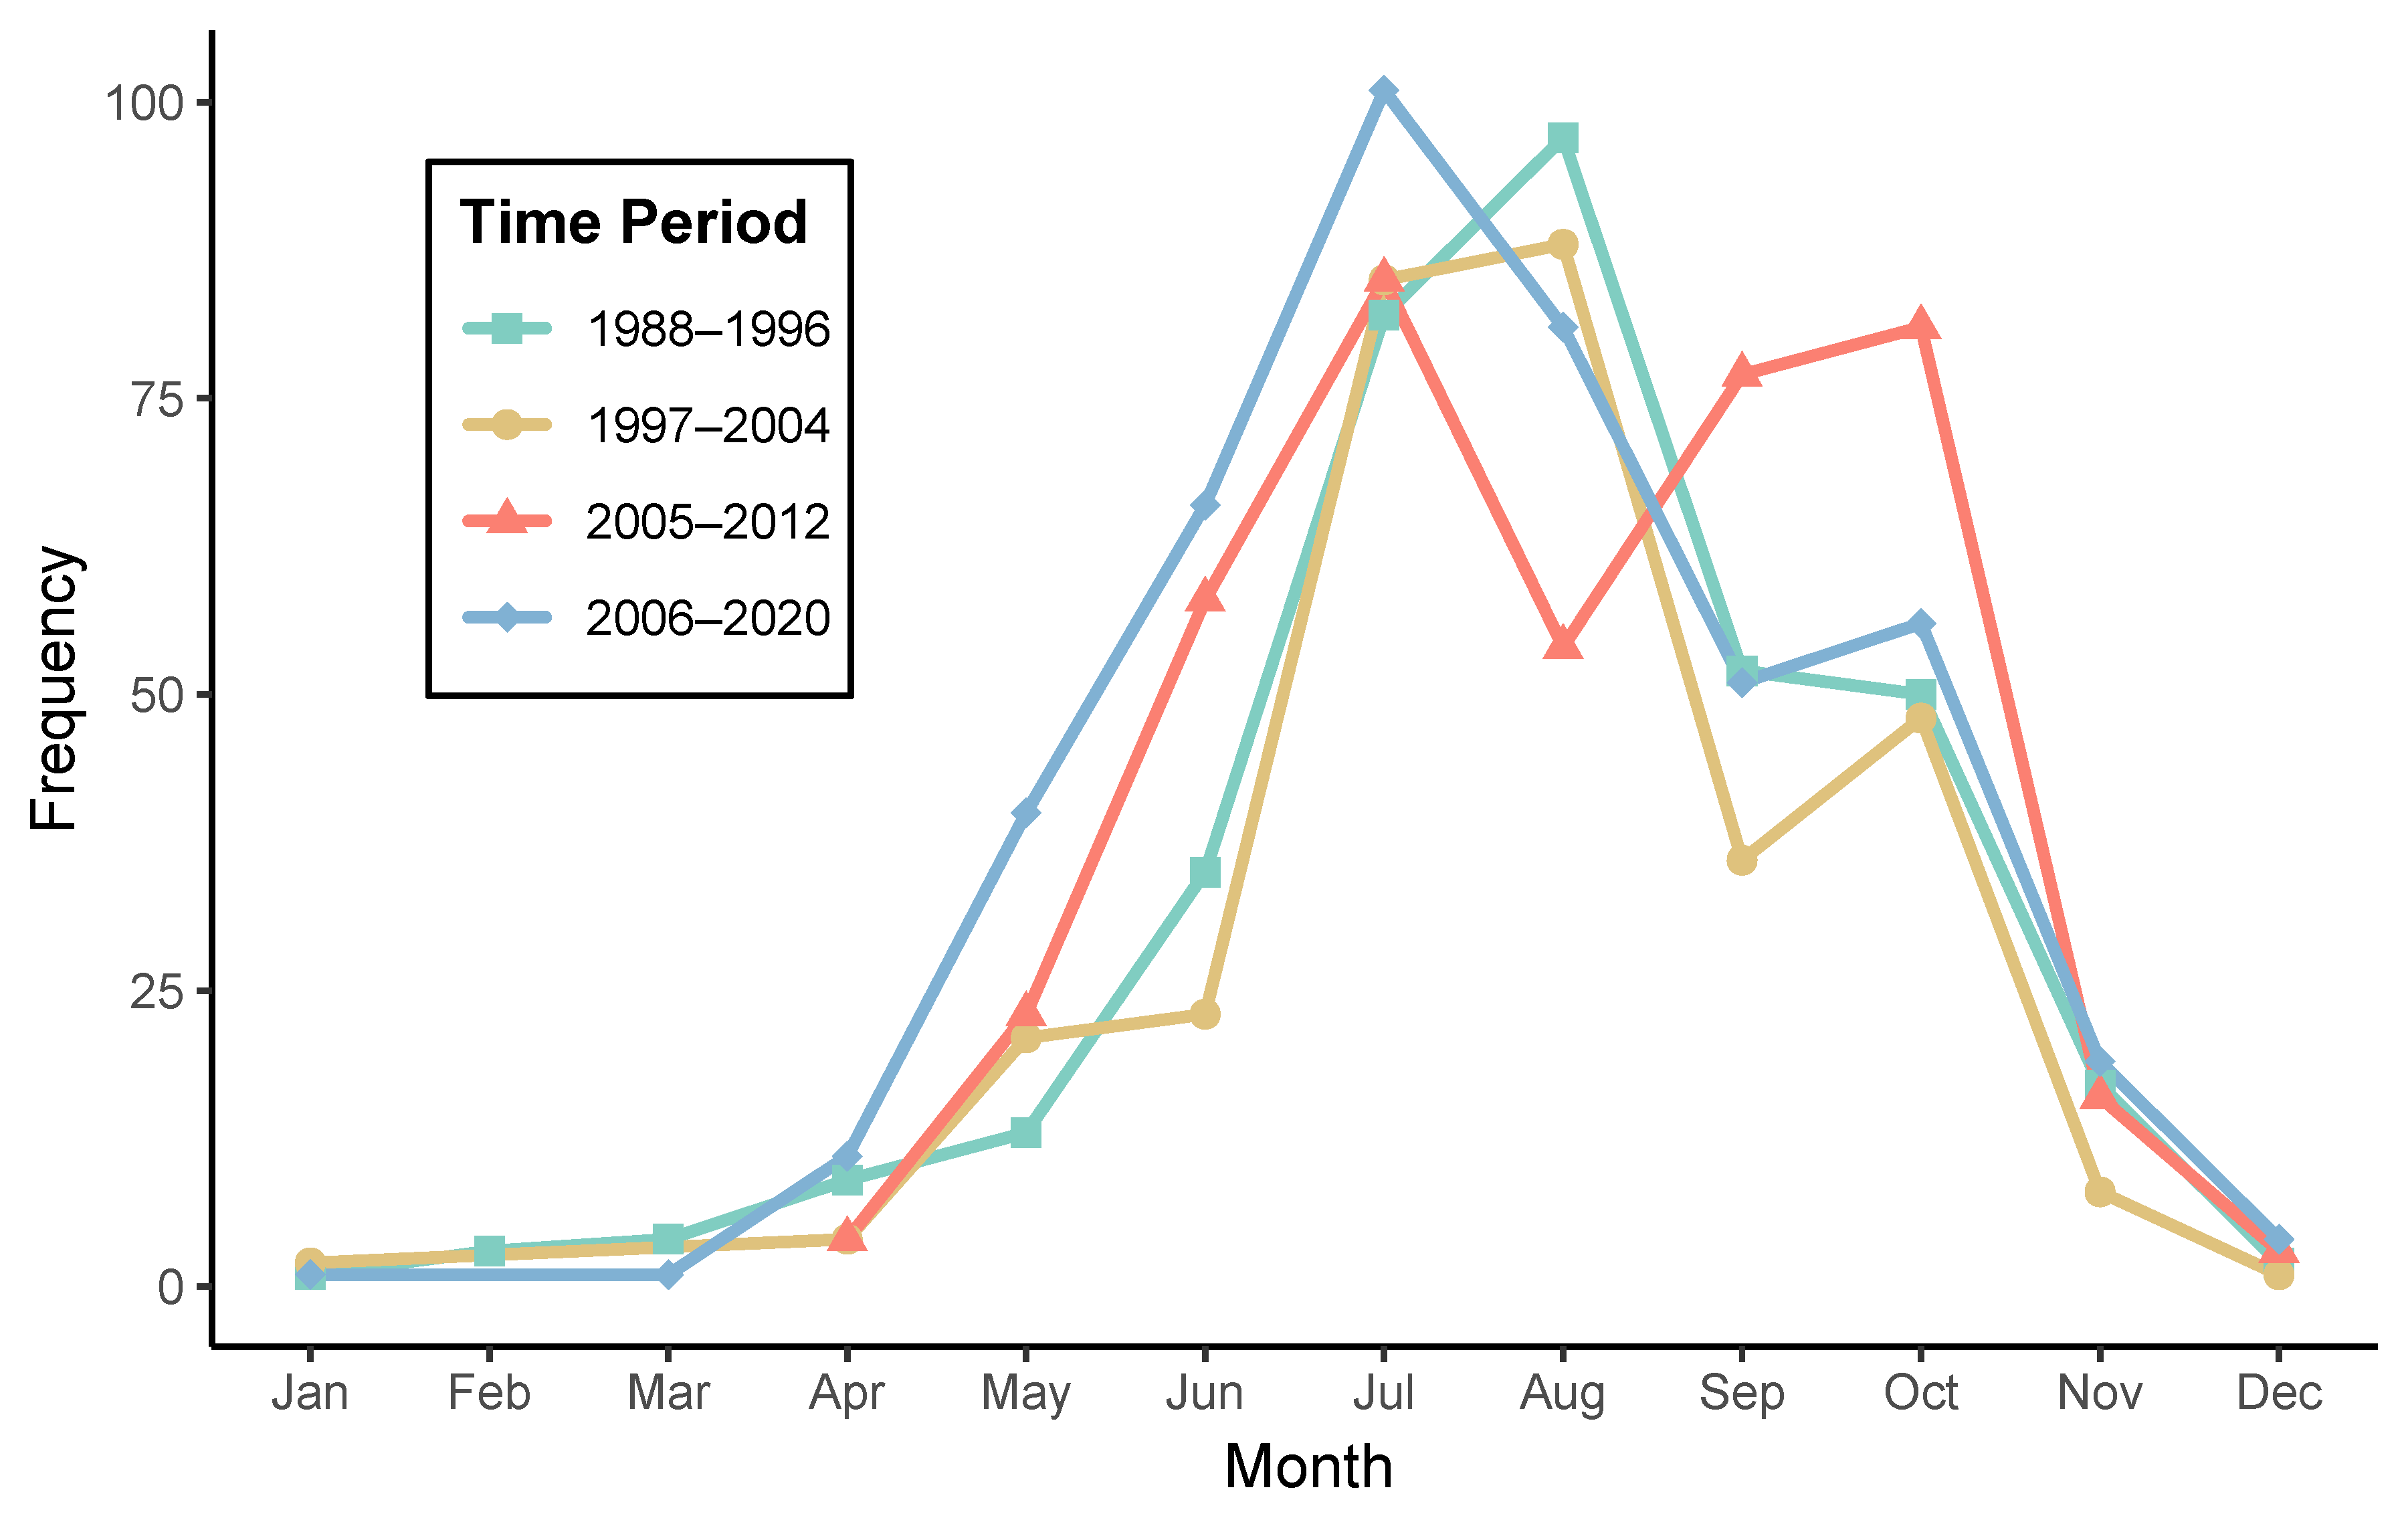
3.1. Epidemiology
3.2. Clinical Findings
3.3. Laboratory Findings
3.4. Vaccine Effectiveness
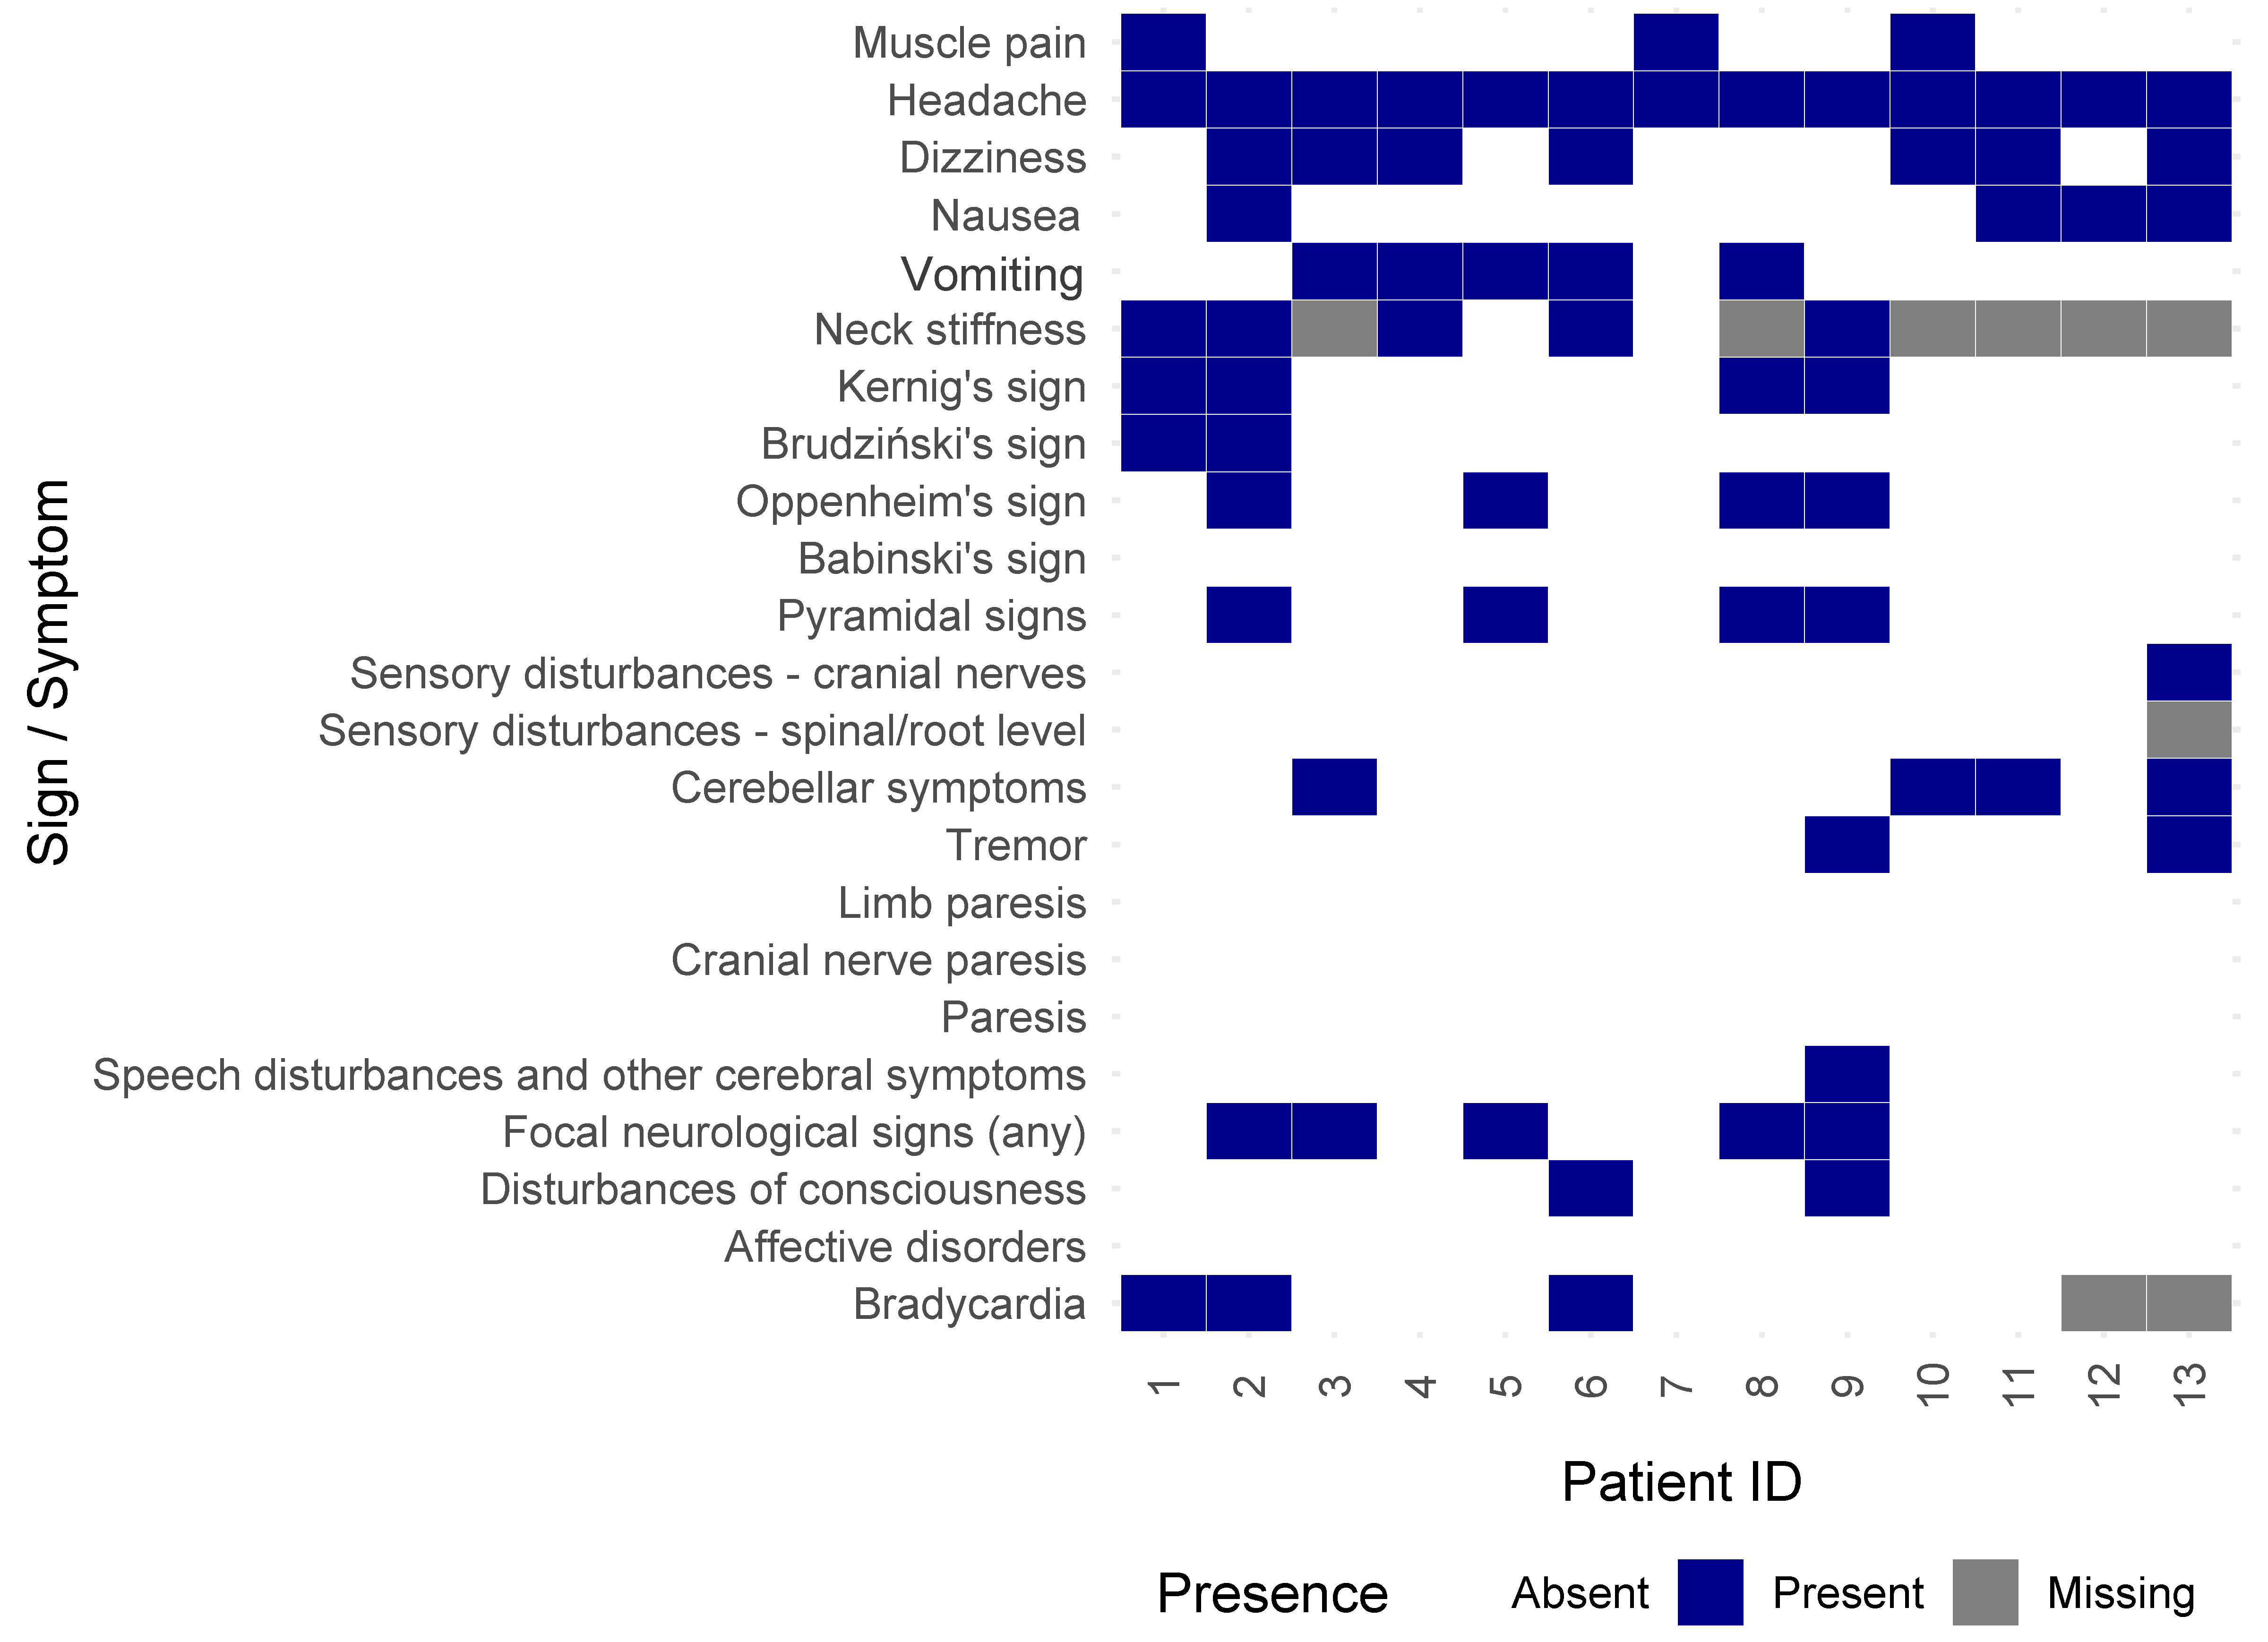
3.5. Case Studies of Patients Hospitalized with TBE Despite Vaccination
4. Discussion
5. Conclusions
Supplementary Materials
Author Contributions
Funding
Institutional Review Board Statement
Informed Consent Statement
Data Availability Statement
Conflicts of Interest
Abbreviations
| CI | Confidence interval |
| CNS | Central nervous system |
| CSF | Cerebrospinal fluid |
| ECDC | European Centre for Disease Prevention and Control |
| IgG | Immunoglobulin G |
| IgM | Immunoglobulin M |
| IQR | Interquartile range |
| IRR | Incidence rate ratio |
| Mdn | Median |
| OR | Odds ratio |
| SD | Standard deviation |
| TBE | Tick-borne encephalitis |
| TBEV | Tick-borne encephalitis virus |
| VBI | Vaccine breakthrough infections |
| VE | Vaccine effectiveness |
References
- Amicizia, D.; Domnich, A.; Panatto, D.; Lai, P.L.; Cristina, M.L.; Avio, U.; Gasparini, R. Epidemiology of Tick-Borne Encephalitis (TBE) in Europe and Its Prevention by Available Vaccines. Hum. Vaccin. Immunother. 2013, 9, 1163–1171. [Google Scholar] [CrossRef] [PubMed]
- Venkatesan, A. Emerging Infectious Encephalitides. Curr. Opin. Neurol. 2021, 34, 410–416. [Google Scholar] [CrossRef] [PubMed]
- Dekker, M.; Laverman, G.D.; de Vries, A.; Reimerink, J.; Geeraedts, F. Emergence of Tick-Borne Encephalitis (TBE) in the Netherlands. Ticks Tick-Borne Dis. 2019, 10, 176–179. [Google Scholar] [CrossRef]
- Haglund, M.; Günther, G. Tick-Borne Encephalitis--Pathogenesis, Clinical Course and Long-Term Follow-Up. Vaccine 2003, 21 (Suppl. 1), S11–S18. [Google Scholar] [CrossRef]
- Nygren, T.M.; Pilic, A.; Böhmer, M.M.; Wagner-Wiening, C.; Wichmann, O.; Harder, T.; Hellenbrand, W. Tick-Borne Encephalitis Vaccine Effectiveness and Barriers to Vaccination in Germany. Sci. Rep. 2022, 12, 11706. [Google Scholar] [CrossRef]
- Beran, J.; Lattanzi, M.; Costantini, M.; Pammolli, A.; Galgani, I. Sustained Antibody Persistence for at Least 15 Years after a Booster Vaccination against Tick-Borne Encephalitis Following Different Primary Vaccination Schedules: Third 5-Year Follow-Up. Vaccine 2023, 41, 3518–3524. [Google Scholar] [CrossRef]
- Narodowy Instytut Zdrowia Publicznego—Państwowy Zakład Higieny. Available online: https://www.pzh.gov.pl/ (accessed on 22 April 2025).
- Hansson, K.E.; Rosdahl, A.; Insulander, M.; Vene, S.; Lindquist, L.; Gredmark-Russ, S.; Askling, H.H. Tick-Borne Encephalitis Vaccine Failures: A 10-Year Retrospective Study Supporting the Rationale for Adding an Extra Priming Dose in Individuals Starting at Age 50 Years. Clin. Infect Dis. 2020, 70, 245–251. [Google Scholar] [CrossRef] [PubMed]
- Heinz, F.X.; Holzmann, H.; Essl, A.; Kundi, M. Field Effectiveness of Vaccination against Tick-Borne Encephalitis. Vaccine 2007, 25, 7559–7567. [Google Scholar] [CrossRef]
- Santonja, I.; Stiasny, K.; Essl, A.; Heinz, F.X.; Kundi, M.; Holzmann, H. Tick-Borne Encephalitis in Vaccinated Patients: A Retrospective Case-Control Study and Analysis of Vaccination Field Effectiveness in Austria From 2000 to 2018. J. Infect Dis. 2023, 227, 512–521. [Google Scholar] [CrossRef]
- Bojkiewicz, E.; Toczylowski, K.; Grygorczuk, S.; Zelazowska-Rutkowska, B.; Dunaj, J.; Zebrowska, A.; Czupryna, P.; Moniuszko-Malinowska, A.; Sulik, A. The Prevalence of Asymptomatic Infections with Tick-Borne Encephalitis Virus and Attitude towards Tick-Borne Encephalitis Vaccine in the Endemic Area of Northeastern Poland. Vaccines 2022, 10, 1294. [Google Scholar] [CrossRef]
- Makowski, D.; Lüdecke, D.; Patil, I.; Thériault, R.; Ben-Shachar, M.S.; Wiernik, B.M. Automated Results Reporting as a Practical Tool to Improve Reproducibility and Methodological Best Practices Adoption (R Package Report). Posit Software, PBC. 2023. Available online: https://cran.r-project.org/web/packages/report/index.html (accessed on 22 April 2025).
- Sjoberg, D.D.; Whiting, K.; Curry, M.; Lavery, J.A.; Larmarange, J. Reproducible Summary Tables with the Gtsummary Package. R J. 2021, 13, 570–580. [Google Scholar] [CrossRef]
- Wickham, H.; Chang, W.; Henry, L.; Pedersen, T.L.; Takahashi, K.; Wilke, C.; Woo, K.; Yutani, H.; Dunnington, D.; van den Brand, T.; et al. ggplot2: Create Elegant Data Visualisations Using the Grammar of Graphics (R Package). Posit Software, PBC. 2024. Available online: https://cran.r-project.org/web/packages/ggplot2/index.html (accessed on 22 April 2025).
- Wickham, H.; François, R.; Henry, L.; Müller, K.; Vaughan, D. dplyr: A Grammar of Data Manipulation (R Package Version). Posit Software, PBC. 2023. Available online: https://cran.r-project.org/web/packages/dplyr/index.html (accessed on 22 April 2025).
- Wickham, H.; Vaughan, D.; Girlich, M.; Ushey, K. tidyr: Tidy Messy Data (R Package). Posit Software, PBC. 2024. Available online: https://cran.r-project.org/web/packages/tidyr/index.html (accessed on 22 April 2025).
- Woolf, B. On estimating the relation between blood group and disease. Ann. Hum. Genet. 1955, 19, 251–253. [Google Scholar] [CrossRef] [PubMed]
- Lotrič-Furlan, S.; Bogovič, P.; Avšič-Županc, T.; Jelovšek, M.; Lusa, L.; Strle, F. Tick-Borne Encephalitis in Patients Vaccinated against This Disease. J. Intern. Med. 2017, 282, 142–155. [Google Scholar] [CrossRef]
- Dobler, G.; Kaier, K.; Hehn, P.; Böhmer, M.M.; Kreusch, T.M.; Borde, J.P. Tick-Borne Encephalitis Virus Vaccination Breakthrough Infections in Germany: A Retrospective Analysis from 2001 to 2018. Clin. Microbiol. Infect. 2020, 26, 1090.e7–1090.e13. [Google Scholar] [CrossRef]
- Aregay, A.; Slunečko, J.; Korva, M.; Bogovic, P.; Resman Rus, K.; Knap, N.; Beicht, J.; Kubinski, M.; Saletti, G.; Avšič-Županc, T.; et al. Tick-Borne Encephalitis Vaccine Breakthrough Infections Induce Aberrant T Cell and Antibody Responses to Non-Structural Proteins. npj Vaccines 2024, 9, 141. [Google Scholar] [CrossRef]
- Grgič-Vitek, M.; Avšič-Županc, T.; Klavs, I. Tick-Borne Encephalitis after Vaccination: Vaccine Failure or Misdiagnosis. Vaccine 2010, 28, 7396–7400. [Google Scholar] [CrossRef] [PubMed]
- Wagner, J.N.; Sonnberger, M.; Troescher, A.; Krehan, I.; Hauser, A.; Panholzer, J.; von Oertzen, T.J. Patients with Breakthrough Tick-Borne Encephalitis Suffer a More Severe Clinical Course and Display Extensive Magnetic Resonance Imaging Changes. Eur. J. Neurol. 2020, 27, 1201–1209. [Google Scholar] [CrossRef]
- Andrejkovits, Á.V.; Huțanu, A.; Manu, D.R.; Dobreanu, M.; Văsieșiu, A.M. Dynamic Changes in Lymphocyte Populations and Their Relationship with Disease Severity and Outcome in COVID-19. Int. J. Mol. Sci. 2024, 25, 11921. [Google Scholar] [CrossRef]
- Schmidt, A.J.; Altpeter, E.; Graf, S.; Steffen, R. Tick-Borne Encephalitis (TBE) in Switzerland: Does the Prolongation of Vaccine Booster Intervals Result in an Increased Risk of Breakthroughs? J. Travel. Med. 2022, 29, taab158. [Google Scholar] [CrossRef]
- Rubel, F.; Brugger, K. Tick-Borne Encephalitis Incidence Forecasts for Austria, Germany, and Switzerland. Ticks Tick-Borne Dis. 2020, 11, 101437. [Google Scholar] [CrossRef]
- Henao-Restrepo, A.M.; Camacho, A.; Longini, I.M.; Watson, C.H.; Edmunds, W.J.; Egger, M.; Carroll, M.W.; Dean, N.E.; Diatta, I.; Doumbia, M.; et al. Efficacy and Effectiveness of an rVSV-Vectored Vaccine in Preventing Ebola Virus Disease: Final Results from the Guinea Ring Vaccination, Open-Label, Cluster-Randomised Trial (Ebola Ça Suffit!). Lancet 2017, 389, 505–518. [Google Scholar] [CrossRef] [PubMed]


| Time Period | Season | Total Hospitalizations | Number of Months | Average Count |
|---|---|---|---|---|
| 1988–1996 | Cold | 36 | 6 | 6.0 |
| Warm | 329 | 6 | 54.8 | |
| 1997–2004 | Cold | 15 | 4 | 3.8 |
| Warm | 301 | 6 | 50.2 | |
| 2005–2012 | Cold | 23 | 3 | 7.7 |
| Warm | 378 | 6 | 63.0 | |
| 2006–2020 | Cold | 36 | 5 | 7.2 |
| Warm | 395 | 6 | 65.8 |
| Characteristic | n | Overall Sample | Vaccination Against TBE | p c | |
|---|---|---|---|---|---|
| Yes n1 = 13 a | No n2 = 1505 a | ||||
| Demographic and general characteristics | |||||
| Age, years | 1516 | 43.00 (31.00, 57.00) b | 42.00 (38.00, 47.00) b | 44.00 (31.00, 57.00) b | 0.743 e |
| Sex: | 1518 | 0.577 d | |||
| female | 583 (38.41%) | 6 (46.15%) | 577 (38.34%) | ||
| male | 935 (61.59%) | 7 (53.85%) | 928 (61.66%) | ||
| Locality: | 1515 | 0.648 d | |||
| city | 856 (56.50%) | 6 (50%) | 850 (56.55%) | ||
| village | 659 (43.50%) | 6 (50%) | 653 (43.45%) | ||
| Periods of hospitalization observations, seasonality, and durations | |||||
| Periods of observation: | 1518 | 0.051 | |||
| 1988–1996 | 370 (24.37%) | 0 (0%) | 370 (24.58%) | ||
| 1997–2004 | 316 (20.82%) | 2 (15.38%) | 314 (20.86%) | ||
| 2005–2012 | 401 (26.42%) | 7 (53.85%) | 394 (26.18%) | ||
| 2013–2020 | 431 (28.39%) | 4 (30.77%) | 427 (28.37%) | ||
| Season of hospitalization: | 1514 | 0.541 | |||
| winter | 17 (1.12%) | 0 (0%) | 17 (1.13%) | ||
| spring | 130 (8.59%) | 2 (15.38%) | 128 (8.53%) | ||
| summer | 856 (56.54%) | 8 (61.54%) | 848 (56.50%) | ||
| autumn | 511 (33.75%) | 3 (23.08%) | 508 (33.84%) | ||
| Duration of first hospitalization, days | 1449 | 19.00 (15.00, 27.00) b | 14.00 (12.50, 16.00) b | 19.00 (15.00, 27.00) b | 0.015 e |
| General symptoms | |||||
| Diagnosis: | 1480 | 1.000 | |||
| encephalomeningits | 471 (31.82%) | 4 (33.33%) | 467 (31.81%) | ||
| meningitis | 884 (59.73%) | 7 (58.33%) | 877 (59.74%) | ||
| meningoencephalomyelitis | 125 (8.45%) | 1 (8.33%) | 124 (8.45%) | ||
| Muscle pain | 1309 | 332 (25.36%) | 3 (23.08%) | 329 (25.39%) | 1.000 |
| Headache | 1315 | 1252 (95.21%) | 13 (100%) | 1239 (95.16%) | 1.000 d |
| Dizziness | 1314 | 538 (40.94%) | 7 (53.85%) | 531 (40.81%) | 0.342 d |
| Nausea | 1315 | 307 (23.35%) | 4 (30.77%) | 303 (23.27%) | 0.515 |
| Vomiting | 1315 | 441 (33.54%) | 5 (38.46%) | 436 (33.49%) | 0.770 d |
| Other symptoms | 1320 | 300 (22.73%) | 4 (30.77%) | 296 (22.65%) | 0.507 |
| Neurological and other symptoms | |||||
| Neck stiffness | 802 | 576 (71.82%) | 5 (71.43%) | 571 (71.82%) | 1.000 d |
| Kernig’s sign | 1307 | 652 (49.89%) | 4 (30.77%) | 648 (50.08%) | 0.166 |
| Brudziński’s sign | 1309 | 344 (26.28%) | 2 (15.38%) | 342 (26.39%) | 0.532 |
| Oppenheim’s sign | 1369 | 448 (32.72%) | 4 (30.77%) | 444 (32.74%) | 1.000 |
| Babinski’s sign | 1371 | 121 (8.82%) | 0 (0%) | 121 (8.90%) | 0.620 |
| Pyramidal signs | 1375 | 480 (34.91%) | 4 (30.77%) | 476 (34.95%) | 1.000 |
| Sensory disturbances—cranial nerves | 1373 | 36 (2.62%) | 1 (7.69%) | 35 (2.57%) | 0.293 |
| Sensory disturbances—spinal/root level | 1371 | 64 (4.67%) | 0 (0%) | 64 (4.71%) | 1.000 |
| Cerebellar symptoms | 1376 | 263 (19.11%) | 4 (30.77%) | 259 (19%) | 0.288 |
| Tremor | 1376 | 133 (9.67%) | 2 (15.38%) | 131 (9.61%) | 0.363 |
| Limb paresis | 1380 | 114 (8.26%) | 0 (0%) | 114 (8.34%) | 0.617 |
| Cranial nerve paresis | 1381 | 56 (4.06%) | 0 (0%) | 56 (4.09%) | 1.000 |
| Speech disturbances and other cerebral symptoms | 1383 | 26 (1.88%) | 1 (7.69%) | 25 (1.82%) | 0.219 |
| Focal neurological signs (any) | 1382 | 646 (46.74%) | 5 (38.46%) | 641 (46.82%) | 0.548 d |
| Disturbances of consciousness | 1386 | 393 (28.35%) | 2 (15.38%) | 391 (28.48%) | 0.372 |
| Bradycardia | 1327 | 130 (9.80%) | 3 (27.27%) | 127 (9.65%) | 0.084 |
| Differential blood count at admission | |||||
| Lymphocytes | 1062 | 1515.85 (1150.00, 2008.89) | 1167.26 (664.78, 1426.76) | 1520.00 (1152.82, 2010.67) | 0.087 |
| Neutrophils | 747 | 6751.80 (4862.50, 8845.00) | 7310.00 (5930.00, 9070.00) | 6745.56 (4856.25, 8839.85) | 0.999 |
| Monocytes | 858 | 700.00 (158.50, 1000.00) | 800.00 (420.48, 880.00) | 700.00 (130.00, 1000.00) | 0.716 |
| Eosinophils | 803 | 10.00 (0.00, 76.09) | 0.00 (0.00, 19.01) | 10.00 (0.00, 77.00) | 0.317 |
| Basophils | 803 | 0.00 (0.00, 20.00) | 8.92 (0.00, 9.85) | 0.00 (0.00, 20.00) | 0.651 |
Disclaimer/Publisher’s Note: The statements, opinions and data contained in all publications are solely those of the individual author(s) and contributor(s) and not of MDPI and/or the editor(s). MDPI and/or the editor(s) disclaim responsibility for any injury to people or property resulting from any ideas, methods, instructions or products referred to in the content. |
© 2025 by the authors. Licensee MDPI, Basel, Switzerland. This article is an open access article distributed under the terms and conditions of the Creative Commons Attribution (CC BY) license (https://creativecommons.org/licenses/by/4.0/).
Share and Cite
Sulik-Wakulińska, M.; Toczyłowski, K.; Grygorczuk, S. Breakthrough Tick-Borne Encephalitis and Epidemiological Trends in an Endemic Region in Poland: A Retrospective Hospital-Based Study, 1988–2020. Vaccines 2025, 13, 665. https://doi.org/10.3390/vaccines13070665
Sulik-Wakulińska M, Toczyłowski K, Grygorczuk S. Breakthrough Tick-Borne Encephalitis and Epidemiological Trends in an Endemic Region in Poland: A Retrospective Hospital-Based Study, 1988–2020. Vaccines. 2025; 13(7):665. https://doi.org/10.3390/vaccines13070665
Chicago/Turabian StyleSulik-Wakulińska, Magdalena, Kacper Toczyłowski, and Sambor Grygorczuk. 2025. "Breakthrough Tick-Borne Encephalitis and Epidemiological Trends in an Endemic Region in Poland: A Retrospective Hospital-Based Study, 1988–2020" Vaccines 13, no. 7: 665. https://doi.org/10.3390/vaccines13070665
APA StyleSulik-Wakulińska, M., Toczyłowski, K., & Grygorczuk, S. (2025). Breakthrough Tick-Borne Encephalitis and Epidemiological Trends in an Endemic Region in Poland: A Retrospective Hospital-Based Study, 1988–2020. Vaccines, 13(7), 665. https://doi.org/10.3390/vaccines13070665