
Effectiveness of Heterologous and Homologous Ad26.COV2.S Vaccine Boosting in Preventing COVID-19-Related Outcomes Among Individuals with a Completed Primary Vaccination Series in the United States

 and
and
Abstract
1. Introduction
2. Materials and Methods
2.1. Data
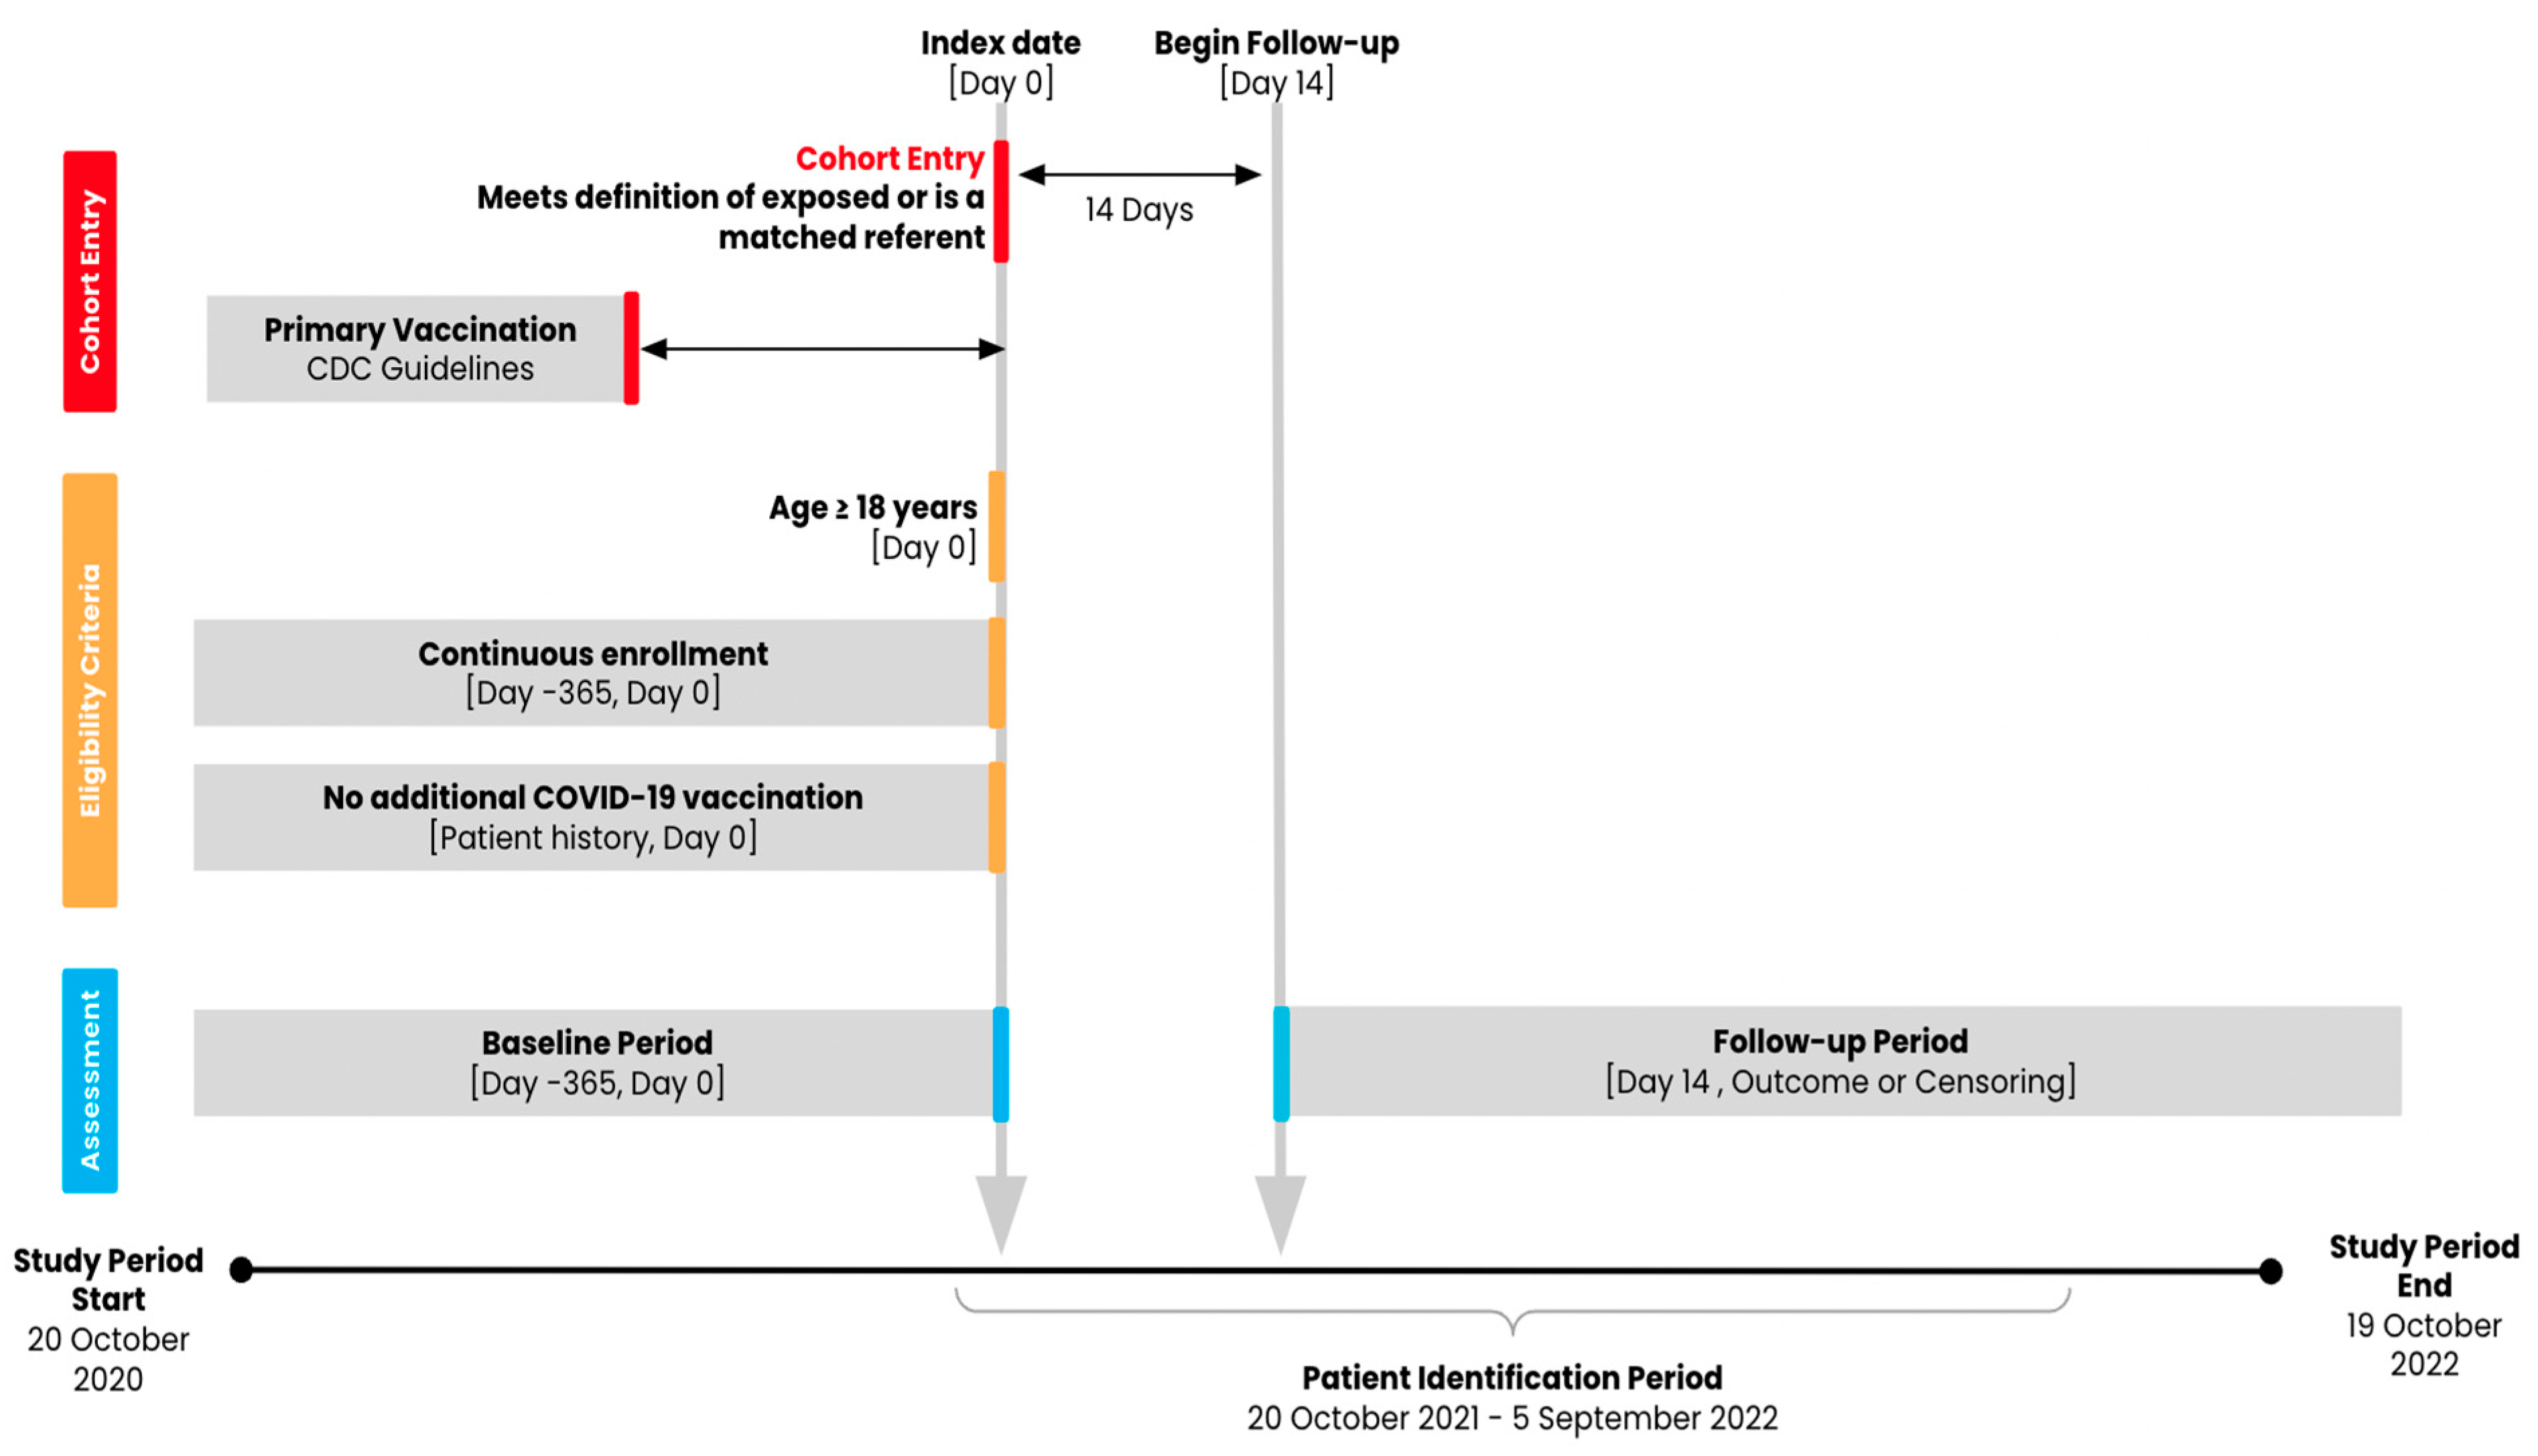
2.2. Population and Exposure
2.3. Follow-Up and Outcomes
2.4. Participant Characteristics
2.5. Statistical Analysis
3. Results
3.1. Descriptive Statistics
3.1.1. Contrast: mRNA + Ad26.COV2.S vs. mRNA + No Boost
3.1.2. Contrast: mRNA + Ad26.COV2.S vs. Ad26.COV2.S + No Boost
3.1.3. Contrast: Ad26.COV2.S + Ad26.COV2.S vs. mRNA + No Boost
3.1.4. Contrast: Ad26.COV2.S + Ad26.COV2.S vs. Ad26.COV2.S + No Boost
3.2. Main Results
4. Discussion
5. Conclusions
Supplementary Materials
Author Contributions
Funding
Institutional Review Board Statement
Informed Consent Statement
Data Availability Statement
Conflicts of Interest
References
- Steele, M.K.; Couture, A.; Reed, C.; Iuliano, D.; Whitaker, M.; Fast, H.; Hall, A.J.; MacNeil, A.; Cadwell, B.; Marks, K.J.; et al. Estimated Number of COVID-19 Infections, Hospitalizations, and Deaths Prevented Among Vaccinated Persons in the US, December 2020 to September 2021. JAMA Netw. Open 2022, 5, e2220385. [Google Scholar] [CrossRef]
- Yamana, T.K.; Galanti, M.; Pei, S.; Di Fusco, M.; Angulo, F.J.; Moran, M.M.; Khan, F.; Swerdlow, D.L.; Shaman, J. The Impact of COVID-19 Vaccination in the US: Averted Burden of SARS-CoV-2-Related Cases, Hospitalizations and Deaths. PLoS ONE 2023, 18, e0275699. [Google Scholar] [CrossRef]
- Authorizations of Emergency Use of Certain Biological Products During the COVID-19 Pandemic Availability. Available online: https://www.federalregister.gov/documents/2021/05/27/2021-11234/authorizations-of-emergency-use-of-certain-biological-products-during-the-covid-19-pandemic (accessed on 15 February 2024).
- Vaccine Monitor: Eagerness to Get Vaccinated Begins to Level Off as Most People Who Want a Vaccine Have Gotten One, but Republicans Show Biggest Shift Toward Vaccination. KFF. 2021. Available online: https://www.kff.org/coronavirus-covid-19/press-release/vaccine-monitor-eagerness-to-get-vaccinated-begins-to-level-off-as-most-people-who-want-a-vaccine-have-gotten-one-but-republicans-show-biggest-shift-toward-vaccination/ (accessed on 3 January 2025).
- CDC. COVID Data Tracker. Available online: https://covid.cdc.gov/covid-data-tracker (accessed on 8 November 2021).
- Coronavirus (COVID-19) Update: FDA Expands Eligibility for COVID-19 Vaccine Boosters. Available online: https://www.fda.gov/news-events/press-announcements/coronavirus-covid-19-update-fda-expands-eligibility-covid-19-vaccine-boosters (accessed on 27 January 2025).
- Coronavirus (COVID-19) Update: FDA Authorizes Additional Vaccine Dose for Certain Immunocompromised Individuals. Available online: https://www.fda.gov/news-events/press-announcements/coronavirus-covid-19-update-fda-authorizes-additional-vaccine-dose-certain-immunocompromised (accessed on 15 February 2024).
- Coronavirus (COVID-19) Update: 29 October 2021. Available online: https://www.fda.gov/news-events/press-announcements/coronavirus-covid-19-update-october-29-2021 (accessed on 15 February 2024).
- Borobia, A.M.; Carcas, A.J.; Pérez-Olmeda, M.; Castaño, L.; Bertran, M.J.; García-Pérez, J.; Campins, M.; Portolés, A.; González-Pérez, M.; Morales, M.T.G.; et al. Immunogenicity and Reactogenicity of BNT162b2 Booster in ChAdOx1-S-Primed Participants (CombiVacS): A Multicentre, Open-Label, Randomised, Controlled, Phase 2 Trial. Lancet 2021, 398, 121–130. [Google Scholar] [CrossRef]
- Khoury, D.S.; Cromer, D.; Reynaldi, A.; Schlub, T.E.; Wheatley, A.K.; Juno, J.A.; Subbarao, K.; Kent, S.J.; Triccas, J.A.; Davenport, M.P. Neutralizing Antibody Levels Are Highly Predictive of Immune Protection from Symptomatic SARS-CoV-2 Infection. Nat. Med. 2021, 27, 1205–1211. [Google Scholar] [CrossRef] [PubMed]
- Hardt, K.; Vandebosch, A.; Sadoff, J.; Le Gars, M.; Truyers, C.; Lowson, D.; Van Dromme, I.; Vingerhoets, J.; Kamphuis, T.; Scheper, G.; et al. Efficacy, Safety, and Immunogenicity of a Booster Regimen of Ad26.COV2.S Vaccine against COVID-19 (ENSEMBLE2): Results of a Randomised, Double-Blind, Placebo-Controlled, Phase 3 Trial. Lancet Infect. Dis. 2022, 22, 1703–1715. [Google Scholar] [CrossRef] [PubMed]
- Atmar, R.L.; Lyke, K.E.; Deming, M.E.; Jackson, L.A.; Branche, A.R.; El Sahly, H.M.; Rostad, C.A.; Martin, J.M.; Johnston, C.; Rupp, R.E.; et al. Homologous and Heterologous COVID-19 Booster Vaccinations. N. Engl. J. Med. 2022, 386, 1046–1057. [Google Scholar] [CrossRef]
- Vaccines and Related Biological Products Advisory Committee 14–15 October 2021 Meeting Presentation. Presented at the Vaccines and Related Biological Products Advisory Committee Meeting. Available online: https://www.fda.gov/advisory-committees/advisory-committee-calendar/vaccines-and-related-biological-products-advisory-committee-october-14-15-2021-meeting-announcement (accessed on 3 January 2025).
- Hung Nguyen, V.; Boileau, C.; Bogdanov, A.; Sredl, M.; Bonafede, M.; Ducruet, T.; Chavers, S.; Rosen, A.; Martin, D.; Buck, P.; et al. Relative Effectiveness of BNT162b2, mRNA-1273, and Ad26.COV2.S Vaccines and Homologous Boosting in Preventing COVID-19 in Adults in the US. Open Forum Infect. Dis. 2023, 10, ofad288. [Google Scholar] [CrossRef] [PubMed]
- Wu, N.; Joyal-Desmarais, K.; Ribeiro, P.A.B.; Vieira, A.M.; Stojanovic, J.; Sanuade, C.; Yip, D.; Bacon, S.L. Long-Term Effectiveness of COVID-19 Vaccines against Infections, Hospitalisations, and Mortality in Adults: Findings from a Rapid Living Systematic Evidence Synthesis and Meta-Analysis up to December, 2022. Lancet Respir. Med. 2023, 11, 439–452. [Google Scholar] [CrossRef]
- Adams, K.; Rhoads, J.P.; Surie, D.; Gaglani, M.; Ginde, A.A.; McNeal, T.; Talbot, H.K.; Casey, J.D.; Zepeski, A.; Shapiro, N.I.; et al. Vaccine Effectiveness of Primary Series and Booster Doses against COVID-19 Associated Hospital Admissions in the United States: Living Test Negative Design Study. BMJ 2022, 379, e072065. [Google Scholar] [CrossRef] [PubMed]
- Lewis, N.M.; Murray, N.; Adams, K.; Surie, D.; Gaglani, M.; Ginde, A.A.; McNeal, T.; Ghamande, S.; Douin, D.J.; Talbot, H.K.; et al. Absolute and Relative Vaccine Effectiveness of Primary and Booster Series of COVID-19 Vaccines (mRNA and Adenovirus Vector) Against COVID-19 Hospitalizations in the United States, December 2021–April 2022. Open Forum Infect. Dis. 2023, 10, ofac698. [Google Scholar] [CrossRef]
- Table HIC-4_ACS. Health Insurance Coverage Status and Type of Coverage by State—All Persons: 2008 to 2019, September 2020. Available online: https://www.census.gov/library/publications/2023/demo/p60-281.html (accessed on 2 January 2025).
- Centers for Disease Control and Prevention. Grading of Recommendations, Assessment, Development, and Evaluation (GRADE): Pfizer-BioNTech, Moderna, and Janssen COVID-19 Booster Doses. 2024. Available online: https://www.cdc.gov/acip/grade/covid-19-booster-doses.html#:~:text=COV2.S%20Vaccine%20(5%C3%971010%20viral%20particles%2C%20IM)%20should,%E2%89%A518%20years%20who%20completed%20a%20COVID%2D19%20vaccine (accessed on 6 December 2024).
- Gagne, J.J.; Glynn, R.J.; Avorn, J.; Levin, R.; Schneeweiss, S. A Combined Comorbidity Score Predicted Mortality in Elderly Patients Better than Existing Scores. J. Clin. Epidemiol. 2011, 64, 749–759. [Google Scholar] [CrossRef] [PubMed]
- Cox, D.R. Regression Models and Life-Tables. J. R. Stat. Soc. Ser. B Methodol. 1972, 34, 187–220. [Google Scholar] [CrossRef]
- Rothman, K.J.; Lash, T.L.; VanderWeele, T.J.; Haneuse, S. Modern Epidemiology, 4th ed.; Wolters Kluwer: Philadelphia, PA, USA, 2021; ISBN 978-1-4511-9328-2. [Google Scholar]

| Contrasts of Interest | ||
|---|---|---|
| Exposure | Referent | |
| 1 | 2 mRNA + 1 Ad26.COV2.S | 2 mRNA |
| 2 | 2 mRNA + 1 Ad26.COV2.S | 1 Ad26.COV2.S |
| 3 | 1 Ad26.COV2.S + 1 Ad26.COV2.S | 2 mRNA |
| 4 | 1 Ad26.COV2.S + 1 Ad26.COV2.S | 1 Ad26.COV2.S |
| Characteristic a | mRNA + Ad26.COV2.S vs. mRNA + No Boost | mRNA + Ad26.COV2.S vs. Ad26.COV2.S + No Boost | ||||
|---|---|---|---|---|---|---|
| N (%) or Mean +/− SD Unless Otherwise Noted | mRNA + Ad26.COV2.S | mRNA + No Boost | ASD | mRNA + Ad26.COV2.S | Ad26.COV2.S + No Boost | ASD |
| Number of individuals | 2969 | 11,492 | 2973 | 11,568 | ||
| Demographics | ||||||
| Age, mean (SD) | 46.89 (15.58) | 46.69 (15.29) | 0.013 | 46.89 (15.56) | 46.88 (15.40) | 0.000 |
| Male sex; n (%) | 1581 (53.3%) | 6253 (54.4%) | 0.023 | 1587 (53.4%) | 6170 (53.3%) | 0.001 |
| U.S. region b | 0.005 | 0.003 | ||||
| Northeast; n (%) | 474 (16.0%) | 1820 (15.8%) | 474 (15.9%) | 1836 (15.9%) | ||
| Midwest; n (%) | 320 (10.8%) | 1229 (10.7%) | 321 (10.8%) | 1242 (10.7%) | ||
| South; n (%) | 648 (21.8%) | 2511 (21.8%) | 651 (21.9%) | 2537 (21.9%) | ||
| West; n (%) | 1527 (51.4%) | 5932 (51.6%) | 1527 (51.4%) | 5953 (51.5%) | ||
| State c | 0.053 | 0.042 | ||||
| Index months | 0.020 | 0.018 | ||||
| October 2021; n (%) | 125 (4.2%) | 499 (4.3%) | 125 (4.2%) | 509 (4.4%) | ||
| November 2021; n (%) | 877 (29.5%) | 3343 (29.1%) | 876 (29.5%) | 3360 (29.0%) | ||
| December 2021; n (%) | 1169 (39.4%) | 4502 (39.2%) | 1171 (39.4%) | 4567 (39.5%) | ||
| January 2022; n (%) | 403 (13.6%) | 1609 (14.0%) | 406 (13.7%) | 1597 (13.8%) | ||
| February 2022 to September 2022; n (%) | 395 (13.3%) | 1539 (13.4%) | 395 (13.3%) | 1535 (13.3%) | ||
| Commercial Enrollment on CED; n (%) | 1631 (54.9%) | 6343 (55.2%) | 0.005 | 1634 (55.0%) | 6338 (54.8%) | 0.003 |
| Medicare Advantage Enrollment on CED; n (%) | 203 (6.8%) | 795 (6.9%) | 0.003 | 201 (6.8%) | 783 (6.8%) | 0.000 |
| Medicaid Enrollment on CED; n (%) | 1245 (41.9%) | 4762 (41.4%) | 0.010 | 1247 (41.9%) | 4845 (41.9%) | 0.001 |
| COVID-19-related characteristics | ||||||
| Receipt of any laboratory test for COVID-19; n (%) | 832 (28.0%) | 3214 (28.0%) | 0.001 | 835 (28.1%) | 3294 (28.5%) | 0.009 |
| History of COVID-19 infection; n (%) | 269 (9.1%) | 1024 (8.9%) | 0.005 | 270 (9.1%) | 1052 (9.1%) | 0.000 |
| Month of primary vaccination; n (%) d | ||||||
| January 2021; n (%) | 91 (3.1%) | 328 (2.9%) | 0.012 | 91 (3.1%) | 377 (3.3%) | 0.011 |
| February 2021; n (%) | 301 (10.1%) | 1150 (10.0%) | 0.004 | 301 (10.1%) | 1150 (9.9%) | 0.006 |
| March 2021; n (%) | 392 (13.2%) | 1502 (13.1%) | 0.004 | 392 (13.2%) | 1549 (13.4%) | 0.006 |
| April 2021; n (%) | 1033 (34.8%) | 3997 (34.8%) | 0.000 | 1032 (34.7%) | 3949 (34.1%) | 0.012 |
| May 2021; n (%) | 752 (25.3%) | 2947 (25.6%) | 0.007 | 755 (25.4%) | 2910 (25.2%) | 0.006 |
| June 2021 to July 2022; n (%) | 400 (13.5%) | 1568 (13.6%) | - | 402 (13.5%) | 1633 (14.1%) | - |
| Days since primary series (SD) a | 245.07 (52.94) | 244.93 (54.54) | 0.003 | 245.02 (52.81) | 244.88 (53.81) | 0.002 |
| Comorbid conditions | ||||||
| Cerebrovascular disease; n (%) | 101 (3.4%) | 385 (3.4%) | 0.003 | 101 (3.4%) | 358 (3.1%) | 0.017 |
| Chronic kidney disease (CKD); n (%) | 122 (4.1%) | 462 (4.0%) | 0.005 | 122 (4.1%) | 472 (4.1%) | 0.001 |
| Chronic obstructive pulmonary disease (COPD); n (%) | 397 (13.4%) | 1544 (13.4%) | 0.002 | 399 (13.4%) | 1528 (13.2%) | 0.006 |
| Cystic fibrosis; n (%) | 0 (0.0%) | 0 (0.0%) | - | 0 (0.0%) | 0 (0.0%) | - |
| HIV; n (%) | 33 (1.1%) | 126 (1.1%) | 0.001 | 32 (1.1%) | 133 (1.1%) | 0.007 |
| Hypertension; n (%) | 923 (31.1%) | 3558 (31.0%) | 0.003 | 922 (31.0%) | 3590 (31.0%) | 0.000 |
| Immunocompromised state from organ transplant; n (%) | 10 (0.3%) | 40 (0.3%) | 0.002 | 10 (0.3%) | 41 (0.4%) | 0.003 |
| Immunocompromised state from blood transplant; n (%) | 13 (0.4%) | 41 (0.4%) | 0.013 | 13 (0.4%) | 56 (0.5%) | 0.007 |
| Liver disease; n (%) | 205 (6.9%) | 766 (6.7%) | 0.010 | 207 (7.0%) | 808 (7.0%) | 0.001 |
| Malignancies; n (%) | 105 (3.5%) | 393 (3.4%) | 0.006 | 105 (3.5%) | 432 (3.7%) | 0.011 |
| Moderate-to-severe asthma; n (%) | 35 (1.2%) | 142 (1.2%) | 0.005 | 35 (1.2%) | 136 (1.2%) | 0.000 |
| Neurologic conditions; n (%) | 950 (32.0%) | 3626 (31.6%) | 0.010 | 954 (32.1%) | 3651 (31.6%) | 0.011 |
| Obesity; n (%) | 730 (24.6%) | 2792 (24.3%) | 0.007 | 730 (24.6%) | 2829 (24.5%) | 0.002 |
| Pulmonary fibrosis; n (%) | 12 (0.4%) | 48 (0.4%) | 0.002 | 12 (0.4%) | 44 (0.4%) | 0.004 |
| Serious heart conditions; n (%) | 258 (8.7%) | 998 (8.7%) | 0.000 | 259 (8.7%) | 1003 (8.7%) | 0.001 |
| Sickle cell disease; n (%) | 0 (0.0%) | 0 (0.0%) | - | 0 (0.0%) | 0 (0.0%) | - |
| Thalassemia; n (%) | 2 (0.1%) | 4 (0.0%) | 0.014 | 2 (0.1%) | 7 (0.1%) | 0.003 |
| Type 1 diabetes mellitus; n (%) | 38 (1.3%) | 156 (1.4%) | 0.007 | 38 (1.3%) | 155 (1.3%) | 0.005 |
| Type 2 diabetes mellitus; n (%) | 446 (15.0%) | 1713 (14.9%) | 0.003 | 444 (14.9%) | 1714 (14.8%) | 0.003 |
| Gagne combined comorbidity score, mean (SD) | 0.80 (1.76) | 0.79 (1.75) | 0.009 | 0.81 (1.76) | 0.79 (1.75) | 0.008 |
| Healthcare resource utilization | ||||||
| Recent medical claim; n (%) e | 2017 (67.9%) | 7640 (66.5%) | 0.031 | 2018 (67.9%) | 7727 (66.8%) | 0.023 |
| Recent pharmacy claim; n (%) e | 2058 (69.3%) | 7811 (68.0%) | 0.029 | 2061 (69.3%) | 7982 (69.0%) | 0.007 |
| Characteristic a | Ad26.COV2.S + Ad26.COV2.S vs. mRNA + No Boost | Ad26.COV2.S + Ad26.COV2.S vs. Ad26.COV2.S + No Boost | ||||
|---|---|---|---|---|---|---|
| N (%) or Mean +/− SD Unless Otherwise Noted | Ad26.COV2.S + Ad26.COV2.S | mRNA + No Boost | ASD | Ad26.COV2.S + Ad26.COV2.S | Ad26.COV2.S + No Boost | ASD |
| Number of individuals | 74,628 | 289,215 | 43,072 | 166,907 | ||
| Demographics | ||||||
| Age, mean (SD) | 51.19 (14.93) | 51.14 (14.69) | 0.003 | 49.08 (15.46) | 49.04 (15.03) | 0.003 |
| Male sex; n (%) | 36,904 (49.5%) | 143,114 (49.5%) | 0.001 | 21,373 (49.6%) | 82,901 (49.7%) | 0.001 |
| U.S. region b | 0.014 | 0.014 | ||||
| Northeast; n (%) | 14,866 (19.9%) | 56,825 (19.6%) | 8838 (20.5%) | 33,913 (20.3%) | ||
| Midwest; n (%) | 12,125 (16.2%) | 46,705 (16.1%) | 7593 (17.6%) | 29,046 (17.4%) | ||
| South; n (%) | 15,255 (20.4%) | 58,243 (20.1%) | 9536 (22.1%) | 36,558 (21.9%) | ||
| West; n (%) | 32,382 (43.4%) | 127,442 (44.1%) | 17,105 (39.7%) | 67,390 (40.4%) | ||
| State c | 0.021 | 0.022 | ||||
| Index months | 0.008 | 0.008 | ||||
| October 2021; n (%) | 5981 (8.0%) | 22,810 (7.9%) | 5593 (13.0%) | 21,758 (13.0%) | ||
| November 2021; n (%) | 25,936 (34.8%) | 100,700 (34.8%) | 17,467 (40.6%) | 68,010 (40.7%) | ||
| December 2021; n (%) | 22,071 (29.6%) | 86,077 (29.8%) | 10,297 (23.9%) | 39,928 (23.9%) | ||
| January 2022; n (%) | 12,009 (16.1%) | 46,440 (16.1%) | 5457 (12.7%) | 20,981 (12.6%) | ||
| February 2022 to September 2022; n (%) | 8631 (11.6%) | 33,188 (11.5%) | 4258 (9.9%) | 16,230 (9.7%) | ||
| Commercial Enrollment on CED; n (%) | 38,657 (51.8%) | 151,204 (52.3%) | 0.010 | 22,411 (52.0%) | 87,390 (52.4%) | 0.007 |
| Medicare Advantage Enrollment on CED; n (%) | 6748 (9.0%) | 25,518 (8.8%) | 0.008 | 3593 (8.3%) | 13,676 (8.2%) | 0.005 |
| Medicaid Enrollment on CED; n (%) | 30,444 (40.8%) | 117,236 (40.5%) | 0.005 | 17,825 (41.4%) | 68,698 (41.2%) | 0.005 |
| COVID-19-related characteristics | ||||||
| Receipt of any laboratory test for COVID-19; n (%) | 16,466 (22.1%) | 63,213 (21.9%) | 0.005 | 9619 (22.3%) | 36,575 (21.9%) | 0.010 |
| History of COVID-19 infection; n (%) | 6371 (8.5%) | 24,115 (8.3%) | 0.007 | 3724 (8.6%) | 14,086 (8.4%) | 0.007 |
| Month of primary vaccination; n (%) d | ||||||
| January 2021; n (%) | 0 (0.0%) | 0 (0.0%) | - | 0 (0.0%) | 0 (0.0%) | - |
| February 2021; n (%) | 1 (0.0%) | 4 (0.0%) | 0.000 | 0 (0.0%) | 0 (0.0%) | - |
| March 2021; n (%) | 20,103 (26.9%) | 77,512 (26.8%) | 0.003 | 10,407 (24.2%) | 40,411 (24.2%) | 0.001 |
| April 2021; n (%) | 29,642 (39.7%) | 116,132 (40.2%) | 0.009 | 15,881 (36.9%) | 62,149 (37.2%) | 0.008 |
| May 2021; n (%) | 11,169 (15.0%) | 42,657 (14.7%) | 0.006 | 6933 (16.1%) | 26,638 (16.0%) | 0.004 |
| June 2021 to July 2022; n (%) | 13,713 (18.4%) | 52,910 (18.3%) | - | 9851 (22.9%) | 37,709 (22.6%) | - |
| Days since primary series (SD) a | 230.89 (52.73) | 228.19 (52.57) | 0.051 | 215.99 (51.55) | 216.08 (51.60) | 0.002 |
| Comorbid conditions | ||||||
| Cerebrovascular disease; n (%) | 2599 (3.5%) | 9786 (3.4%) | 0.005 | 1438 (3.3%) | 5475 (3.3%) | 0.003 |
| Chronic kidney disease (CKD); n (%) | 3824 (5.1%) | 14,510 (5.0%) | 0.005 | 1997 (4.6%) | 7642 (4.6%) | 0.003 |
| Chronic obstructive pulmonary disease (COPD); n (%) | 9521 (12.8%) | 36,249 (12.5%) | 0.007 | 5460 (12.7%) | 20,861 (12.5%) | 0.005 |
| Cystic fibrosis; n (%) | 2 (0.0%) | 8 (0.0%) | 0.000 | 1 (0.0%) | 4 (0.0%) | 0.000 |
| HIV; n (%) | 541 (0.7%) | 2110 (0.7%) | 0.001 | 313 (0.7%) | 1189 (0.7%) | 0.002 |
| Hypertension; n (%) | 27,665 (37.1%) | 105,077 (36.3%) | 0.015 | 14,901 (34.6%) | 56,873 (34.1%) | 0.011 |
| Immunocompromised state from organ transplant; n (%) | 387 (0.5%) | 1504 (0.5%) | 0.000 | 226 (0.5%) | 859 (0.5%) | 0.001 |
| Immunocompromised state from blood transplant; n (%) | 398 (0.5%) | 1494 (0.5%) | 0.002 | 211 (0.5%) | 809 (0.5%) | 0.001 |
| Liver disease; n (%) | 4850 (6.5%) | 18,217 (6.3%) | 0.008 | 2713 (6.3%) | 10,232 (6.1%) | 0.007 |
| Malignancies; n (%) | 3016 (4.0%) | 11,496 (4.0%) | 0.003 | 1640 (3.8%) | 6230 (3.7%) | 0.004 |
| Moderate-to-severe asthma; n (%) | 1013 (1.4%) | 3851 (1.3%) | 0.002 | 605 (1.4%) | 2351 (1.4%) | 0.000 |
| Neurologic conditions; n (%) | 23,443 (31.4%) | 88,880 (30.7%) | 0.015 | 13,303 (30.9%) | 50,507 (30.3%) | 0.014 |
| Obesity; n (%) | 19,819 (26.6%) | 75,199 (26.0%) | 0.013 | 11,117 (25.8%) | 42,301 (25.3%) | 0.011 |
| Pulmonary fibrosis; n (%) | 442 (0.6%) | 1663 (0.6%) | 0.002 | 246 (0.6%) | 946 (0.6%) | 0.001 |
| Serious heart conditions; n (%) | 6927 (9.3%) | 26,164 (9.0%) | 0.008 | 3697 (8.6%) | 14,064 (8.4%) | 0.006 |
| Sickle cell disease; n (%) | 67 (0.1%) | 253 (0.1%) | 0.001 | 43 (0.1%) | 168 (0.1%) | 0.000 |
| Thalassemia; n (%) | 96 (0.1%) | 357 (0.1%) | 0.001 | 52 (0.1%) | 185 (0.1%) | 0.003 |
| Type 1 diabetes mellitus; n (%) | 831 (1.1%) | 3118 (1.1%) | 0.003 | 457 (1.1%) | 1740 (1.0%) | 0.002 |
| Type 2 diabetes mellitus; n (%) | 13,604 (18.2%) | 51,170 (17.7%) | 0.014 | 7146 (16.6%) | 27,406 (16.4%) | 0.005 |
| Gagne combined comorbidity score, mean (SD) | 0.69 (1.66) | 0.67 (1.66) | 0.012 | 0.68 (1.64) | 0.67 (1.64) | 0.008 |
| Healthcare resource utilization | ||||||
| Recent medical claim; n (%) e | 48,085 (64.4%) | 183,968 (63.6%) | 0.017 | 27,622 (64.1%) | 106,136 (63.6%) | 0.011 |
| Recent pharmacy claim; n (%) e | 53,039 (71.1%) | 202,604 (70.1%) | 0.022 | 30,194 (70.1%) | 115,927 (69.5%) | 0.014 |
| N Events | Person-Years | Incidence Rate (per 1000 Person-Years) | Median Days Follow-Up [IQR] | Fully Adjusted HR (95% CI) * | |
|---|---|---|---|---|---|
| mRNA + Ad26.COV2.S vs. mRNA + no boost | |||||
| COVID-19-related hospitalization | |||||
| mRNA + Ad26.COV2.S | 23 | 1867 | 12.32 | 272 (168, 303) | 0.67 (0.43, 1.06) |
| mRNA + no boost (ref) | 103 | 5464 | 18.85 | 208 (35, 295) | |
| Medically attended COVID-19 | |||||
| mRNA + Ad26.COV2.S | 246 | 1780 | 138.21 | 263 (147, 301) | 0.84 (0.73, 0.97) |
| mRNA + no boost (ref) | 876 | 5133 | 170.67 | 176 (30, 289) | |
| mRNA + Ad26.COV2.S vs. Ad26.COV2.S + no boost | |||||
| COVID-19-related hospitalization | |||||
| mRNA + Ad26.COV2.S | 23 | 1868 | 12.31 | 272 (168, 303) | 0.81 (0.51, 1.27) |
| Ad26.COV2.S + no boost (ref) | 93 | 5916 | 15.72 | 226 (56, 296) | |
| Medically attended COVID-19 | |||||
| mRNA + Ad26.COV2.S | 247 | 1781 | 138.67 | 263 (147, 301) | 0.88 (0.76, 1.01) |
| Ad26.COV2.S + no boost (ref) | 899 | 5568 | 161.46 | 197 (45, 292) | |
| Ad26.COV2.S + Ad26.COV2.S vs. mRNA + no boost | |||||
| COVID-19-related hospitalization | |||||
| Ad26.COV2.S + Ad26.COV2.S | 553 | 51,428 | 10.75 | 282 (219, 312) | 0.82 (0.75, 0.90) |
| mRNA + no boost (ref) | 1916 | 137,465 | 13.94 | 215 (33, 294) | |
| Medically attended COVID-19 | |||||
| Ad26.COV2.S + Ad26.COV2.S | 6389 | 48,792 | 130.94 | 273 (188, 309) | 0.93 (0.90, 0.96) |
| mRNA + no boost (ref) | 19,237 | 129,833 | 148.17 | 179 (30, 287) | |
| Ad26.COV2.S + Ad26.COV2.S vs. Ad26.COV2.S + no boost | |||||
| COVID-19-related hospitalization | |||||
| Ad26.COV2.S + Ad26.COV2.S | 315 | 30,038 | 10.49 | 292 (217, 321) | 0.63 (0.56, 0.72) |
| Ad26.COV2.S + no boost (ref) | 1534 | 88,825 | 17.27 | 251 (47, 308) | |
| Medically attended COVID-19 | |||||
| Ad26.COV2.S + Ad26.COV2.S | 3813 | 28,427 | 134.13 | 279 (184, 318) | 0.94 (0.91, 0.97) |
| Ad26.COV2.S + no boost (ref) | 12,425 | 83,587 | 148.65 | 226 (41, 304) | |
Disclaimer/Publisher’s Note: The statements, opinions and data contained in all publications are solely those of the individual author(s) and contributor(s) and not of MDPI and/or the editor(s). MDPI and/or the editor(s) disclaim responsibility for any injury to people or property resulting from any ideas, methods, instructions or products referred to in the content. |
© 2025 by the authors. Licensee MDPI, Basel, Switzerland. This article is an open access article distributed under the terms and conditions of the Creative Commons Attribution (CC BY) license (https://creativecommons.org/licenses/by/4.0/).
Share and Cite
Nyaku, M.; Yoon, L.S.; Ricci, D.; Rubens, L.; Sheridan, P.; Iyer, M.; Zhen, T.; Harvey, R.A.; Madsen, A. Effectiveness of Heterologous and Homologous Ad26.COV2.S Vaccine Boosting in Preventing COVID-19-Related Outcomes Among Individuals with a Completed Primary Vaccination Series in the United States. Vaccines 2025, 13, 166. https://doi.org/10.3390/vaccines13020166
Nyaku M, Yoon LS, Ricci D, Rubens L, Sheridan P, Iyer M, Zhen T, Harvey RA, Madsen A. Effectiveness of Heterologous and Homologous Ad26.COV2.S Vaccine Boosting in Preventing COVID-19-Related Outcomes Among Individuals with a Completed Primary Vaccination Series in the United States. Vaccines. 2025; 13(2):166. https://doi.org/10.3390/vaccines13020166
Chicago/Turabian StyleNyaku, Mawuli, Lara S. Yoon, Deborah Ricci, Lexie Rubens, Paige Sheridan, Monica Iyer, Thomas Zhen, Raymond A. Harvey, and Ann Madsen. 2025. "Effectiveness of Heterologous and Homologous Ad26.COV2.S Vaccine Boosting in Preventing COVID-19-Related Outcomes Among Individuals with a Completed Primary Vaccination Series in the United States" Vaccines 13, no. 2: 166. https://doi.org/10.3390/vaccines13020166
APA StyleNyaku, M., Yoon, L. S., Ricci, D., Rubens, L., Sheridan, P., Iyer, M., Zhen, T., Harvey, R. A., & Madsen, A. (2025). Effectiveness of Heterologous and Homologous Ad26.COV2.S Vaccine Boosting in Preventing COVID-19-Related Outcomes Among Individuals with a Completed Primary Vaccination Series in the United States. Vaccines, 13(2), 166. https://doi.org/10.3390/vaccines13020166