
The Memory-CD8+-T-Cell Response to Conserved Influenza Virus Epitopes in Mice Is Not Influenced by Time Since Previous Infection

 , , ,
, , , 
Abstract
1. Introduction
2. Materials and Methods
2.1. Animals
2.2. Viruses
2.3. Study Design
2.4. Sample Collection
- Blood: Erythrocytes were lysed using ACK buffer (KHCO3 0.01 M, NH4Cl 0.15 M, Na2EDTA 0.1 mM).
- Spleen: Spleens were homogenized, passed through 70 µm filters (BD biosciences), and washed with RPMI 1640 containing 10% FCS, 100 U/mL penicillin, streptomycin, and glutamate (P/S/G). Erythrocytes were lysed using ACK buffer.
- Lung: After collection, lungs were minced into 1 mm sized chunks using scissors and incubated in 3 mL 2.4 mg/mL collagenase A (Roche) and 1 mg/mL DNAse (Roche) in RPMI1640 suspension for 30 min at 37 °C. Subsequently, the tissue suspension was diluted with 7 mL washing medium (RPMI1640 + 1%FCS + 2 mM EDTA + 1× P/S/G) and mashed over a 70 µm cell strainer using a plunger. The resulting suspension was centrifuged for 5′ at 500× g to remove the collagenase, after which erythrocytes were shocked using ACK buffer. The cells were then washed, transferred over a 70 µm cell strainer, and resuspended in 1 mL of stimulation medium (RPMI1640 + 10% FCS + 1× P/S/G) for ELISpot, cytokine-FACS, and dextramer staining.
- BM: Before cutting the femurs at both ends, muscles and residue tissues surrounding the femur were removed. A 25-gauge needle and 10 cc syringe filled with ice-cold RPMI (10 mL) were used to flush the bone marrow out of the femur into a 70 µm nylon cell strainer placed in a 50 mL Falcon conical tube. Next, the tissue was smashed through the cell strainer and washed with medium (RPMI1640 + 10%FCS + 2 mM EDTA + 1× P/S/G).
2.5. ELISpot
2.6. Cytokine Responses Measured Using Flow Cytometry
2.7. Antigen-Specific CD8+ T Cells Measured Using Flow Cytometry
2.8. UMAP
2.9. Isolation of Dextramer-Specific T Cells for T-Cell-Receptor Analyses
2.10. Preparing TCRβ cDNA Libraries for Sequencing
2.11. TCRβ Clonotype Analysis
2.12. Statistics
3. Results
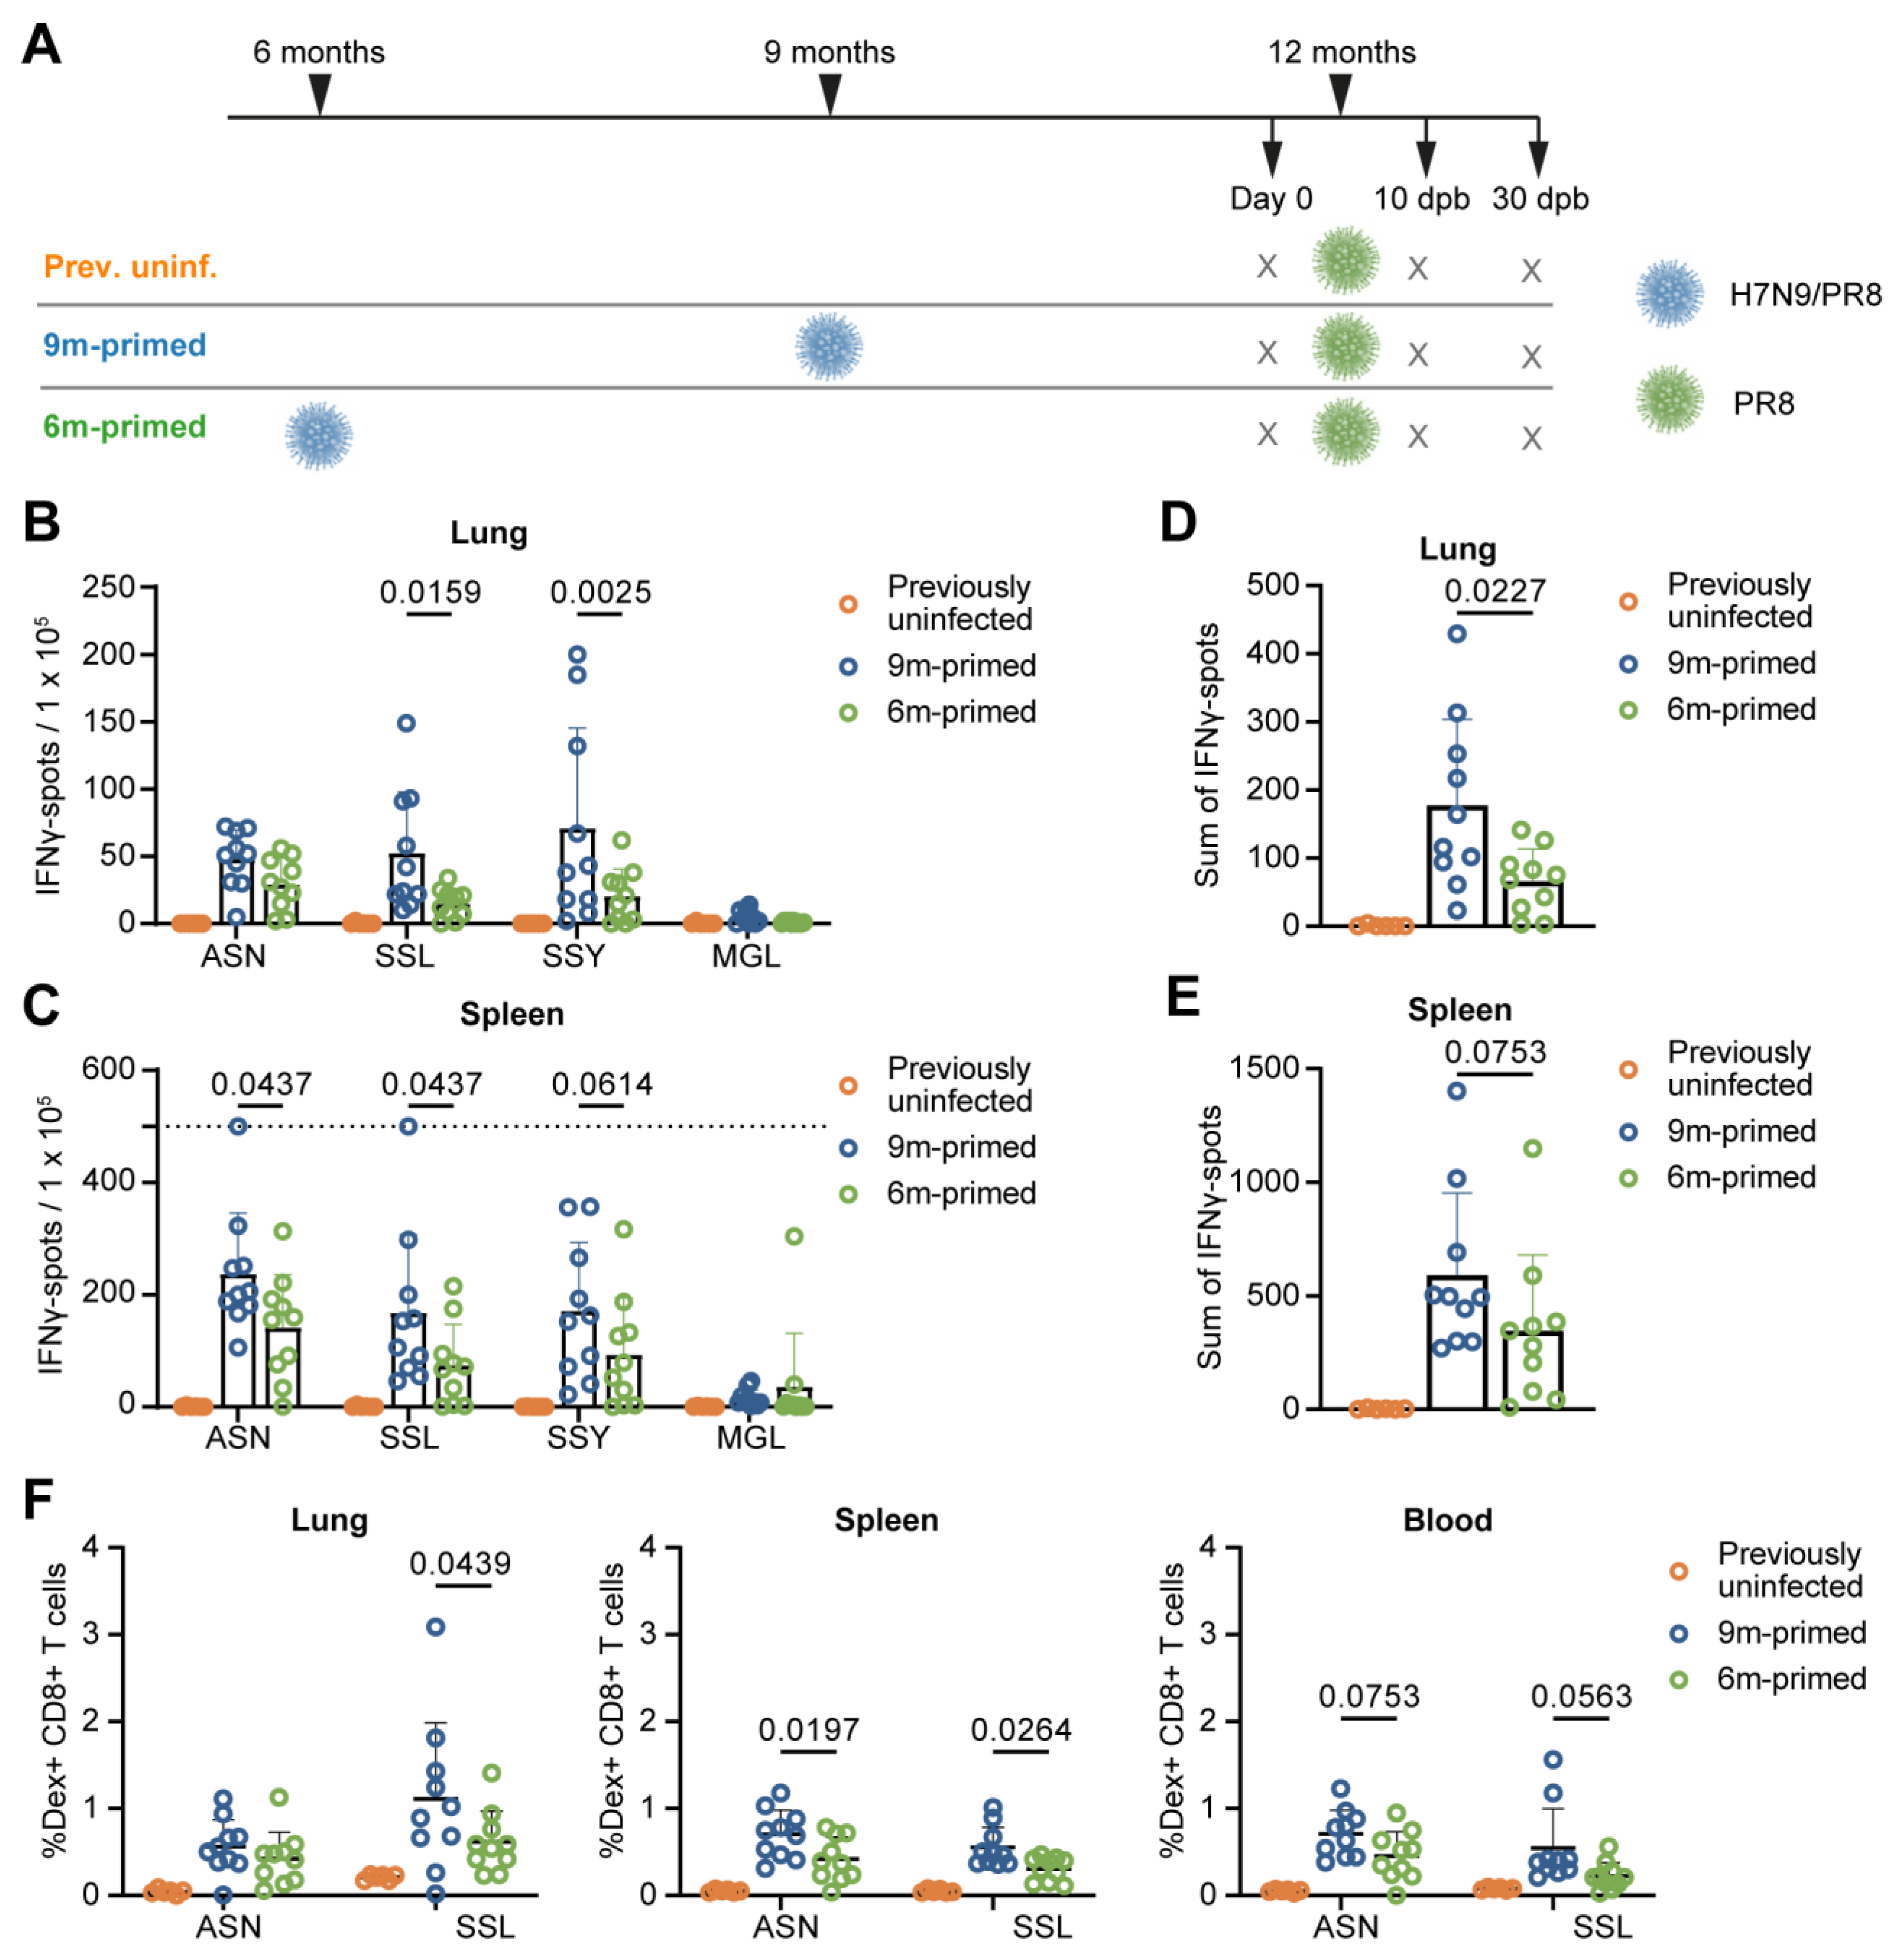
3.1. Study Design
3.2. Lower Baseline T-Cell Response in 6 m Primed Mice Compared to 9 m Primed Mice
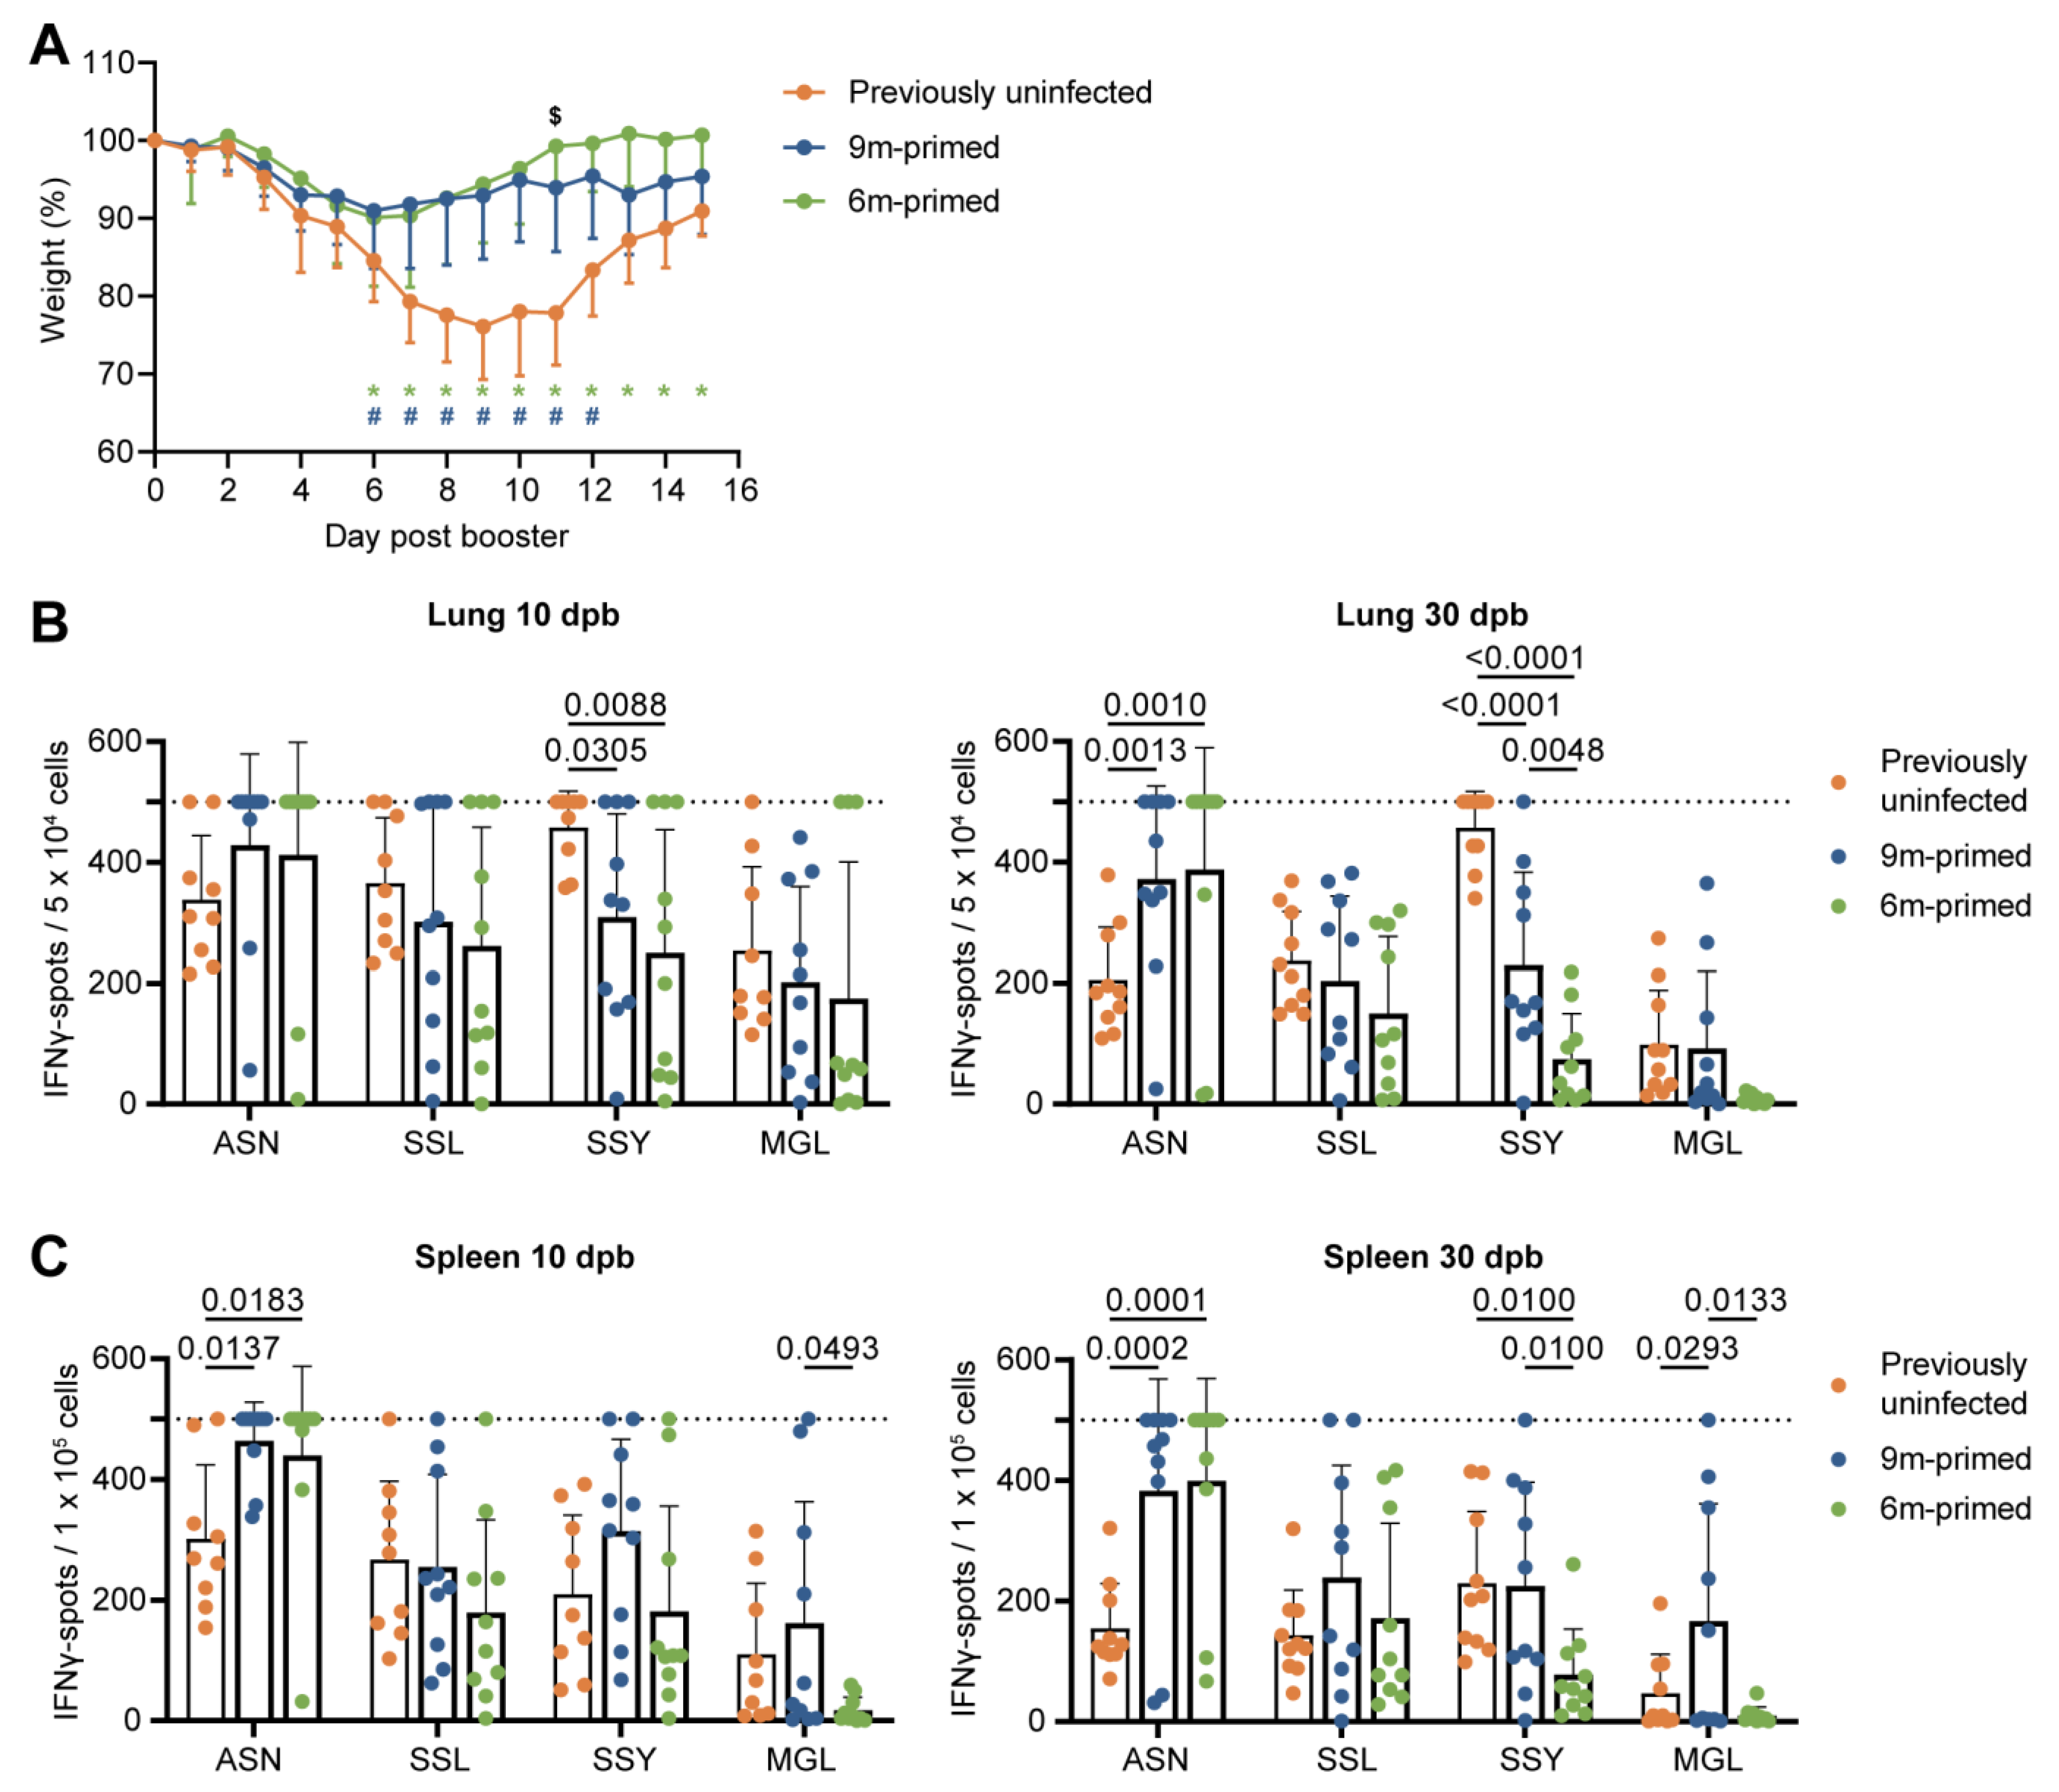
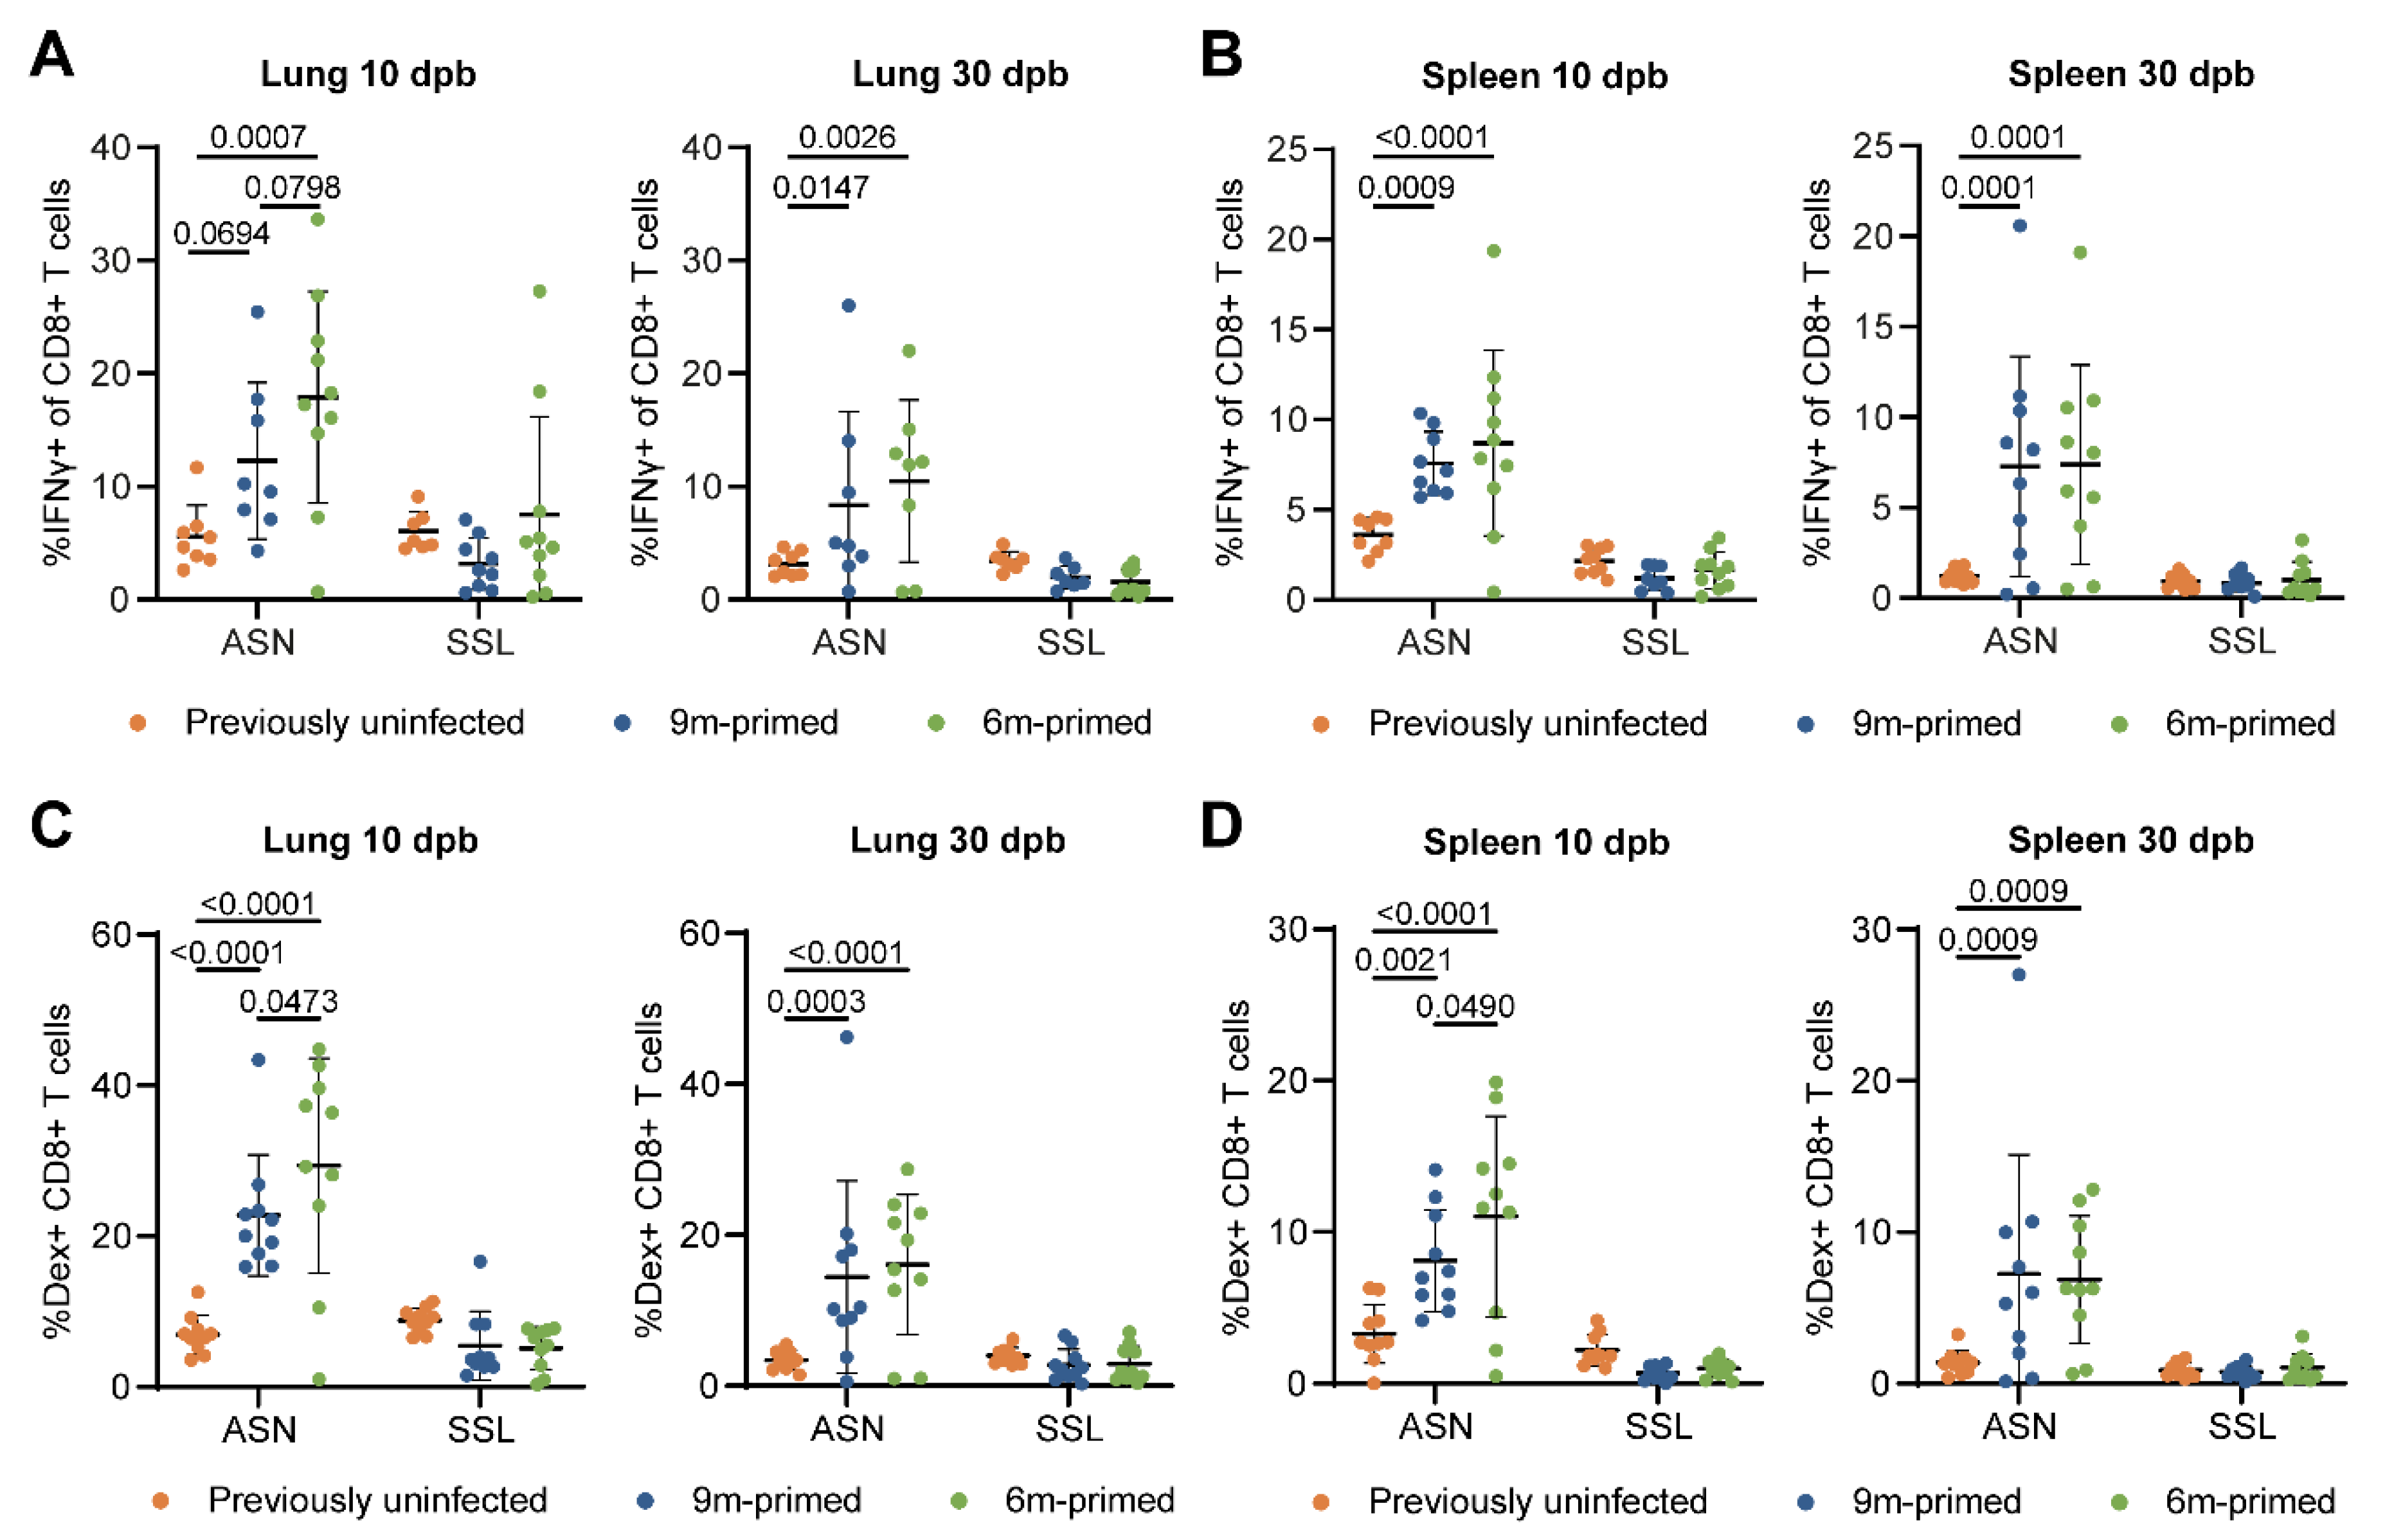
3.3. Similar Differences in T-Cell Responses to Booster Infection in 6 m and 9 m Primed Mice
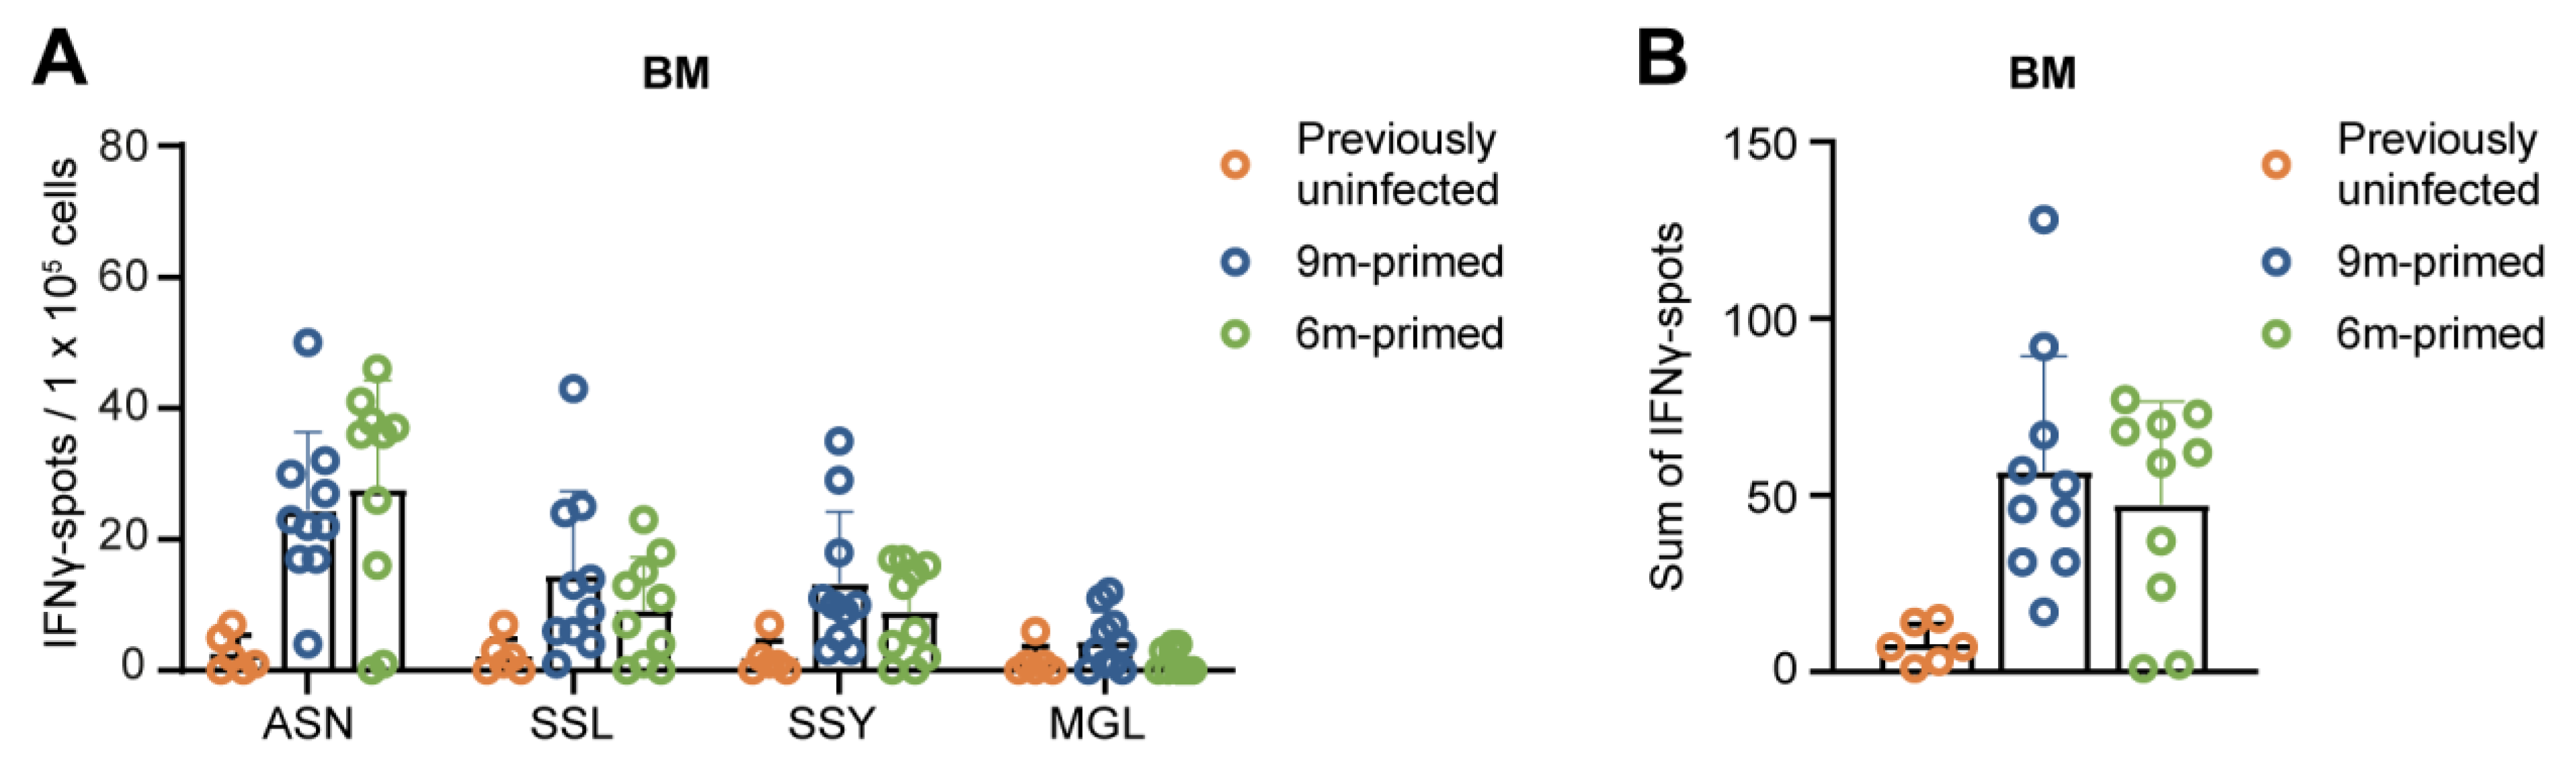
3.4. IAV-Specific T-Cell Responses Are Similarly Maintained in the Bone Marrow in 6 m Primed and 9 m Primed Mice
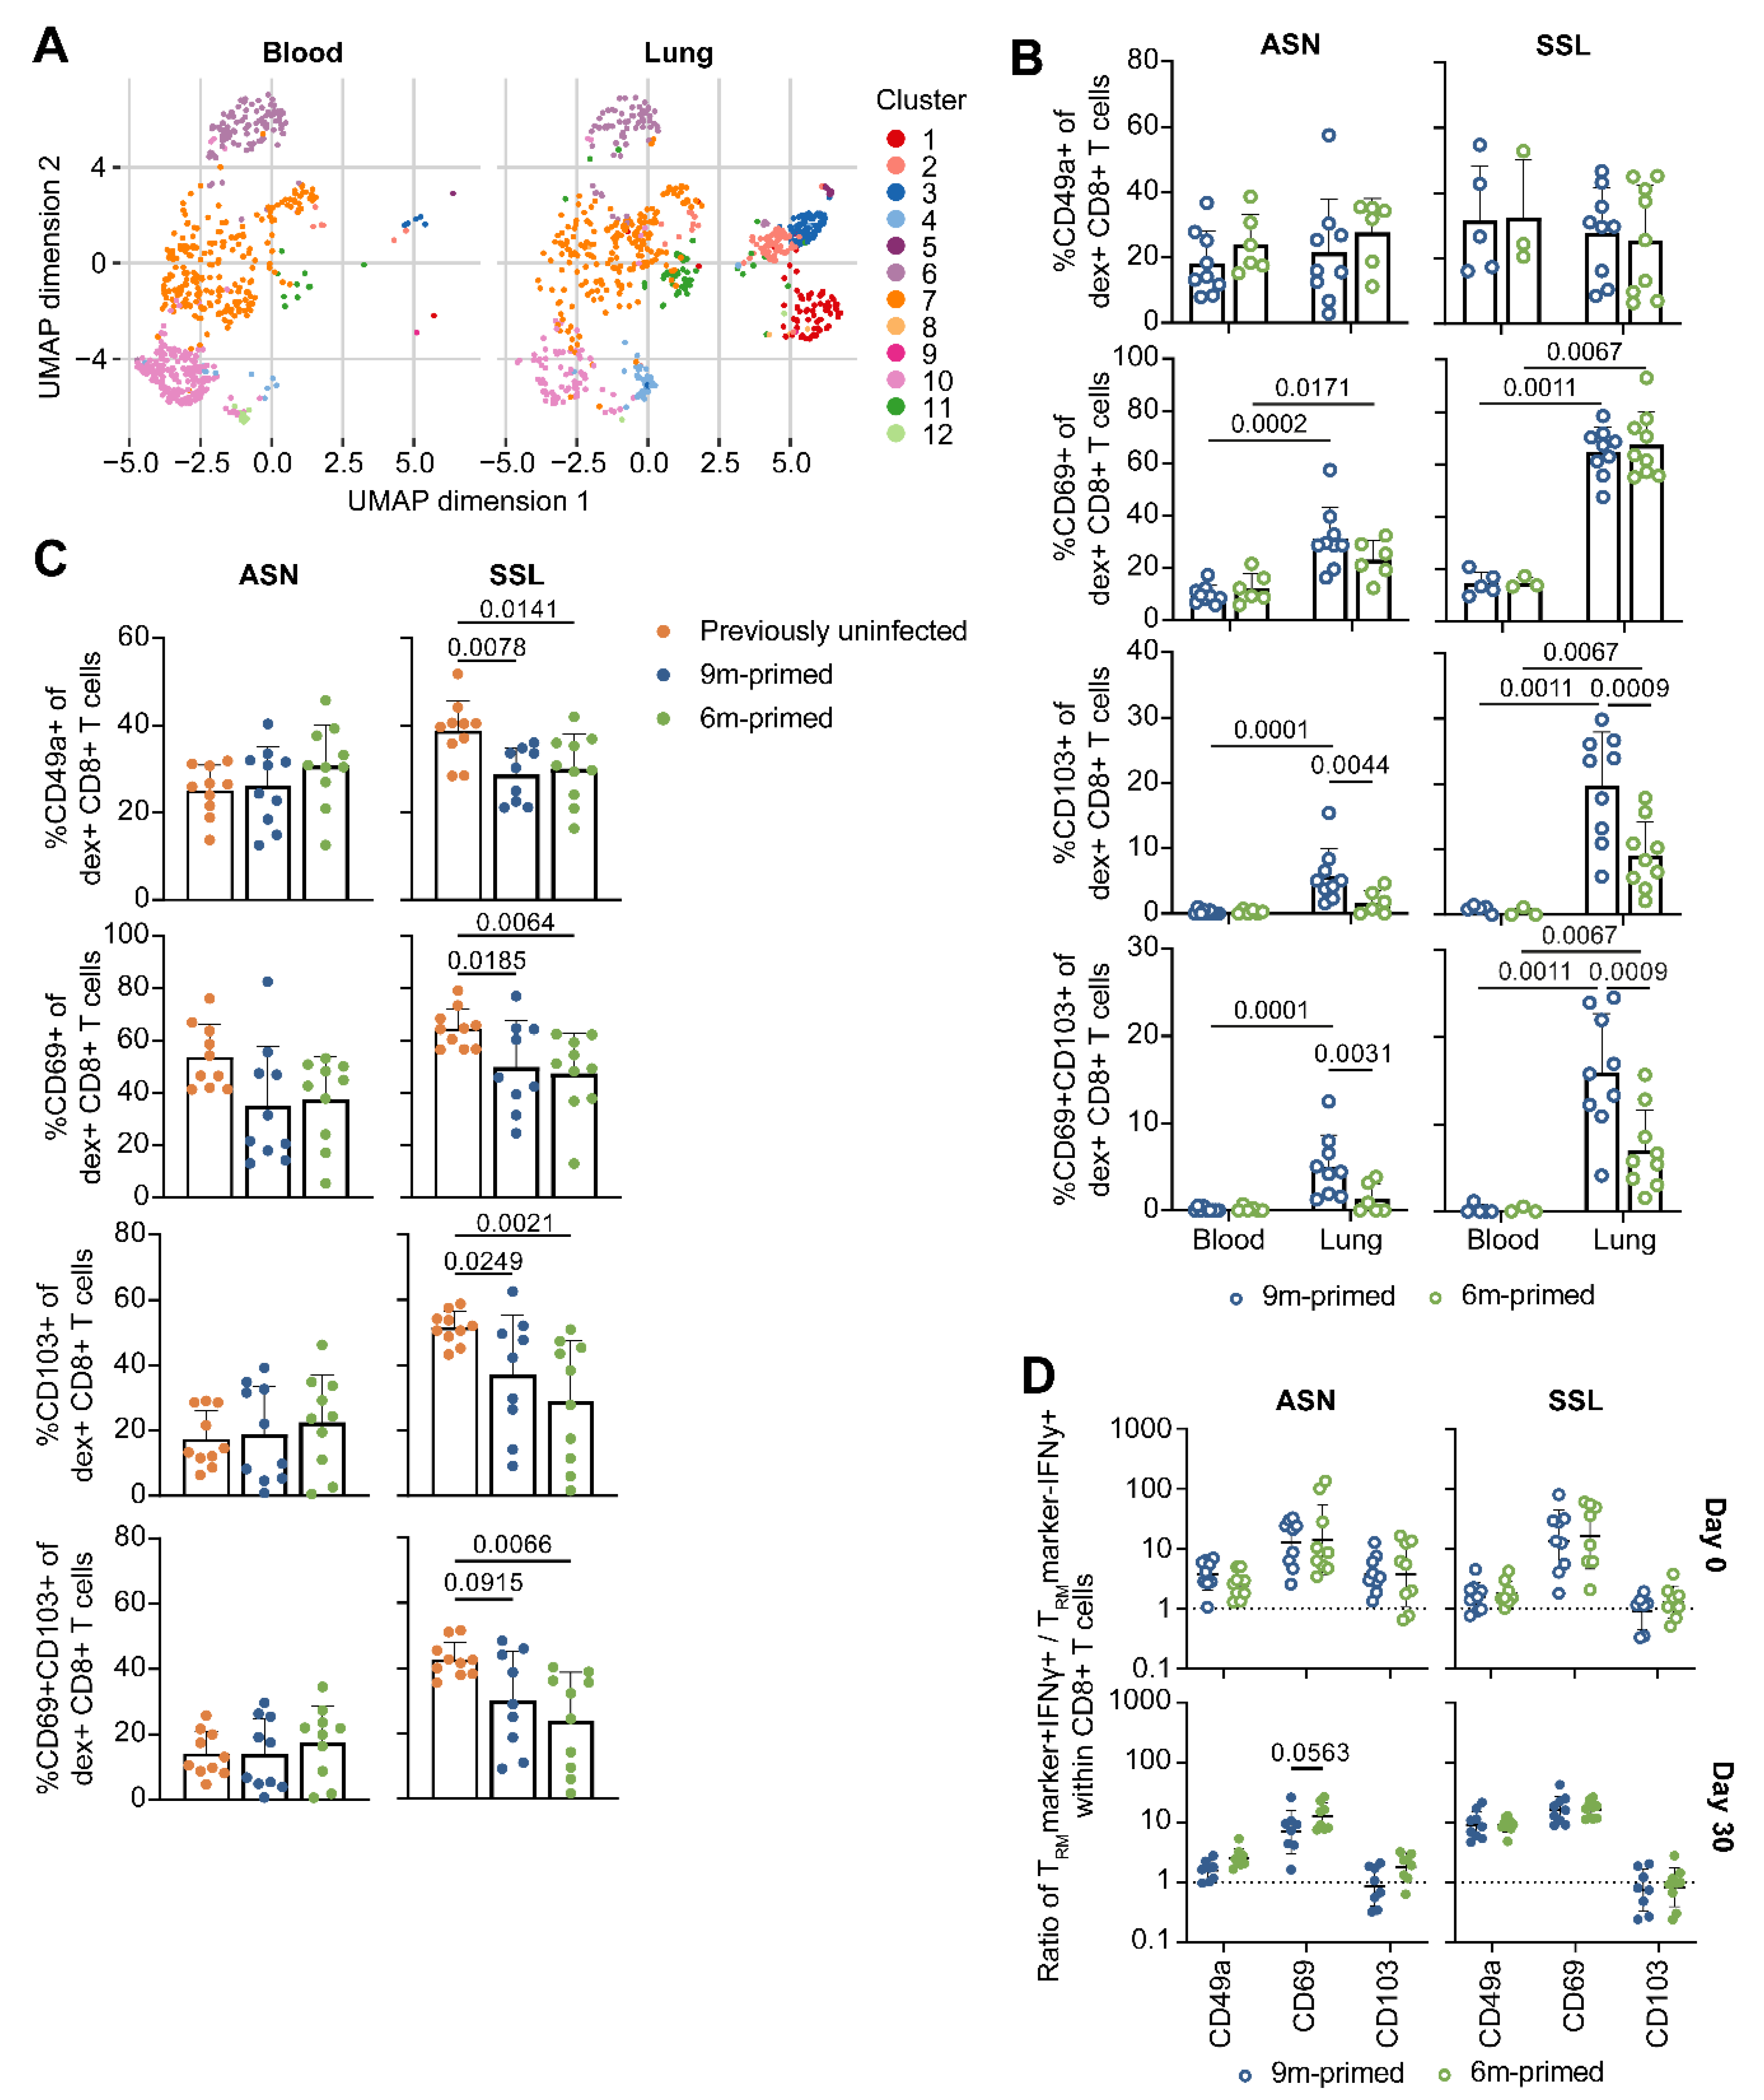
3.5. Lung-Derived T Cells of 6 m Primed and 9 m Primed Mice Express Similar Levels of TRM Markers after Booster
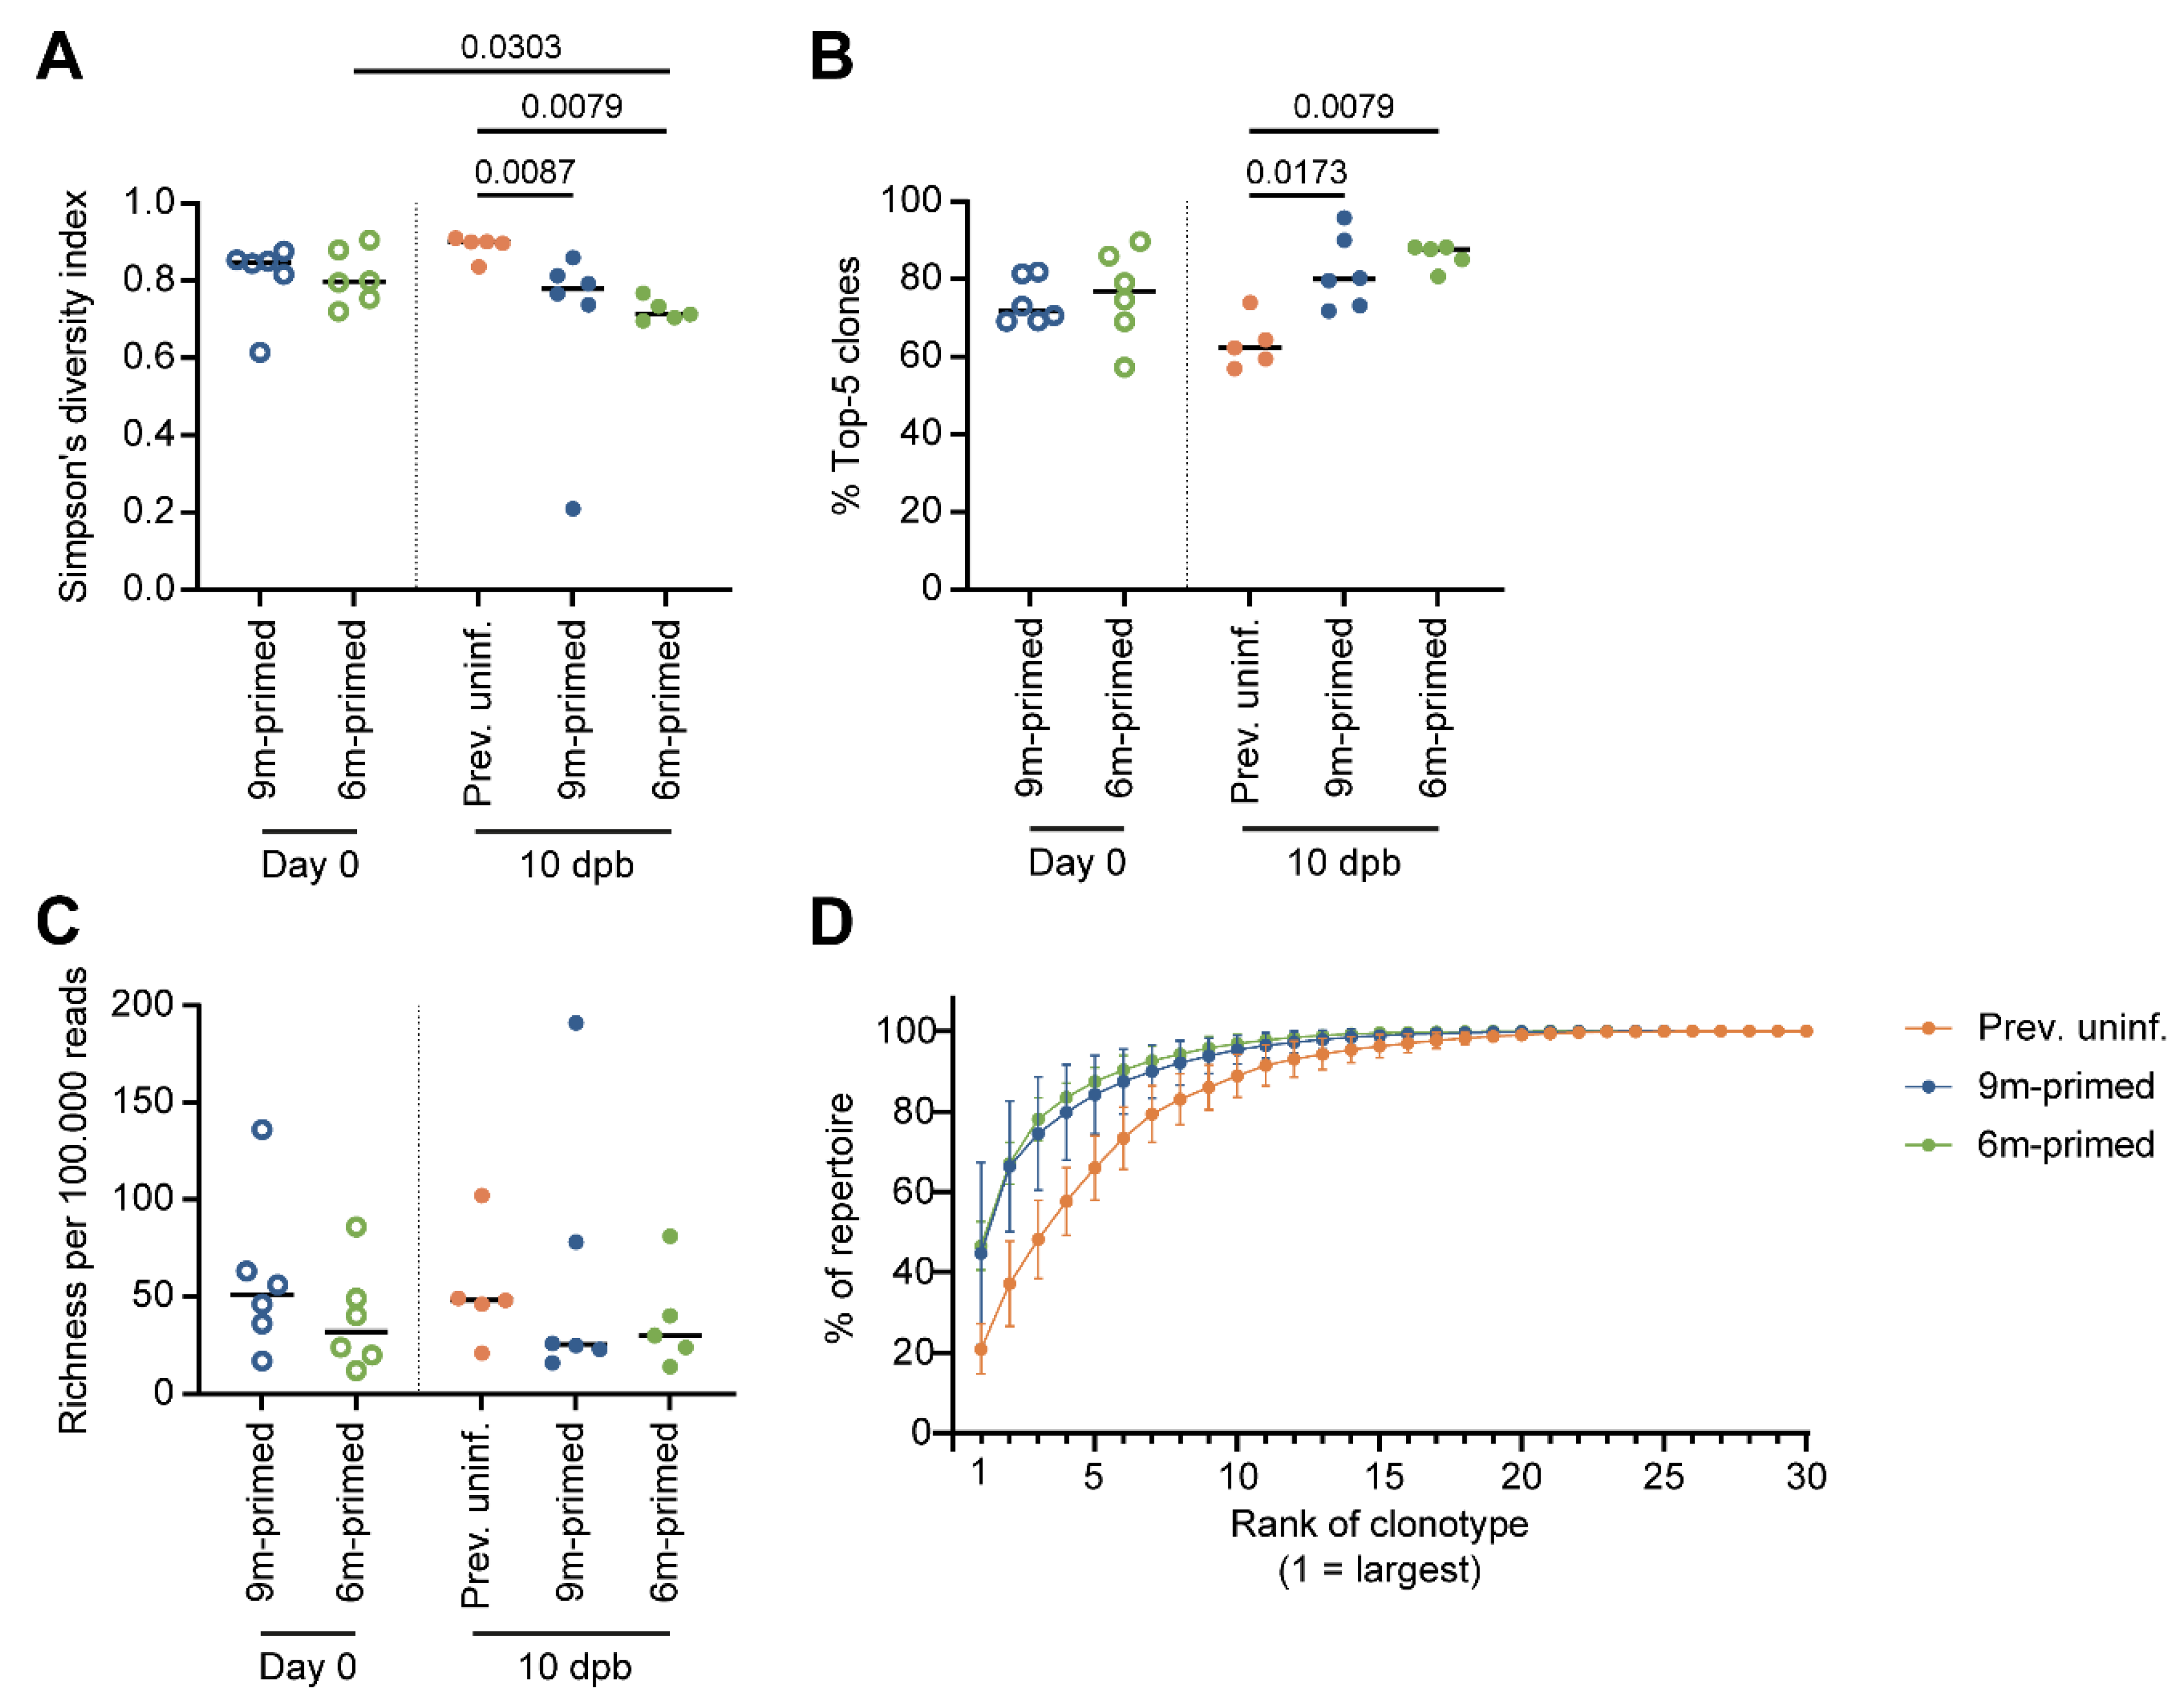
3.6. IAV-Specific TCR Repertoire Diversity Is Maintained between 3 and 6 Months after Infection
4. Discussion
Supplementary Materials
Author Contributions
Funding
Institutional Review Board Statement
Informed Consent Statement
Data Availability Statement
Conflicts of Interest
References
- McElhaney, J.E.; Kuchel, G.A.; Zhou, X.; Swain, S.L.; Haynes, L. T-Cell Immunity to Influenza in Older Adults: A Pathophysiological Framework for Development of More Effective Vaccines. Front. Immunol. 2016, 7, 41. [Google Scholar] [CrossRef] [PubMed]
- Nichol, K.L.; Margolis, K.L.; Wuorenma, J.; von Sternberg, T. The efficacy and cost effectiveness of vaccination against influenza among elderly persons living in the community. N. Engl. J. Med. 1994, 331, 778–784. [Google Scholar] [CrossRef] [PubMed]
- Goronzy, J.J.; Fulbright, J.W.; Crowson, C.S.; Poland, G.A.; O’Fallon, W.M.; Weyand, C.M. Value of immunological markers in predicting responsiveness to influenza vaccination in elderly individuals. J. Virol. 2001, 75, 12182–12187. [Google Scholar] [CrossRef] [PubMed]
- Altman, M.O.; Angeletti, D.; Yewdell, J.W. Antibody Immunodominance: The Key to Understanding Influenza Virus Antigenic Drift. Viral Immunol. 2018, 31, 142–149. [Google Scholar] [CrossRef] [PubMed]
- Wu, N.C.; Wilson, I.A. A Perspective on the Structural and Functional Constraints for Immune Evasion: Insights from Influenza Virus. J. Mol. Biol. 2017, 429, 2694–2709. [Google Scholar] [CrossRef]
- Wang, Z.; Wan, Y.; Qiu, C.; Quinones-Parra, S.; Zhu, Z.; Loh, L.; Tian, D.; Ren, Y.; Hu, Y.; Zhang, X.; et al. Recovery from severe H7N9 disease is associated with diverse response mechanisms dominated by CD8(+) T cells. Nat. Commun. 2015, 6, 6833. [Google Scholar] [CrossRef]
- Sridhar, S.; Begom, S.; Bermingham, A.; Hoschler, K.; Adamson, W.; Carman, W.; Bean, T.; Barclay, W.; Deeks, J.J.; Lalvani, A. Cellular immune correlates of protection against symptomatic pandemic influenza. Nat. Med. 2013, 19, 1305–1312. [Google Scholar] [CrossRef] [PubMed]
- Wilkinson, T.M.; Li, C.K.; Chui, C.S.; Huang, A.K.; Perkins, M.; Liebner, J.C.; Lambkin-Williams, R.; Gilbert, A.; Oxford, J.; Nicholas, B.; et al. Preexisting influenza-specific CD4+ T cells correlate with disease protection against influenza challenge in humans. Nat. Med. 2012, 18, 274–280. [Google Scholar] [CrossRef] [PubMed]
- McElhaney, J.E.; Xie, D.; Hager, W.D.; Barry, M.B.; Wang, Y.; Kleppinger, A.; Ewen, C.; Kane, K.P.; Bleackley, R.C. T cell responses are better correlates of vaccine protection in the elderly. J. Immunol. 2006, 176, 6333–6339. [Google Scholar] [CrossRef]
- Savic, M.; Dembinski, J.L.; Kim, Y.; Tunheim, G.; Cox, R.J.; Oftung, F.; Peters, B.; Mjaaland, S. Epitope specific T-cell responses against influenza A in a healthy population. Immunology 2016, 147, 165–177. [Google Scholar] [CrossRef]
- Zens, K.D.; Chen, J.K.; Farber, D.L. Vaccine-generated lung tissue-resident memory T cells provide heterosubtypic protection to influenza infection. JCI Insight 2016, 1, e85832. [Google Scholar] [CrossRef] [PubMed]
- Rak, A.; Isakova-Sivak, I.; Rudenko, L. Nucleoprotein as a Promising Antigen for Broadly Protective Influenza Vaccines. Vaccines 2023, 11, 1747. [Google Scholar] [CrossRef] [PubMed]
- van de Ven, K.; Lanfermeijer, J.; van Dijken, H.; Muramatsu, H.; Vilas Boas de Melo, C.; Lenz, S.; Peters, F.; Beattie, M.B.; Lin, P.J.C.; Ferreira, J.A.; et al. A universal influenza mRNA vaccine candidate boosts T cell responses and reduces zoonotic influenza virus disease in ferrets. Sci. Adv. 2022, 8, eadc9937. [Google Scholar] [CrossRef] [PubMed]
- Xiong, F.; Zhang, C.; Shang, B.; Zheng, M.; Wang, Q.; Ding, Y.; Luo, J.; Li, X. An mRNA-based broad-spectrum vaccine candidate confers cross-protection against heterosubtypic influenza A viruses. Emerg. Microbes Infect. 2023, 12, 2256422. [Google Scholar] [CrossRef] [PubMed]
- Boon, A.C.M.; de Mutsert, G.; Graus, Y.M.F.; Fouchier, R.A.M.; Sintnicolaas, K.; Osterhaus, A.D.M.E.; Rimmelzwaan, G.F. The Magnitude and Specificity of Influenza A Virus-Specific Cytotoxic T-Lymphocyte Responses in Humans Is Related to HLA-A and -B Phenotype. J. Virol. 2002, 76, 582–590. [Google Scholar] [CrossRef] [PubMed]
- Nguyen, T.H.O.; Sant, S.; Bird, N.L.; Grant, E.J.; Clemens, E.B.; Koutsakos, M.; Valkenburg, S.A.; Gras, S.; Lappas, M.; Jaworowski, A.; et al. Perturbed CD8+ T cell immunity across universal influenza epitopes in the elderly. J. Leukoc. Biol. 2017, 103, 321–339. [Google Scholar] [CrossRef] [PubMed]
- Sant, S.; Grzelak, L.; Wang, Z.; Pizzolla, A.; Koutsakos, M.; Crowe, J.; Loudovaris, T.; Mannering, S.I.; Westall, G.P.; Wakim, L.M.; et al. Single-Cell Approach to Influenza-Specific CD8(+) T Cell Receptor Repertoires Across Different Age Groups, Tissues, and Following Influenza Virus Infection. Front. Immunol. 2018, 9, 1453. [Google Scholar] [CrossRef] [PubMed]
- Yager, E.J.; Ahmed, M.; Lanzer, K.; Randall, T.D.; Woodland, D.L.; Blackman, M.A. Age-associated decline in T cell repertoire diversity leads to holes in the repertoire and impaired immunity to influenza virus. J. Exp. Med. 2008, 205, 711–723. [Google Scholar] [CrossRef]
- Valkenburg, S.A.; Venturi, V.; Dang, T.H.; Bird, N.L.; Doherty, P.C.; Turner, S.J.; Davenport, M.P.; Kedzierska, K. Early priming minimizes the age-related immune compromise of CD8(+) T cell diversity and function. PLoS Pathog. 2012, 8, e1002544. [Google Scholar] [CrossRef]
- Van Braeckel-Budimir, N.; Varga, S.M.; Badovinac, V.P.; Harty, J.T. Repeated Antigen Exposure Extends the Durability of Influenza-Specific Lung-Resident Memory CD8(+) T Cells and Heterosubtypic Immunity. Cell Rep. 2018, 24, 3374–3382.e3373. [Google Scholar] [CrossRef]
- Slütter, B.; Van Braeckel-Budimir, N.; Abboud, G.; Varga, S.M.; Salek-Ardakani, S.; Harty, J.T. Dynamics of influenza-induced lung-resident memory T cells underlie waning heterosubtypic immunity. Sci. Immunol. 2017, 2, eaag2031. [Google Scholar] [CrossRef] [PubMed]
- Wu, T.; Hu, Y.; Lee, Y.T.; Bouchard, K.R.; Benechet, A.; Khanna, K.; Cauley, L.S. Lung-resident memory CD8 T cells (TRM) are indispensable for optimal cross-protection against pulmonary virus infection. J. Leukoc. Biol. 2014, 95, 215–224. [Google Scholar] [CrossRef] [PubMed]
- Cookenham, T.; Lanzer, K.G.; Tighe, M.; Ward, J.M.; Reiley, W.W.; Blackman, M.A. Visualization of Resident Memory CD8 T Cells in the Lungs of Young and Aged Influenza Memory Mice and after Heterosubtypic Challenge. Immunohorizons 2021, 5, 543–556. [Google Scholar] [CrossRef] [PubMed]
- R Core Team. R: A Language and Environment for Statistical Computing, 4.1.1; R Foundation for Statistical Computing: Vienna, Austria, 2021. [Google Scholar]
- Crowell, H.; Chevrier, S.Z.V.; Robinson, M. CATALYST: Cytometry dATa anALYSis Tools. R Package Version 1.14.0. 2021. [Google Scholar]
- Zhang, J.; Kobert, K.; Flouri, T.; Stamatakis, A. PEAR: A fast and accurate Illumina Paired-End reAd mergeR. Bioinformatics 2014, 30, 614–620. [Google Scholar] [CrossRef] [PubMed]
- Gerritsen, B.; Pandit, A.; Andeweg, A.C.; de Boer, R.J. RTCR: A pipeline for complete and accurate recovery of T cell repertoires from high throughput sequencing data. Bioinformatics 2016, 32, 3098–3106. [Google Scholar] [CrossRef] [PubMed]
- Venturi, V.; Kedzierska, K.; Turner, S.J.; Doherty, P.C.; Davenport, M.P. Methods for comparing the diversity of samples of the T cell receptor repertoire. J. Immunol. Methods 2007, 321, 182–195. [Google Scholar] [CrossRef] [PubMed]
- Benjamini, Y.; Krieger, A.M.; Yekutieli, D. Adaptive linear step-up procedures that control the false discovery rate. Biometrika 2006, 93, 491–507. [Google Scholar] [CrossRef]
- Flurkey, K.; McUrrer, J.; Harrison, D. Mouse Models in Aging Research. In The Mouse in Biomedical Research; Academic Press: Cambridge, MA, USA, 2007; pp. 637–672. [Google Scholar]
- Dutta, S.; Sengupta, P. Men and mice: Relating their ages. Life Sci. 2016, 152, 244–248. [Google Scholar] [CrossRef] [PubMed]
- Pauken, K.E.; Godec, J.; Odorizzi, P.M.; Brown, K.E.; Yates, K.B.; Ngiow, S.F.; Burke, K.P.; Maleri, S.; Grande, S.M.; Francisco, L.M.; et al. The PD-1 Pathway Regulates Development and Function of Memory CD8(+) T Cells following Respiratory Viral Infection. Cell Rep. 2020, 31, 107827. [Google Scholar] [CrossRef]
- Badovinac, V.P.; Porter, B.B.; Harty, J.T. Programmed contraction of CD8(+) T cells after infection. Nat. Immunol. 2002, 3, 619–626. [Google Scholar] [CrossRef]
- Sercan Alp, O.; Durlanik, S.; Schulz, D.; McGrath, M.; Grun, J.R.; Bardua, M.; Ikuta, K.; Sgouroudis, E.; Riedel, R.; Zehentmeier, S.; et al. Memory CD8(+) T cells colocalize with IL-7(+) stromal cells in bone marrow and rest in terms of proliferation and transcription. Eur. J. Immunol. 2015, 45, 975–987. [Google Scholar] [CrossRef]
- Reilly, E.C.; Lambert Emo, K.; Buckley, P.M.; Reilly, N.S.; Smith, I.; Chaves, F.A.; Yang, H.; Oakes, P.W.; Topham, D.J. TRM integrins CD103 and CD49a differentially support adherence and motility after resolution of influenza virus infection. Proc. Natl. Acad. Sci. USA 2020, 117, 12306–12314. [Google Scholar] [CrossRef] [PubMed]
- Ray, S.J.; Franki, S.N.; Pierce, R.H.; Dimitrova, S.; Koteliansky, V.; Sprague, A.G.; Doherty, P.C.; de Fougerolles, A.R.; Topham, D.J. The collagen binding alpha1beta1 integrin VLA-1 regulates CD8 T cell-mediated immune protection against heterologous influenza infection. Immunity 2004, 20, 167–179. [Google Scholar] [CrossRef] [PubMed]
- Ariotti, S.; Hogenbirk, M.A.; Dijkgraaf, F.E.; Visser, L.L.; Hoekstra, M.E.; Song, J.Y.; Jacobs, H.; Haanen, J.B.; Schumacher, T.N. T cell memory. Skin-resident memory CD8(+) T cells trigger a state of tissue-wide pathogen alert. Science 2014, 346, 101–105. [Google Scholar] [CrossRef] [PubMed]
- Schenkel, J.M.; Fraser, K.A.; Vezys, V.; Masopust, D. Sensing and alarm function of resident memory CD8(+) T cells. Nat. Immunol. 2013, 14, 509–513. [Google Scholar] [CrossRef] [PubMed]
- McMaster, S.R.; Wilson, J.J.; Wang, H.; Kohlmeier, J.E. Airway-Resident Memory CD8 T Cells Provide Antigen-Specific Protection against Respiratory Virus Challenge through Rapid IFN-gamma Production. J. Immunol. 2015, 195, 203–209. [Google Scholar] [CrossRef] [PubMed]
- Vitiello, A.; Yuan, L.; Chesnut, R.W.; Sidney, J.; Southwood, S.; Farness, P.; Jackson, M.R.; Peterson, P.A.; Sette, A. Immunodominance Analysis of CTL Responses to Influenza PR8 Reveals Two Dominant and Subdominant Kb-restricted Epitopes. J. Immunol. 1996, 157, 5555–5562. [Google Scholar] [CrossRef] [PubMed]
- Belz, G.T.; Stevenson, P.G.; Doherty, P.C. Contemporary analysis of MHC-related immunodominance hierarchies in the CD8+ T cell response to influenza A viruses. J. Immunol. 2000, 165, 2404–2409. [Google Scholar] [CrossRef]
- Belz, G.T.; Xie, W.; Doherty, P.C. Diversity of epitope and cytokine profiles for primary and secondary influenza a virus-specific CD8+ T cell responses. J. Immunol. 2001, 166, 4627–4633. [Google Scholar] [CrossRef]
- Belz, G.T.; Xie, W.; Altman, J.D.; Doherty, P.C. A Previously Unrecognized H-2Db-Restricted Peptide Prominent in the Primary Influenza A Virus-specific CD8+ T-Cell Response Is Much Less Apparent following Secondary Challenge. J. Virol. 2000, 74, 3486–3493. [Google Scholar] [CrossRef]
- Crowe, S.R.; Turner, S.J.; Miller, S.C.; Roberts, A.D.; Rappolo, R.A.; Doherty, P.C.; Ely, K.H.; Woodland, D.L. Differential antigen presentation regulates the changing patterns of CD8+ T cell immunodominance in primary and secondary influenza virus infections. J. Exp. Med. 2003, 198, 399–410. [Google Scholar] [CrossRef] [PubMed]
- Flynn, K.J.; Belz, G.T.; Altman, J.D.; Ahmed, R.; Woodland, D.L.; Doherty, P.C. Virus-specific CD8+ T cells in primary and secondary influenza pneumonia. Immunity 1998, 8, 683–691. [Google Scholar] [CrossRef] [PubMed]
- Kedzierska, K. Conserved T cell receptor usage in primary and recall responses to an immunodominant influenza virus nucleoprotein epitope. Proc. Natl. Acad. Sci. USA 2004, 101, 4942–4947. [Google Scholar] [CrossRef]
- Busch, D.H.; Pilip, I.; Pamer, E.G. Evolution of a Complex T Cell Receptor Repertoire during Primary and Recall Bacterial Infection. J. Exp. Med. 1998, 188, 61–70. [Google Scholar] [CrossRef] [PubMed]
- Trautmann, L.; Rimbert, M.; Echasserieau, K.; Saulquin, X.; Neveu, B.; Dechanet, J.; Cerundolo, V.; Bonneville, M. Selection of T Cell Clones Expressing High-Affinity Public TCRs within Human Cytomegalovirus-Specific CD8 T Cell Responses. J. Immunol. 2005, 175, 6123–6132. [Google Scholar] [CrossRef] [PubMed]
- Price, D.A.; Brenchley, J.M.; Ruff, L.E.; Betts, M.R.; Hill, B.J.; Roederer, M.; Koup, R.A.; Migueles, S.A.; Gostick, E.; Wooldridge, L.; et al. Avidity for antigen shapes clonal dominance in CD8+ T cell populations specific for persistent DNA viruses. J. Exp. Med. 2005, 202, 1349–1361. [Google Scholar] [CrossRef]
- Cukalac, T.; Kan, W.T.; Dash, P.; Guan, J.; Quinn, K.M.; Gras, S.; Thomas, P.G.; La Gruta, N.L. Paired TCRalphabeta analysis of virus-specific CD8(+) T cells exposes diversity in a previously defined ‘narrow’ repertoire. Immunol. Cell Biol. 2015, 93, 804–814. [Google Scholar] [CrossRef]
- Kedzierska, K.; Day, E.B.; Pi, J.; Heard, S.B.; Doherty, P.C.; Turner, S.J.; Perlman, S. Quantification of repertoire diversity of influenza-specific epitopes with predominant public or private TCR usage. J. Immunol. 2006, 177, 6705–6712. [Google Scholar] [CrossRef] [PubMed]
- Turner, S.J.; Diaz, G.; Cross, R.; Doherty, P.C. Analysis of Clonotype Distribution and Persistence for an Influenza Virus-Specific CD8 T cell response. Immunity 2003, 18, 549–559. [Google Scholar] [CrossRef]
- Slütter, B.; Pewe, L.L.; Kaech, S.M.; Harty, J.T. Lung airway-surveilling CXCR3(hi) memory CD8(+) T cells are critical for protection against influenza A virus. Immunity 2013, 39, 939–948. [Google Scholar] [CrossRef]
- Pizzolla, A.; Nguyen, T.H.O.; Smith, J.M.; Brooks, A.G.; Kedzieska, K.; Heath, W.R.; Reading, P.C.; Wakim, L.M. Resident memory CD8(+) T cells in the upper respiratory tract prevent pulmonary influenza virus infection. Sci. Immunol. 2017, 2, eaam6970. [Google Scholar] [CrossRef]
- Cheuk, S.; Schlums, H.; Gallais Serezal, I.; Martini, E.; Chiang, S.C.; Marquardt, N.; Gibbs, A.; Detlofsson, E.; Introini, A.; Forkel, M.; et al. CD49a Expression Defines Tissue-Resident CD8(+) T Cells Poised for Cytotoxic Function in Human Skin. Immunity 2017, 46, 287–300. [Google Scholar] [CrossRef] [PubMed]
- Reilly, E.C.; Sportiello, M.; Emo, K.L.; Amitrano, A.M.; Jha, R.; Kumar, A.B.R.; Laniewski, N.G.; Yang, H.; Kim, M.; Topham, D.J. CD49a Identifies Polyfunctional Memory CD8 T Cell Subsets that Persist in the Lungs After Influenza Infection. Front. Immunol. 2021, 12, 728669. [Google Scholar] [CrossRef]
- Schenkel, J.M.; Masopust, D. Tissue-resident memory T cells. Immunity 2014, 41, 886–897. [Google Scholar] [CrossRef]
- Anderson, K.G.; Mayer-Barber, K.; Sung, H.; Beura, L.; James, B.R.; Taylor, J.J.; Qunaj, L.; Griffith, T.S.; Vezys, V.; Barber, D.L.; et al. Intravascular staining for discrimination of vascular and tissue leukocytes. Nat. Protoc. 2014, 9, 209–222. [Google Scholar] [CrossRef] [PubMed]
- Westera, L.; Drylewicz, J.; Den Braber, I.; Mugwagwa, T.; Van Der Maas, I.; Kwast, L.; Volman, T.; Van De Weg-Schrijver, E.H.R.; Bartha, I.; Spierenburg, G.; et al. Closing the gap between T-cell life span estimates from stable isotope-labeling studies in mice and humans. Blood 2013, 122, 2205–2212. [Google Scholar] [CrossRef] [PubMed]
- Kucharski, A.J.; Lessler, J.; Read, J.M.; Zhu, H.; Jiang, C.Q.; Guan, Y.; Cummings, D.A.; Riley, S. Estimating the life course of influenza A(H3N2) antibody responses from cross-sectional data. PLoS Biol. 2015, 13, e1002082. [Google Scholar] [CrossRef] [PubMed]
- Somes, M.P.; Turner, R.M.; Dwyer, L.J.; Newall, A.T. Estimating the annual attack rate of seasonal influenza among unvaccinated individuals: A systematic review and meta-analysis. Vaccine 2018, 36, 3199–3207. [Google Scholar] [CrossRef] [PubMed]
- Kedzierska, K.; Venturi, V.; Field, K.; Davenport, M.P.; Turner, S.J.; Doherty, P.C. Early establishment of diverse T cell receptor profiles for influenza-specific CD8+CD62Lhi memory T cells. Proc. Natl. Acad. Sci. USA 2006, 103, 9184–9189. [Google Scholar] [CrossRef]
- van de Sandt, C.E.; Hillaire, M.L.; Geelhoed-Mieras, M.M.; Osterhaus, A.D.; Fouchier, R.A.; Rimmelzwaan, G.F. Human Influenza A Virus-Specific CD8+ T-Cell Response Is Long-lived. J. Infect. Dis. 2015, 212, 81–85. [Google Scholar] [CrossRef]
- Sullivan, K.M.; Monto, A.S.; Longini, I.M., Jr. Estimates of the US health impact of influenza. Am. J. Public. Health 1993, 83, 1712–1716. [Google Scholar] [CrossRef] [PubMed]
- Fraser, K.A.; Schenkel, J.M.; Jameson, S.C.; Vezys, V.; Masopust, D. Preexisting high frequencies of memory CD8+ T cells favor rapid memory differentiation and preservation of proliferative potential upon boosting. Immunity 2013, 39, 171–183. [Google Scholar] [CrossRef] [PubMed]
- Jabbari, A.; Harty, J.T. Secondary memory CD8+ T cells are more protective but slower to acquire a central-memory phenotype. J. Exp. Med. 2006, 203, 919–932. [Google Scholar] [CrossRef] [PubMed]
- Masopust, D.; Ha, S.J.; Vezys, V.; Ahmed, R. Stimulation history dictates memory CD8 T cell phenotype: Implications for prime-boost vaccination. J. Immunol. 2006, 177, 831–839. [Google Scholar] [CrossRef] [PubMed]


Disclaimer/Publisher’s Note: The statements, opinions and data contained in all publications are solely those of the individual author(s) and contributor(s) and not of MDPI and/or the editor(s). MDPI and/or the editor(s) disclaim responsibility for any injury to people or property resulting from any ideas, methods, instructions or products referred to in the content. |
© 2024 by the authors. Licensee MDPI, Basel, Switzerland. This article is an open access article distributed under the terms and conditions of the Creative Commons Attribution (CC BY) license (https://creativecommons.org/licenses/by/4.0/).
Share and Cite
Lanfermeijer, J.; van de Ven, K.; Hendriks, M.; van Dijken, H.; Lenz, S.; Vos, M.; Borghans, J.A.M.; van Baarle, D.; de Jonge, J. The Memory-CD8+-T-Cell Response to Conserved Influenza Virus Epitopes in Mice Is Not Influenced by Time Since Previous Infection. Vaccines 2024, 12, 419. https://doi.org/10.3390/vaccines12040419
Lanfermeijer J, van de Ven K, Hendriks M, van Dijken H, Lenz S, Vos M, Borghans JAM, van Baarle D, de Jonge J. The Memory-CD8+-T-Cell Response to Conserved Influenza Virus Epitopes in Mice Is Not Influenced by Time Since Previous Infection. Vaccines. 2024; 12(4):419. https://doi.org/10.3390/vaccines12040419
Chicago/Turabian StyleLanfermeijer, Josien, Koen van de Ven, Marion Hendriks, Harry van Dijken, Stefanie Lenz, Martijn Vos, José A. M. Borghans, Debbie van Baarle, and Jørgen de Jonge. 2024. "The Memory-CD8+-T-Cell Response to Conserved Influenza Virus Epitopes in Mice Is Not Influenced by Time Since Previous Infection" Vaccines 12, no. 4: 419. https://doi.org/10.3390/vaccines12040419
APA StyleLanfermeijer, J., van de Ven, K., Hendriks, M., van Dijken, H., Lenz, S., Vos, M., Borghans, J. A. M., van Baarle, D., & de Jonge, J. (2024). The Memory-CD8+-T-Cell Response to Conserved Influenza Virus Epitopes in Mice Is Not Influenced by Time Since Previous Infection. Vaccines, 12(4), 419. https://doi.org/10.3390/vaccines12040419