Abstract
New vaccination programs measure economic success through cost-effectiveness analysis (CEA) based on an outcome evaluated over a certain time frame. The reimbursement price of the newly approved vaccine is then often reliant on a simulated ideal effect projection because of limited long-term data availability. This optimal cost-effectiveness result is later rarely adjusted to the observed effect measurements, barring instances of market competition-induced price erosion through the tender process. However, comprehensive and systematic monitoring of the vaccine effect (VE) for the evaluation of the real long-term economic success of vaccination is critical. It informs expectations about vaccine performance with success timelines for the investment. Here, an example is provided by a 15-year assessment of the rotavirus vaccination program in Belgium (RotaBIS study spanning 2005 to 2019 across 11 hospitals). The vaccination program started in late 2006 and yielded sub-optimal outcomes. Long-term VE surveillance data provided insights into the infection dynamics, disease progression, and vaccine performance. The presented analysis introduces novel conceptual frameworks and methodologies about the long-term economic success of vaccination programs. The CEA evaluates the initial target vaccination population, considering vaccine effectiveness compared with a historical unvaccinated group. Cost-impact analysis (CIA) covers a longer period and considers the whole vaccinated and unvaccinated population in which the vaccine has direct and indirect effects. The economic success index ratio of CIA over CEA outcomes evaluates long-term vaccination performance. Good performance is close to the optimal result, with an index value ≤1, combined with a low CEA. This measurement is a valuable aid for new vaccine introductions. It supports the establishment of robust monitoring protocols over time.
1. Introduction
The success of a vaccine is expressed as its vaccine effect (VE). This is referred to as ‘vaccine efficacy’ when assessed under the strict conditions of a double-blinded randomized controlled trial (RCT) evaluating vaccinated and unvaccinated subjects over a fixed period [1], and as ‘vaccine effectiveness’ when assessed under uncontrolled conditions comparing vaccinated and unvaccinated groups in real-world practice [2]. VE may change over time and may decrease, described as vaccine waning. Different types of waning can be identified [3]. In classical waning, the vaccine inoculum does not activate a sustainable immune response in the host, and this can be remedied by a vaccine booster dose. Another waning process is related to the vaccine’s biological activity, producing partial antigen activation, and resulting in lower VE over time after multiple exposures to the pathogen. Such leaky or partially responding effects have been described in studies analyzing influenza vaccines introduced in recent years [4,5,6]. A third type of waning, which differs from the previous two in that it is not caused by the vaccine, may appear with suboptimal introduction of a new vaccine. This type of waning, referred to in this paper as ‘strategic waning’, can only be detected by long-term measurement of VE [7], and it is the focus of this paper. This analysis proposes an approach to measuring the success of a vaccination program from an economic perspective across the whole population, including any strategic waning effect. Epidemiological assessments of infectious diseases and vaccinations are made at the level of comparative groups and use the term ‘effectiveness’, whereas evaluations at the level of the whole population use the term ‘impact’ assessment [8]. Health economic evaluations have not conventionally made this distinction; however, it could help to understand that vaccination may have a broader and longer economic impact on the whole population extending beyond specific comparable at-risk target groups [9,10]. Furthermore, a sub-optimal start to a vaccination program may affect the long-term impact of the vaccination program on the whole population. This paper illustrates this potential effect and highlights the importance of evaluating a vaccination program in a broader context than the conventional one. Most of the analyses and results presented here are based on rotavirus vaccine introduction in Belgium using data from the RotaBIS study. Many of the results have already been published elsewhere [7,9,11,12]. This paper builds on previous publications by making the link between effectiveness and impact and showing how the success or failure of a new vaccination program can be measured using a new ratio calculation, called the success index. This helps to assess the economic long-term value achieved with vaccination in complex environments. The paper uses cost-effectiveness and cost-impact analyses to obtain results that should help healthcare payers assess whether the investment in a vaccination program was successful [13].
2. Materials and Methods
2.1. Background
This analysis concerns rotavirus infection and its vaccination in a high-income country, Belgium. Rotavirus infection is distinctive in that it is seasonal in the northern hemisphere, spreading during each winter period from around January to March/April, and affects children up to 5 years old, causing severe diarrhea with a risk of dehydration [14]. Different sources of this infection exist, but the primary source is infants aged 3 to 14 months who spread the infection across the whole at-risk group. More exposure to infection increases the immunity level against the disease [15]. The infection is contagious, with a primary reproductive number of R0 estimated at around 9 under normal conditions [16,17]. The disease spread as a function of age has a clear Weibull distribution pattern, with a mean around 15 months of age and a long decreasing tail to the right up to 60 months of age [14]. Rotavirus infection has mainly been studied by the rate of cases leading to hospitalization, with less measurement of infection rates at the primary healthcare or family care level as laboratory tests are not systematically conducted. Two vaccines are available in high-income countries, a two-dose vaccine (Rotarix, GSK Biologicals, Wavre, Belgium) and a three-dose vaccine (Rotateq, Merck, Rahway, NJ, USA), which should be given at the age of 6 weeks for the first dose with a 4-week interval for subsequent doses [18,19,20]. As reported in clinical trials, vaccination provides a very high response rate in reducing severe cases [21,22]. However, the vaccination should be given prior to 32 weeks of age as it may have a very low risk of the severe adverse effect of intussusception [23,24]. There is, therefore, no option to introduce a catch-up vaccine strategy to vaccinate everyone at risk at once. Consequently, every newborn needs to be vaccinated, and the time required to cover the whole at-risk group (children up to 5 years old) with vaccination may be at least 5 years. The possibility of vaccine waning over time has been suggested, based on comparing the first- and second-year efficacy data [25]. When introduced in a child population in the defined age group (aged 6 weeks to 8 months), the vaccine diminishes infection in the primary source (infants aged 3–14 months). Consequently it causes an indirect protective effect amongst the unvaccinated individuals in the population. This also reduces the potential for creating secondary sources of infection in the same target group, i.e., infection sources developed as a consequence of the primary source. So the primary source is not only the cause of direct infection but also the cause of secondary infection [11]. If the vaccine substantially reduces the primary source of infection by achieving a high coverage rate at start of the vaccination program, it can also reduce the secondary sources of infection, thus causing an important additional indirect effect. If the vaccine coverage is lower and/or the timing of the program’s introduction is sub-optimal in relation to the disease’s seasonality, it allows a greater manifestation of secondary sources of infection that are not influenced by the vaccine’s direct effect. The level of secondary infection sources affects the vaccine’s effect over time and the endemicity level of rotavirus in the whole population. Increasing vaccine coverage has an immediate impact only on the initial primary source, with a lesser effect on secondary sources of infection that develop into new primary sources of infection in the population over time [7].
2.2. Economic Assessment
An economic value assessment of a vaccine, short to long term, must rely on two sources of information: data observations and credible modeling exercises.
2.2.1. Data
The data observations are from the RotaBIS study, which started to assemble information in 2007, a year after the vaccine’s introduction. The vaccine price was 80% reimbursed by the Belgian authorities in November 2006 [26,27]. Hospital data on rotavirus infection in young children were retrospectively collected for the years of 2005 and 2006. The same information was further collected annually for 13 years (2007 to 2019) from 11 hospitals that were representative of the different parts of the country (9 were general hospitals with a pediatric ward, 2 were pediatric-only hospitals, and 4 of the 11 hospitals were academic centers). The data assembled for each event, in addition to the lab test results and dates of rotavirus detection, were the date of hospitalization, the age when the disease occurred, sex, duration of hospitalization, and nosocomial acquisition. The study protocol with the first data analyses was presented in 2011 [28]. The information relevant to the present analysis is summarized in Table 1, showing the numbers of disease-specific hospitalizations by age and year reported over a total period of 15 years (the pre-vaccination years of 2005 and 2006 are reported as average values for the two years combined).

Table 1.
Number of rotavirus hospitalizations by age and year (m—month; Yn—year number).
2.2.2. Modeling
Models must replicate the observed data (blue line in Figure 1A). They are constructed based on variables that affect the observed curve with direct and indirect vaccine effects [7]. To facilitate model construction, the observation period was split into two timeframes (period I and period II), with a different model type for each period (Figure 1B). Full details about the models, including sensitivity analyses, have been published elsewhere [7].
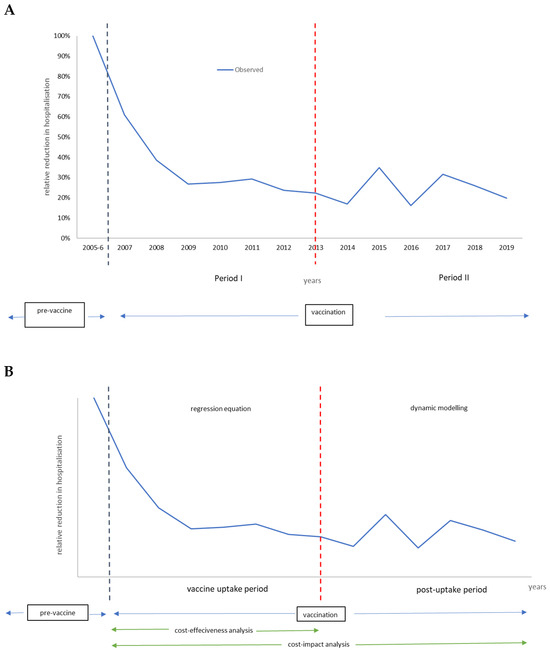
Figure 1.
Defining two periods in the vaccination program model (A). The model specificities in each period and economic evaluation type (B).
Vaccination period I is the vaccine uptake period, which may last 5 to 7 years until a new infection equilibrium has been reached in the target group of children aged ≤5 years. The model selected for that period uses a time-dependent regression equation that shapes the curve with the different forces that impact the regression line, reproducing the number of disease-specific hospitalizations observed per year. Two overall forces identify each combination of several components. The first overall force includes the direct vaccine effect, with components of effectiveness, coverage, and waning. The second overall force looks at the indirect effect of the vaccine, with components of herd effect and secondary sources of infection. The uptake period defined here is the measurement of vaccine ‘effectiveness’, which should be stable when the new infection equilibrium is reached in the target group at the end of period I.
Period I is subsequently followed by the post-uptake period (period II). During that second period, the dynamic infection spread is simulated through a time differential compartmental equation with susceptible, infectious, and recovered (SIR) groups. Those compartments are linked by transition rates replicating the observed biennial disease peaks over time using a Hamer model design [29]. The frequency and height of the peaks depend on the entry conditions defined at the end of period I. The entry conditions include the remaining infection rate in the population, the maintained vaccine coverage rate with its net effect, the susceptible group (newborns) entering at any given time point, and the contact matrix of the at-risk population. It is important to note that the initial primary source of infection pre-vaccination has now moved in the post-uptake period (period II) to an older age group. The shift is developed during the vaccine uptake period (period I) when the vaccine coverage and the timing of initiating the vaccination program are not optimal. The total period of period I + period II is defined here as the period over which the vaccine ‘impact’ assessment is calculated.
2.3. Cost-Effectiveness and Cost-Impact Analysis
The economic evaluations have an identical basic formula to assess the two measures of interest: the cost-effectiveness analysis (CEA) and the cost-impact analysis (CIA). CEA references the vaccine uptake period using the modeled or observed data as input until the post-uptake period is reached. CEA evaluates the initial target vaccination population, considering the effectiveness of the direct and indirect effects of the vaccine, such as the positive herd effect and the opposing effect of secondary sources of infection in unvaccinated individuals, and compares the results with a historical group that is unvaccinated [30]. CIA covers a more extended period than CEA, including the uptake and post-uptake periods, and the whole vaccinated and unvaccinated population in which the vaccine has direct and indirect effects (the impact of the beneficial herd effect will be less than in CEA and the impact of the detrimental secondary infection source effect will be greater) again over time. The accumulated results are compared with the situation before initiating the vaccination program (pv) [10]. The formula for CIA is as follows:
where ∆ = difference; C = cost; E = health effect often expressed in quality-adjusted life-years (QALYs); pv = pre-vaccination; uv = unvaccinated; and v = vaccinated.
The negative indirect effect of vaccination on the whole population is added to the evaluation, as secondary sources of infection in older age groups develop into new primary sources of infection if the vaccination program’s initiation is not optimal. This evaluation method for CIA refers to impact assessment in epidemiology, as presented by Hanquet et al. [8], which is applied here as an economic assessment.
2.3.1. Input Data
Table 2 presents the input data for the estimation of the cost and QALY loss due to rotavirus hospitalization. These data are based on Belgium. The cost data are those used when the vaccine was launched in 2006 and received its reimbursement price in Belgium, which has marginally changed over time.
Table 2.
Cost and QALY loss input data used in the analysis.
Input values for the key variables that define the shape of the curve during the vaccine uptake period are presented in Table 3.
Table 3.
Key input data values for the uptake and the post-uptake period.
2.3.2. Output Data
The output obtained is the incremental cost-effect ratio (ICER) achieved, with ‘effect’ defined as ‘effectiveness’ or ‘impact’ measurement for CEA or CIA, respectively. Scenario evaluations are performed comparing the ICER of the uptake period (7 years) with the ICIR obtained for the uptake + post-uptake period (15 years), using observed data. The ICIR obtained of the observed data is then compared with the ICIR of the optimal launch and the ICIR of the worst-case launch. Discounting cost or health gains were not applied because the present analysis is concerned with assessing the optimal strategy for vaccine launch and not with assessing the vaccine’s value.
The output for the optimal launch and the worst-case vaccine launch scenarios used the previous two models, where the vaccine coverage rates were adjusted in each scenario (86% from the start in the optimal launch scenario and 40% in the worst-case scenario) with a slightly lower VE (0.86 instead of 0.95). The lower VE was justified by the potential presence of the two vaccine waning processes over time (reduced immune response, leaky vaccine). Figure 2 illustrates the decrease in hospitalizations simulated with the model programs for an optimal vaccine launch and a worst-case scenario of a poor vaccination launch, together with the observed data.
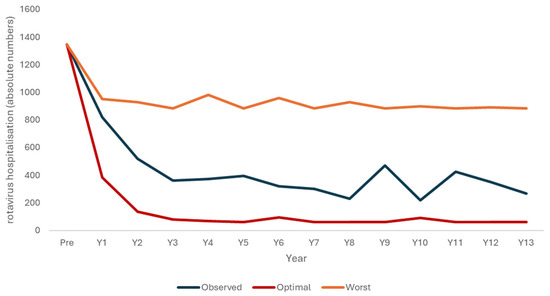
Figure 2.
Three scenarios of rotavirus hospitalizations decreasing due to the vaccination program, with a modeled optimal launch scenario (red), the observed data (blue), and a modeled worst-case scenario (orange).
2.4. The Success Index
The results of CEA and CIA do not reveal whether a vaccination program has been successful over time, with ‘success’ meaning that the vaccination is maintaining control of the infection spread, indicated by very low rates of disease-specific hospitalizations in the long term. Lower CEA results are often considered to have reached better outcomes. However, CEA is mainly performed to obtain a value assessment related to the acceptable vaccine price; therefore, a low CEA could also result from a low vaccine price and not from reasonable long-term control of infection spread achieved by the vaccination program. Reasonable control of infection spread would have the effect of reducing the frequency and height of the biennial peaks in the post-uptake period. There are, however, two situations in which those post-uptake peaks could be reduced. One results from optimal vaccine introduction with a high vaccine coverage at the start, inducing a high indirect effect with control of primary and secondary sources of infection, resulting in peaks of limited size and frequency in the long term. The other could result from deficient vaccine uptake, resulting in the continued dominance of the initial primary source of infection and consequently no clear manifestation of the secondary sources of infection in the long term. The two situations can be distinguished by considering the ratio of the results of CIA over CEA, here called the success index. A successful vaccination launch will have a ratio close to 1, with a low CEA result. A poor vaccination launch will also have a ratio close to 1, but with a high CEA result. Intermediate results indicate that the vaccination program was not a failure but could have been more successful with an optimal vaccine launch. The ratio will be close to 1.5, combined with a higher CEA result than that projected for the optimal launch. There is, therefore, a maximum ratio for CIA over CEA, dependent on the level of attenuation of the primary source of infection by the vaccination program.
3. Results
3.1. ICER Results
The cost-effectiveness results for the uptake period compared with no vaccination are shown in Table 4.
Table 4.
Cost-effectiveness results comparing days of hospitalization for no vaccination and vaccinated observed data for the vaccine uptake period.
The results shown in Table 5 compare hospitalization days for the whole uptake period, including post-uptake data with results for no vaccination. The ICER result from this CIA differs from that calculated in the previous CEA (Table 4) due to the appearance of secondary hospitalization peaks at 9 and 11 years post-vaccine introduction, which negatively impacts VE over time.
Table 5.
Cost-impact results comparing days of hospitalization regarding no vaccination, pre-launch predicted data, and the vaccinated observed data of the whole period.
3.2. The Success Index and the Scenario Analyses
Table 6 shows the success index ratio calculated from the CEA results (Table 4) and the CIA results (Table 5). Table 6 also presents the simulation results for the two scenarios of optimal vaccine launch and worst-case vaccine launch. Figure 3 shows the simulation results for the success index ratio expressed as a function of the CEA value calculated over a pre-specified evaluation period (defined in this analysis as 15 years). The results follow a lognormal outline distribution, illustrating the success and failure areas for this setting when the threshold for the CIA/CEA ratio has been set at 1 (CEAmax = €15,091 for S; CEAmin = €60,296 for F). The results for the optimal launch scenario, the worst-case launch scenario, and the observed Belgian data are plotted as point values; the optimal launch scenario falls into the success ‘S’ area of the outline, the worst-case launch scenario falls into the failure ‘F’ area, and the observed data from Belgium fall into an intermediate area (Figure 3).
Table 6.
Ratio calculation of CEA and CIA for observed and simulated data (undiscounted).
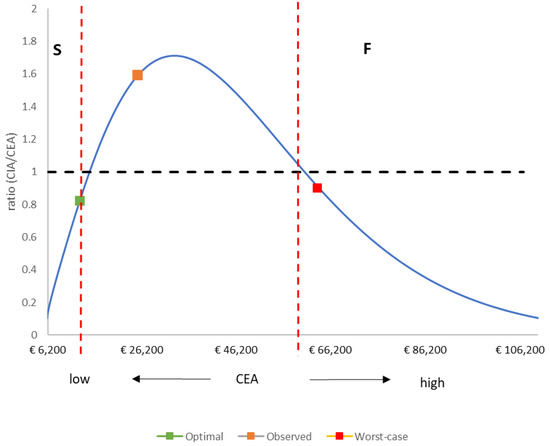
Figure 3.
Outline of the success index ratio (CIA/CEA) as a function of the CEA value over an evaluation period of 15 years. CEA: cost-effectiveness analysis; CIA: cost impact analysis; S: Success; F: Failure.
4. Discussion
The analysis presented here illustrates a potential approach for the assessment of preventive health programs, emphasizing the importance of establishing clear objectives regarding cost and health outcomes over defined timeframes at the start of a vaccination program. The proposed success index offers a way to evaluate the performance of the program in the real world over time. Initially, the rotavirus vaccination campaign targeted what was perceived as a minor health concern in high-income countries. Disease elimination was anticipated through progressively expanding vaccine coverage, and some models predicted success when the vaccine was launched in 2006 [33,34]. Early vaccination outcomes exhibited notable reductions in rotavirus hospitalizations within the first two years, yet subsequent declines plateaued [26]. The absence of systematic, ongoing health gain monitoring meant that new, biennial disease peaks appearing some years after vaccine introduction, reflecting strategic waning of the vaccination, may not have always been reported. The RotaBIS study in Belgium addressed this lack of monitoring by initiating a routine annual data collection system once the vaccine was approved and reimbursed [28]. The study was able to maintain data processing for several years into the post-uptake period because it was collecting data recorded in routine practice and thus required a limited budget assignment. Finally, rigorous data analysis was crucial for identifying anomalous trends and understanding the underlying phenomena. The use of comparative analyses with subtly different scenarios provided valuable insights, informing interpretations of the observed data anomalies. This required the creation of two evaluation periods in the analysis, the use of two models, outcome measures assessed over two periods, and the development of a new impact calculation, familiar in the epidemiology world but relatively new in the health economics arena. The approach illustrated the necessity of understanding the data assembled, the effect of different infection sources on disease spread, and the effect on the vaccine impact of a sub-optimal introduction. The sensitivity analyses of worst-case and optimal vaccination launch scenarios were useful because different countries were found to be close to the results projected in both scenarios. The United Kingdom (UK) and Finland indicate what might be expected with a near-optimal rotavirus vaccine launch, compared with sub-optimal launches in Spain and Ireland [35,36,37,38]. The present analysis proposes an approach to investigating whether a vaccination program is successful using the success index ratio.
This comprehensive analysis illustrated the importance of considering impact evaluations in economic assessment, as was adopted in epidemiological research a few decades ago [8,39]. It could be argued that CEA will capture the impact from short to long durations in any case. However, it is important to make the distinction between the effects in populations at risk compared with the whole population. The effects in the wider population, not the population targeted by vaccination, are the cause of the new primary source of rotavirus infection (older children who in the pre-vaccination period had been a secondary source of infection) that appeared in the post-uptake period when the vaccination was not optimally introduced at the start. This new primary source will not be easy to target because the rotavirus vaccine does not directly reach the new source, as these children are too old to receive the vaccine. Any vaccination campaign introduced across a population may affect others besides those at-risk groups for whom vaccination is intended. Broader consequences may appear, which need to be captured in economic evaluations. It was an option to stop the RotaBIS monitoring study after eight years when the new infection equilibrium in the target population appeared to have been reached. Fortunately, the study continued to collect data over a longer period, which helped to construct a better explanation for the plateau reached during the uptake period, approximately three years after the vaccine’s introduction. The study’s emphasis on impact evaluations within the economic assessments of vaccines reflects a paradigm shift in health economics, akin to methodologies long employed in epidemiological research. This approach, exemplified by the rotavirus vaccination case study, acknowledges the broader societal impacts of vaccination beyond individual health gains. Sensitivity analyses exploring various vaccination scenarios further contextualized the findings and provided insights into optimal vaccination strategies.
The present analysis developed the success index because it may be useful for healthcare decisionmakers to have an unequivocal measure of the success of a vaccination program. The results observed in Belgium during the first two years after rotavirus vaccine introduction were considered a great success, as the country was the first high-income country to introduce the new vaccine systematically. However, our modeling analyses, supported by experience with rotavirus vaccine introduction in other countries, indicate that better outcomes could have been obtained if more detail about infection spread and disease burden had been available and applied to inform the implementation and timing of the vaccine’s introduction in Belgium. Our results may be useful for any new vaccine in current or future development [40].
5. Conclusions
Vaccines and infections need to be assessed individually to take into account their unique characteristics. Nevertheless, the assessment framework presented here has broad applicability. The evaluation approach, focusing on community infection control processes, transcends traditional cost-effectiveness analyses, offering a more comprehensive understanding of the value of a vaccination program expressed through its success index score from short- to long-term evaluation. Although developed with specific reference to the case of rotavirus vaccination, the principles and methodologies outlined in the present study are relevant for assessing the clinical and economic implications of future vaccine introductions using such a score.
Author Contributions
Conceptualization: B.S. and M.T.; methodology: B.S. and M.T.; validation, B.S., M.R., O.E., B.B. and M.T.; formal analysis, B.S.; investigation, B.S., O.E. and B.B.; resources, B.S.; data curation, B.S. and M.R.; writing—original draft preparation, B.S.; writing—review and editing, B.S., M.R., O.E., B.B. and M.T.; visualization, B.S., M.T. and B.B.; supervision, M.T.; project administration, B.S. All authors have read and agreed to the published version of the manuscript.
Funding
This research received no external funding.
Institutional Review Board Statement
Not applicable as this study used only existing data already published.
Informed Consent Statement
Not applicable for this data here as the data were already published. We only give a new interpretation to existing data with a modelling exercise.
Data Availability Statement
All of the data used are presented in previous publications. The analysis models developed are available upon request from the corresponding author.
Acknowledgments
The authors would like to thank Carole Nadin for editorial assistance.
Conflicts of Interest
Author Bernd Benninghoff is employed by the A&N Immugen, this company has no commercial or financial relationships with this study. The remaining authors declare that the research was conducted in the absence of any commercial or financial relationships that could be construed as a potential conflict of interest.
References
- Halloran, M.E.; Longini, I.M.; Struchiner, C.J. Design and Analysis of Vaccine Studies; Gail, M., Krickeberg, K., Samet, J., Tsiatis, A., Wong, W., Eds.; Springer: New York, NY, USA; Dordrecht, The Netherlands; Berlin/Heidelberg, Germany; London, UK, 2010; 387p. [Google Scholar]
- Halloran, M.E.; Longini, I.M., Jr.; Struchiner, C.J. Design and interpretation of vaccine field studies. Epidemiol. Rev. 1999, 21, 73–88. [Google Scholar] [CrossRef] [PubMed]
- Halloran, M.E.; Longini, I.M., Jr.; Struchiner, C.J. Estimability and interpretation of vaccine efficacy using frailty mixing models. Am. J. Epidemiol. 1996, 144, 83–97. [Google Scholar] [CrossRef] [PubMed]
- Ray, G.T.; Lewis, N.; Klein, N.P.; Daley, M.F.; Wang, S.V.; Kulldorff, M.; Fireman, B. Intraseason Waning of Influenza Vaccine Effectiveness. Clin. Infect. Dis. 2019, 68, 1623–1630. [Google Scholar] [CrossRef] [PubMed]
- Tokars, J.I.; Patel, M.M.; Foppa, I.M.; Reed, C.; Fry, A.M.; Ferdinands, J.M. Waning of Measured Influenza Vaccine Effectiveness Over Time: The Potential Contribution of Leaky Vaccine Effect. Clin. Infect. Dis. 2020, 71, e633–e641. [Google Scholar] [CrossRef] [PubMed]
- Lipsitch, M. Challenges of Vaccine Effectiveness and Waning Studies. Clin. Infect. Dis. 2019, 68, 1631–1633. [Google Scholar] [CrossRef]
- Standaert, B.; Benninghoff, B. Defining the Recipe for an Optimal Rotavirus Vaccine Introduction in a High-Income Country in Europe. Viruses 2022, 14, 425. [Google Scholar] [CrossRef]
- Hanquet, G.; Valenciano, M.; Simondon, F.; Moren, A. Vaccine effects and impact of vaccination programmes in post-licensure studies. Vaccine 2013, 31, 5634–5642. [Google Scholar] [CrossRef]
- Standaert, B. The economic value of rotavirus vaccination when optimally implemented in a high-income country. Vaccines 2023, 11, 917. [Google Scholar] [CrossRef]
- Standaert, B.; Dort, T.; Toumi, M. Vaccine Efficacy, Effectiveness, or Impact: Which One to Choose in Economic Evaluations of Vaccines? Value Health 2017, 20, PA754. [Google Scholar] [CrossRef]
- Standaert, B.; Strens, D.; Pereira, P.; Benninghoff, B.; Raes, M. Lessons Learned from Long-Term Assessment of Rotavirus Vaccination in a High-Income Country: The Case of the Rotavirus Vaccine Belgium Impact Study (RotaBIS). Infect. Dis. Ther. 2020, 9, 967–980. [Google Scholar] [CrossRef]
- Standaert, B.; Strens, D.; Raes, M.; Benninghoff, B. Explaining the formation of a plateau in rotavirus vaccine impact on rotavirus hospitalisations in Belgium. Vaccine 2022, 40, 1948–1957. [Google Scholar] [CrossRef] [PubMed]
- Carrico, J.; Mellott, C.E.; Talbird, S.E.; Bento-Abreu, A.; Merckx, B.; Vandenhaute, J.; Benchabane, D.; Dauby, N.; Ethgen, O.; Lepage, P.; et al. Public health impact and return on investment of Belgium’s pediatric immunization program. Front. Public Health 2023, 11, 1032385. [Google Scholar] [CrossRef] [PubMed]
- Standaert, B.; Harlin, O.; Desselberger, U. The financial burden of rotavirus disease in four countries of the European Union. Pediatr. Infect. Dis. J. 2008, 27, S20–S27. [Google Scholar] [CrossRef]
- Velazquez, F.R.; Matson, D.O.; Calva, J.J.; Guerrero, L.; Morrow, A.L.; Carter-Campbell, S.; Glass, R.I.; Estes, M.K.; Pickering, L.K.; Ruiz-Palacios, G.M. Rotavirus infection in infants as protection against subsequent infections. N. Engl. J. Med. 1996, 335, 1022–1028. [Google Scholar] [CrossRef]
- Crawford, S.E.; Ramani, S.; Tate, J.E.; Parashar, U.D.; Svensson, L.; Hagbom, M.; Franco, M.A.; Greenberg, H.B.; O’Ryan, M.; Kang, G.; et al. Rotavirus infection. Nat. Rev. Dis. Primers 2017, 3, 17083. [Google Scholar] [CrossRef]
- van Gaalen, R.D.; van de Kassteele, J.; Hahne, S.J.M.; Bruijning-Verhagen, P.; Wallinga, J. Determinants of Rotavirus Transmission: A Lag Nonlinear Time Series Analysis. Epidemiology 2017, 28, 503–513. [Google Scholar] [CrossRef]
- Poelaert, D.; Pereira, P.; Gardner, R.; Standaert, B.; Benninghoff, B. A review of recommendations for rotavirus vaccination in Europe: Arguments for change. Vaccine 2018, 36, 2243–2253. [Google Scholar] [CrossRef]
- Bencina, G.; Costantino, C.; Mameli, C.; Sabale, U. Real-world impact of rotavirus vaccination in European healthcare settings: A systematic literature review. Expert Rev. Vaccines 2022, 21, 1121–1136. [Google Scholar] [CrossRef]
- Pereira, P.; Vetter, V.; Standaert, B.; Benninghoff, B. Fifteen years of experience with the oral live-attenuated human rotavirus vaccine: Reflections on lessons learned. Expert Rev. Vaccines 2020, 19, 755–769. [Google Scholar] [CrossRef]
- Vesikari, T.; Matson, D.O.; Dennehy, P.; Van Damme, P.; Santosham, M.; Rodriguez, Z.; Dallas, M.J.; Heyse, J.F.; Goveia, M.G.; Black, S.B.; et al. Safety and efficacy of a pentavalent human-bovine (WC3) reassortant rotavirus vaccine. N. Engl. J. Med. 2006, 354, 23–33. [Google Scholar] [CrossRef]
- Vesikari, T.; Karvonen, A.; Prymula, R.; Schuster, V.; Tejedor, J.C.; Cohen, R.; Meurice, F.; Han, H.H.; Damaso, S.; Bouckenooghe, A. Efficacy of human rotavirus vaccine against rotavirus gastroenteritis during the first 2 years of life in European infants: Randomised, double-blind controlled study. Lancet 2007, 370, 1757–1763. [Google Scholar] [CrossRef] [PubMed]
- Koch, J.; Harder, T.; von Kries, R.; Wichmann, O. Risk of Intussusception After Rotavirus Vaccination. Dtsch. Arztebl. Int. 2017, 114, 255–262. [Google Scholar] [CrossRef] [PubMed]
- Ledent, E.; Arlegui, H.; Buyse, H.; Basile, P.; Karkada, N.; Praet, N.; Nachbaur, G. Benefit Versus Risk Assessment of Rotavirus Vaccination in France: A Simulation and Modeling Analysis. BioDrugs 2018, 32, 139–152. [Google Scholar] [CrossRef] [PubMed]
- Jit, M.; Bilcke, J.; Mangen, M.J.; Salo, H.; Melliez, H.; Edmunds, W.J.; Yazdan, Y.; Beutels, P. The cost-effectiveness of rotavirus vaccination: Comparative analyses for five European countries and transferability in Europe. Vaccine 2009, 27, 6121–6128. [Google Scholar] [CrossRef] [PubMed]
- Standaert, B.; Strens, D.; Alwan, A.; Raes, M. Medium- to Long-Term Impact of Rotavirus Vaccination on Hospital Care in Belgium: A 7-Year Follow-Up of the Rotavirus Belgium Impact Study (RotaBIS). Infect. Dis. Ther. 2016, 5, 31–44. [Google Scholar] [CrossRef]
- Standaert, B.; Strens, D.; Li, X.; Schecroun, N.; Raes, M. The Sustained Rotavirus Vaccination Impact on Nosocomial Infection, Duration of Hospital Stay, and Age: The RotaBIS Study (2005–2012). Infect. Dis. Ther. 2016, 5, 509–524. [Google Scholar] [CrossRef]
- Raes, M.; Strens, D.; Vergison, A.; Verghote, M.; Standaert, B. Reduction in pediatric rotavirus-related hospitalizations after universal rotavirus vaccination in Belgium. Pediatr. Infect. Dis. J. 2011, 30, e120–e125. [Google Scholar] [CrossRef]
- Vynnycky, E.; White, R. An Introduction to Infectious Disease Modelling; Oxford University Press: Oxford, UK, 2010. [Google Scholar]
- Chua, H.; Feng, S.; Lewnard, J.A.; Sullivan, S.G.; Blyth, C.C.; Lipsitch, M.; Cowling, B.J. The Use of Test-negative Controls to Monitor Vaccine Effectiveness: A Systematic Review of Methodology. Epidemiology 2020, 31, 43–64. [Google Scholar] [CrossRef]
- Bilcke, J.; Beutels, P.; De Smet, F.; Hanquet, G.; Van Ranst, M.; Van Damme, P. Kosten-Effectiviteitsanalyse van Rotavirus Vaccinatie van Zuigelingen in België; Federaal Kenniscentrum voor de Gezondheidszorg (KCE): Brussels, Belgium, 2007.
- Martin, A.; Cottrell, S.; Standaert, B. Estimating utility scores in young children with acute rotavirus gastroenteritis in the UK. J. Med. Econ. 2008, 11, 471–484. [Google Scholar] [CrossRef]
- Atkins, K.E.; Shim, E.; Pitzer, V.E.; Galvani, A.P. Impact of rotavirus vaccination on epidemiological dynamics in England and Wales. Vaccine 2012, 30, 552–564. [Google Scholar] [CrossRef]
- Atchison, C.; Lopman, B.; Edmunds, W.J. Modelling the seasonality of rotavirus disease and the impact of vaccination in England and Wales. Vaccine 2010, 28, 3118–3126. [Google Scholar] [CrossRef] [PubMed]
- Gower, C.M.; Stowe, J.; Andrews, N.J.; Dunning, J.; Ramsay, M.E.; Ladhani, S.N. Sustained Declines in Age Group-Specific Rotavirus Infection and Acute Gastroenteritis in Vaccinated and Unvaccinated Individuals During the 5 Years Since Rotavirus Vaccine Introduction in England. Clin. Infect. Dis. 2022, 74, 437–445. [Google Scholar] [CrossRef] [PubMed]
- Leino, T.; Baum, U.; Scott, P.; Ollgren, J.; Salo, H. Impact of five years of rotavirus vaccination in Finland—And the associated cost savings in secondary healthcare. Vaccine 2017, 35, 5611–5617. [Google Scholar] [CrossRef] [PubMed]
- Ruiz-Contreras, J.; Alfayate-Miguelez, S.; Carazo-Gallego, B.; Onis, E.; Diaz-Munilla, L.; Mendizabal, M.; Mendez Hernandez, M.; Ferrer-Lorente, B.; Unsain-Mancisidor, M.; Ramos-Amador, J.T.; et al. Rotavirus gastroenteritis hospitalizations in provinces with different vaccination coverage rates in Spain, 2013–2018. BMC Infect. Dis. 2021, 21, 1138. [Google Scholar] [CrossRef] [PubMed]
- Health Protection Surveillance Centre. Annual Reports on Rotavirus. Available online: https://www.hse.ie/eng/health/immunisation/hcpinfo/othervaccines/rotavirus/#How%20many%20cases%20of%20rotavirus%20occur%20in%20Ireland? (accessed on 20 May 2021).
- Hanquet, G.; Ducoffre, G.; Vergison, A.; Neels, P.; Sabbe, M.; Van Damme, P.; Van Herck, K. Impact of rotavirus vaccination on laboratory confirmed cases in Belgium. Vaccine 2011, 29, 4698–4703. [Google Scholar] [CrossRef]
- Standaert, B. How to design an optimal vaccine launch. Res. Features 2023, 148, 24–27. [Google Scholar] [CrossRef]
Disclaimer/Publisher’s Note: The statements, opinions and data contained in all publications are solely those of the individual author(s) and contributor(s) and not of MDPI and/or the editor(s). MDPI and/or the editor(s) disclaim responsibility for any injury to people or property resulting from any ideas, methods, instructions or products referred to in the content. |
© 2024 by the authors. Licensee MDPI, Basel, Switzerland. This article is an open access article distributed under the terms and conditions of the Creative Commons Attribution (CC BY) license (https://creativecommons.org/licenses/by/4.0/).