
COVID-19 Vaccination Personas in Yemen: Insights from Three Rounds of a Cross-Sectional Survey

 ,
,
Abstract
1. Introduction
Studies
2. Methodology
2.1. Survey Instrument
2.2. Statistical Analysis
3. Results
3.1. Overall Description of the Sample
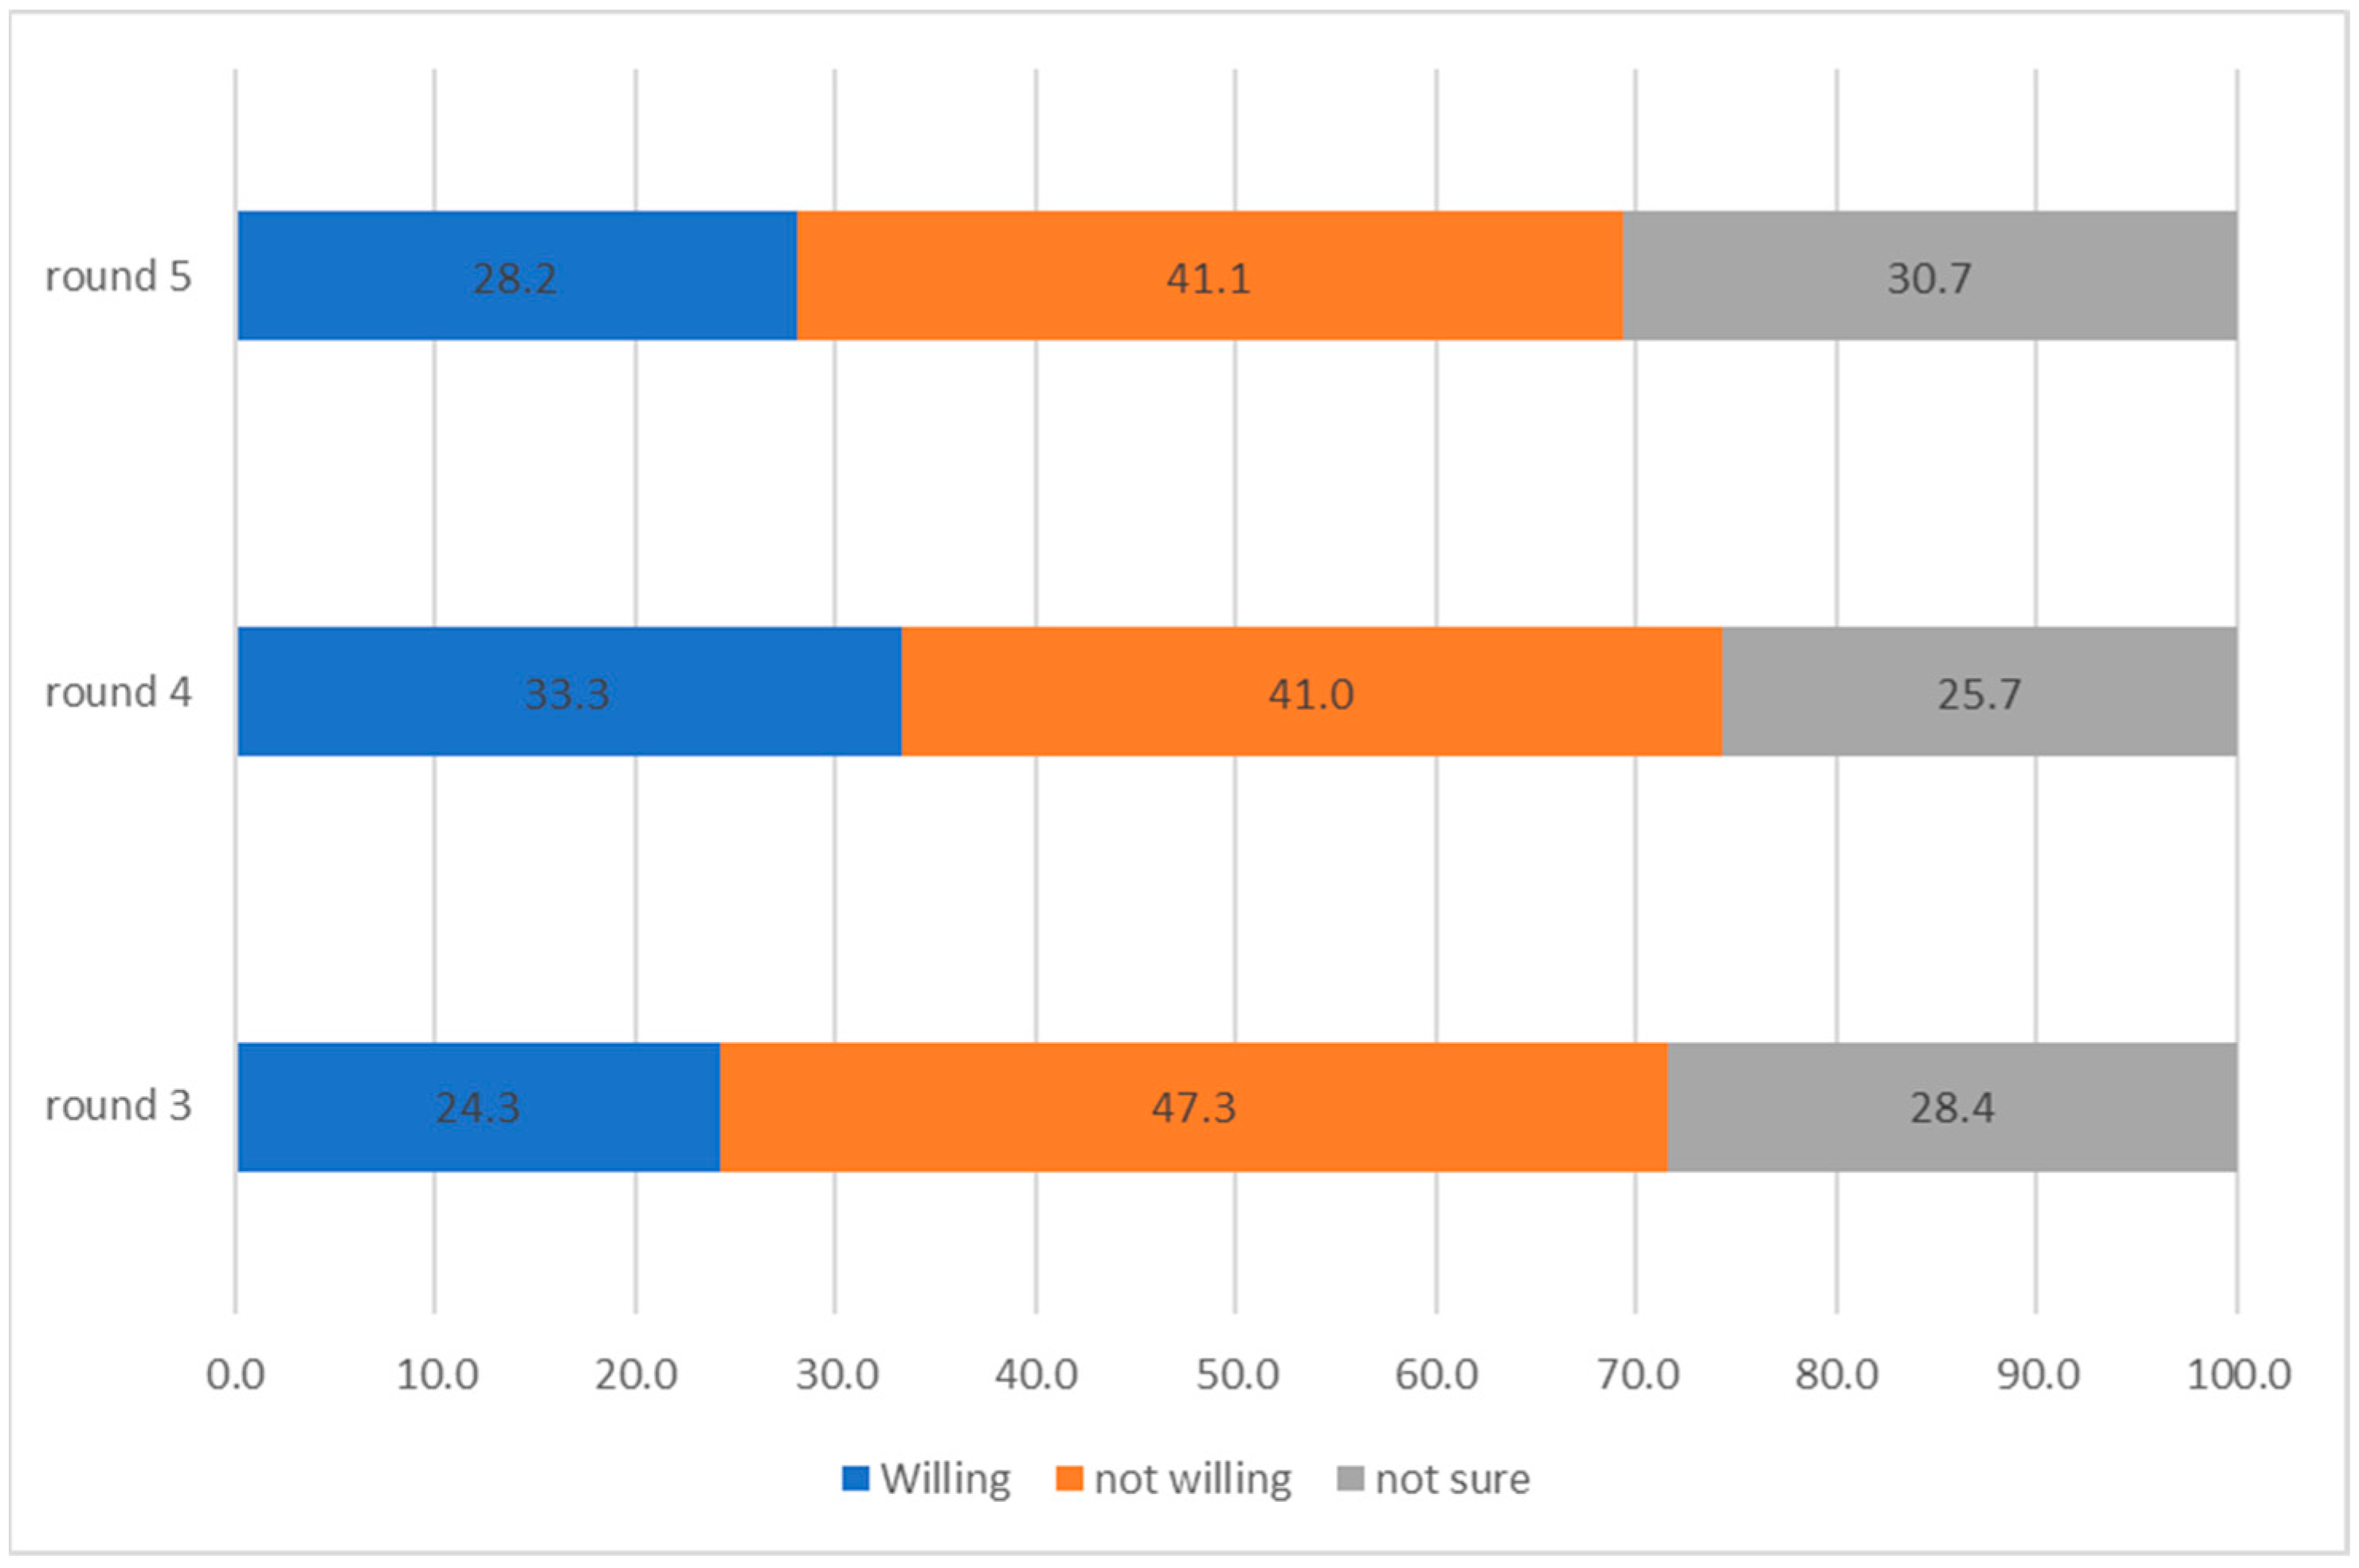
3.2. Vaccination Personas
3.2.1. Persona 1: Willing to Be Vaccinated
3.2.2. Persona 2: Not Vaccinated and Undecided
3.2.3. Persona 3: Not Willing to Get Vaccinated
4. Discussion
Author Contributions
Funding
Institutional Review Board Statement
Informed Consent Statement
Data Availability Statement
Conflicts of Interest
Appendix A

| Round 3 | Round 4 | ||||||||||||||
|---|---|---|---|---|---|---|---|---|---|---|---|---|---|---|---|
| Willing | Not Willing | Not Sure | Willing | Not Willing | Not Sure | ||||||||||
| % | Number | % | Number | % | Number | chi2 p-Value | % | Number | % | Number | % | Number | chi2 p-Value | ||
| Age | Age | ||||||||||||||
| less than 20 | 25.8 | 23 | 44.9 | 40 | 29.2 | 26 | 0.3 | less than 20 | 29.8 | 31 | 47.1 | 49 | 23.1 | 24 | 0.1 |
| 21 to 30 | 24.5 | 99 | 45.8 | 185 | 29.7 | 120 | 21 to 30 | 34.5 | 153 | 37.5 | 166 | 28.0 | 124 | ||
| 31 to 40 | 25.8 | 112 | 47.9 | 208 | 26.3 | 114 | 31 to 40 | 31.8 | 137 | 41.8 | 180 | 26.5 | 114 | ||
| 41 to 50 | 24.3 | 71 | 44.5 | 130 | 31.2 | 91 | 41 to 50 | 37.7 | 95 | 36.5 | 92 | 25.8 | 65 | ||
| 51 to 60 | 15.0 | 17 | 57.5 | 65 | 27.4 | 31 | 51 to 60 | 30.7 | 43 | 50.7 | 71 | 18.6 | 26 | ||
| 61 to 70 | 26.3 | 5 | 52.6 | 10 | 21.1 | 4 | 61 to 70 | 21.4 | 6 | 53.6 | 15 | 25.0 | 7 | ||
| 71 and above | 60.0 | 3 | 40.0 | 2 | 0.0 | 0 | 71 and above | 0.0 | 0 | 0.0 | 0 | 0.0 | 0 | ||
| Education | Education | ||||||||||||||
| can’t read and write | 15.5 | 19 | 49.6 | 61 | 35.0 | 43 | <0.001 | can’t read and write | 18.7 | 26 | 51.1 | 71 | 30.2 | 42 | <0.001 |
| can read and write | 18.5 | 45 | 50.6 | 123 | 30.9 | 75 | can read and write | 28.8 | 63 | 46.1 | 101 | 25.1 | 55 | ||
| basic | 26.4 | 42 | 48.4 | 77 | 25.2 | 40 | basic | 34.7 | 60 | 46.8 | 81 | 18.5 | 32 | ||
| secondary | 23.0 | 92 | 51.3 | 205 | 25.8 | 103 | secondary | 34.5 | 134 | 41.8 | 162 | 23.7 | 92 | ||
| college degree | 28.3 | 115 | 42.3 | 172 | 29.5 | 120 | college degree | 36.5 | 163 | 33.3 | 149 | 30.2 | 135 | ||
| masters or phd | 65.4 | 17 | 15.4 | 4 | 19.2 | 5 | masters or phd | 60.6 | 20 | 27.3 | 9 | 12.1 | 4 | ||
| Gender | Gender | ||||||||||||||
| female | 22.3 | 139 | 46.0 | 287 | 31.7 | 198 | <0.001 | female | 31.8 | 191 | 39.0 | 234 | 29.2 | 175 | <0.001 |
| male | 26.0 | 191 | 48.4 | 355 | 25.6 | 188 | male | 34.4 | 275 | 42.4 | 339 | 23.2 | 185 | ||
| Occupation | Occupation | ||||||||||||||
| agricultural | 15.7 | 19 | 55.4 | 67 | 28.9 | 35 | <0.001 | agricultural | 25.2 | 37 | 49.7 | 73 | 25.2 | 37 | <0.001 |
| educational | 27.9 | 56 | 40.8 | 82 | 31.3 | 63 | educational | 42.3 | 102 | 31.1 | 75 | 26.6 | 64 | ||
| housewife | 20.1 | 65 | 48.5 | 157 | 31.5 | 102 | housewife | 30.5 | 85 | 43.7 | 122 | 25.8 | 72 | ||
| office | 33.1 | 57 | 47.7 | 82 | 19.2 | 33 | office | 40.1 | 67 | 32.9 | 55 | 27.0 | 45 | ||
| student | 26.9 | 52 | 43.5 | 84 | 29.5 | 57 | student | 28.5 | 51 | 42.5 | 76 | 29.1 | 52 | ||
| unemployed | 14.0 | 13 | 53.8 | 50 | 32.3 | 30 | unemployed | 26.6 | 21 | 48.1 | 38 | 25.3 | 20 | ||
| handicraft | 20.8 | 27 | 56.2 | 73 | 23.1 | 30 | handicraft | 32.8 | 65 | 47.5 | 94 | 19.7 | 39 | ||
| other | 33.1 | 41 | 37.9 | 47 | 29.0 | 36 | other | 34.9 | 38 | 36.7 | 40 | 28.4 | 31 | ||
| Likley to become sick with COVID-19 | Likley to become sick with COVID-19 | ||||||||||||||
| I don’t know | 22.6 | 125 | 38.5 | 213 | 38.9 | 215 | <0.001 | I don’t know | 21.7 | 110 | 43.3 | 219 | 35.0 | 177 | <0.001 |
| Yes | 29.3 | 164 | 49.1 | 275 | 21.6 | 121 | Yes | 44.7 | 306 | 36.5 | 250 | 18.8 | 129 | ||
| No | 16.7 | 41 | 62.9 | 154 | 20.4 | 50 | No | 24.0 | 50 | 50.0 | 104 | 26.0 | 54 | ||
| Public Health and Social Measures over the last 10 months | Willing | Not willing | Not sure | Public Health and Social Measures over the last 10 months | Willing | Not willing | Not sure | ||||||||
| Practiced social distancing | % | number | % | number | % | number | chi2 p-value | Practiced social distancing | % | number | % | number | % | number | chi2 p-value |
| No | 20.7 | 189 | 50.9 | 464 | 28.4 | 259 | <0.001 | No | 32.8 | 289 | 44.0 | 388 | 23.2 | 205 | <0.001 |
| Yes | 31.6 | 141 | 39.9 | 178 | 28.5 | 127 | Yes | 34.2 | 177 | 35.8 | 185 | 30.0 | 155 | ||
| Worn a mask | Worn a mask | ||||||||||||||
| No | 14.5 | 74 | 57.0 | 292 | 28.5 | 146 | <0.001 | No | 23.4 | 94 | 48.3 | 194 | 28.4 | 114 | <0.001 |
| Yes | 30.3 | 256 | 41.4 | 350 | 28.4 | 240 | Yes | 37.3 | 372 | 38.0 | 379 | 24.7 | 246 | ||
| Stayed away from the mosque | Stayed away from the mosque | ||||||||||||||
| No | 23.6 | 281 | 48.7 | 580 | 27.8 | 331 | <0.001 | No | 32.7 | 372 | 42.1 | 479 | 25.2 | 286 | 0.2 |
| Yes | 29.5 | 49 | 37.4 | 62 | 33.1 | 55 | Yes | 35.9 | 94 | 35.9 | 94 | 28.2 | 74 | ||
| Wash hands | |||||||||||||||
| No | 20.4 | 62 | 56.3 | 171 | 23.4 | 71 | <0.001 | ||||||||
| Yes | 36.9 | 404 | 36.7 | 402 | 26.4 | 289 | |||||||||
| Avoided social gatherings | Avoided social gatherings | ||||||||||||||
| No | 19.9 | 140 | 54.7 | 384 | 25.4 | 178 | <0.001 | No | 32.9 | 276 | 43.8 | 367 | 23.3 | 195 | <0.001 |
| Yes | 29.0 | 190 | 39.3 | 258 | 31.7 | 208 | Yes | 33.9 | 190 | 36.7 | 206 | 29.4 | 165 | ||
| Public Health and Social Measures over the last 4 weeks | Willing | Not willing | Not sure | Public Health and Social Measures over the last 4 weeks | Willing | Not willing | Not sure | ||||||||
| Practiced social distancing | % | number | % | number | % | number | chi2 p-value | Practiced social distancing | % | number | % | number | % | number | chi2 p-value |
| No | 21.2 | 234 | 49.3 | 543 | 29.5 | 325 | <0.001 | No | 32.4 | 405 | 41.8 | 523 | 25.9 | 324 | 0.1 |
| Yes | 37.5 | 96 | 38.7 | 99 | 23.8 | 61 | Yes | 41.5 | 61 | 34.0 | 50 | 24.5 | 36 | ||
| Worn a mask | Worn a mask | ||||||||||||||
| No | 20.2 | 185 | 52.0 | 475 | 27.8 | 254 | <0.001 | No | 26.1 | 227 | 44.7 | 388 | 29.2 | 254 | <0.001 |
| Yes | 32.7 | 145 | 37.6 | 167 | 29.7 | 132 | Yes | 45.1 | 239 | 34.9 | 185 | 20.0 | 106 | ||
| Stayed away from the mosque | Stayed away from the mosque | ||||||||||||||
| No | 23.9 | 312 | 47.6 | 621 | 28.5 | 371 | <0.001 | No | 33.1 | 454 | 41.0 | 562 | 25.9 | 355 | 0.5 |
| Yes | 33.3 | 18 | 38.9 | 21 | 27.8 | 15 | Yes | 42.9 | 12 | 39.3 | 11 | 17.9 | 5 | ||
| Washed hands | |||||||||||||||
| No | 21.1 | 148 | 50.0 | 350 | 28.9 | 202 | <0.001 | ||||||||
| Yes | 45.5 | 318 | 31.9 | 223 | 22.6 | 158 | |||||||||
| Avoided social gatherings | Avoided social gatherings | ||||||||||||||
| No | 22.2 | 232 | 50.2 | 525 | 27.6 | 289 | <0.001 | No | 32.2 | 404 | 42.8 | 537 | 25.1 | 315 | <0.001 |
| Yes | 31.4 | 98 | 37.5 | 117 | 31.1 | 97 | Yes | 43.4 | 62 | 25.2 | 36 | 31.5 | 45 | ||
| Round 3 | Round 4 | ||||||||||||||
|---|---|---|---|---|---|---|---|---|---|---|---|---|---|---|---|
| Willing | Not Willing | Not Sure | Willing | Not Willing | Not Sure | ||||||||||
| Knowledge to protect yourself from the virus | % | number | % | number | % | number | chi2 p-value | Knowledge to protect yourself from the virus | % | number | % | number | % | number | chi2 p-value |
| No knowledge | 6.0 | 4 | 67.2 | 45 | 26.9 | 18 | <0.001 | No knowledge | 3.7 | 1 | 59.3 | 16 | 37.0 | 10 | <0.001 |
| needs improvement | 18.1 | 89 | 53.3 | 262 | 28.7 | 141 | needs improvement | 25.7 | 83 | 48.3 | 156 | 26.0 | 84 | ||
| good | 25.9 | 133 | 45.3 | 233 | 28.8 | 148 | good | 36.3 | 224 | 41.8 | 258 | 22.0 | 136 | ||
| very good | 32.5 | 53 | 42.3 | 69 | 25.2 | 41 | very good | 33.6 | 86 | 35.2 | 90 | 31.3 | 80 | ||
| excellent | 41.8 | 51 | 27.1 | 33 | 31.2 | 38 | excellent | 41.1 | 72 | 30.3 | 53 | 28.6 | 50 | ||
| Trust in the official information from the authorities | Trust in the official information from the authorities | ||||||||||||||
| No confidence | 9.0 | 30 | 67.5 | 226 | 23.6 | 79 | <0.001 | No confidence | 23.3 | 49 | 47.1 | 99 | 29.5 | 62 | <0.001 |
| little confidence | 26.0 | 127 | 42.3 | 207 | 31.7 | 155 | little confidence | 35.6 | 159 | 44.1 | 197 | 20.4 | 91 | ||
| confident | 33.1 | 114 | 42.4 | 146 | 24.4 | 84 | confident | 35.2 | 162 | 38.0 | 175 | 26.7 | 123 | ||
| total confidence | 47.1 | 41 | 24.1 | 21 | 28.7 | 25 | total confidence | 39.9 | 63 | 29.8 | 47 | 30.4 | 48 | ||
| Trust in the ability of the health authorties to deal with the virus | Trust in the ability of the health authorties to deal with the virus | ||||||||||||||
| No confidence | 16.0 | 57.2 | 26.7 | 0.0 | No confidence | 28.9 | 41.2 | 29.9 | 0.0 | ||||||
| little confidence | 28.6 | 41.2 | 30.2 | little confidence | 38.9 | 41.4 | 19.8 | ||||||||
| confident | 34.6 | 42.7 | 22.8 | confident | 41.5 | 44.0 | 24.6 | ||||||||
| total confidence | 56.8 | 16.2 | 27.0 | total confidence | 39.5 | 35.5 | 25.0 | ||||||||
| Trust in your own ability to deal with the virus | Trust in your own ability to deal with the virus | ||||||||||||||
| No confidence | 17.6 | 49 | 51.8 | 144 | 30.6 | 85 | <0.001 | No confidence | 26.8 | 125 | 45.9 | 178 | 27.3 | 129 | <0.001 |
| little confidence | 22.6 | 110 | 46.6 | 227 | 30.8 | 150 | little confidence | 32.4 | 185 | 38.9 | 197 | 28.7 | 94 | ||
| confident | 31.0 | 119 | 48.2 | 185 | 20.8 | 80 | confident | 35.1 | 78 | 43.4 | 109 | 21.5 | 61 | ||
| total confidence | 30.6 | 34 | 33.3 | 37 | 36.0 | 40 | total confidence | 42.1 | 30 | 32.8 | 27 | 25.1 | 19 | ||
| How dangerous do you think the COVID-19 virus is | How dangerous do you think the COVID-19 virus is | ||||||||||||||
| it is not dangerous | 7.9 | 14 | 74.7 | 133 | 17.4 | 31 | <0.001 | it is not dangerous | 9.2 | 12 | 62.6 | 82 | 28.2 | 37 | <0.001 |
| more or less dangerous | 17.6 | 62 | 50.1 | 177 | 32.3 | 114 | more or less dangerous | 37.2 | 197 | 44.6 | 236 | 18.2 | 96 | ||
| very dangerous | 32.4 | 253 | 38.7 | 302 | 28.9 | 226 | very dangerous | 35.7 | 255 | 33.9 | 242 | 30.5 | 218 | ||
| Willing | Not Willing | Not Sure | Willing | Not Willing | Not Sure | ||||||||||
|---|---|---|---|---|---|---|---|---|---|---|---|---|---|---|---|
| Vaccine is effective | % | number | % | number | % | number | chi2 p-value | Vaccine is effective | % | number | % | number | % | number | chi2 p-value |
| No | 17.6 | 127 | 53.6 | 386 | 28.8 | 207 | <0.001 | No | 13.6 | 85 | 52.3 | 327 | 34.1 | 213 | <0.001 |
| Yes | 61.5 | 153 | 18.1 | 45 | 20.5 | 51 | Yes | 58.1 | 370 | 26.5 | 169 | 15.4 | 98 | ||
| Vaccine has side effects | Vaccine has side effects | ||||||||||||||
| No | 39.4 | 227 | 29.7 | 171 | 30.9 | 178 | <0.001 | No | 52.8 | 318 | 27.4 | 165 | 19.8 | 119 | <0.001 |
| Yes | 13.5 | 53 | 66.2 | 260 | 20.4 | 80 | Yes | 20.8 | 137 | 50.2 | 331 | 29.1 | 192 | ||
| Round 3 | Round 4 | ||||||||||||||
|---|---|---|---|---|---|---|---|---|---|---|---|---|---|---|---|
| Most Trusted Source | Willing | Not Willing | Not Sure | Most Trusted Source | Willing | Not Willing | Not Sure | ||||||||
| % | Number | % | Number | % | Number | chi2 p-value | % | Number | % | Number | % | Number | chi2 p-value | ||
| TV | TV | ||||||||||||||
| first mention | 26.4 | 139 | 45.4 | 239 | 28.1 | 148 | <0.001 | first mention | 37.1 | 275 | 41.5 | 308 | 21.4 | 159 | <0.001 |
| second mention | 30.0 | 76 | 44.7 | 113 | 25.3 | 64 | second mention | 23.3 | 31 | 47.4 | 63 | 29.3 | 39 | ||
| third mention | 22.6 | 14 | 32.3 | 20 | 45.2 | 28 | third mention | 34.3 | 12 | 25.7 | 9 | 40.0 | 14 | ||
| Radio | Radio | ||||||||||||||
| first mention | 25.8 | 67 | 43.9 | 114 | 30.4 | 79 | 0.2 | first mention | 33.3 | 47 | 37.6 | 53 | 29.1 | 41 | 0.8 |
| second mention | 37.0 | 27 | 34.3 | 25 | 28.8 | 21 | second mention | 32.5 | 13 | 32.5 | 13 | 35.0 | 14 | ||
| third mention | 31.8 | 14 | 31.8 | 14 | 36.4 | 16 | third mention | 28.0 | 7 | 48.0 | 12 | 24.0 | 6 | ||
| first mention | 24.5 | 26 | 46.2 | 49 | 29.3 | 31 | 0.8 | first mention | 36.7 | 62 | 33.1 | 56 | 30.2 | 51 | 0.1 |
| second mention | 29.6 | 29 | 48.0 | 47 | 22.5 | 22 | second mention | 25.2 | 34 | 49.6 | 67 | 25.2 | 34 | ||
| third mention | 28.0 | 30 | 47.7 | 51 | 24.3 | 26 | third mention | 27.3 | 12 | 43.2 | 19 | 29.6 | 13 | ||
| Social media | Social media | ||||||||||||||
| first mention | 28.9 | 26 | 41.1 | 37 | 30.0 | 27 | 0.6 | first mention | 32.3 | 41 | 39.4 | 50 | 28.4 | 36 | 0.9 |
| second mention | 29.0 | 27 | 50.5 | 47 | 20.4 | 19 | second mention | 32.4 | 33 | 34.3 | 35 | 33.3 | 34 | ||
| third mention | 29.0 | 27 | 44.1 | 41 | 26.9 | 25 | third mention | 29.8 | 28 | 40.4 | 38 | 29.8 | 28 | ||
| Communication materials | |||||||||||||||
| first mention | 36.4 | 28 | 35.1 | 27 | 28.6 | 22 | 0.9 | ||||||||
| second mention | 31.5 | 28 | 37.1 | 33 | 31.5 | 28 | |||||||||
| third mention | 29.1 | 16 | 36.4 | 20 | 34.6 | 19 | |||||||||
| Health unit | Health unit | ||||||||||||||
| first mention | 24.8 | 31 | 37.6 | 47 | 37.6 | 47 | <0.001 | first mention | 22.5 | 22 | 52.0 | 51 | 25.5 | 25 | 0.1 |
| second mention | 23.0 | 14 | 59.0 | 36 | 18.0 | 11 | second mention | 37.7 | 26 | 33.3 | 23 | 29.0 | 20 | ||
| third mention | 34.0 | 16 | 27.7 | 13 | 38.3 | 18 | third mention | 30.8 | 12 | 38.5 | 15 | 30.8 | 12 | ||
| Family | Family | ||||||||||||||
| first mention | 22.2 | 20 | 40.0 | 36 | 37.8 | 34 | 0.7 | first mention | 19.6 | 27 | 46.4 | 64 | 34.1 | 47 | 0.1 |
| second mention | 18.7 | 14 | 46.7 | 35 | 34.7 | 26 | second mention | 23.5 | 20 | 48.2 | 41 | 28.2 | 24 | ||
| third mention | 26.9 | 18 | 41.8 | 28 | 31.3 | 21 | third mention | 8.1 | 3 | 67.6 | 25 | 24.3 | 9 | ||
| Friends | Friends | ||||||||||||||
| first mention | 26.8 | 15 | 44.6 | 25 | 28.6 | 16 | 0.4 | first mention | 25.3 | 21 | 43.4 | 36 | 31.3 | 26 | 1.0 |
| second mention | 27.4 | 17 | 43.6 | 27 | 29.0 | 18 | second mention | 26.8 | 22 | 46.3 | 38 | 26.8 | 22 | ||
| third mention | 16.0 | 12 | 45.3 | 34 | 38.7 | 29 | third mention | 19.4 | 6 | 51.6 | 16 | 29.0 | 9 | ||
| Community health workers | Community health workers | ||||||||||||||
| first mention | 29.6 | 37 | 48.0 | 60 | 22.4 | 28 | <0.001 | first mention | 32.0 | 47 | 41.5 | 61 | 26.5 | 39 | 0.5 |
| second mention | 23.2 | 19 | 40.2 | 33 | 36.6 | 30 | second mention | 36.8 | 32 | 35.6 | 31 | 27.6 | 24 | ||
| third mention | 46.5 | 20 | 27.9 | 12 | 25.6 | 11 | third mention | 45.8 | 22 | 31.3 | 15 | 22.9 | 11 | ||
| Volunteers | Volunteers | ||||||||||||||
| first mention | 34.7 | 42 | 41.3 | 50 | 24.0 | 29 | 0.2 | first mention | 34.2 | 27 | 34.2 | 27 | 31.7 | 25 | 0.3 |
| second mention | 22.6 | 14 | 54.8 | 34 | 22.6 | 14 | second mention | 33.3 | 19 | 36.8 | 21 | 29.8 | 17 | ||
| third mention | 39.2 | 20 | 33.3 | 17 | 27.5 | 14 | third mention | 50.0 | 20 | 20.0 | 8 | 30.0 | 12 | ||
| Community leaders | Community leaders | ||||||||||||||
| first mention | 27.6 | 8 | 34.5 | 10 | 37.9 | 11 | 0.3 | first mention | 25.0 | 7 | 50.0 | 14 | 25.0 | 7 | 0.2 |
| second mention | 10.0 | 3 | 43.3 | 13 | 46.7 | 14 | second mention | 47.8 | 11 | 34.8 | 8 | 17.4 | 4 | ||
| third mention | 18.0 | 9 | 50.0 | 25 | 32.0 | 16 | third mention | 18.8 | 3 | 37.5 | 6 | 43.8 | 7 | ||
| Religious leaders | Religious leaders | ||||||||||||||
| first mention | 20.6 | 20 | 43.3 | 42 | 36.1 | 35 | 0.1 | first mention | 24.7 | 40 | 47.5 | 77 | 27.8 | 45 | 0.6 |
| second mention | 20.0 | 14 | 57.1 | 40 | 22.9 | 16 | second mention | 29.7 | 11 | 43.2 | 16 | 27.0 | 10 | ||
| third mention | 28.1 | 23 | 50.0 | 41 | 22.0 | 18 | third mention | 28.4 | 23 | 37.0 | 30 | 34.6 | 28 | ||
| Traditional healers | Traditional healers | ||||||||||||||
| first mention | 7.1 | 1 | 28.6 | 4 | 64.3 | 9 | <0.001 | first mention | 22.2 | 2 | 44.4 | 4 | 33.3 | 3 | 0.2 |
| second mention | 0.0 | 0 | 87.5 | 7 | 12.5 | 1 | second mention | 12.5 | 2 | 75.0 | 12 | 12.5 | 2 | ||
| third mention | 20.8 | 5 | 41.7 | 10 | 37.5 | 9 | third mention | 38.9 | 7 | 33.3 | 6 | 27.8 | 5 | ||
| A person from the community | A person from the community | ||||||||||||||
| first mention | 0.0 | 0 | 50.0 | 3 | 50.0 | 3 | <0.001 | first mention | 25.0 | 4 | 56.3 | 9 | 18.8 | 3 | 0.7 |
| second mention | 0.0 | 0 | 100.0 | 6 | 0.0 | 0 | second mention | 18.2 | 2 | 72.7 | 8 | 9.1 | 1 | ||
| third mention | 31.3 | 10 | 25.0 | 8 | 43.8 | 14 | third mention | 20.7 | 6 | 51.7 | 15 | 27.6 | 8 | ||
| Logistic Regression | |||||||
|---|---|---|---|---|---|---|---|
| Willing to Get Vaccinated | Odds Ratios | St. Err. | t-Value | p-Value | [95% Conf | Interval] | Sig |
| Age (relative to under 20) | |||||||
| 21 to 30 | 1.176 | 0.387 | 0.49 | 0.622 | 0.617 | 2.241 | |
| 31 to 40 | 1.081 | 0.415 | 0.20 | 0.840 | 0.509 | 2.294 | |
| 41 to 50 | 0.871 | 0.352 | −0.34 | 0.733 | 0.395 | 1.923 | |
| 51 to 60 | 0.916 | 0.438 | −0.18 | 0.855 | 0.359 | 2.338 | |
| 61 to 70 | 1.011 | 0.674 | 0.02 | 0.986 | 0.274 | 3.732 | |
| 71 and above | 2.854 | 2.239 | 1.34 | 0.181 | 0.613 | 13.278 | |
| Education (relative to cannot read and write) | |||||||
| Can read and write | 0.646 | 0.319 | −0.89 | 0.376 | 0.245 | 1.702 | |
| Basic | 0.939 | 0.477 | −0.13 | 0.901 | 0.347 | 2.540 | |
| Secondary | 0.865 | 0.432 | −0.29 | 0.771 | 0.324 | 2.304 | |
| College degree | 1.256 | 0.655 | 0.44 | 0.661 | 0.452 | 3.490 | |
| Masters of PhD | 2.887 | 1.791 | 1.71 | 0.088 | 0.855 | 9.742 | * |
| Gender (relative to female) | |||||||
| Male | 2.672 | 0.762 | 3.45 | 0.001 | 1.529 | 4.671 | *** |
| Occupation (relative to agriculture) | |||||||
| Education | 1.114 | 0.537 | 0.23 | 0.822 | 0.433 | 2.866 | |
| Housewife | 1.838 | 0.918 | 1.22 | 0.223 | 0.690 | 4.894 | |
| Office | 0.607 | 0.288 | −1.05 | 0.293 | 0.239 | 1.539 | |
| Student | 1.458 | 0.695 | 0.79 | 0.429 | 0.573 | 3.711 | |
| Unemployed | 1.172 | 0.732 | 0.25 | 0.800 | 0.344 | 3.989 | |
| Handicraft | 0.893 | 0.371 | −0.27 | 0.786 | 0.396 | 2.017 | |
| Other | 0.847 | 0.441 | −0.32 | 0.749 | 0.306 | 2.348 | |
| Likely to become sick with COVID-19 (relative to do not know) | |||||||
| Yes | 1.099 | 0.219 | 0.47 | 0.637 | 0.743 | 1.624 | |
| No | 1.007 | 0.333 | 0.02 | 0.984 | 0.526 | 1.925 | |
| Practised social distancing in the last 10 months | 1.478 | 0.361 | 1.60 | 0.110 | 0.916 | 2.386 | |
| Wore face mask in the last ten months | 0.872 | 0.238 | −0.50 | 0.616 | 0.511 | 1.488 | |
| Stayed away from mosque in the last ten months | 1.422 | 0.403 | 1.24 | 0.214 | 0.816 | 2.479 | |
| Washed hands in the last ten months | 2.931 | 0.953 | 3.31 | 0.001 | 1.550 | 5.542 | *** |
| Avoided social events in the last ten months | 1.097 | 0.261 | 0.39 | 0.699 | 0.688 | 1.749 | |
| Practised social distancing in the last four weeks | 1.148 | 0.515 | 0.31 | 0.759 | 0.476 | 2.767 | |
| Wore face mask in the last four weeks | 0.829 | 0.271 | −0.57 | 0.567 | 0.437 | 1.573 | |
| Stayed away from mosque in the last four weeks | 0.912 | 0.476 | −0.17 | 0.861 | 0.328 | 2.538 | |
| Washed hands in the last four weeks | 0.540 | 0.143 | −2.33 | 0.020 | 0.321 | 0.906 | ** |
| Avoided social events in the last four weeks | 1.736 | 0.641 | 1.50 | 0.135 | 0.842 | 3.579 | |
| Trust in the official information (relative to no trust) | |||||||
| Little confidence | 0.764 | 0.327 | −0.63 | 0.530 | 0.330 | 1.768 | |
| Confident | 1.532 | 0.682 | 0.96 | 0.338 | 0.640 | 3.668 | |
| Total confidence | 2.118 | 1.050 | 1.51 | 0.130 | 0.802 | 5.595 | |
| Trust in your own ability to deal with the virus (relative to no trust) | 1.000 | ||||||
| Little confidence | 1.074 | 0.328 | 0.23 | 0.814 | 0.591 | 1.954 | |
| Confident | 1.362 | 0.444 | 0.95 | 0.344 | 0.719 | 2.580 | |
| Total confidence | 1.156 | 0.599 | 0.28 | 0.780 | 0.419 | 3.190 | |
| The virus is dangerous (relative to it is not) | 1.000 | ||||||
| More or less dangerous | 4.742 | 2.512 | 2.94 | 0.003 | 1.679 | 13.391 | *** |
| Very dangerous | 14.233 | 7.662 | 4.93 | 0.000 | 4.955 | 40.883 | *** |
| Other | 22.195 | 29.773 | 2.31 | 0.021 | 1.601 | 307.662 | ** |
| Vaccine is effective | 6.799 | 1.684 | 7.74 | 0.000 | 4.184 | 11.049 | *** |
| Vaccine has side effects | 0.162 | 0.031 | −9.52 | 0.000 | 0.111 | 0.235 | *** |
| Constant | 0.006 | 0.006 | −5.29 | 0.000 | 0.001 | 0.039 | *** |
| Mean dependent var | 0.320 | SD dependent var | 0.467 | ||||
| Pseudo r-squared | 0.333 | Number of obs | 1128.000 | ||||
| Chi-square | 209.738 | Prob > chi2 | 0.000 | ||||
| Akaike crit. (AIC) | 1029.857 | Bayesian crit. (BIC) | 1246.070 | ||||
| Logistic Regression | |||||||
|---|---|---|---|---|---|---|---|
| Not Vaccinated and Not Willing | Odds Ratios | St. Err. | t-Value | p-Value | [95% Conf | Interval] | Sig |
| Age (relative to under 20) | 1.000 | ||||||
| 21 to 30 | 1.017 | 0.340 | 0.05 | 0.960 | 0.528 | 1.958 | |
| 31 to 40 | 1.066 | 0.405 | 0.17 | 0.865 | 0.507 | 2.244 | |
| 41 to 50 | 1.058 | 0.418 | 0.14 | 0.887 | 0.488 | 2.294 | |
| 51 to 60 | 1.278 | 0.551 | 0.57 | 0.570 | 0.548 | 2.976 | |
| 61 to 70 | 0.891 | 0.584 | −0.18 | 0.860 | 0.246 | 3.223 | |
| 71 and above | 0.790 | 0.691 | −0.27 | 0.787 | 0.142 | 4.389 | |
| Education (relative to cannot read and write) | 1.000 | ||||||
| Can read and write | 0.948 | 0.353 | −0.14 | 0.887 | 0.457 | 1.968 | |
| Basic | 0.751 | 0.295 | −0.73 | 0.466 | 0.347 | 1.623 | |
| Secondary | 0.810 | 0.307 | −0.56 | 0.579 | 0.385 | 1.704 | |
| College degree | 0.700 | 0.287 | −0.87 | 0.384 | 0.314 | 1.563 | |
| Masters of PhD | 0.611 | 0.305 | −0.99 | 0.323 | 0.230 | 1.624 | |
| Gender (relative to female) | 1.000 | ||||||
| Male | 0.587 | 0.123 | −2.54 | 0.011 | 0.389 | 0.886 | ** |
| Occupation (relative to agriculture) | 1.000 | ||||||
| Education | 0.667 | 0.249 | −1.08 | 0.278 | 0.321 | 1.385 | |
| Housewife | 0.583 | 0.213 | −1.48 | 0.140 | 0.285 | 1.193 | |
| Office | 0.973 | 0.353 | −0.07 | 0.940 | 0.478 | 1.980 | |
| Student | 0.652 | 0.257 | −1.08 | 0.278 | 0.300 | 1.413 | |
| Unemployed | 0.594 | 0.258 | −1.20 | 0.230 | 0.254 | 1.390 | |
| Handicraft | 0.929 | 0.276 | −0.25 | 0.805 | 0.519 | 1.664 | |
| Other | 0.678 | 0.282 | −0.94 | 0.350 | 0.300 | 1.531 | |
| Likely to become sick with COVID-19 (relative to do not know) | 1.000 | ||||||
| Yes | 1.109 | 0.184 | 0.62 | 0.533 | 0.801 | 1.535 | |
| No | 1.562 | 0.392 | 1.78 | 0.076 | 0.955 | 2.556 | * |
| Practised social distancing in the last 10 months | 0.750 | 0.146 | −1.48 | 0.139 | 0.512 | 1.098 | |
| Wore face mask in the last ten months | 0.989 | 0.206 | −0.05 | 0.959 | 0.658 | 1.487 | |
| Stayed away from mosque in the last ten months | 1.027 | 0.243 | 0.11 | 0.909 | 0.647 | 1.632 | |
| Washed hands in the last ten months | 0.552 | 0.125 | −2.63 | 0.008 | 0.354 | 0.859 | *** |
| Avoided social events in the last ten months | 0.674 | 0.119 | −2.24 | 0.025 | 0.478 | 0.952 | ** |
| Practised social distancing in the last four weeks | 1.782 | 0.791 | 1.30 | 0.193 | 0.747 | 4.252 | |
| Wore face mask in the last four weeks | 0.764 | 0.195 | −1.05 | 0.292 | 0.463 | 1.261 | |
| Stayed away from mosque in the last four weeks | 1.963 | 1.043 | 1.27 | 0.204 | 0.693 | 5.559 | |
| Washed hands in the last four weeks | 1.224 | 0.248 | 1.00 | 0.319 | 0.823 | 1.820 | |
| Avoided social events in the last four weeks | 0.448 | 0.180 | −2.00 | 0.046 | 0.203 | 0.985 | ** |
| Trust in the official information (relative to no trust) | 1.000 | ||||||
| Little confidence | 0.795 | 0.223 | −0.82 | 0.414 | 0.459 | 1.378 | |
| Confident | 0.611 | 0.174 | −1.73 | 0.084 | 0.349 | 1.068 | * |
| Total confidence | 0.593 | 0.217 | −1.43 | 0.154 | 0.290 | 1.215 | |
| Trust in your own ability to deal with the virus (relative to no trust) | 1.000 | ||||||
| Little confidence | 1.035 | 0.217 | 0.17 | 0.869 | 0.686 | 1.562 | |
| Confident | 0.873 | 0.203 | −0.58 | 0.559 | 0.553 | 1.378 | |
| Total confidence | 0.873 | 0.361 | −0.33 | 0.742 | 0.388 | 1.964 | |
| The virus is dangerous (relative to it is not) | 1.000 | ||||||
| More or less dangerous | 0.457 | 0.104 | −3.44 | 0.001 | 0.293 | 0.715 | *** |
| Very dangerous | 0.244 | 0.057 | −6.00 | 0.000 | 0.154 | 0.387 | *** |
| Other | 0.191 | 0.198 | −1.60 | 0.110 | 0.025 | 1.453 | |
| Vaccine is effective | 0.484 | 0.084 | −4.19 | 0.000 | 0.345 | 0.680 | *** |
| Vaccine has side effects | 1.444 | 0.235 | 2.26 | 0.024 | 1.050 | 1.986 | ** |
| Constant | 10.067 | 6.770 | 3.43 | 0.001 | 2.694 | 37.610 | *** |
| Mean dependent var | 0.362 | SD dependent var | 0.481 | ||||
| Pseudo r-squared | 0.150 | Number of obs | 1128.000 | ||||
| Chi-square | 170.972 | Prob > chi2 | 0.000 | ||||
| Akaike crit. (AIC) | 1340.615 | Bayesian crit. (BIC) | 1556.828 | ||||
| Logistic Regression | |||||||
|---|---|---|---|---|---|---|---|
| Not Vaccinated and Not Decided | Odds Ratios | St. Err. | t-Value | p-Value | [95% Conf | Interval] | Sig |
| Age (relative to under 20) | 1.000 | ||||||
| 21 to 30 | 0.976 | 0.303 | −0.08 | 0.937 | 0.531 | 1.792 | |
| 31 to 40 | 1.113 | 0.391 | 0.30 | 0.761 | 0.559 | 2.216 | |
| 41 to 50 | 1.191 | 0.435 | 0.48 | 0.633 | 0.582 | 2.438 | |
| 51 to 60 | 1.070 | 0.448 | 0.16 | 0.872 | 0.471 | 2.430 | |
| 61 to 70 | 1.412 | 0.932 | 0.52 | 0.602 | 0.387 | 5.151 | |
| 71 and above | 0.830 | 0.686 | −0.23 | 0.821 | 0.164 | 4.197 | |
| Education (relative to cannot read and write) | 1.000 | ||||||
| Can read and write | 1.777 | 0.718 | 1.42 | 0.155 | 0.804 | 3.924 | |
| Basic | 1.830 | 0.774 | 1.43 | 0.153 | 0.799 | 4.192 | |
| Secondary | 1.767 | 0.735 | 1.37 | 0.171 | 0.782 | 3.992 | |
| College degree | 1.633 | 0.724 | 1.10 | 0.269 | 0.684 | 3.894 | |
| Masters of PhD | 0.904 | 0.509 | −0.18 | 0.857 | 0.300 | 2.726 | |
| Gender (relative to female) | 1.000 | ||||||
| Male | 0.952 | 0.188 | −0.25 | 0.804 | 0.646 | 1.402 | |
| Occupation (relative to agriculture) | 1.000 | ||||||
| Education | 1.442 | 0.543 | 0.97 | 0.331 | 0.689 | 3.018 | |
| Housewife | 1.320 | 0.490 | 0.75 | 0.454 | 0.638 | 2.731 | |
| Office | 1.503 | 0.548 | 1.12 | 0.263 | 0.736 | 3.071 | |
| Student | 1.271 | 0.507 | 0.60 | 0.548 | 0.582 | 2.778 | |
| Unemployed | 1.637 | 0.765 | 1.05 | 0.292 | 0.655 | 4.089 | |
| Handicraft | 1.177 | 0.374 | 0.51 | 0.609 | 0.631 | 2.194 | |
| Other | 1.683 | 0.750 | 1.17 | 0.243 | 0.703 | 4.029 | |
| Likely to become sick with COVID-19 (relative to do not know) | 1.000 | ||||||
| Yes | 0.771 | 0.122 | −1.65 | 0.099 | 0.566 | 1.050 | * |
| No | 0.522 | 0.137 | −2.47 | 0.013 | 0.311 | 0.874 | ** |
| Practised social distancing in the last 10 months | 0.928 | 0.182 | −0.38 | 0.703 | 0.632 | 1.362 | |
| Wore face mask in the last ten months | 1.270 | 0.263 | 1.16 | 0.247 | 0.847 | 1.905 | |
| Stayed away from mosque in the last ten months | 0.790 | 0.201 | −0.93 | 0.352 | 0.480 | 1.299 | |
| Washed hands in the last ten months | 1.025 | 0.231 | 0.11 | 0.914 | 0.659 | 1.595 | |
| Avoided social events in the last ten months | 1.311 | 0.225 | 1.58 | 0.115 | 0.937 | 1.834 | |
| Practised social distancing in the last four weeks | 0.683 | 0.274 | −0.95 | 0.342 | 0.311 | 1.499 | |
| Wore face mask in the last four weeks | 1.348 | 0.339 | 1.19 | 0.234 | 0.824 | 2.206 | |
| Stayed away from mosque in the last four weeks | 0.258 | 0.204 | −1.71 | 0.087 | 0.055 | 1.218 | * |
| Washed hands in the last four weeks | 1.427 | 0.298 | 1.70 | 0.088 | 0.948 | 2.150 | * |
| Avoided social events in the last four weeks | 1.112 | 0.395 | 0.30 | 0.766 | 0.554 | 2.229 | |
| Trust in the official information (relative to no trust) | 1.000 | ||||||
| Little confidence | 1.613 | 0.465 | 1.66 | 0.097 | 0.917 | 2.839 | * |
| Confident | 1.361 | 0.395 | 1.06 | 0.289 | 0.770 | 2.405 | |
| Total confidence | 1.022 | 0.397 | 0.06 | 0.956 | 0.477 | 2.188 | |
| Trust in your own ability to deal with the virus (relative to no trust) | 1.000 | ||||||
| Little confidence | 0.909 | 0.194 | −0.45 | 0.656 | 0.598 | 1.382 | |
| Confident | 0.800 | 0.179 | −1.00 | 0.319 | 0.517 | 1.240 | |
| Total confidence | 1.131 | 0.497 | 0.28 | 0.780 | 0.477 | 2.678 | |
| The virus is dangerous (relative to it is not) | 1.000 | ||||||
| More or less dangerous | 1.813 | 0.437 | 2.47 | 0.014 | 1.131 | 2.907 | ** |
| Very dangerous | 1.334 | 0.330 | 1.17 | 0.243 | 0.822 | 2.166 | |
| Other | 1.919 | 1.850 | 0.68 | 0.499 | 0.290 | 12.695 | |
| Vaccine is effective | 0.539 | 0.097 | −3.42 | 0.001 | 0.378 | 0.768 | *** |
| Vaccine has side effects | 2.536 | 0.418 | 5.65 | 0.000 | 1.836 | 3.502 | *** |
| Constant | 0.072 | 0.049 | −3.90 | 0.000 | 0.019 | 0.270 | *** |
| Mean dependent var | 0.318 | SD dependent var | 0.466 | ||||
| Pseudo r-squared | 0.077 | Number of obs | 1128.000 | ||||
| Chi-square | 104.632 | Prob > chi2 | 0.000 | ||||
| Akaike crit. (AIC) | 1388.300 | Bayesian crit. (BIC) | 1604.513 | ||||
| Logistic Regression | |||||||
|---|---|---|---|---|---|---|---|
| Willing to Vaccinate | Coef. | St. Err. | t-Value | p-Value | [95% Conf | Interval] | Sig |
| Practised social distancing in the last 10 months | 1.137 | 0.119 | 1.22 | 0.221 | 0.926 | 1.395 | |
| Wore face mask in the last 10 months | 1.942 | 0.215 | 6.00 | 0.000 | 1.563 | 2.413 | *** |
| Did not go to mosque in the last 10 months | 1.192 | 0.151 | 1.38 | 0.167 | 0.929 | 1.528 | |
| Avoided social events in the last 10 months | 0.905 | 0.087 | −1.04 | 0.300 | 0.749 | 1.093 | |
| Washed hands in the last 10 months | 1.910 | 0.244 | 5.08 | 0.000 | 1.488 | 2.452 | *** |
| Constant | 0.172 | 0.023 | −13.32 | 0.000 | 0.133 | 0.223 | *** |
| Mean dependent var | 0.307 | SD dependent var | 0.461 | ||||
| Pseudo r-squared | 0.035 | Number of obs | 2848.000 | ||||
| Chi-square | 113.752 | Prob > chi2 | 0.000 | ||||
| Akaike crit. (AIC) | 3404.417 | Bayesian crit. (BIC) | 3446.098 | ||||
| Not willing to vaccinate | Coef. | St. Err. | t-value | p-value | [95% Conf | Interval] | Sig |
| Practised social distancing in the last 10 months | 0.790 | 0.076 | −2.44 | 0.015 | 0.654 | 0.955 | ** |
| Wore face mask in the last 10 months | 0.622 | 0.059 | −5.04 | 0.000 | 0.517 | 0.748 | *** |
| Did not go to mosque in the last 10 months | 0.920 | 0.114 | −0.67 | 0.504 | 0.722 | 1.174 | |
| Avoided social events in the last 10 months | 0.914 | 0.083 | −0.99 | 0.321 | 0.765 | 1.092 | |
| Washed hands in the last 10 months | 0.504 | 0.053 | −6.55 | 0.000 | 0.411 | 0.619 | *** |
| Constant | 1.886 | 0.199 | 6.02 | 0.000 | 1.534 | 2.318 | *** |
| Mean dependent var | 0.410 | SD dependent var | 0.492 | ||||
| Pseudo r-squared | 0.036 | Number of obs | 2848.000 | ||||
| Chi-square | 128.242 | Prob > chi2 | 0.000 | ||||
| Akaike crit. (AIC) | 3733.355 | Bayesian crit. (BIC) | 3775.035 | ||||
| Undecided | Coef. | St. Err. | t-value | p-value | [95% Conf | Interval] | Sig |
| Practised social distancing in the last 10 months | 1.147 | 0.119 | 1.32 | 0.185 | 0.936 | 1.406 | |
| Wore face mask in the last 10 months | 0.952 | 0.099 | −0.47 | 0.635 | 0.776 | 1.167 | |
| Did not go to mosque in the last 10 months | 0.899 | 0.118 | −0.81 | 0.420 | 0.695 | 1.163 | |
| Avoided social events in the last 10 months | 1.218 | 0.117 | 2.05 | 0.040 | 1.009 | 1.470 | ** |
| Washed hands in the last 10 months | 1.305 | 0.155 | 2.24 | 0.025 | 1.034 | 1.647 | ** |
| Constant | 0.259 | 0.031 | −11.14 | 0.000 | 0.204 | 0.329 | *** |
| Mean dependent var | 0.283 | SD dependent var | 0.450 | ||||
| Pseudo r-squared | 0.007 | Number of obs | 2848.000 | ||||
| Chi-square | 22.641 | Prob > chi2 | 0.001 | ||||
| Akaike crit. (AIC) | 3382.133 | Bayesian crit. (BIC) | 3423.814 | ||||
| Logistic Regression | |||||||
|---|---|---|---|---|---|---|---|
| Willing to Vaccinate | Coef. | St. Err. | t-Value | p-Value | [95% Conf | Interval] | Sig |
| Practised social distancing in the last 4 weeks | 1.106 | 0.191 | 0.58 | 0.559 | 0.788 | 1.553 | |
| Wore face mask in the last 4 weeks | 1.665 | 0.181 | 4.68 | 0.000 | 1.345 | 2.061 | *** |
| Did not go to mosque in the last 4 weeks | 1.259 | 0.417 | 0.70 | 0.487 | 0.658 | 2.412 | |
| Avoided social events in the last 4 weeks | 1.227 | 0.206 | 1.22 | 0.223 | 0.883 | 1.706 | |
| Washed hands in the last 4 weeks | 1.871 | 0.199 | 5.88 | 0.000 | 1.518 | 2.305 | *** |
| Constant | 0.278 | 0.021 | −16.70 | 0.000 | 0.239 | 0.323 | *** |
| Mean dependent var | 0.307 | SD dependent var | 0.461 | ||||
| Pseudo r-squared | 0.050 | Number of obs | 2848.000 | ||||
| Chi-square | 166.834 | Prob > chi2 | 0.000 | ||||
| Akaike crit. (AIC) | 3351.825 | Bayesian crit. (BIC) | 3393.506 | ||||
| Unwilling to vaccinate | Coef. | St. Err. | t-value | p-value | [95% Conf | Interval] | Sig |
| Practised social distancing in the last 4 weeks | 0.924 | 0.159 | −0.46 | 0.646 | 0.659 | 1.295 | |
| Wore face mask in the last 4 weeks | 0.774 | 0.084 | −2.37 | 0.018 | 0.626 | 0.957 | ** |
| Did not go to mosque in the last 4 weeks | 1.463 | 0.486 | 1.15 | 0.252 | 0.763 | 2.804 | |
| Avoided social events in the last 4 weeks | 0.581 | 0.107 | −2.94 | 0.003 | 0.405 | 0.835 | *** |
| Washed hands in the last 4 weeks | 0.561 | 0.056 | −5.80 | 0.000 | 0.462 | 0.682 | *** |
| Constant | 1.058 | 0.072 | 0.83 | 0.407 | 0.926 | 1.209 | |
| Mean dependent var | 0.410 | SD dependent var | 0.492 | ||||
| Pseudo r-squared | 0.030 | Number of obs | 2848.000 | ||||
| Chi-square | 107.547 | Prob > chi2 | 0.000 | ||||
| Akaike crit. (AIC) | 3754.570 | Bayesian crit. (BIC) | 3796.251 | ||||
| Undecided | Coef. | St. Err. | t-value | p-value | [95% Conf | Interval] | Sig |
| Practised social distancing in the last 4 weeks | 0.979 | 0.184 | −0.11 | 0.911 | 0.678 | 1.414 | |
| Wore face mask in the last 4 weeks | 0.755 | 0.088 | −2.41 | 0.016 | 0.601 | 0.949 | ** |
| Did not go to mosque in the last 4 weeks | 0.438 | 0.180 | −2.00 | 0.045 | 0.195 | 0.981 | ** |
| Avoided social events in the last 4 weeks | 1.373 | 0.240 | 1.82 | 0.069 | 0.976 | 1.934 | * |
| Washed hands in the last 4 weeks | 1.063 | 0.116 | 0.56 | 0.577 | 0.858 | 1.315 | |
| Constant | 0.366 | 0.028 | −13.06 | 0.000 | 0.315 | 0.426 | *** |
| Mean dependent var | 0.283 | SD dependent var | 0.450 | ||||
| Pseudo r-squared | 0.007 | Number of obs | 2848.000 | ||||
| Chi-square | 22.906 | Prob > chi2 | 0.001 | ||||
| Akaike crit. (AIC) | 3382.811 | Bayesian crit. (BIC) | 3424.491 | ||||
References
- Yemen: 2018 Humanitarian Needs Overview. Available online: https://reliefweb.int/report/yemen/yemen-2018-humanitarian-needs-overview-enar (accessed on 1 May 2023).
- Yemen Humanitarian Needs Overview 2021. Available online: https://reliefweb.int/report/yemen/yemen-humanitarian-needs-overview-2021-february-2021-enar (accessed on 1 May 2023).
- Ghobari, M. War-Ravaged Yemen Confirms First Coronavirus Case, Braces for More. 10 April 2020. Available online: https://www.reuters.com/article/us-healthcoronavirus-yemen-case/war-ravaged-yemenconfirms-first-coronavirus-case-braces-formore-idUSKCN21S0EI (accessed on 3 June 2021).
- Almoughales, A.A.; Swed, S.; Sawaf, B.; Alibrahim, H. COVID-19 vaccine hesitancy among indigenous people in Yemen: An incipient crisis. Ann. Med. Surg. 2022, 73, 103206. [Google Scholar] [CrossRef] [PubMed]
- Koum Besson, E.S.; Norris, A.; Bin Ghouth, A.S.; Freemantle, T.; Alhaffar, M.; Vazquez, Y.; Reeve, C.; Curran, P.J.; Checci, F. Excess mortality during the COVID-19 pandemic: A geospatial and statistical analysis in Aden governorate, Yemen. BMJ Glob. Health 2021, 6, e004564. [Google Scholar] [CrossRef] [PubMed]
- WHO. WHO Yemen Update Situation Report—Issue No.3 (March 2021). 9 May 2021. Available online: https://reliefweb.int/report/yemen/who-yemen-update-situation-report-issue-no3-march-2021 (accessed on 1 May 2023).
- The Johns Hopkins University. Understanding Vaccination Progress. Available online: https://coronavirus.jhu.edu/vaccines/international (accessed on 1 May 2023).
- Bitar, A.N.; Zawiah, M.; Al-Ashwal, F.Y.; Kubas, M.; Saeed, R.M.; Abduljabbar, R.; Jaber, A.A.S.; Sulaiman, S.A.S.; Khan, A.H. Misinformation, perceptions towards COVID-19 and willingness to be vaccinated: A population-based survey in Yemen. PLoS ONE 2021, 16, e0248325. [Google Scholar] [CrossRef] [PubMed]
- Noushad, M.; Al-Awar, M.S.; Al-Saqqaf, I.S.; Nassani, M.Z.; Alrubaiee, G.G.; Rastam, S. Lack of Access to Coronavirus Disease 2019 Vaccines Could Be a Greater Threat than Vaccine Hesitancy in Low-Income and Conflict Nations: The Case of Yemen. Clin. Infect. Dis. 2022, 75, 1827–1833. [Google Scholar] [CrossRef] [PubMed]
- Bin Ghouth, A.; Al-Kaldy, K. COVID-19 Vaccine Acceptance in Mukalla City, Yemen. Res. Sq. 2021. [Google Scholar] [CrossRef]
- Nikoloski, Z.; Bain, R.; Elzalabany, M.; Hanna, P.; Aynsley, T.R.; Samhouri, D.; Menchini, L.; Kapil, N.; Gillespie, A. Modelling COVID-19 vaccination status and adherence to public health and social measures, Members of Eastern Mediterranean Region and Algeria. Bull. World Health Organ. 2023, 101, 111–120. [Google Scholar] [CrossRef] [PubMed]
- Abu-Farha, R.; Mukattash, T.; Itani, R.; Karout, S.; Khojah, H.M.; Al-Mahmood, A.A.; Alzoubi, K.H. Willingness of Middle Eastern public to receive COVID-19 vaccines. Saudi Pharm. J. 2021, 29, 734–739. [Google Scholar] [CrossRef] [PubMed]
- Dubé, E.; Gagnon, D.; Nickels, E.; Jeram, S.; Schuster, M. Mapping vaccine hesitancy—Country-specific characteristics of a global phenomenon. Vaccine 2014, 32, 6649–6654. [Google Scholar] [CrossRef] [PubMed]
- Wagner, A.L.; Masters, N.B.; Domek, G.J.; Mathew, J.L.; Sun, X.; Asturias, E.J.; Ren, J.; Huang, Z.; Contreras-Roldan, I.L.; Gebremeskel, B.; et al. Comparisons of Vaccine Hesitancy across Five Low- and Middle-Income Countries. Vaccines 2019, 7, 155. [Google Scholar] [CrossRef] [PubMed]
- Lam, C.N.; Kaplan, C.; Saluja, S. Relationship between mask wearing, testing, and vaccine willingness among Los Angeles County adults during the peak of the COVID-19 pandemic. Transl. Behav. Med. 2022, 12, 480–485. [Google Scholar] [CrossRef]
- Hogg, M.A.; Terry, D.J.; White, K.M. A tale of two theories: A critical comparison of identity theory with social identity theory. Soc. Psychol. Q. 1995, 58, 255–269. [Google Scholar] [CrossRef]
- Salem, G.M.; Said, R.M.; Abdelsalam, A.E. Acceptance rate of COVID-19 vaccination and its predictors in Egypt: An online survey. J. Infect. Dev. Ctries. 2022, 16, 993–1000. [Google Scholar] [CrossRef]
- Yassin, E.O.M.; Faroug, H.A.A.; Ishaq, Z.B.Y.; Mustafa, M.M.A.; Idris, M.M.A.; Widatallah, S.E.K.; Abd El-Raheem, G.O.H.; Suliman, M.Y. COVID-19 Vaccination Acceptance among Healthcare Staff in Sudan, 2021. J. Immunol. Res. 2022, 2022, 3392667. [Google Scholar] [CrossRef]
- Darweesh, O.; Khatab, N.; Kheder, R.; Mohammed, T.; Faraj, T.; Ali, S.; Ameen, M.; Kamal-Aldin, A.; Alswes, M.; Al-Jomah, N. Assessment of COVID-19 vaccination among healthcare workers in Iraq; adverse effects and hesitancy. PLoS ONE 2022, 17, e0274526. [Google Scholar] [CrossRef]
- Askarian, M.; Fu, L.Y.; Taghrir, M.H.; Borazjani, R.; Shayan, Z.; Taherifard, E.; Taherifard, E.; Akbarialiabad, H.; Longtin, Y.; Askarian, A.; et al. COVID-19 Vaccination Acceptance in Iran, a Nationwide Survey on Factors Associated with the Willingness toward Getting Vaccinated. Int. J. Prev. Med. 2022, 13, 130. [Google Scholar] [CrossRef]
- Mahmud, I.; Al Imam, M.H.; Vinnakota, D.; Kheirallah, K.A.; Jaber, M.F.; Abalkhail, A.; Alasqah, I.; Alslamah, T.; Kabir, R. Vaccination Intention against COVID-19 among the Unvaccinated in Jordan during the Early Phase of the Vaccination Drive: A Cross-Sectional Survey. Vaccines 2022, 10, 1159. [Google Scholar] [CrossRef] [PubMed]
- Yasmin, F.; Asghar, W.; Babar, M.S.; Khan, H.; Ahmad, S.; Hameed, Z.; Asghar, M.S.; Nauman, H.; Khattak, A.K.; Arshad, Z.; et al. Acceptance Rates and Beliefs toward COVID-19 Vaccination among the General Population of Pakistan: A Cross-Sectional Survey. Am. J. Trop. Med. Hyg. 2021, 105, 1230–1239. [Google Scholar] [CrossRef] [PubMed]
- Lounis, M.; Abdelhadi, S.; Rais, M.A.; Bencherit, D.; Sallam, M. Intention to get COVID-19 vaccination and its associated predictors: A cross-sectional study among the general public in Algeria. Vacunas 2022, 23, S52–S59. [Google Scholar] [CrossRef] [PubMed]
- SWI swissinfo.ch. Yemen and the Challenge of COVID Vaccine Rollout in Conflict Countries. Available online: https://www.swissinfo.ch/eng/politics/yemen-and-the-challenge-of-covid-vaccine-rollout-in-conflict-countries/46651534 (accessed on 1 May 2023).
- Daraj. Yemen: “We Don’t Want Vaccines. There Is No Corona Here. We Are Fine.” 2021. Available online: https://daraj.com/en/66891/ (accessed on 1 May 2023).
- TittlePress. Corona Vaccine—The Unfounded Story of Infertility|Sciences|In-Depth Science and Technology Report DW. 2021. Available online: https://tittlepress.com/covid19/1031146/ (accessed on 1 May 2023).
- Gavi. Joint Appraisal for Afghanistan. 2019. Available online: https://www.gavi.org/country-documents/afghanistan (accessed on 1 May 2023).


| Round 3 (March 2021) | Round 4 (Aug/Sept 2021) | Round 5 (April 2022) | ||||
|---|---|---|---|---|---|---|
| % | Number | % | Number | % | Number | |
| Age | ||||||
| under 20 | 6.4 | 89 | 7.4 | 104 | 7.0 | 101 |
| 21 to 30 | 29.3 | 408 | 31.6 | 446 | 28.7 | 416 |
| 31 to 40 | 31.8 | 443 | 30.7 | 433 | 31.2 | 452 |
| 41 to 50 | 21.3 | 296 | 18.1 | 255 | 20.9 | 303 |
| 51 to 60 | 9.1 | 127 | 10.3 | 145 | 9.4 | 136 |
| 61 to 70 | 1.7 | 23 | 2.1 | 29 | 2.2 | 32 |
| 71 and above | 0.4 | 6 | 0.0 | 0 | 0.7 | 10 |
| Education | ||||||
| cannot read and write | 10.0 | 140 | 10.4 | 147 | 7.2 | 105 |
| can read and write | 18.2 | 255 | 15.6 | 220 | 15.6 | 226 |
| basic | 12.0 | 167 | 12.2 | 173 | 14.9 | 216 |
| secondary | 28.7 | 401 | 27.7 | 391 | 31.0 | 450 |
| college degree | 29.3 | 409 | 31.8 | 449 | 27.8 | 404 |
| masters or PhD | 1.9 | 26 | 2.3 | 33 | 3.5 | 50 |
| Gender | ||||||
| female | 46.6 | 651 | 42.9 | 606 | 34.1 | 494 |
| male | 53.4 | 747 | 57.1 | 807 | 66.0 | 957 |
| Occupation | ||||||
| agricultural | 9.0 | 126 | 10.5 | 149 | 8.9 | 129 |
| educational | 14.5 | 203 | 17.1 | 242 | 14.0 | 203 |
| housewife | 24.7 | 345 | 19.9 | 281 | 17.4 | 252 |
| office | 12.4 | 173 | 11.8 | 167 | 16.3 | 237 |
| student | 13.8 | 193 | 12.7 | 179 | 15.2 | 220 |
| unemployed | 6.9 | 97 | 5.9 | 84 | 4.1 | 60 |
| handicraft | 9.7 | 136 | 14.1 | 199 | 19.0 | 276 |
| other | 8.9 | 125 | 7.9 | 112 | 5.1 | 74 |
| Likely to become sick with COVID-19 | ||||||
| I do not know | 40.7 | 554 | 36.2 | 506 | 38.0 | 550 |
| Yes | 41.3 | 563 | 49.0 | 685 | 49.8 | 721 |
| No | 18.1 | 246 | 14.9 | 208 | 12.3 | 178 |
| Trust in the official information from the authorities | ||||||
| no confidence | 26.8 | 337 | 16.5 | 210 | 14.6 | 193 |
| little confidence | 38.8 | 489 | 35.1 | 447 | 26.9 | 356 |
| confident | 27.4 | 345 | 36.1 | 460 | 50.7 | 670 |
| total confidence | 7.0 | 88 | 12.4 | 158 | 7.8 | 103 |
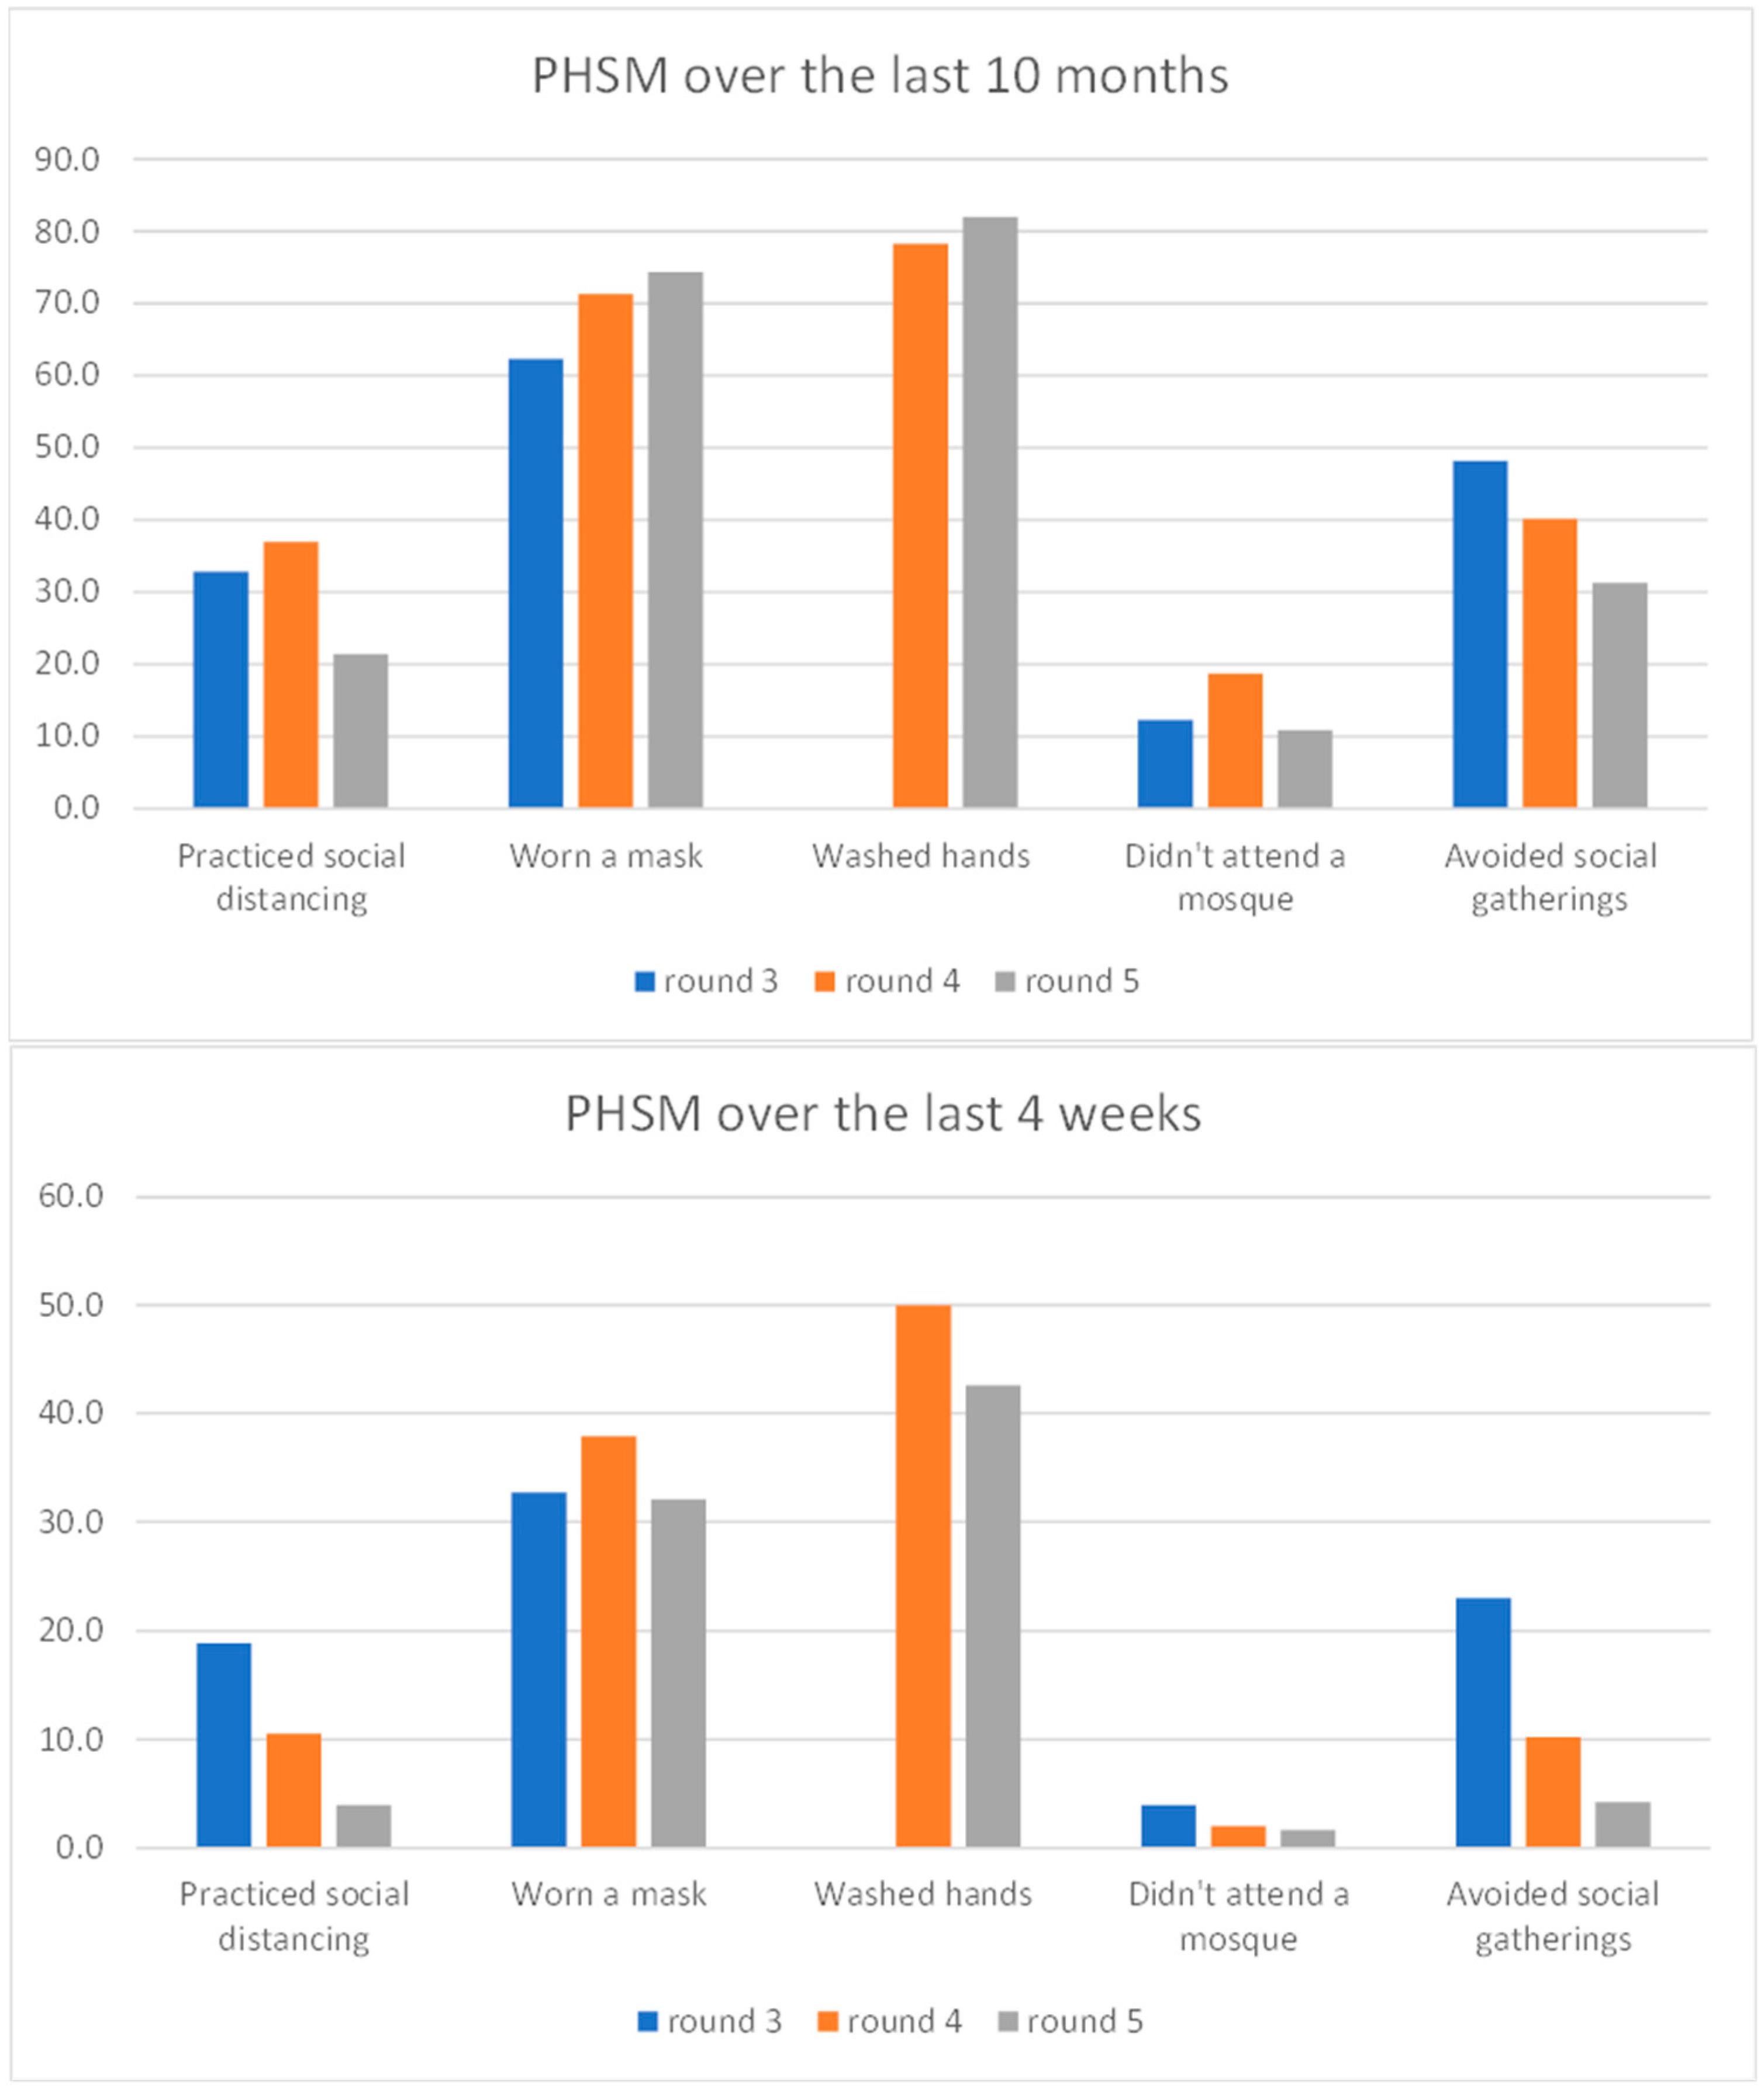
| PHSM in the last 10 months | ||||||
| practised social distancing | 32.8 | 447 | 37.0 | 517 | 21.4 | 310 |
| worn a mask | 62.3 | 849 | 71.3 | 997 | 74.3 | 1077 |
| washed hands | N/A | N/A | 78.3 | 1095 | 82.0 | 1188 |
| PHSM in the last 4 weeks | ||||||
| practised social distancing | 18.9 | 257 | 10.5 | 147 | 3.9 | 57 |
| worn a mask | 32.7 | 446 | 37.9 | 530 | 32.1 | 464 |
| washed hands | N/A | N/A | 50.0 | 699 | 42.6 | 617 |
| Willing | Not Sure | Not Willing | |||||
|---|---|---|---|---|---|---|---|
| % | Number | % | Number | % | Number | chi2 p-Value | |
| Age | |||||||
| under 20 | 37 | 37 | 32 | 32 | 31 | 31 | <0.001 |
| 21 to 30 | 33.4 | 139 | 30.8 | 128 | 35.8 | 149 | |
| 31 to 40 | 29.3 | 132 | 29.5 | 133 | 41.2 | 186 | |
| 41 to 50 | 21.5 | 65 | 32 | 97 | 46.5 | 141 | |
| 51 to 60 | 18.4 | 25 | 32.4 | 44 | 49.3 | 67 | |
| 61 to 70 | 18.8 | 6 | 25 | 8 | 56.3 | 18 | |
| 71 and above | 30 | 3 | 30 | 3 | 40 | 4 | |
| Education | |||||||
| cannot read and write | 14.3 | 15 | 18.1 | 19 | 67.6 | 71 | <0.001 |
| can read and write | 18.1 | 41 | 29.2 | 66 | 52.7 | 119 | |
| basic | 34 | 73 | 29.8 | 64 | 36.3 | 78 | |
| secondary | 28.7 | 129 | 33.6 | 151 | 37.8 | 170 | |
| college degree | 31.3 | 126 | 32.5 | 131 | 36.2 | 146 | |
| masters or PhD | 48 | 24 | 28 | 14 | 24 | 12 | |
| Gender | |||||||
| female | 19.5 | 96 | 29.9 | 147 | 50.6 | 249 | <0.001 |
| male | 32.6 | 312 | 31.1 | 298 | 36.3 | 347 | |
| Occupation | |||||||
| agricultural | 14 | 18 | 28.7 | 37 | 57.4 | 74 | <0.001 |
| educational | 30.1 | 61 | 34 | 69 | 36 | 73 | |
| housewife | 16.7 | 42 | 28.7 | 72 | 54.6 | 137 | |
| office | 31.2 | 74 | 35 | 83 | 33.8 | 80 | |
| student | 38.8 | 85 | 31.1 | 68 | 30.1 | 66 | |
| unemployed | 20 | 12 | 38.3 | 23 | 41.7 | 25 | |
| handicraft | 30.8 | 85 | 27.5 | 76 | 41.7 | 115 | |
| other | 41.9 | 31 | 23 | 17 | 35.1 | 26 | |
| Likely to become sick with COVID-19 | |||||||
| I do not know | 20.9 | 115 | 33.6 | 185 | 45.5 | 250 | <0.001 |
| yes | 36.8 | 265 | 30.9 | 223 | 32.3 | 233 | |
| no | 15.7 | 28 | 20.8 | 37 | 63.5 | 113 | |
| Public Health and Social Measures over the last 10 months | Willing | Not sure | Not willing | ||||
| Practised social distancing | % | number | % | number | % | number | chi2 p-value |
| no | 25.9 | 295 | 30.7 | 350 | 43.4 | 494 | <0.001 |
| yes | 36.5 | 113 | 30.7 | 95 | 32.9 | 102 | |
| Worn a mask | |||||||
| no | 13.2 | 49 | 25.3 | 94 | 61.6 | 229 | <0.001 |
| yes | 33.3 | 359 | 32.6 | 351 | 34.1 | 367 | |
| Stayed away from the mosque | |||||||
| no | 26.7 | 345 | 31 | 400 | 42.3 | 547 | <0.001 |
| yes | 40.1 | 63 | 28.7 | 45 | 31.2 | 49 | |
| Wash hands | |||||||
| no | 13.8 | 36 | 24.1 | 63 | 62.1 | 162 | <0.001 |
| yes | 31.3 | 372 | 32.2 | 382 | 36.5 | 434 | |
| Avoided social gatherings | |||||||
| no | 26.4 | 263 | 29.6 | 295 | 44 | 438 | <0.001 |
| yes | 32 | 145 | 33.1 | 150 | 34.9 | 158 | |
| Public Health and Social Measures over the last 4 weeks | Willing | Not sure | Not willing | ||||
| Practised social distancing | % | number | % | number | % | number | chi2 p-value |
| no | 27.5 | 383 | 31 | 431 | 41.5 | 578 | <0.001 |
| yes | 43.9 | 25 | 24.6 | 14 | 31.6 | 18 | |
| Worn a mask | |||||||
| no | 21 | 207 | 30.7 | 302 | 48.3 | 476 | <0.001 |
| yes | 43.3 | 201 | 30.8 | 143 | 25.9 | 120 | |
| Stayed away from the mosque | |||||||
| no | 27.7 | 394 | 31 | 442 | 41.3 | 589 | <0.001 |
| yes | 58.3 | 14 | 12.5 | 3 | 29.2 | 7 | |
| Wash hands | |||||||
| no | 21.4 | 178 | 29.7 | 247 | 48.9 | 407 | <0.001 |
| yes | 37.3 | 230 | 32.1 | 198 | 30.6 | 189 | |
| Avoided social gatherings | |||||||
| no | 27.2 | 377 | 31 | 430 | 41.9 | 581 | <0.001 |
| yes | 50.8 | 31 | 24.6 | 15 | 24.6 | 15 | |
| Willing | Not Sure | Not Willing | |||||
|---|---|---|---|---|---|---|---|
| Knowledge to Protect Yourself from the Virus | % | Number | % | Number | % | Number | chi2 p-Value |
| no knowledge | 2.3 | 1 | 16.3 | 7 | 81.4 | 35 | <0.001 |
| needs improvement | 12.3 | 32 | 27.3 | 71 | 60.4 | 157 | |
| good | 32.3 | 265 | 33.7 | 277 | 34 | 279 | |
| very good | 28.9 | 54 | 34.8 | 65 | 36.4 | 68 | |
| excellent | 40.6 | 56 | 18.1 | 25 | 41.3 | 57 | |
| Trust in the official information from the authorities | |||||||
| no confidence | 14 | 27 | 22.8 | 44 | 63.2 | 122 | <0.001 |
| little confidence | 18.5 | 66 | 36.5 | 130 | 44.9 | 160 | |
| confident | 37.6 | 252 | 31.5 | 211 | 30.9 | 207 | |
| total confidence | 42.7 | 44 | 21.4 | 22 | 35.9 | 37 | |
| Trust in your own ability to deal with the virus | |||||||
| no confidence | 19.5 | 25 | 29.7 | 38 | 50.8 | 65 | <0.001 |
| little confidence | 16.3 | 54 | 33.5 | 111 | 50.2 | 166 | |
| confident | 34.4 | 226 | 31.2 | 205 | 34.4 | 226 | |
| total confidence | 41.2 | 70 | 27.1 | 46 | 31.8 | 54 | |
| How dangerous do you think the COVID-19 virus is | |||||||
| it is not dangerous | 2.6 | 7 | 24.9 | 66 | 72.5 | 192 | <0.001 |
| more or less dangerous | 29.5 | 189 | 33 | 211 | 37.5 | 240 | |
| very dangerous | 40.3 | 210 | 31.1 | 162 | 28.6 | 149 | |
| Willing | Not Sure | Not Willing | |||||
|---|---|---|---|---|---|---|---|
| Vaccine Is Effective | % | Number | % | Number | % | Number | chi2 p-Value |
| no | 10.3 | 65 | 37.7 | 238 | 52 | 328 | <0.001 |
| yes | 48.2 | 339 | 25.8 | 181 | 26 | 183 | |
| Vaccine has side effects | |||||||
| no | 48.1 | 317 | 22.9 | 151 | 29 | 191 | <0.001 |
| yes | 12.9 | 87 | 39.7 | 268 | 47.7 | 320 | |
| Most Trusted Source | Willing | Not Sure | Not Willing | ||||
|---|---|---|---|---|---|---|---|
| % | Number | % | Number | % | Number | chi2 p-Value | |
| TV | |||||||
| first mention | 35.6 | 252 | 28.4 | 201 | 36 | 255 | <0.001 |
| second mention | 15.8 | 15 | 39 | 37 | 45.3 | 43 | |
| third mention | 22.6 | 7 | 35.5 | 11 | 41.9 | 13 | |
| Radio | |||||||
| first mention | 16.8 | 19 | 37.2 | 42 | 46 | 52 | 0.56 |
| second mention | 10.3 | 3 | 37.9 | 11 | 51.7 | 15 | |
| third mention | 28.6 | 4 | 21.4 | 3 | 50 | 7 | |
| first mention | 33.1 | 46 | 33.8 | 47 | 33.1 | 46 | 0.21 |
| second mention | 28.6 | 22 | 29.9 | 23 | 41.6 | 32 | |
| third mention | 14.7 | 5 | 35.3 | 12 | 50 | 17 | |
| Social media | |||||||
| first mention | 36.4 | 51 | 34.3 | 48 | 29.3 | 41 | 0.21 |
| second mention | 37.1 | 39 | 31.4 | 33 | 31.4 | 33 | |
| third mention | 21.2 | 11 | 34.6 | 18 | 44.2 | 23 | |
| Communication materials | |||||||
| first mention | 47 | 31 | 27.3 | 18 | 25.8 | 17 | 0.16 |
| second mention | 42.9 | 18 | 35.7 | 15 | 21.4 | 9 | |
| third mention | 20 | 5 | 40 | 10 | 40 | 10 | |
| Health unit | |||||||
| first mention | 29.5 | 31 | 22.9 | 24 | 47.6 | 50 | 0.32 |
| second mention | 18.4 | 16 | 26.4 | 23 | 55.2 | 48 | |
| third mention | 30 | 12 | 30 | 12 | 40 | 16 | |
| Family | |||||||
| first mention | 10.4 | 23 | 24.3 | 54 | 65.3 | 145 | 0.07 |
| second mention | 17.9 | 17 | 27.4 | 26 | 54.7 | 52 | |
| third mention | 23.7 | 9 | 29 | 11 | 47.4 | 18 | |
| Friends | |||||||
| first mention | 28 | 30 | 22.4 | 24 | 49.5 | 53 | 0.03 |
| second mention | 20.6 | 21 | 24.5 | 25 | 54.9 | 56 | |
| third mention | 6.7 | 4 | 31.7 | 19 | 61.7 | 37 | |
| Community health workers | |||||||
| first mention | 26.8 | 37 | 32.6 | 45 | 40.6 | 56 | 0.29 |
| second mention | 25.6 | 21 | 28.1 | 23 | 46.3 | 38 | |
| third mention | 21.3 | 13 | 21.3 | 13 | 57.4 | 35 | |
| Volunteers | |||||||
| first mention | 39.5 | 43 | 23.9 | 26 | 36.7 | 40 | 0.35 |
| second mention | 27.1 | 19 | 24.3 | 17 | 48.6 | 34 | |
| third mention | 33.3 | 15 | 31.1 | 14 | 35.6 | 16 | |
| Community leaders | |||||||
| first mention | 50 | 8 | 25 | 4 | 25 | 4 | 0.07 |
| second mention | 5.9 | 1 | 47.1 | 8 | 47.1 | 8 | |
| third mention | 24 | 6 | 32 | 8 | 44 | 11 | |
| Religious leaders | |||||||
| first mention | 22.3 | 37 | 33.7 | 56 | 44 | 73 | 0.52 |
| second mention | 25.6 | 22 | 24.4 | 21 | 50 | 43 | |
| third mention | 23.2 | 19 | 25.6 | 21 | 51.2 | 42 | |
| Traditional healers | |||||||
| first mention | 30.8 | 4 | 15.4 | 2 | 53.9 | 7 | 0.27 |
| second mention | 25 | 3 | 25 | 3 | 50 | 6 | |
| third mention | 0 | 0 | 45.5 | 5 | 54.6 | 6 | |
| A person from the community | |||||||
| first mention | 44.4 | 4 | 22.2 | 2 | 33.3 | 3 | 0.2 |
| second mention | 66.7 | 6 | 0 | 0 | 33.3 | 3 | |
| third mention | 28.6 | 8 | 35.7 | 10 | 35.7 | 10 | |
Disclaimer/Publisher’s Note: The statements, opinions and data contained in all publications are solely those of the individual author(s) and contributor(s) and not of MDPI and/or the editor(s). MDPI and/or the editor(s) disclaim responsibility for any injury to people or property resulting from any ideas, methods, instructions or products referred to in the content. |
© 2023 by the authors. Licensee MDPI, Basel, Switzerland. This article is an open access article distributed under the terms and conditions of the Creative Commons Attribution (CC BY) license (https://creativecommons.org/licenses/by/4.0/).
Share and Cite
Nikoloski, Z.; Chimenya, D.; Alshehari, A.; Hassan, H.; Bain, R.; Menchini, L.; Gillespie, A. COVID-19 Vaccination Personas in Yemen: Insights from Three Rounds of a Cross-Sectional Survey. Vaccines 2023, 11, 1272. https://doi.org/10.3390/vaccines11071272
Nikoloski Z, Chimenya D, Alshehari A, Hassan H, Bain R, Menchini L, Gillespie A. COVID-19 Vaccination Personas in Yemen: Insights from Three Rounds of a Cross-Sectional Survey. Vaccines. 2023; 11(7):1272. https://doi.org/10.3390/vaccines11071272
Chicago/Turabian StyleNikoloski, Zlatko, Dennis Chimenya, Abdullah Alshehari, Hauwa Hassan, Robert Bain, Leonardo Menchini, and Amaya Gillespie. 2023. "COVID-19 Vaccination Personas in Yemen: Insights from Three Rounds of a Cross-Sectional Survey" Vaccines 11, no. 7: 1272. https://doi.org/10.3390/vaccines11071272
APA StyleNikoloski, Z., Chimenya, D., Alshehari, A., Hassan, H., Bain, R., Menchini, L., & Gillespie, A. (2023). COVID-19 Vaccination Personas in Yemen: Insights from Three Rounds of a Cross-Sectional Survey. Vaccines, 11(7), 1272. https://doi.org/10.3390/vaccines11071272