
Dose Intervals and Time since Final Dose on Changes in Metabolic Indices after COVID-19 Vaccination


Abstract
:1. Introduction
2. Materials and Methods
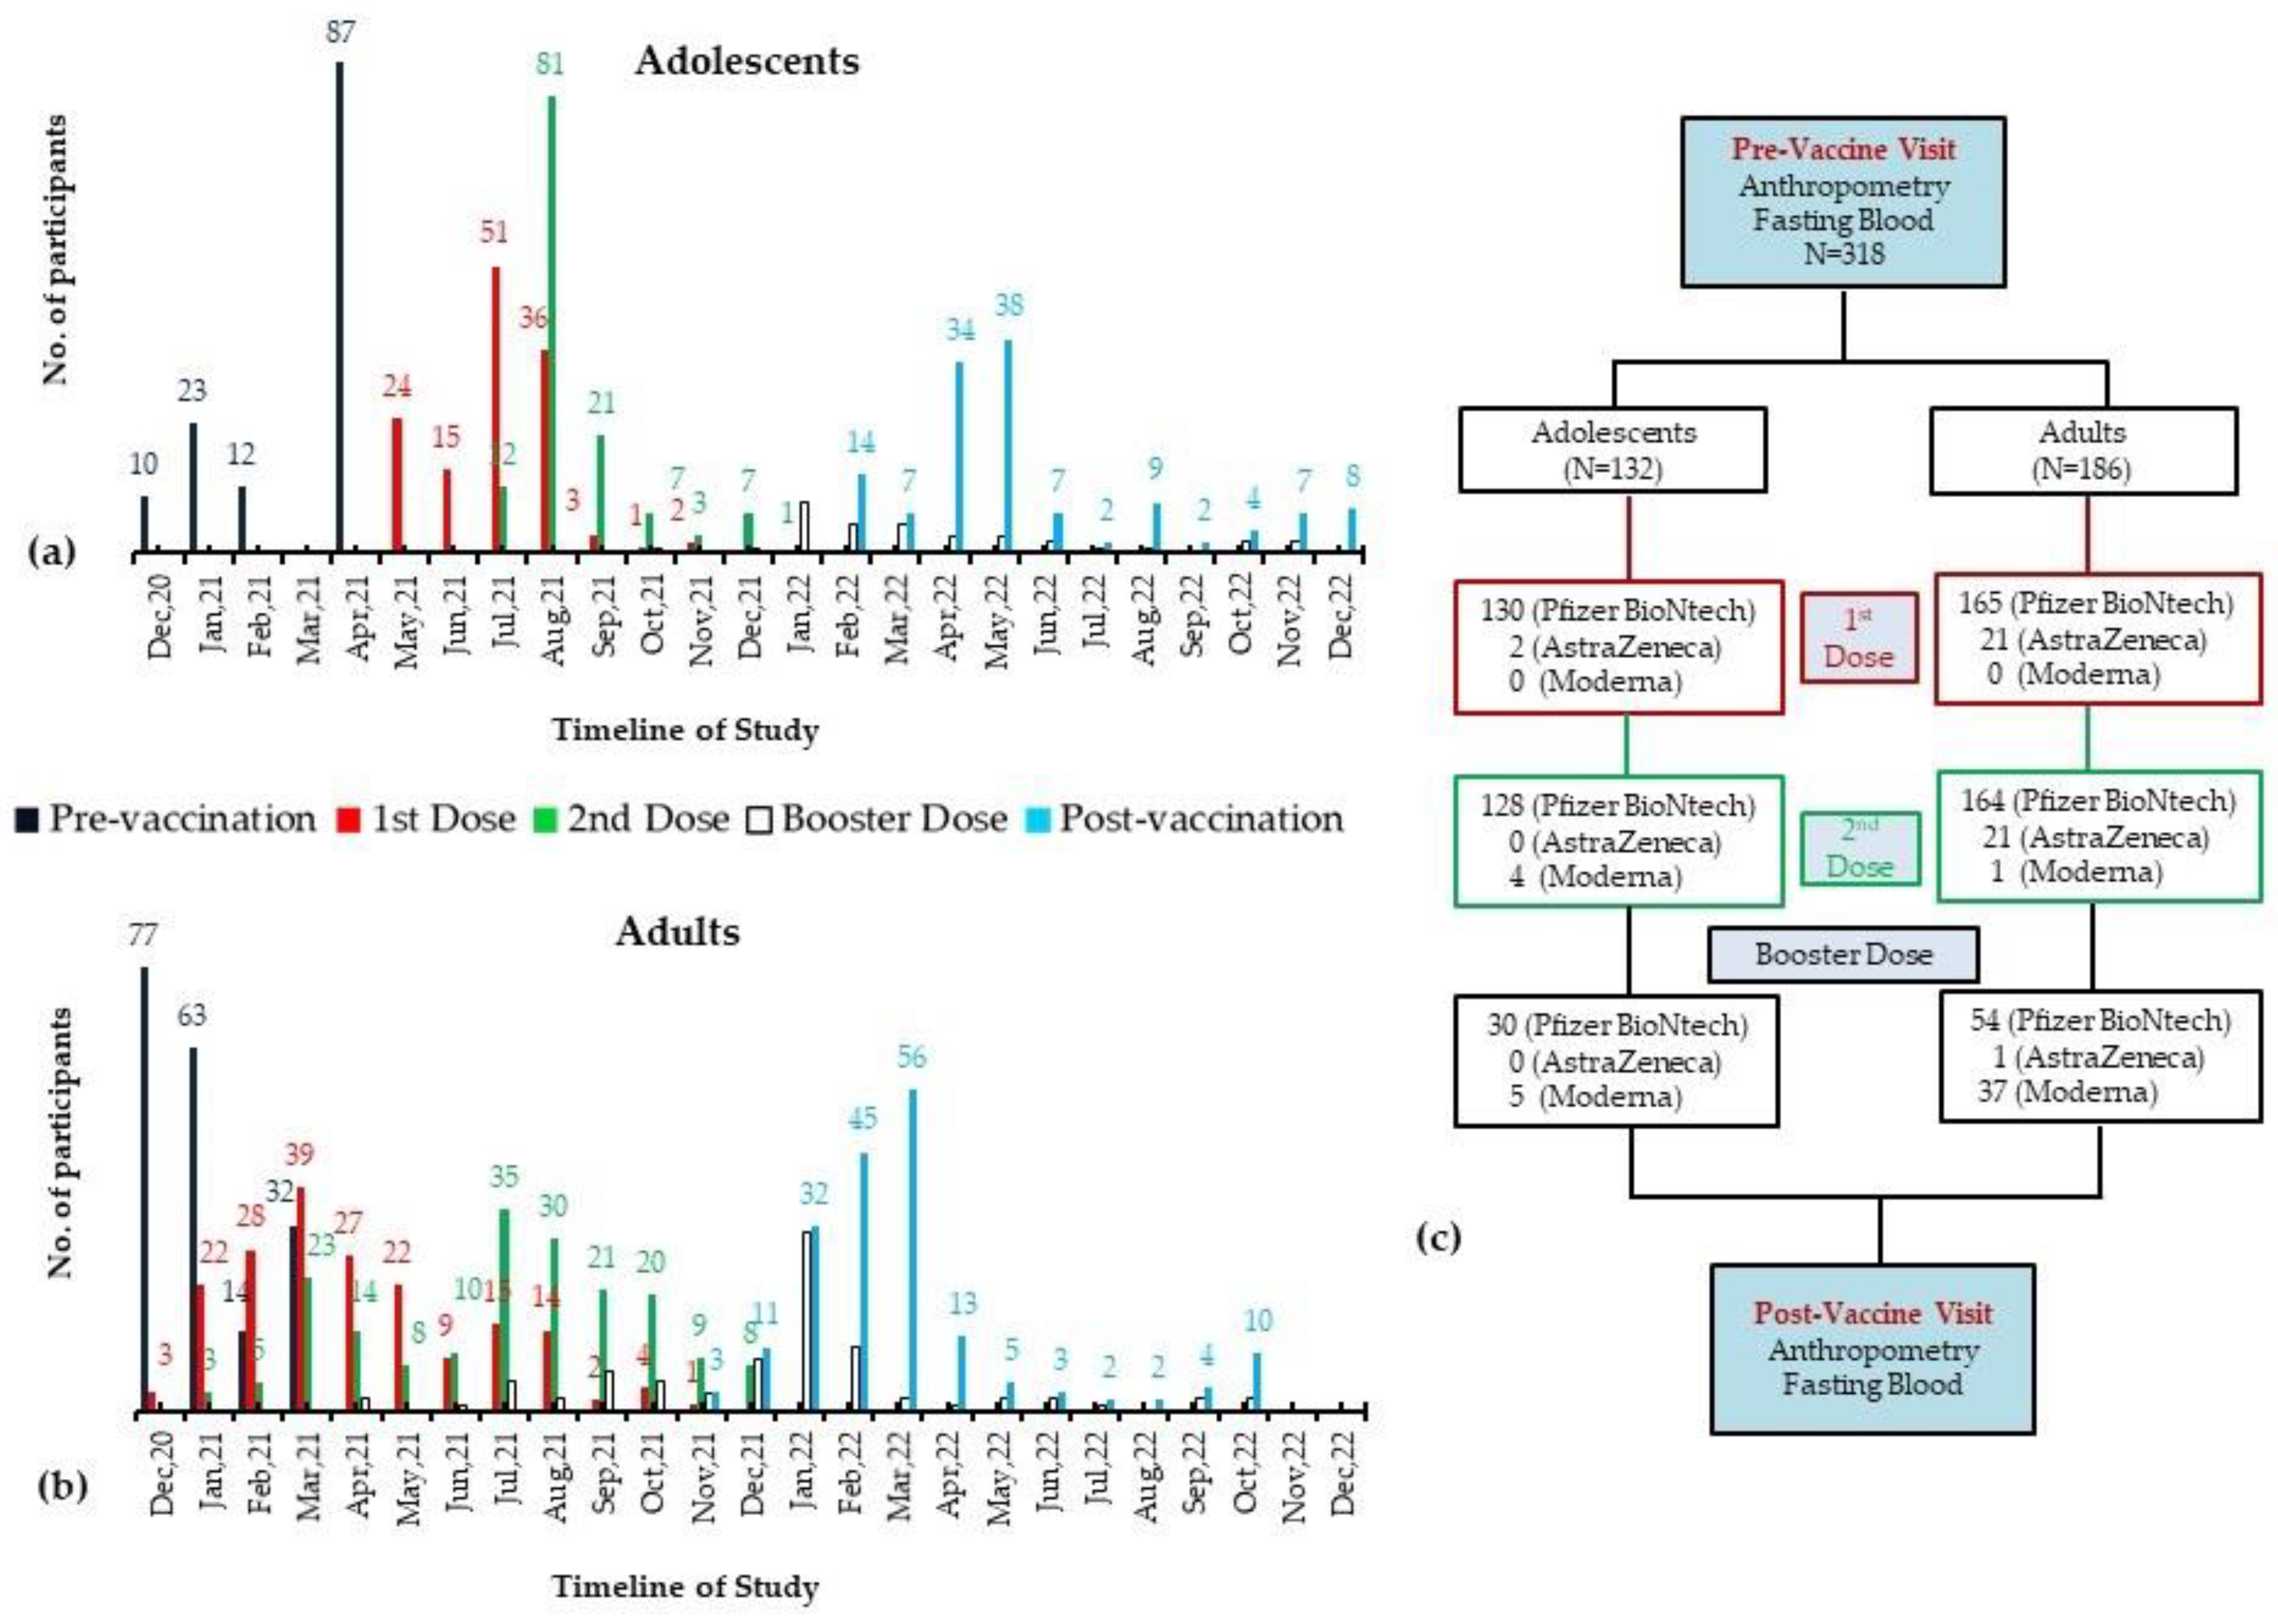
2.1. Participants and Assessment at Pre-Vaccination Visit
2.2. Post-Vaccination Assessment
2.3. Biochemical Analysis
2.4. Data Analysis
3. Results
3.1. Study Subjects’ Baseline Characteristics
3.2. Differences in Pre- to Post-Vaccination Changes in the Study Groups
3.3. Difference in Pre- to Post-Vaccination Changes in the Prevalence of MetS and Its Components
4. Discussion
5. Conclusions
Supplementary Materials
Author Contributions
Funding
Institutional Review Board Statement
Informed Consent Statement
Data Availability Statement
Acknowledgments
Conflicts of Interest
References
- Feng, W.; Zong, W.; Wang, F.; Ju, S. Severe acute respiratory syndrome coronavirus 2 (SARS-CoV-2): A review. Mol. Cancer 2020, 19, 100. [Google Scholar] [CrossRef]
- Kandi, V.; Thungaturthi, S.; Vadakedath, S.; Gundu, R.; Mohapatra, R.K.; Gundu, R., Sr. Mortality rates of coronavirus disease 2019 (COVID-19) caused by the novel severe acute respiratory syndrome coronavirus-2 (SARS-CoV-2). Cureus 2021, 13, 14081. [Google Scholar] [CrossRef] [PubMed]
- Wouters, O.J.; Shadlen, K.C.; Salcher-Konrad, M.; Pollard, A.J.; Larson, H.J.; Teerawattananon, Y.; Jit, M. Challenges in ensuring global access to COVID-19 vaccines: Production, affordability, allocation, and deployment. Lancet 2021, 397, 1023–1034. [Google Scholar] [CrossRef] [PubMed]
- Barouch, D.H. COVID-19 vaccines—Immunity, variants, boosters. N. Engl. J. Med. 2022, 387, 1011–1020. [Google Scholar] [CrossRef] [PubMed]
- Firouzabadi, N.; Ghasemiyeh, P.; Moradishooli, F.; Mohammadi-Samani, S. Update on the effectiveness of COVID-19 vaccines on different variants of SARS-CoV-2. Int. Immunopharmacol. 2023, 117, 109968. [Google Scholar] [CrossRef] [PubMed]
- Mohammed, I.; Nauman, A.; Paul, P.; Ganesan, S.; Chen, K.-H.; Jalil, S.M.S.; Jaouni, S.H.; Kawas, H.; Khan, W.A.; Vattoth, A.L. The efficacy and effectiveness of the COVID-19 vaccines in reducing infection, severity, hospitalization, and mortality: A systematic review. Hum. Vaccines Immunother. 2022, 18, 2027160. [Google Scholar] [CrossRef]
- Rudan, I.; Adeloye, D.; Sheikh, A. COVID-19: Vaccines, efficacy and effects on variants. Curr. Opin. Pulm. Med. 2022, 28, 180–191. [Google Scholar] [CrossRef]
- Skowronski, D.M.; Febriani, Y.; Ouakki, M.; Setayeshgar, S.; El Adam, S.; Zou, M.; Talbot, D.; Prystajecky, N.; Tyson, J.R.; Gilca, R. Two-dose severe acute respiratory syndrome coronavirus 2 vaccine effectiveness with mixed schedules and extended dosing intervals: Test-negative design studies from British Columbia and Quebec, Canada. Clin. Infect. Dis. 2022, 75, 1980–1992. [Google Scholar] [CrossRef]
- Au, W.Y.; Cheung, P.P.-H. Effectiveness of heterologous and homologous COVID-19 vaccine regimens: Living systematic review with network meta-analysis. Bmj 2022, 377, e069989. [Google Scholar] [CrossRef]
- Blasioli, E.; Mansouri, B.; Tamvada, S.S.; Hassini, E. Vaccine Allocation and Distribution: A Review with a Focus on Quantitative Methodologies and Application to Equity, Hesitancy, and COVID-19 Pandemic. In Operations Research Forum; Springer: Cham, Switzerland, 2023; p. 27. [Google Scholar]
- Alhandod, T.A.; Rabbani, S.I.; Almuqbil, M.; Alshehri, S.; Hussain, S.A.; Alomar, N.F.; Mir, M.A.; Asdaq, S.M.B. A systematic review on the safety and efficacy of COVID-19 vaccines approved in Saudi Arabia. Vaccines 2023, 11, 281. [Google Scholar] [CrossRef]
- Kashte, S.B.; Sharma, R.K.; Kadam, S. Profile of adverse events following COVID-19 vaccination: Insights from Covishield, Covaxin, and Corbevax beneficiaries in India. J. Krishna Inst. Med. Sci. (JKIMSU) 2023, 12, 86–96. [Google Scholar]
- Shahzad, M.W.; Al-Shabaan, A.; Mattar, A.; Salameh, B.; Alturaiki, E.M.; AlQarni, W.A.; AlHarbi, K.A.; Alhumaidany, T.M. Public satisfaction with COVID-19 vaccination program in Saudi Arabia. Patient Exp. J. 2022, 9, 154–163. [Google Scholar] [CrossRef]
- Sheerah, H.A.; Almuzaini, Y.; Khan, A. Public Health Challenges in Saudi Arabia during the COVID-19 Pandemic: A Literature Review. Healthcare 2023, 11, 1757. [Google Scholar] [CrossRef] [PubMed]
- Alhuzaimi, A.N.; Alrasheed, A.A.; Al-Eyadhy, A.; Aljamaan, F.; Alhasan, K.; Batais, M.A.; Jamal, A.; Alshahrani, F.S.; Alenezi, S.; Alhaboob, A. Exploring Determinants of COVID-19 Vaccine Acceptance, Uptake, and Hesitancy in the Pediatric Population: A Study of Parents and Caregivers in Saudi Arabia during the Initial Vaccination Phase. Healthcare 2023, 11, 972. [Google Scholar] [CrossRef] [PubMed]
- Hossain, M.K.; Hassanzadeganroudsari, M.; Feehan, J.; Apostolopoulos, V. The race for a COVID-19 vaccine: Where are we up to? Expert Rev. Vaccines 2022, 21, 355–376. [Google Scholar] [CrossRef] [PubMed]
- Alam, M.M.; Melhim, L.K.B.; Ahmad, M.T.; Jemmali, M. Public attitude towards COVID-19 vaccination: Validation of COVID-vaccination attitude scale (c-vas). J. Multidiscip. Healthc. 2022, 15, 941–954. [Google Scholar] [CrossRef] [PubMed]
- Dagla, I.; Iliou, A.; Benaki, D.; Gikas, E.; Mikros, E.; Bagratuni, T.; Kastritis, E.; Dimopoulos, M.A.; Terpos, E.; Tsarbopoulos, A. Plasma metabolomic alterations induced by COVID-19 vaccination reveal putative biomarkers reflecting the immune response. Cells 2022, 11, 1241. [Google Scholar] [CrossRef]
- Al-Kuraishy, H.M.; Al-Gareeb, A.I.; El-Bouseary, M.M.; Sonbol, F.I.; Batiha, G.E.-S. Hyperviscosity syndrome in COVID-19 and related vaccines: Exploring of uncertainties. Clin. Exp. Med. 2023, 23, 679–688. [Google Scholar] [CrossRef]
- Sanoudou, D.; Hill, M.A.; Belanger, M.J.; Arao, K.; Mantzoros, C.S. Obesity, metabolic phenotypes and COVID-19. Metabolism 2022, 128, 155121. [Google Scholar] [CrossRef]
- Sudhakar, M.; Winfred, S.B.; Meiyazhagan, G.; Venkatachalam, D.P. Mechanisms contributing to adverse outcomes of COVID-19 in obesity. Mol. Cell. Biochem. 2022, 477, 1155–1193. [Google Scholar] [CrossRef]
- Renata, R.-B.N.; Arely, G.-R.A.; Gabriela, L.-M.A.; Esther, M.-L.M. Immunomodulatory role of microelements in COVID-19 outcome: A relationship with nutritional status. Biol. Trace Elem. Res. 2023, 201, 1596–1614. [Google Scholar] [CrossRef] [PubMed]
- Westheim, A.J.; Bitorina, A.V.; Theys, J.; Shiri-Sverdlov, R. COVID-19 infection, progression, and vaccination: Focus on obesity and related metabolic disturbances. Obes. Rev. 2021, 22, e13313. [Google Scholar] [CrossRef] [PubMed]
- Wang, Y.; Wang, X.; Luu, L.D.W.; Chen, S.; Jin, F.; Wang, S.; Huang, X.; Wang, L.; Zhou, X.; Chen, X. Proteomic and metabolomic signatures associated with the immune response in healthy individuals immunized with an inactivated SARS-CoV-2 vaccine. Front. Immunol. 2022, 13, 848961. [Google Scholar] [CrossRef] [PubMed]
- Iddir, M.; Brito, A.; Dingeo, G.; Fernandez Del Campo, S.S.; Samouda, H.; La Frano, M.R.; Bohn, T. Strengthening the immune system and reducing inflammation and oxidative stress through diet and nutrition: Considerations during the COVID-19 crisis. Nutrients 2020, 12, 1562. [Google Scholar] [CrossRef] [PubMed]
- Painter, S.D.; Ovsyannikova, I.G.; Poland, G.A. The weight of obesity on the human immune response to vaccination. Vaccine 2015, 33, 4422–4429. [Google Scholar] [CrossRef]
- Al-Daghri, N.M.; Wani, K.; Khattak, M.N.; Alnaami, A.M.; Amer, O.E.; Aljohani, N.J.; Hameidi, A.; Alfawaz, H.; Alharbi, M.; Sabico, S. Cardiometabolic Effects of a 12-Month, COVID-19 Lockdown-Interrupted Lifestyle Education Program for Arab Adolescents. Front. Pediatr. 2022, 10, 887138. [Google Scholar] [CrossRef] [PubMed]
- Al-Daghri, N.M.; Amer, O.E.; Hameidi, A.; Alfawaz, H.; Alharbi, M.; Khattak, M.N.; Alnaami, A.M.; Aljohani, N.J.; Alkhaldi, G.; Wani, K. Effects of a 12-Month Hybrid (In-Person+ Virtual) Education Program in the Glycemic Status of Arab Youth. Nutrients 2022, 14, 1759. [Google Scholar] [CrossRef]
- Al-Daghri, N.M.; Amer, O.E.; Khattak, M.N.; Hussain, S.D.; Alkhaldi, G.; Alfawaz, H.A.; Elsaid, M.A.; Sabico, S. Attendance-Based Adherence and Outcomes of Obesity Management Program in Arab Adolescents. Children 2023, 10, 1449. [Google Scholar] [CrossRef]
- Al-Daghri, N.M.; Almiman, A.A.; Wani, K.; Khattak, M.N.; Aljohani, N.J.; Alfawaz, H.; Al-Hameidi, A.; Aldisi, D.; Alkhaldi, G.; Sabico, S. COVID-19 lockdown and lifestyle changes in Saudi adults with types 1 and 2 diabetes. Front. Public Health 2022, 10, 912816. [Google Scholar] [CrossRef]
- Alfawaz, H.A.; Wani, K.; Aljumah, A.A.; Aldisi, D.; Ansari, M.G.; Yakout, S.M.; Sabico, S.; Al-Daghri, N.M. Psychological well-being during COVID-19 lockdown: Insights from a Saudi State University’s Academic Community. J. King Saud Univ. Sci. 2021, 33, 101262. [Google Scholar] [CrossRef]
- Casas, I.; Mena, G. The COVID-19 vaccination. Med. Clin. 2021, 156, 500. [Google Scholar] [CrossRef] [PubMed]
- Sallam, M. COVID-19 vaccine hesitancy worldwide: A concise systematic review of vaccine acceptance rates. Vaccines 2021, 9, 160. [Google Scholar] [CrossRef] [PubMed]
- Magazzino, C.; Mele, M.; Coccia, M. A machine learning algorithm to analyse the effects of vaccination on COVID-19 mortality. Epidemiol. Infect. 2022, 150, e168. [Google Scholar] [CrossRef] [PubMed]
- Rahmani, K.; Shavaleh, R.; Forouhi, M.; Disfani, H.F.; Kamandi, M.; Oskooi, R.K.; Foogerdi, M.; Soltani, M.; Rahchamani, M.; Mohaddespour, M. The effectiveness of COVID-19 vaccines in reducing the incidence, hospitalization, and mortality from COVID-19: A systematic review and meta-analysis. Front. Public Health 2022, 10, 2738. [Google Scholar] [CrossRef] [PubMed]
- Esposito, M.; Cocimano, G.; Vanaria, F.; Sessa, F.; Salerno, M. Death from COVID-19 in a Fully Vaccinated Subject: A Complete Autopsy Report. Vaccines 2023, 11, 142. [Google Scholar] [CrossRef] [PubMed]
- Koster, K.J.; Webb, H.L.; Cirillo, J.D. COVID-19 and beyond: Exploring public Health benefits from non-specific effects of BCG vaccination. Microorganisms 2021, 9, 2120. [Google Scholar] [CrossRef] [PubMed]
- Mosaddeghi, P.; Shahabinezhad, F.; Dorvash, M.; Goodarzi, M.; Negahdaripour, M. Harnessing the non-specific immunogenic effects of available vaccines to combat COVID-19. Hum. Vaccines Immunother. 2021, 17, 1650–1661. [Google Scholar] [CrossRef]
- Watanabe, M.; Balena, A.; Masi, D.; Tozzi, R.; Risi, R.; Caputi, A.; Rossetti, R.; Spoltore, M.E.; Biagi, F.; Anastasi, E. Rapid weight loss, central obesity improvement and blood glucose reduction are associated with a stronger adaptive immune response following COVID-19 mRNA vaccine. Vaccines 2022, 10, 79. [Google Scholar] [CrossRef]
- Rubino, F.; Amiel, S.A.; Zimmet, P.; Alberti, G.; Bornstein, S.; Eckel, R.H.; Mingrone, G.; Boehm, B.; Cooper, M.E.; Chai, Z. New-onset diabetes in COVID-19. N. Engl. J. Med. 2020, 383, 789–790. [Google Scholar] [CrossRef]
- Care, D. Care in diabetes—2022. Diabetes Care 2022, 45, S17. [Google Scholar]
- Wan, E.Y.F.; Chui, C.S.L.; Mok, A.H.Y.; Xu, W.; Yan, V.K.C.; Lai, F.T.T.; Li, X.; Wong, C.K.H.; Chan, E.W.Y.; Lui, D.T.W. mRNA (BNT162b2) and Inactivated (CoronaVac) COVID-19 Vaccination and Risk of Adverse Events and Acute Diabetic Complications in Patients with Type 2 Diabetes Mellitus: A Population-Based Study. Drug Saf. 2022, 45, 1477–1490. [Google Scholar] [CrossRef] [PubMed]
- Xie, Y.; Xu, E.; Bowe, B.; Al-Aly, Z. Long-term cardiovascular outcomes of COVID-19. Nat. Med. 2022, 28, 583–590. [Google Scholar] [CrossRef]
- Iqbal, Z.; Ho, J.H.; Adam, S.; France, M.; Syed, A.; Neely, D.; Rees, A.; Khatib, R.; Cegla, J.; Byrne, C. Managing hyperlipidaemia in patients with COVID-19 and during its pandemic: An expert panel position statement from HEART UK. Atherosclerosis 2020, 313, 126–136. [Google Scholar] [CrossRef] [PubMed]
- Sabico, S.; Wani, K.; Grant, W.B.; Al-Daghri, N.M. Improved HDL Cholesterol through Vitamin D Status Correction Substantially Lowers 10-Year Atherosclerotic Cardiovascular Disease Risk Score in Vitamin D-Deficient Arab Adults. Nutrients 2023, 15, 551. [Google Scholar] [CrossRef] [PubMed]
- Wani, K.; AlHarthi, H.; Alghamdi, A.; Sabico, S.; Al-Daghri, N.M. Role of NLRP3 inflammasome activation in obesity-mediated metabolic disorders. Int. J. Environ. Res. Public Health 2021, 18, 511. [Google Scholar] [CrossRef]
- Ramasamy, M.N.; Minassian, A.M.; Ewer, K.J.; Flaxman, A.L.; Folegatti, P.M.; Owens, D.R.; Voysey, M.; Aley, P.K.; Angus, B.; Babbage, G. Safety and immunogenicity of ChAdOx1 nCoV-19 vaccine administered in a prime-boost regimen in young and old adults (COV002): A single-blind, randomised, controlled, phase 2/3 trial. Lancet 2020, 396, 1979–1993. [Google Scholar] [CrossRef]
- Thumser, A.E.; Moore, J.B.; Plant, N.J. Fatty acid binding proteins: Tissue-specific functions in health and disease. Curr. Opin. Clin. Nutr. Metab. Care 2014, 17, 124–129. [Google Scholar] [CrossRef] [PubMed]
- Catapano, A.L.; Pirillo, A.; Bonacina, F.; Norata, G.D. HDL in innate and adaptive immunity. Cardiovasc. Res. 2014, 103, 372–383. [Google Scholar] [CrossRef]
- Jeet Kaur, R.; Dutta, S.; Charan, J.; Bhardwaj, P.; Tandon, A.; Yadav, D.; Islam, S.; Haque, M. Cardiovascular adverse events reported from COVID-19 vaccines: A study based on WHO database. Int. J. Gen. Med. 2021, 14, 3909–3927. [Google Scholar] [CrossRef]
- Zappa, M.; Verdecchia, P.; Spanevello, A.; Visca, D.; Angeli, F. Blood pressure increase after Pfizer/BioNTech SARS-CoV-2 vaccine. Eur. J. Intern. Med. 2021, 90, 111–113. [Google Scholar] [CrossRef]
- Syrigos, N.; Kollias, A.; Grapsa, D.; Fyta, E.; Kyriakoulis, K.G.; Vathiotis, I.; Kotteas, E.; Syrigou, E. Significant Increase in Blood Pressure Following BNT162b2 mRNA COVID-19 Vaccination among Healthcare Workers: A Rare Event. Vaccines 2022, 10, 745. [Google Scholar] [CrossRef] [PubMed]
- McMahon, D.E.; Amerson, E.; Rosenbach, M.; Lipoff, J.B.; Moustafa, D.; Tyagi, A.; Desai, S.R.; French, L.E.; Lim, H.W.; Thiers, B.H. Cutaneous reactions reported after Moderna and Pfizer COVID-19 vaccination: A registry-based study of 414 cases. J. Am. Acad. Dermatol. 2021, 85, 46–55. [Google Scholar] [CrossRef] [PubMed]
- Wallace, M.; Moulia, D.; Blain, A.E.; Ricketts, E.K.; Minhaj, F.S.; Link-Gelles, R.; Curran, K.G.; Hadler, S.C.; Asif, A.; Godfrey, M. The Advisory Committee on Immunization Practices’ recommendation for use of Moderna COVID-19 vaccine in adults aged ≥18 years and considerations for extended intervals for administration of primary series doses of mRNA COVID-19 vaccines—United States, February 2022. Morb. Mortal. Wkly. Rep. 2022, 71, 416. [Google Scholar]
- Esposito, M.; Salerno, M.; Scoto, E.; Di Nunno, N.; Sessa, F. The impact of the COVID-19 pandemic on the practice of forensic medicine: An overview. Healthcare 2022, 10, 319. [Google Scholar] [CrossRef] [PubMed]
- Skowronski, D.M.; Setayeshgar, S.; Febriani, Y.; Ouakki, M.; Zou, M.; Talbot, D.; Prystajecky, N.; Tyson, J.R.; Gilca, R.; Brousseau, N. Two-dose SARS-CoV-2 vaccine effectiveness with mixed schedules and extended dosing intervals: Test-negative design studies from British Columbia and Quebec, Canada. MedRxiv 2021. MedRxiv 2021.2010.2026.21265397. [Google Scholar]
- Steenblock, C.; Schwarz, P.E.; Ludwig, B.; Linkermann, A.; Zimmet, P.; Kulebyakin, K.; Tkachuk, V.A.; Markov, A.G.; Lehnert, H.; De Angelis, M.H. COVID-19 and metabolic disease: Mechanisms and clinical management. Lancet Diabetes Endocrinol. 2021, 9, 786–798. [Google Scholar] [CrossRef] [PubMed]
- Moghadas, S.M.; Vilches, T.N.; Zhang, K.; Nourbakhsh, S.; Sah, P.; Fitzpatrick, M.C.; Galvani, A.P. Evaluation of COVID-19 vaccination strategies with a delayed second dose. PLoS Biol. 2021, 19, e3001211. [Google Scholar] [CrossRef] [PubMed]
- Sathish, T.; Tapp, R.J.; Cooper, M.E.; Zimmet, P. Potential metabolic and inflammatory pathways between COVID-19 and new-onset diabetes. Diabetes Metab. 2021, 47, 101204. [Google Scholar] [CrossRef]
- Wu, Q.; Zhou, L.; Sun, X.; Yan, Z.; Hu, C.; Wu, J.; Xu, L.; Li, X.; Liu, H.; Yin, P. Altered lipid metabolism in recovered SARS patients twelve years after infection. Sci. Rep. 2017, 7, 9110. [Google Scholar] [CrossRef]
- de Araújo, A.L.; da Silva Duarte, A.J.; Levin, A.S.; Guedes, B.F.; Kallas, E.G.; Pinna, F.R.; de Souza, H.P.; da Silva, K.R.; Sawamura, M.V.Y.; Seelaender, M. Post-acute sequelae of SARS-CoV-2 infection (PASC): A protocol for a multidisciplinary prospective observational evaluation of a cohort of patients surviving hospitalisation in Sao Paulo, Brazil. BMJ Open 2021, 11, e051706. [Google Scholar]
- Pawelec, G. Age and immunity: What is “immunosenescence”? Exp. Gerontol. 2018, 105, 4–9. [Google Scholar] [CrossRef] [PubMed]
- Akkaya, M.; Kwak, K.; Pierce, S.K. B cell memory: Building two walls of protection against pathogens. Nat. Rev. Immunol. 2020, 20, 229–238. [Google Scholar] [CrossRef] [PubMed]
- Shrotri, M.; Navaratnam, A.M.; Nguyen, V.; Byrne, T.; Geismar, C.; Fragaszy, E.; Beale, S.; Fong, W.L.E.; Patel, P.; Kovar, J. Spike-antibody waning after second dose of BNT162b2 or ChAdOx1. Lancet 2021, 398, 385–387. [Google Scholar] [CrossRef] [PubMed]
- Andrews, N.; Tessier, E.; Stowe, J.; Gower, C.; Kirsebom, F.; Simmons, R.; Gallagher, E.; Thelwall, S.; Groves, N.; Dabrera, G. Duration of protection against mild and severe disease by COVID-19 vaccines. N. Engl. J. Med. 2022, 386, 340–350. [Google Scholar] [CrossRef] [PubMed]
- Lee, Y.S.; Wollam, J.; Olefsky, J.M. An integrated view of immunometabolism. Cell 2018, 172, 22–40. [Google Scholar] [CrossRef] [PubMed]
- Mathis, D.; Shoelson, S.E. Immunometabolism: An emerging frontier. Nat. Rev. Immunol. 2011, 11, 81. [Google Scholar] [CrossRef] [PubMed]
- Berber, E.; Sumbria, D.; Kokkaya, S. A metabolic blueprint of COVID-19 and long-term vaccine efficacy. Drug Metab. Pers. Ther. 2022, 38, 15–29. [Google Scholar] [CrossRef]
- Hotamisligil, G.S. Inflammation and metabolic disorders. Nature 2006, 444, 860–867. [Google Scholar] [CrossRef]
- Donath, M.Y.; Shoelson, S.E. Type 2 diabetes as an inflammatory disease. Nat. Rev. Immunol. 2011, 11, 98–107. [Google Scholar] [CrossRef]
- Serhan, C.N. Resolution phase of inflammation: Novel endogenous anti-inflammatory and proresolving lipid mediators and pathways. Annu. Rev. Immunol. 2007, 25, 101–137. [Google Scholar] [CrossRef]
- Laupèze, B.; Del Giudice, G.; Doherty, M.T.; Van der Most, R. Vaccination as a preventative measure contributing to immune fitness. Npj Vaccines 2021, 6, 93. [Google Scholar] [CrossRef] [PubMed]
- Proto, M.C.; Fiore, D.; Piscopo, C.; Pagano, C.; Galgani, M.; Bruzzaniti, S.; Laezza, C.; Gazzerro, P.; Bifulco, M. Lipid homeostasis and mevalonate pathway in COVID-19: Basic concepts and potential therapeutic targets. Prog. Lipid Res. 2021, 82, 101099. [Google Scholar] [CrossRef] [PubMed]
- Brestoff, J.R.; Artis, D. Immune regulation of metabolic homeostasis in health and disease. Cell 2015, 161, 146–160. [Google Scholar] [CrossRef] [PubMed]
- Abumrad, N.A.; Davidson, N.O. Role of the gut in lipid homeostasis. Physiol. Rev. 2012, 92, 1061–1085. [Google Scholar] [CrossRef]
- Seong, H.; Choi, B.K.; Han, Y.-H.; Kim, J.H.; Gim, J.-A.; Lim, S.; Noh, J.Y.; Cheong, H.J.; Kim, W.J.; Song, J.Y. Gut microbiota as a potential key to modulating humoral immunogenicity of new platform COVID-19 vaccines. Signal Transduct. Target. Ther. 2023, 8, 178. [Google Scholar] [CrossRef]
- Wani, K.; Rahman, S.; Draz, H. The Gut Microbiome and its Impact on Metabolic Disorders. Front. Endocrinol. 2023, 14, 1265314. [Google Scholar] [CrossRef]


| All (n = 318) | Adolescents (132) | 1st to 2nd Dose Interval | Time since the Final Dose | |||||
|---|---|---|---|---|---|---|---|---|
| ≤8 Weeks (95) | >8 Weeks (37) | p-Value | ≤6 Months (36) | >6 Months (96) | p-Value | |||
| 1st to 2nd dose (months) | 2.89 ± 2.5 | 2.23 ± 2.1 | 1.13 ± 0.4 | 5.05 ± 2.2 | <0.001 | 2.39 ± 2.6 | 2.17 ± 1.9 | 0.60 |
| Time to final dose (months) | 6.04 ± 2.9 | 7.4 ± 1.8 | 7.4 ± 1.8 | 7.5 ± 1.8 | 0.63 | 4.8 ± 0.9 | 8.4 ± 0.8 | <0.001 |
| COVID 19 (1st dose) | ||||||||
| Pfizer-BioNtech | 295 (92.8) | 130 (98.5) | 95 (0.0) | 35 (94.6) | 0.02 | 36 (100.0) | 94 (97.9) | 0.38 |
| AstraZeneca | 23 (7.2) | 2 (1.5) | 0 (0.0) | 2 (5.4) | 0 (0.0) | 2 (2.1) | ||
| Moderna | 0 (0.0) | 0 (0.0) | 0 (0.0) | 0 (0.0) | 0 (0.0) | 0 (0.0) | ||
| COVID 19 (2nd dose) | ||||||||
| Pfizer-BioNtech | 292 (91.8) | 128 (97.0) | 92 (96.8) | 36 (97.3) | 0.89 | 36 (100.0) | 92 (95.8) | 0.21 |
| AstraZeneca | 21 (6.6) | 0 (0.0) | 0 (0.0) | 0 (0.0) | 0 (0.0) | 0 (0.0) | ||
| Moderna | 5 (1.6) | 4 (3.0) | 3 (3.2) | 1 (2.7) | 0 (0.0) | 4 (4.2) | ||
| COVID-19 (Booster dose) | ||||||||
| Pfizer-BioNtech | 84 (26.4) | 30 (22.7) | 21 (22.1) | 9 (24.3) | 0.16 | 14 (38.9) | 16 (16.7) | 0.26 |
| AstraZeneca | 1 (0.3) | 0 (0.0) | 0 (0.0) | 0 (0.0) | 0 (0.0) | 0 (0.0) | ||
| Moderna | 42 (13.2) | 5 (4.5) | 5 (5.3) | 0 (0.0) | 1 (2.8) | 4 (4.2) | ||
| Infected with COVID-19 | ||||||||
| n | 31 (9.7) | 10 (7.6) | 5 (5.3) | 5 (13.5) | 0.11 | 3 (8.3) | 7 (7.3) | 0.84 |
| After both doses a | 7 (22.6) | 0 (0.0) | 0 (0.0) | 0 (0.0) | - | 0 (0.0) | 0 (0.0) | - |
| Between doses a | 17 (54.8) | 10 (100.0) | 5 (100.0) | 5 (100.0) | 3 (100.0) | 7 (100.0) | ||
| Before dose 1 a | 7 (22.6) | 0 (0.0) | 0 (0.0) | 0 (0.0) | 0 (0.0) | 0 (0.0) | ||
| Clinical characteristics | ||||||||
| Sex (Females) | 190 (59.7) | 59 (44.7) | 43 (45.3) | 16 (43.2) | 0.83 | 17 (47.2) | 42 (43.8) | 0.72 |
| Age (Years) | 28 ± 13.6 | 15.0 ± 1.2 | 15.0 ± 1.2 | 15.1 ± 1.0 | 0.59 | 15.2 ± 1.3 | 14.9 ± 1.1 | 0.29 |
| Weight (Kg) | 65.0 ± 17.9 | 55.4 ± 17.2 | 55.3 ± 17.4 | 55.7 ± 16.8 | 0.89 | 59.2 ± 16 | 53.9 ± 17.4 | 0.12 |
| BMI (Kg/m2) | 25.5 ± 6.1 | 22.7 ± 6.4 | 22.4 ± 6.5 | 23.4 ± 6.1 | 0.43 | 23.7 ± 6.2 | 22.3 ± 6.5 | 0.27 |
| Overweight or obese | 152 (47.8) | 37 (28.1) | 24 (25.3) | 13 (35.1) | 0.23 | 11 (30.5) | 26 (27.1) | 0.87 |
| Waist (cm) | 80.1 ± 13.8 | 74.2 ± 12.7 | 74.4 ± 12.2 | 73.7 ± 14.1 | 0.76 | 74.2 ± 10.7 | 74.2 ± 13.4 | 0.99 |
| Hips (cm) | 96.5 ± 14.9 | 87.79 ± 14.2 | 87.9 ± 13.8 | 87.6 ± 15.3 | 0.91 | 90.7 ± 11.1 | 86.7 ± 15.1 | 0.16 |
| Systolic BP (mmHG) | 119.4 ± 18 | 115.8 ± 17 | 115.8 ± 18 | 115.6 ± 16 | 0.95 | 122 ± 15.1 | 113.5 ± 18 | 0.01 |
| Diastolic BP (mm HG) | 73.3 ± 13.2 | 70.12 ± 14.2 | 69.8 ± 15.7 | 70.8 ± 9.5 | 0.73 | 73.6 ± 17.5 | 68.8 ± 12.7 | 0.09 |
| Biochemical characteristics | ||||||||
| Total cholesterol (mmol/L) | 4.8 ± 1 | 4.3 ± 0.8 | 4.4 ± 0.7 | 4.3 ± 0.9 | 0.52 | 4.2 ± 0.6 | 4.4 ± 0.8 | 0.17 |
| Fasting glucose (mmol/L) | 5.4 ± 1.2 | 5.4 ± 1.1 | 5.4 ± 1.2 | 5.3 ± 0.9 | 0.75 | 5.3 ± 0.9 | 5.4 ± 1.2 | 0.69 |
| HbA1c | 5.2 ± 0.7 | 5.1 ± 0.7 | 5.1 ± 0.7 | 5.2 ± 0.6 | 0.96 | 5.2 ± 0.5 | 5.1 ± 0.7 | 0.64 |
| HDL-Cholesterol (mmol/L) | 1.0 ± 0.2 | 1 (0.9,1.1) | 0.99 ± 0.2 | 1.0 ± 0.2 | 0.17 | 0.99 ± 0.2 | 1.01 ± 0.2 | 0.50 |
| Triglycerides (mmol/L) | 1.1 (0.8,1.5) | 0.95 (0.7,1) | 0.9(0.7,1) | 0.98 (0.7,1) | 0.67 | 0.9 (0.7,1) | 0.95 (0.7,1) | 0.68 |
| 25(OH) D (nmol/L) | 30.6 (23.6,44) | 29.5 (22.9,37) | 30 (23,39) | 28.4 (23,32) | 0.34 | 29.8 (22,35) | 29 (23,38) | 0.73 |
| All Subjects (n = 318) | Adults (186) | 1st to 2nd Dose Interval | Time since the Final Dose | |||||
|---|---|---|---|---|---|---|---|---|
| ≤8 Weeks (70) | >8 Weeks (116) | p-Value | ≤6 Months (118) | >6 Months (68) | p-Value | |||
| 1st to 2nd dose (months) | 2.9 ± 2.5 | 3.36 ± 2.5 | 1.06 ± 0.5 | 4.75 ± 2.3 | <0.001 | 3.62 ± 2.7 | 2.91 ± 2.2 | 0.07 |
| Time to final dose (months) | 6.04 ± 2.9 | 5.07 ± 3.1 | 5.4 ± 3.5 | 4.87 ± 2.8 | 0.26 | 3.11 ± 1.7 | 8.47 ± 1.7 | <0.001 |
| COVID 19 (1st dose) | ||||||||
| Pfizer-BioNtech | 295 (92.8) | 165 (88.7) | 63 (90.0) | 102 (87.9) | 0.67 | 104 (88.1) | 61 (89.7) | 0.74 |
| AstraZeneca | 23 (7.2) | 21 (11.3) | 7 (10.0) | 14 (12.1) | 14 (11.9) | 7 (10.3) | ||
| Moderna | 0 (0.0) | 0 (0.0) | 0 (0.0) | 0 (0.0) | 0 (0.0) | 0 (0.0) | ||
| COVID 19 (2nd dose) | ||||||||
| Pfizer-BioNtech | 292 (91.8) | 164 (88.2) | 63 (90.0) | 101 (87.1) | 0.67 | 104 (88.1) | 60 (88.2) | 0.74 |
| AstraZeneca | 21 (6.6) | 21 (11.3) | 7 (10.0) | 14 (12.1) | 13 (11.0) | 8 (11.8) | ||
| Moderna | 5 (1.6) | 1 (0.5) | 0 (0.0) | 1 (0.9) | 1 (0.8) | 0 (0.0) | ||
| COVID-19 (Booster dose) | ||||||||
| Pfizer-BioNtech | 84 (26.4) | 54 (29.0) | 23 (32.9) | 31 (26.7) | 0.56 | 41 (34.7) | 13 (19.1) | 0.85 |
| AstraZeneca | 1 (0.3) | 1 (0.5) | 0 (0.0) | 1 (0.9) | 1 (0.8) | 0 (0.0) | ||
| Moderna | 42 (13.2) | 37 (19.9) | 13 (18.6) | 24 (20.7) | 28 (23.7) | 9 (13.2) | ||
| Infected with COVID-19 | ||||||||
| n | 31 (9.7) | 21 (14.4) | 7 (14.3) | 14 (14.4) | 0.98 | 14 (13.5) | 7 (16.7) | 0.62 |
| After both doses a | 7 (22.6) | 7 (33.3) | 3 (42.9) | 4 (28.6) | 0.42 | 6 (42.9) | 1 (14.3) | 0.42 |
| Between doses a | 17 (54.8) | 7 (33.3) | 1 (14.3) | 6 (42.9) | 4 (28.6) | 3 (42.9) | ||
| Before dose 1 a | 7 (22.6) | 7 (33.3) | 3 (42.9) | 4 (28.6) | 4 (28.6) | 3 (42.9) | ||
| Clinical characteristics | ||||||||
| Sex (Females) | 190 (59.7) | 131 (70.4) | 48 (68.6) | 83 (71.6) | 0.67 | 84 (71.2) | 47 (69.1) | 0.77 |
| Age (Years) | 28 ± 13.6 | 37.23 ± 10.5 | 36.77 ± 10.6 | 37.51 ± 10.4 | 0.64 | 38.08 ± 10 | 35.76 ± 11.2 | 0.15 |
| Weight (Kg) | 65.0 ± 17.9 | 71.8 ± 15 | 71.9 ± 16.8 | 71.8 ± 13.9 | 0.98 | 72 ± 14.4 | 71.6 ± 16.1 | 0.87 |
| BMI (Kg/m2) | 25.5 ± 6.1 | 27.49 ± 5.1 | 27.69 ± 5.5 | 27.37 ± 4.8 | 0.68 | 27.52 ± 5 | 27.45 ± 5.2 | 0.93 |
| Overweight or obese | 152 (47.8) | 115 (61.8) | 41 (58.6) | 74 (63.7) | 0.28 | 72 (61.0) | 43 (63.3) | 0.34 |
| Waist (cm) | 80.1 ± 13.8 | 84.2 ± 13 | 84.5 ± 13.7 | 84.1 ± 12.6 | 0.85 | 84.8 ± 12.9 | 83.3 ± 13.2 | 0.46 |
| Hips (cm) | 96.5 ± 14.9 | 102.7 ± 12 | 102 ± 13.1 | 103 ± 11.4 | 0.70 | 103 ± 11.6 | 101 ± 12.7 | 0.27 |
| Systolic BP (mmHG) | 119 ± 18.1 | 122 ± 18.3 | 121 ± 15.2 | 122 ± 20 | 0.94 | 121 ± 16.4 | 124 ± 21.1 | 0.17 |
| Diastolic BP (mm HG) | 73.1 ± 13.2 | 75.6 ± 12 | 74.4 ± 10.6 | 76.2 ± 12.7 | 0.32 | 76 ± 12.9 | 75 ± 10.1 | 0.55 |
| Biochemical characteristics | ||||||||
| Total cholesterol (mmol/L) | 4.8 ± 1 | 5.2 ± 1 | 5.1 ± 1.2 | 5.2 ± 0.9 | 0.45 | 5.1 ± 1 | 5.2 ± 1.1 | 0.77 |
| Fasting glucose (mmol/L) | 5.4 ± 1.2 | 5.4 ± 1.2 | 5.3 ± 1.1 | 5.5 ± 1.3 | 0.18 | 5.5 ± 1.3 | 5.3 ± 1 | 0.33 |
| HbA1c | 5.2 ± 0.7 | 5.2 ± 0.8 | 5.2 ± 0.6 | 5.2 ± 0.8 | 0.74 | 5.2 ± 0.8 | 5.13 ± 0.7 | 0.51 |
| HDL-Cholesterol (mmol/L) | 1.0 ± 0.2 | 1 (0.9,1.1) | 1.02 ± 0.2 | 1.0 ± 0.2 | 0.76 | 0.99 ± 0.2 | 1.0 ± 0.2 | 0.19 |
| Triglycerides (mmol/L) | 1.1 (0.8,1.5) | 1.2 (0.9,1.7) | 1.2 (0.9,2) | 1.2 (1,1.9) | 0.36 | 1.2 (0.9,2) | 1.18 (1,1.7) | 0.83 |
| 25(OH) D (nmol/L) | 31 (23.6,43.5) | 32.7 (24,47) | 32 (23,52) | 34 (24,45) | 0.67 | 34.4 (24,48) | 32 (23,44) | 0.40 |
| Changes in 1st to 2nd Dose Interval | Changes in the Time since the Final Dose | |||||||
|---|---|---|---|---|---|---|---|---|
| ≤8 Weeks | >8 Weeks | Difference Change (95% CI) | p | ≤6 Months | >6 Months | Difference Change (95% CI) | p | |
| Adolescents | ||||||||
| Weight (Kg) | 11.5 | 6.99 | 4.5 (−1.3,10) | 0.13 | 9.1 | 10.67 | −1.6 (−7.5,4) | 0.60 |
| BMI (Kg/m2) | 4.83 | 3.15 | 1.7 (−0.7,4) | 0.17 | 3.78 | 4.57 | −0.8 (−3.2,1.6) | 0.52 |
| Waist (cm) | 6.24 | 4.75 | 1.5 (−4.1,7) | 0.60 | 7.60 | 5.16 | 2.4 (−3.2,8.1) | 0.39 |
| Hips (cm) | 8.57 | 7.09 | 1.5 (−3.7,7) | 0.57 | 6.11 | 8.92 | −2.8 (−8.0,2.4) | 0.28 |
| Systolic BP (mmHG) | 5.18 | 0.78 | 4.4 (−2.5,11) | 0.21 | −3.50 | 6.74 | −10.2 (−17,−3.4) | 0.003 |
| Diastolic BP (mm HG) | 3.14 | 3.03 | 0.1 (−5.5,6) | 0.97 | −2.64 | 5.26 | −7.9 (−13,−2.4) | 0.005 |
| Total Chol (mmol/L) | 0.09 | −0.08 | 0.2 (−0.1,0.5) | 0.29 | 0.12 | −0.06 | 0.2 (0.1,0.5) | 0.05 |
| Fasting glucose (mmol/L) | −0.02 | −0.04 | 0.02 (−0.3,0.3) | 0.92 | −0.13 | 0.00 | −0.14 (−0.5,0.2) | 0.41 |
| HbA1c | −0.07 | −0.11 | 0.04 (−0.3,0.4) | 0.81 | −0.24 | −0.03 | −0.21 (−0.5,0.1) | 0.21 |
| HDL-Chol (mmol/L) | 0.27 | 0.13 | 0.14 (0.0,0.3) | 0.11 | 0.29 | 0.21 | 0.09 (−0.1,0.3) | 0.30 |
| Triglycerides (mmol/L) | 0.75 | 0.67 | −0.11 (−0.4,0.2) | 0.48 | 0.57 | 0.75 | −0.16 (−0.5,0.2) | 0.34 |
| 25(OH)D (nmol/L) | 7.20 | 10.1 | −4.96 (−15.5,5.6) | 0.42 | 10.05 | 7.47 | −2.7 (−13.3,8.0) | 0.62 |
| Adults | ||||||||
| Weight (Kg) | 2.46 | 0.96 | 1.49 (−1.2,4.2) | 0.27 | 1.70 | 1.22 | 0.47 (−2.2,3.2) | 0.73 |
| BMI (Kg/m2) | 0.97 | 0.40 | 0.57 (−0.4,1.6) | 0.27 | 0.66 | 0.51 | 0.15 (−0.9,1.2) | 0.77 |
| Waist (cm) | −3.17 | −3.94 | 0.77 (−3.4,4.9) | 0.71 | −3.57 | −3.78 | 0.22 (−3.9,4.4) | 0.92 |
| Hips (cm) | −4.81 | −8.28 | 3.48 (−1.2,8.2) | 0.14 | −7.42 | −6.18 | −1.24 (−6.0,3.5) | 0.61 |
| Systolic BP (mmHG) | −9.76 | −8.03 | −1.73 (−7.9,4.5) | 0.58 | −7.53 | −10.67 | 3.13 (−3.1,9.3) | 0.32 |
| Diastolic BP (mm HG) | −2.64 | −2.76 | 0.12 (−3.8,4.1) | 0.95 | −3.4 | −1.53 | −1.87 (−5.8,2.1) | 0.35 |
| Total Chol (mmol/L) | 0.33 | 0.28 | 0.04 (−0.3,0.4) | 0.79 | 0.36 | 0.22 | 0.13 (−0.2,0.5) | 0.40 |
| Fasting glucose (mmol/L) | −0.13 | −0.07 | −0.06 (−0.7,0.5) | 0.84 | −0.21 | 0.12 | −0.33 (−0.9,0.3) | 0.28 |
| HbA1c | 0.20 | 0.36 | −0.16 (−0.5,0.2) | 0.35 | 0.35 | 0.21 | 0.13 (−0.2,0.5) | 0.44 |
| HDL-Chol (mmol/L) | 0.38 | 0.42 | −0.04 (−0.2,0.1) | 0.60 | 0.45 | 0.35 | 0.1 (0.0,0.2) | 0.17 |
| Triglycerides (mmol/L) | −0.10 | −0.01 | 0.01 (−0.2,0.2) | 0.95 | −0.11 | 0.14 | −0.4 (−0.6,−0.1) | 0.003 |
| 25(OH)D D (nmol/L) | −4.27 | 12.48 | −9.23 (−24,5.6) | 0.21 | 6.75 | 0.35 | 0.03 (−15.6,16) | 1.0 |
| Mets Components | Pre- Vaccine | Post- Vaccine | Differences in % from Pre- to Post-Vaccine Visits | Odds Ratio, 95% Confidence Interval, p | ||||||
|---|---|---|---|---|---|---|---|---|---|---|
| All | 1st to 2nd Dose (Weeks) | Time to Final Dose (Months) | ||||||||
| ≤8 | >8 | ≤6 | >6 | Parameters | ≤8 vs. >8 Weeks | ≤6 vs. >6 Months | ||||
| Adolescents | ||||||||||
| Central Obesity | 7 (5.3) | 24 (18.2) | 12.9 | 13.6 | 10.9 | 13.8 | 12.5 | Waist circumference1 | 1.00, (0.9,1.0), 0.597 | 1.01, (0.9,1.0), 0.393 |
| Hyperglycemia | 12 (9.1) | 17 (12.9) | 3.8 | 0.0 | 13.5 | 0.0 | 5.2 | Fasting glucose1 | 1.02, (0.7,1.6), 0.919 | 0.83, (0.5,1.3), 0.407 |
| Low HDL | 82 (62.1) | 53 (40.2) | −21.9 | −25.3 | −13.6 | −20.6 | −14.5 | HDL-Cholesterol1 | 2.09, (0.8,5.2), 0.113 | 1.59, (0.7,3.8), 0.294 |
| High Triglycerides | 26 (19.7) | 85 (64.4) | 44.7 | 47.4 | 37.9 | 30.6 | 50.0 | Triglycerides1 | 0.85, (0.5,0.29), 0.479 | 0.79, (0.5,1.3), 0.338 |
| Hypertension | 30 (22.7) | 28 (21.2) | −1.5 | −5.3 | 8.1 | −16.7 | 4.2 | Systolic BP1 | 1.01, (0.9,1.0), 0.213 | 0.97, (0.94,1.00), 0.056 a |
| Diastolic BP1 | 1.00, (0.9,1.0), 0.969 | 0.96, (0.93,1.00), 0.062 a | ||||||||
| Mets | 11 (8.3) | 22 (16.7) | 8.4 | 4.2 | 18.9 | 0.0 | 11.4 | - | - | - |
| MetS comp. | 1.19 ± 1.0 | 1.57 ± 1.0 | 0.38 | 0.31 | 0.57 | −0.14 | 0.58 | MetS components1 | 0.83, (0.6,1.2), 0.268 | 0.63, (0.44,0.89), 0.011 a |
| Adults | ||||||||||
| Central Obesity | 46 (24.7) | 39 (21.0) | −3.7 | 1.4 | −6.9 | −5.9 | 0.0 | Waist circumference1 | 1.00, (0.9,1.0), 0.712 | 1.00, (0.9,1.0), 0.918 |
| Hyperglycemia | 47 (25.3) | 35 (18.8) | −6.5 | −7.2 | −6.0 | −10.2 | 0.0 | Fasting glucose1 | 0.99, (0.8,1.1), 0.839 | 0.92, (0.8,1.1), 0.282 |
| Low HDL | 147 (79.0) | 55 (29.6) | −49.4 | −47.1 | −50.8 | −55.1 | −39.7 | HDL-Cholesterol1 | 0.84, (0.4,1.6), 0.601 | 1.59, (0.8,3.0), 0.168 |
| High Triglycerides | 48 (25.8) | 41 (22.0) | −3.8 | −4.3 | −3.5 | −11.9 | 10.3 | Triglycerides1 | 1.01, (0.7,1.5), 0.951 | 0.39, (0.2,0.7), <0.001 a |
| Hypertension | 54 (29.0) | 14 (7.5) | −21.5 | −21.4 | −21.5 | −22.9 | −19.2 | Systolic BP1 | 0.99, (0.9,1.0), 0.581 | 1.01, (0.9,1.0), 0.323 |
| Diastolic BP1 | 1.00, (0.9,1.0), 0.953 | 0.99, (0.9,1.0), 0.351 | ||||||||
| MetS | 48 (25.8) | 21 (11.3) | −14.5 | −12.8 | −15.5 | −16.1 | −11.8 | - | - | - |
| MetS comp. | 1.84 ± 1.2 | 0.99 ± 1.1 | −0.85 | −0.79 | −0.89 | −1.06 | −0.49 | MetS components1 | 1.06, (0.9,1.3), 0.627 | 0.60, (0.43,0.82), 0.001 a |
Disclaimer/Publisher’s Note: The statements, opinions and data contained in all publications are solely those of the individual author(s) and contributor(s) and not of MDPI and/or the editor(s). MDPI and/or the editor(s) disclaim responsibility for any injury to people or property resulting from any ideas, methods, instructions or products referred to in the content. |
© 2023 by the authors. Licensee MDPI, Basel, Switzerland. This article is an open access article distributed under the terms and conditions of the Creative Commons Attribution (CC BY) license (https://creativecommons.org/licenses/by/4.0/).
Share and Cite
Alghamdi, A.; Wani, K.; Alnaami, A.M.; Al-Daghri, N.M. Dose Intervals and Time since Final Dose on Changes in Metabolic Indices after COVID-19 Vaccination. Vaccines 2023, 11, 1746. https://doi.org/10.3390/vaccines11121746
Alghamdi A, Wani K, Alnaami AM, Al-Daghri NM. Dose Intervals and Time since Final Dose on Changes in Metabolic Indices after COVID-19 Vaccination. Vaccines. 2023; 11(12):1746. https://doi.org/10.3390/vaccines11121746
Chicago/Turabian StyleAlghamdi, Amani, Kaiser Wani, Abdullah M. Alnaami, and Nasser M. Al-Daghri. 2023. "Dose Intervals and Time since Final Dose on Changes in Metabolic Indices after COVID-19 Vaccination" Vaccines 11, no. 12: 1746. https://doi.org/10.3390/vaccines11121746
APA StyleAlghamdi, A., Wani, K., Alnaami, A. M., & Al-Daghri, N. M. (2023). Dose Intervals and Time since Final Dose on Changes in Metabolic Indices after COVID-19 Vaccination. Vaccines, 11(12), 1746. https://doi.org/10.3390/vaccines11121746