

Safety, Efficacy, and Ill Intent: Examining COVID-19 Vaccine Perceptions among the New Undervaccinated Moveable Middle in a U.S. Cohort, October 2022
 ,
,
Abstract
:1. Introduction
2. Materials and Methods
2.1. Participants
2.2. COVID-19 Vaccination Status and Vaccine Perceptions and Motivations
2.3. Household Vaccination Status and Trusted Vaccine Information Sources
2.4. Symptoms of Anxiety or Depression
2.5. Sociodemographic Characteristics
2.6. Statistical Analysis
3. Results
3.1. Participant Characteristics Associated with Being Undervaccinated
3.2. COVID-19 Booster Motivations
3.3. COVID-19 Vaccine Concerns Subscales
3.3.1. Efficacy Concerns
3.3.2. Safety Concerns
3.3.3. Concerns about Ill Intent
4. Discussion
Author Contributions
Funding
Institutional Review Board Statement
Informed Consent Statement
Data Availability Statement
Acknowledgments
Conflicts of Interest
Appendix A. Survey Items, Additional Figures and Tables
- Survey items
- 1.
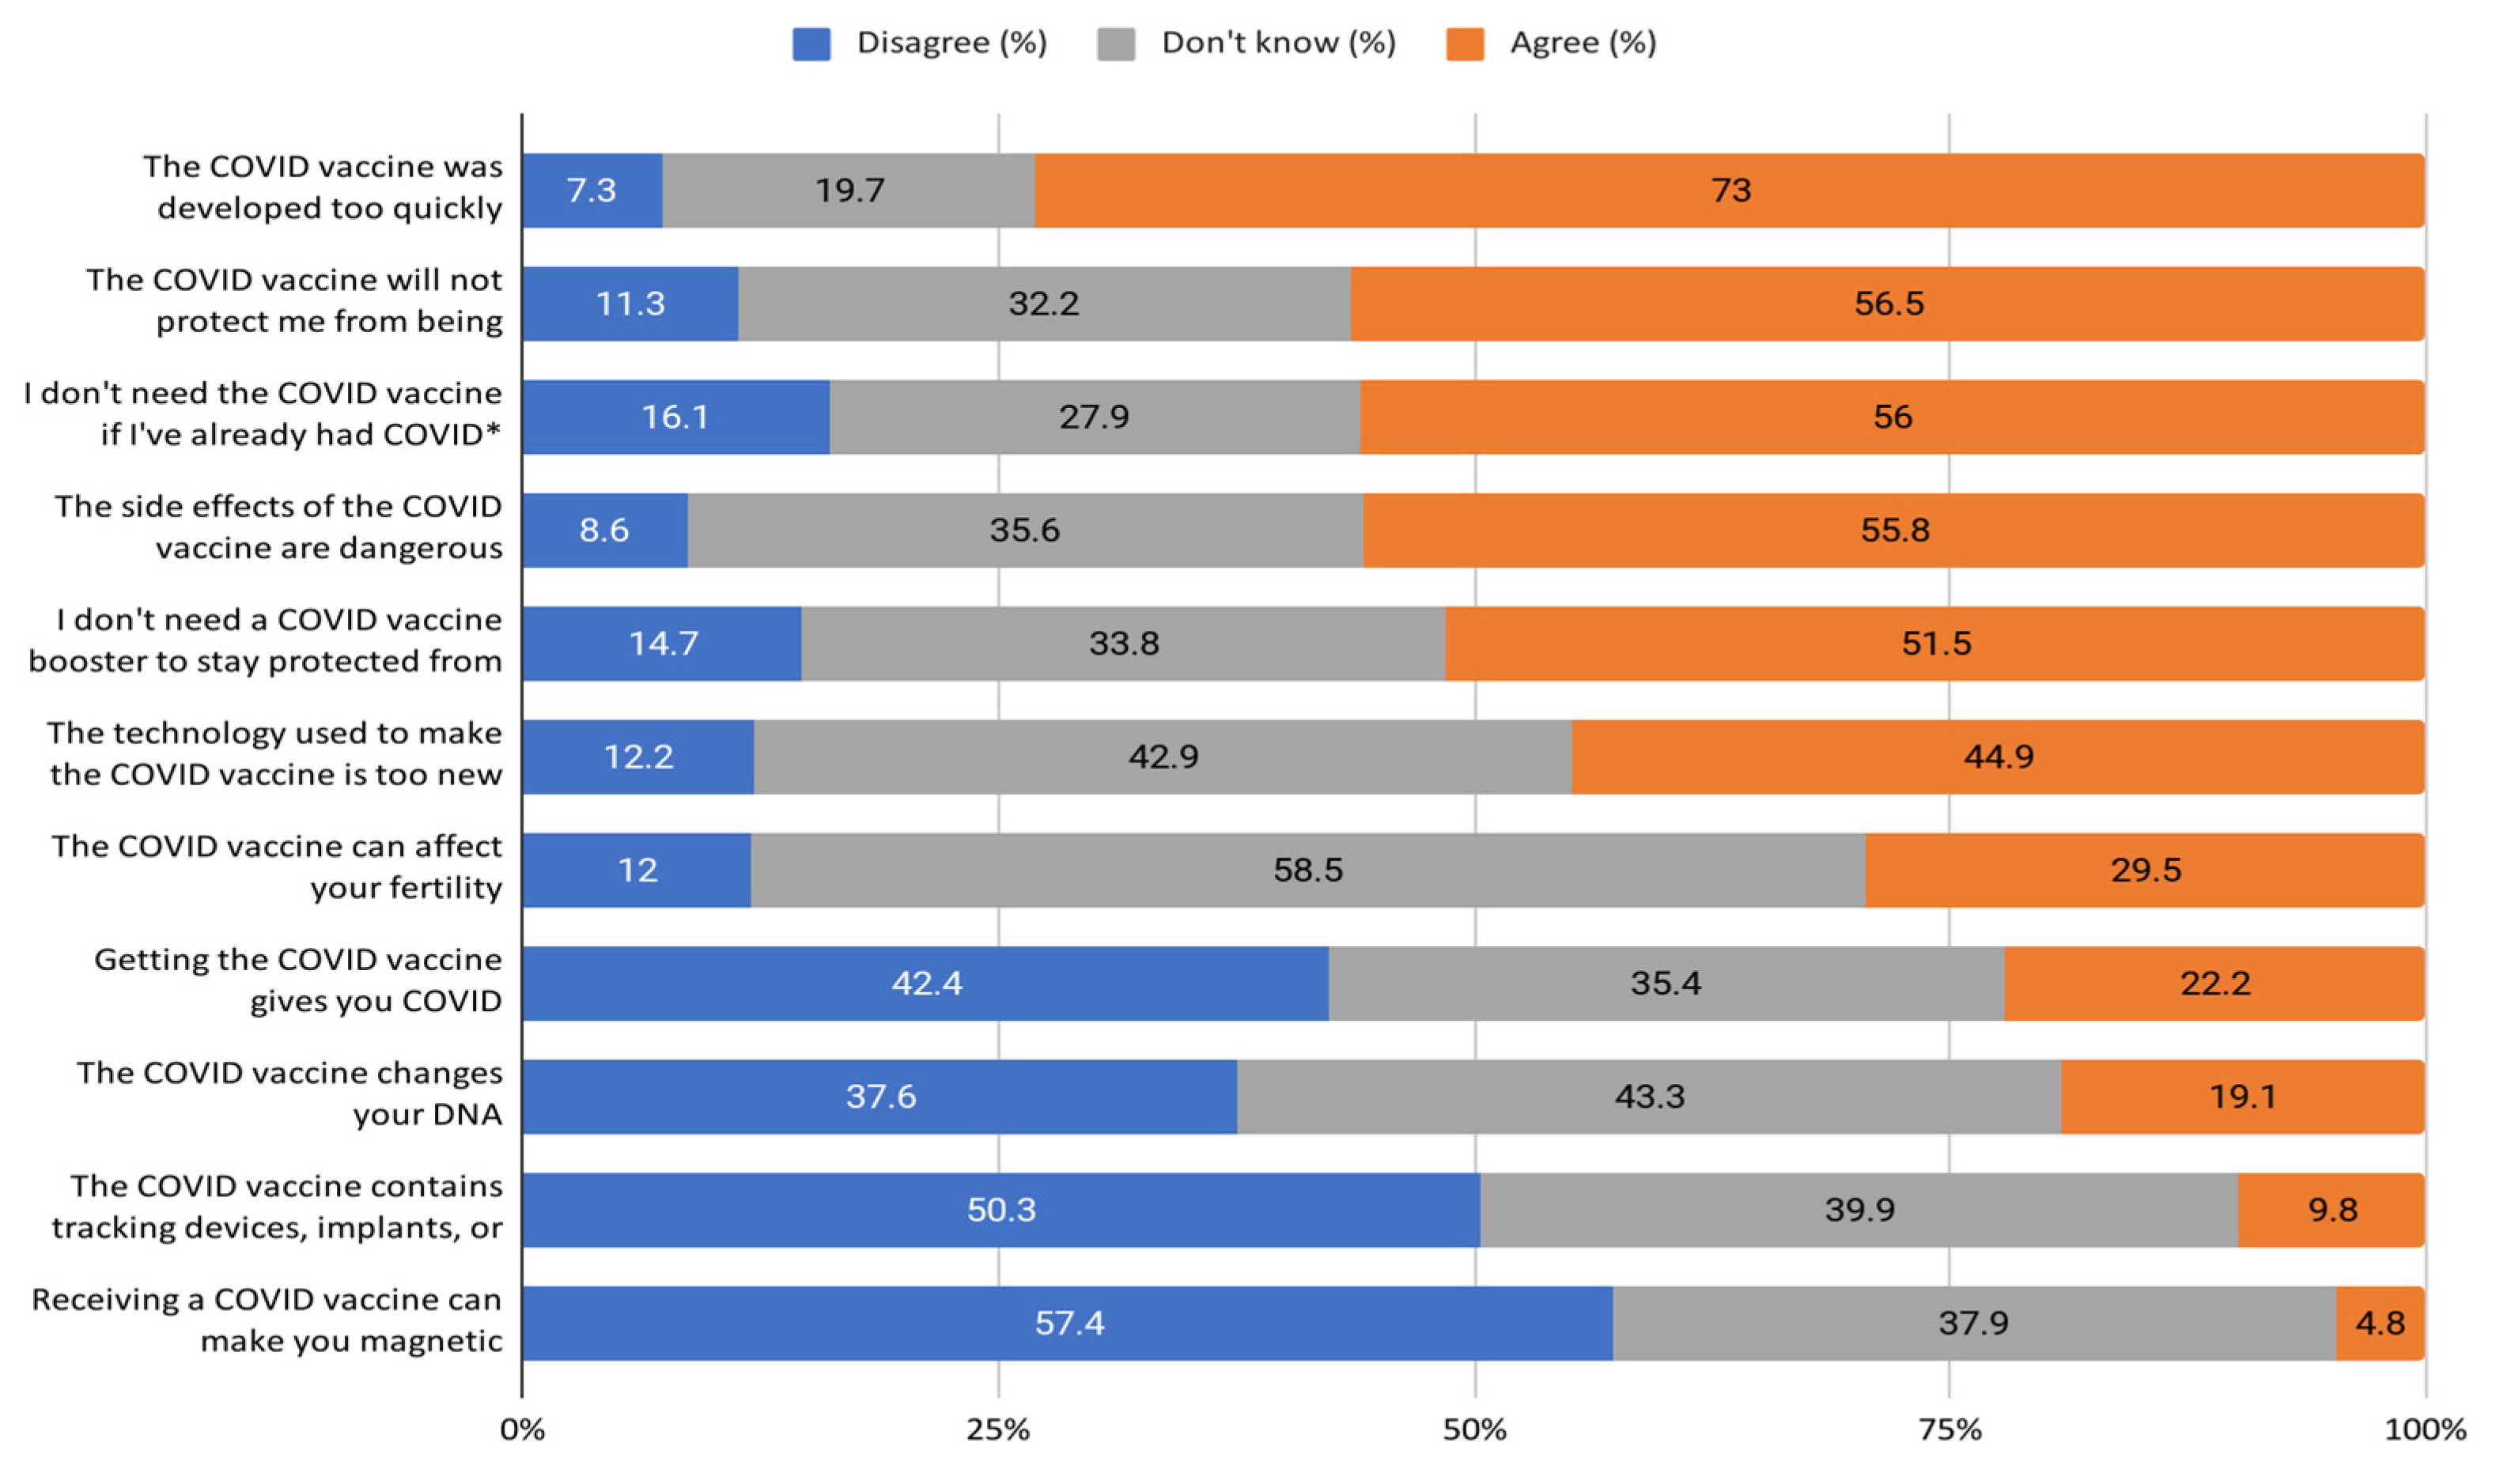
- Do you agree with the following claims about the COVID vaccine?

| Agree | Disagree | Don’t Know | |
|---|---|---|---|
| The COVID vaccine can affect your fertility. | |||
| I need the COVID vaccine, even if I’ve already had COVID. | |||
| The COVID vaccine was developed too quickly. | |||
| The COVID vaccine will protect me from being hospitalized with COVID. | |||
| Getting the COVID vaccine gives you COVID. | |||
| The side effects of the COVID vaccine are dangerous. | |||
| The COVID vaccine changes your DNA. | |||
| I need a COVID vaccine booster to stay protected from severe COVID disease. | |||
| The technology used to make the COVID vaccine is too new to be safe. | |||
| The COVID vaccine contains tracking devices, implants, or microchips. | |||
| Receiving a COVID vaccine can make you magnetic. |
- 2.
- Which of the following influenced your decision not to get a vaccine? Please select all that apply.
- (a)
- Short-term side effects
- (b)
- Long-term side effects
- (c)
- Vaccine effectiveness
- (d)
- Whether other people I know also get it
- (e)
- I think that other people should get it before me
- (f)
- I need more information about the vaccine
- (g)
- I already had COVID
- (h)
- I don’t think I am at risk of getting COVID
- (i)
- I have a medical condition that prevents me from getting vaccinated
- (j)
- Issues with accessing a vaccine at a time that works for me
- (k)
- Issues with accessing a specific vaccine versus the one that is available
- (l)
- Lack of FDA approval (Johnson & Johnson vaccine)
- (m)
- Other _____________
- (n)
- None of the above
- 3.
- Since your last survey, which of the following has influenced your decision not to get a booster? Please select all that apply.
- (a)
- I don’t believe I need an additional booster dose
- (b)
- There is not enough evidence that the booster dose is effective
- (c)
- I’m not yet eligible for the booster dose
- (d)
- I’m not sure if I’m eligible for the booster dose
- (e)
- Short-term side effects
- (f)
- Long-term side effects
- (g)
- Whether other people I know also get it
- (h)
- I think that other people should get it before me
- (i)
- I need more information about the booster dose
- (j)
- I already had COVID
- (k)
- I recently had COVID
- (l)
- I don’t think I am at risk of getting COVID
- (m)
- I have a medical condition that prevents me from getting boosted
- (n)
- Issues with accessing a booster dose at a time (or venue) that works for me
- (o)
- Issues with accessing a specific vaccine booster dose versus the one that is available
- (p)
- Lack of full FDA approval (Johnson & Johnson vaccine)
- (q)
- I plan to get a booster, but I haven’t had time yet
- (r)
- I’m worried that there will be fees or other costs if I get the booster
- (s)
- I’m scared of needles
- (t)
- Other _____________
- (u)
- None of the above
- 4.
- Who do you trust to give you reliable information regarding the COVID-19 vaccine? Please select all that apply.
- (a)
- Centers for Disease Control and Prevention (CDC)
- (b)
- World Health Organization (WHO)
- (c)
- Surgeon General
- (d)
- White House
- (e)
- President
- (f)
- State Health Department
- (g)
- Local/County/City Health Department
- (h)
- Your governor
- (i)
- Your mayor
- (j)
- Personal physician
- (k)
- Other healthcare provider/worker
- (l)
- Family member
- (m)
- Close Friend
- (n)
- Religious leader/clergy
- (o)
- Food and Drug Administration (FDA)
- (p)
- Significant other/spouse
- (q)
- Work colleagues
- (r)
- News media (e.g., television or print)
- (s)
- A social media network member’s post (e.g., anyone you are friends with or follow on social media)
- (t)
- Other: _________

| Total N (col%) | N with Efficacy Concerns Score > 1 (col%) | Crude Risk Ratio for Efficacy Concerns Score > 1 | Adjusted Risk Ratio for Efficacy Concerns Score > 1 * | |
|---|---|---|---|---|
| Total | 441 | 288 | ||
| Age (years) | ||||
| 18–29 | 107 (24.3%) | 64 (22.2%) | 0.81 (0.66–0.99) | 0.91 (0.75–1.09) |
| 30–39 | 166 (37.6%) | 105 (36.5%) | 0.86 (0.72–1.01) | 0.92 (0.78–1.08)) |
| 40–49 | 76 (17.2%) | 51 (17.7%) | 0.91 (0.74–1.11) | 1.00 (0.82–1.22) |
| 50+ | 92 (20.9%) | 68 (23.6%) | REF | REF |
| Gender | ||||
| Man | 134 (30.4%) | 98 (34%) | REF | REF |
| Woman or Non-binary/Transgender/Other | 307 (69.6%) | 190 (66%) | 0.85 (0.74–0.97) | 0.86 (0.76–0.98) |
| Race/ethnicity | ||||
| Black NH | 82 (18.6%) | 43 (14.9%) | 0.77 (0.61–0.96) | 0.83 (0.67–1.03) |
| Hispanic | 97 (22%) | 67 (23.3%) | 1.01 (0.86–1.19) | 1.13 (0.97–1.32) |
| White NH | 223 (50.6%) | 152 (52.8%) | REF | REF |
| Other NH | 39 (8.8%) | 26 (9%) | 0.98 (0.77–1.24) | 0.96 (0.77–1.19) |
| Highest level of education | ||||
| High school or less | 139 (31.5%) | 85 (29.5%) | 0.85 (0.72–1.02) | - |
| Some college | 186 (42.2%) | 120 (41.7%) | 0.90 (0.77–1.05) | - |
| College or graduate degree | 116 (26.3%) | 83 (28.8%) | REF | - |
| Household income | ||||
| <$50,000 | 271 (61.5%) | 167 (58%) | 0.80 (0.65–0.98) | 0.91 (0.75–1.09) |
| $50,000–$99,999 | 126 (28.6%) | 89 (30.9%) | 0.92 (0.74–1.13) | 0.95 (0.79–1.14) |
| $100,000+ | 35 (7.9%) | 27 (9.4%) | REF | REF |
| Unknown | 9 (2%) | 5 (1.7%) | 0.72 (0.39–1.33) | 0.92 (0.51–1.68) |
| Geographic region | ||||
| Midwest | 81 (18.4%) | 50 (17.4%) | 1.04 (0.81–1.35) | - |
| Northeast/ Puerto Rico | 71 (16.1%) | 42 (14.6%) | REF | - |
| South | 199 (45.1%) | 131 (45.5%) | 1.11 (0.90–1.38) | - |
| West | 90 (20.4%) | 65 (22.6%) | 1.22 (0.97–1.54) | - |
| Zip code designation | ||||
| Rural | 202 (45.8%) | 134 (46.5%) | 1.03 (0.90–1.18) | - |
| Urban | 239 (54.2%) | 154 (53.5%) | REF | - |
| Employment status | ||||
| Employed | 279 (63.3%) | 195 (67.7%) | REF | REF |
| Out of work | 38 (8.6%) | 17 (5.9%) | 0.64 (0.45–0.92) | 0.63 (0.45–0.89) |
| Homemaker/student/ retired | 124 (28.1%) | 76 (26.4%) | 0.88 (0.75–1.03) | 0.87 (0.74–1.02) |
| Children under the age of 18 in households | ||||
| No | 157 (35.6%) | 107 (37.2%) | REF | - |
| Yes | 284 (64.4%) | 181 (62.8%) | 0.94 (0.81–1.07) | - |
| Health insurance | ||||
| No/don’t know | 91 (20.6%) | 50 (17.4%) | REF | REF |
| Yes | 350 (79.4%) | 238 (82.6%) | 1.24 (1.01–1.51) | 1.16 (0.95–1.42) |
| Household vaccination status (not including self) | ||||
| No eligible people vaccinated/not sure | 242 (54.9%) | 172 (59.7%) | 1.27 (1.07–1.51) | 1.18 (1.00–1.39) |
| All or some of the eligible people were vaccinated | 129 (29.3%) | 72 (25%) | REF | REF |
| N/A (live alone) | 70 (15.9%) | 44 (15.3%) | 1.13 (0.89–1.43) | 1.04 (0.84–1.31) |
| Trust U.S. public health officials for reliable information regarding the COVID vaccine | ||||
| No/Unknown | 251 (56.9%) | 193 (67%) | REF | REF |
| Yes | 190 (43.1%) | 95 (33%) | 0.65 (0.56–0.76) | 0.66 (0.56–0.77) |
| Trust your personal physician or other healthcare provider/worker for reliable information regarding the COVID vaccine | ||||
| No/Unknown | 270 (61.2%) | 171 (59.4%) | REF | REF |
| Yes | 171 (38.8%) | 117 (40.6%) | 1.08 (0.94–1.24) | 1.13 (0.99–1.29) |
| Moderate to severe symptoms of anxiety or depression | ||||
| No | 318 (72.1%) | 213 (74%) | REF | REF |
| Yes | 123 (27.9%) | 75 (26%) | 0.91 (0.77–1.07) | 1.01 (0.85–1.19) |
| Total N (col%) | N with Safety Concerns Score > 1 (col%) | Crude Risk Ratio for Safety Concerns Score > 1 | Adjusted Risk Ratio for Safety Concerns Score > 1 * | |
|---|---|---|---|---|
| Total | 441 | 316 | ||
| Age (years) | ||||
| 18–29 | 107 (24.3%) | 69 (21.8%) | 0.80 (0.67–0.95) | 0.85 (0.72–1.01) |
| 30–39 | 166 (37.6%) | 115 (36.4%) | 0.86 (0.75–0.99) | 0.89 (0.78–1.03) |
| 40–49 | 76 (17.2%) | 58 (18.4%) | 0.95 (0.81–1.11) | 0.99 (0.84–1.18) |
| 50+ | 92 (20.9%) | 74 (23.4%) | REF | REF |
| Gender | ||||
| Man | 134 (30.4%) | 90 (28.5%) | REF | REF |
| Woman or Non-binary/Transgender/Other | 307 (69.6%) | 226 (71.5%) | 1.10 (0.96–1.26) | 1.07 (0.94–1.22) |
| Race/ethnicity | ||||
| Black NH | 82 (18.6%) | 52 (16.5%) | 0.87 (0.73–1.05) | 0.93 (0.78–1.11) |
| Hispanic | 97 (22%) | 74 (23.4%) | 1.05 (0.92–1.20) | 1.12 (0.97–1.29) |
| White NH | 223 (50.6%) | 162 (51.3%) | REF | REF |
| Other NH | 39 (8.8%) | 28 (8.9%) | 0.99 (0.80–1.22) | 0.96 (0.78–1.18) |
| Highest level of education | ||||
| High school or less | 139 (31.5%) | 100 (31.6%) | 1.01 (0.86–1.17) | - |
| Some college | 186 (42.2%) | 133 (42.1%) | 1.00 (0.86–1.16) | - |
| College or graduate degree | 116 (26.3%) | 83 (26.3%) | REF | - |
| Household income | ||||
| <$50,000 | 271 (61.5%) | 189 (59.8%) | 0.84 (0.71–1.00) | 0.88 (0.75–1.03) |
| $50,000–$99,999 | 126 (28.6%) | 93 (29.4%) | 0.89 (0.74–1.07) | 0.92 (0.78–1.09) |
| $100,000+ | 35 (7.9%) | 29 (9.2%) | REF | REF |
| Unknown | 9 (2%) | 5 (1.6%) | 0.67 (0.37–1.23) | 0.68 (0.37–1.25) |
| Geographic region | ||||
| Midwest | 81 (18.4%) | 56 (17.7%) | 0.98 (0.80–1.21) | - |
| Northeast/ Puerto Rico | 71 (16.1%) | 50 (15.8%) | REF | - |
| South | 199 (45.1%) | 145 (45.9%) | 1.03 (0.87–1.23) | - |
| West | 90 (20.4%) | 65 (20.6%) | 1.03 (0.84–1.25) | - |
| Zip code designation | ||||
| Rural | 202 (45.8%) | 146 (46.2%) | 1.02 (0.90–1.14) | - |
| Urban | 239 (54.2%) | 170 (53.8%) | REF | - |
| Employment status | ||||
| Employed | 279 (63.3%) | 200 (63.3%) | REF | - |
| Out of work | 38 (8.6%) | 26 (8.2%) | 0.95 (0.76–1.20) | - |
| Homemaker/student/ retired | 124 (28.1%) | 90 (28.5%) | 1.01 (0.89–1.15) | - |
| Children under the age of 18 in households | ||||
| No | 157 (35.6%) | 114 (36.1%) | REF | - |
| Yes | 284 (64.4%) | 202 (63.9%) | 0.98 (0.87–1.11) | - |
| Health insurance | ||||
| No/don’t know | 91 (20.6%) | 51 (16.1%) | REF | REF |
| Yes | 350 (79.4%) | 265 (83.9%) | 1.35 (1.12–1.64) | 1.29 (1.06–1.56) |
| Household vaccination status (not including self) | ||||
| No eligible people vaccinated/not sure | 242 (54.9%) | 186 (58.9%) | 1.18 (1.02–1.36) | 1.12 (0.97–1.30) |
| All or some of the eligible people were vaccinated | 129 (29.3%) | 84 (26.6%) | REF | REF |
| N/A (live alone) | 70 (15.9%) | 46 (14.6%) | 1.01 (0.82–1.25) | 0.99 (0.80–1.23) |
| Trust U.S. public health officials for reliable information regarding the COVID vaccine | ||||
| No/Unknown | 251 (56.9%) | 188 (59.5%) | REF | REF |
| Yes | 190 (43.1%) | 128 (40.5%) | 0.90 (0.80–1.02) | 0.90 (0.80–1.03) |
| Trust your personal physician or other healthcare provider/worker for reliable information regarding the COVID vaccine | ||||
| No/Unknown | 270 (61.2%) | 186 (58.9%) | REF | REF |
| Yes | 171 (38.8%) | 130 (41.1%) | 1.10 (0.98–1.24) | 1.07 (0.95–1.20) |
| Moderate to severe symptoms of anxiety or depression | ||||
| No | 318 (72.1%) | 226 (71.5%) | REF | REF |
| Yes | 123 (27.9%) | 90 (28.5%) | 1.03 (0.91–1.17) | 1.08 (0.94–1.23) |
| Total N (col%) | N with Ill Intent Concerns Score > 1 (col %) | Crude Risk Ratio for Ill Intent Concerns Score > 1 | Adjusted Risk Ratio for Ill Intent Concerns Score > 1 * | |
|---|---|---|---|---|
| Total | 441 | 74 | ||
| Age (years) | ||||
| 18–29 | 107 (24.3%) | 13 (17.6%) | 0.62 (0.32–1.20) | 0.49 (0.26–0.92) |
| 30–39 | 166 (37.6%) | 29 (39.2%) | 0.89 (0.53–1.52) | 0.74 (0.43–1.26) |
| 40–49 | 76 (17.2%) | 14 (18.9%) | 0.94 (0.50–1.77) | 0.87 (0.47–1.61) |
| 50+ | 92 (20.9%) | 18 (24.3%) | REF | REF |
| Gender | ||||
| Cis Male | 134 (30.4%) | 23 (31.1%) | REF | REF |
| Cis Female or Non-binary/Transgender/Other | 307 (69.6%) | 51 (68.9%) | 0.97 (0.62–1.52) | 0.92 (0.60–1.42) |
| Race/ethnicity | ||||
| Black NH | 82 (18.6%) | 16 (21.6%) | 1.45 (0.84–2.52) | 1.58 (0.92–2.71) |
| Hispanic | 97 (22%) | 25 (33.8%) | 1.92 (1.19–3.08) | 2.09 (1.32–3.33) |
| White NH | 223 (50.6%) | 30 (40.5%) | REF | REF |
| Other NH | 39 (8.8%) | 3 (4.1%) | 0.57 (0.18–1.78) | 0.48 (0.14–1.58) |
| Highest level of education | ||||
| High school or less | 139 (31.5%) | 23 (31.1%) | 1.07 (0.61–1.88) | - |
| Some college | 186 (42.2%) | 33 (44.6%) | 1.14 (0.68–1.93) | - |
| College or graduate degree | 116 (26.3%) | 18 (24.3%) | REF | - |
| Household income | ||||
| <$50,000 | 271 (61.5%) | 43 (58.1%) | 0.93 (0.43–2.02) | - |
| $50,000–$99,999 | 126 (28.6%) | 24 (32.4%) | 1.11 (0.49–2.50) | - |
| $100,000+ | 35 (7.9%) | 6 (8.1%) | REF | - |
| Unknown | 9 (2%) | 1 (1.4%) | 0.65 (0.09–4.72) | - |
| Geographic region | ||||
| Midwest | 81 (18.4%) | 9 (12.2%) | 0.49 (0.23–1.05) | - |
| Northeast/Puerto Rico | 71 (16.1%) | 16 (21.6%) | REF | - |
| South | 199 (45.1%) | 37 (50%) | 0.83 (0.49–1.39) | - |
| West | 90 (20.4%) | 12 (16.2%) | 0.59 (0.30–1.17) | - |
| Zip code designation | ||||
| Rural | 202 (45.8%) | 32 (43.2%) | 0.90 (0.59–1.37) | - |
| Urban | 239 (54.2%) | 42 (56.8%) | REF | - |
| Employment status | ||||
| Employed | 279 (63.3%) | 53 (71.6%) | REF | - |
| Out of work | 38 (8.6%) | 6 (8.1%) | 0.83 (0.38–1.80) | - |
| Homemaker/student/ retired | 124 (28.1%) | 15 (20.3%) | 0.64 (0.37–1.08) | - |
| Children under the age of 18 in households | ||||
| No | 157 (35.6%) | 26 (35.1%) | REF | - |
| Yes | 284 (64.4%) | 48 (64.9%) | 1.02 (0.66–1.58) | - |
| Health insurance | ||||
| No/don’t know | 91 (20.6%) | 11 (14.9%) | REF | - |
| Yes | 350 (79.4%) | 63 (85.1%) | 1.49 (0.82–2.71) | - |
| Household vaccination status (not including self) | ||||
| No eligible people vaccinated/not sure | 242 (54.9%) | 45 (60.8%) | 1.33 (0.81–2.20) | 1.40 (0.86–2.27) |
| All or some of the eligible people vaccinated | 129 (29.3%) | 18 (24.3%) | REF | REF |
| N/A (live alone) | 70 (15.9%) | 11 (14.9%) | 1.13 (0.56–2.25) | 1.07 (0.56–2.06) |
| Trust U.S. public health officials for reliable information regarding the COVID vaccine | ||||
| No/Unknown | 251 (56.9%) | 52 (70.3%) | REF | REF |
| Yes | 190 (43.1%) | 22 (29.7%) | 0.56 (0.35–0.89) | 0.62 (0.39–0.97) |
| Trust your personal physician or other healthcare provider/worker for reliable information regarding the COVID vaccine | ||||
| No/Unknown | 270 (61.2%) | 59 (79.7%) | REF | REF |
| Yes | 171 (38.8%) | 15 (20.3%) | 0.40 (0.24–0.68) | 0.45 (0.25–0.79) |
| Moderate to severe symptoms of anxiety or depression | ||||
| No | 318 (72.1%) | 49 (66.2%) | REF | REF |
| Yes | 123 (27.9%) | 25 (33.8%) | 1.32 (0.85–2.04) | 1.58 (1.04–2.40) |
References
- Ahmad, F.B. Provisional Mortality Data—United States, 2022. MMWR Morb. Mortal. Wkly. Rep. 2023, 7, 488. Available online: https://www.cdc.gov/mmwr/volumes/72/wr/mm7218a3.htm (accessed on 20 August 2023). [CrossRef]
- COVID-19 Incidence and Mortality among Unvaccinated and Vaccinated Persons Aged ≥12 Years by Receipt of Bivalent Booster Doses and Time Since Vaccination—24 U.S. Jurisdictions, 3 October 2021–24 December 2022|MMWR. Available online: https://www.cdc.gov/mmwr/volumes/72/wr/mm7206a3.htm (accessed on 20 August 2023).
- CDC. Centers for Disease Control and Prevention. COVID Data Tracker. 2020. Available online: https://covid.cdc.gov/covid-data-tracker (accessed on 20 August 2023).
- Voutouri, C.; Hardin, C.C.; Naranbhai, V.; Nikmaneshi, M.R.; Khandekar, M.J.; Gainor, J.F.; Stylianopoulos, T.; Mun, L.L.; Jain, J.K. Mechanistic model for booster doses effectiveness in healthy, cancer, and immunosuppressed patients infected with SARS-CoV-2. Proc. Natl. Acad. Sci. USA 2023, 120, e2211132120. [Google Scholar] [CrossRef] [PubMed]
- Petherick, A.; Goldszmidt, R.; Andrade, E.B.; Furst, R.; Hale, T.; Pott, A.; Wood, A. A worldwide assessment of changes in adherence to COVID-19 protective behaviours and hypothesized pandemic fatigue. Nat. Hum. Behav. 2021, 5, 1145–1160. [Google Scholar] [CrossRef]
- MacIntyre, C.R.; Nguyen, P.Y.; Chughtai, A.A.; Trent, M.; Gerber, B.; Steinhofel, K.; Seale, H. Mask use, risk-mitigation behaviours and pandemic fatigue during the COVID-19 pandemic in five cities in Australia, the UK and USA: A cross-sectional survey. Int. J. Infect. Dis. IJID Off. Publ. Int. Soc. Infect. Dis. 2021, 106, 199–207. [Google Scholar] [CrossRef] [PubMed]
- Lee, S.K.; Sun, J.; Jang, S.; Connelly, S. Misinformation of COVID-19 vaccines and vaccine hesitancy. Sci. Rep. 2022, 12, 13681. [Google Scholar] [CrossRef] [PubMed]
- Lin, C.; Bier, B.; Tu, R.; Paat, J.J.; Tu, P. Vaccinated Yet Booster-Hesitant: Perspectives from Boosted, Non-Boosted, and Unvaccinated Individuals. Vaccines 2023, 11, 550. [Google Scholar] [CrossRef]
- Twitters’ Concerns and Opinions About the COVID-19 Booster Shots: Infoveillance Study. Available online: https://www.researchgate.net/publication/366229443_Twitters’_Concerns_and_Opinions_About_the_COVID-19_Booster_Shots_Infoveillance_Study (accessed on 20 August 2023).
- MacDonald, N.E.; SAGE Working Group on Vaccine Hesitancy. Vaccine hesitancy: Definition, scope and determinants. Vaccine 2015, 33, 4161–4164. [Google Scholar] [CrossRef]
- Loomba, S.; de Figueiredo, A.; Piatek, S.J.; de Graaf, K.; Larson, H.J. Measuring the impact of COVID-19 vaccine misinformation on vaccination intent in the UK and USA. Nat. Hum. Behav. 2021, 5, 337–348. [Google Scholar] [CrossRef]
- Neely, S.R.; Eldredge, C.; Ersing, R.; Remington, C. Vaccine Hesitancy and Exposure to Misinformation: A Survey Analysis. J. Gen. Intern. Med. 2022, 37, 179–187. [Google Scholar] [CrossRef] [PubMed]
- Barli, S.; Dhanini, D.L. Research Report & Meta Analysis, Authored By: Final Rep. 2021.
- Wang, Q.; Xu, R.; Volkow, N.D. Increased risk of COVID-19 infection and mortality in people with mental disorders: Analysis from electronic health records in the United States. World Psychiatry Off. J. World Psychiatr. Assoc. WPA 2021, 20, 124–130. [Google Scholar] [CrossRef]
- De Hert, M.; Mazereel, V.; Stroobants, M.; De Picker, L.; Van Assche, K.; Detraux, J. COVID-19-Related Mortality Risk in People with Severe Mental Illness: A Systematic and Critical Review. Front. Psychiatry 2022, 12, 798554. [Google Scholar] [CrossRef] [PubMed]
- Ceban, F.; Nogo, D.; Carvalho, I.P.; Lee, Y.; Nasri, F.; Xiong, J.; Lui, L.M.V.; Subramaniapillai, M.; Gill, H.; Liu, R.N.; et al. Association Between Mood Disorders and Risk of COVID-19 Infection, Hospitalization, and Death: A Systematic Review and Meta-analysis. JAMA Psychiatry 2021, 78, 1079–1091. [Google Scholar] [CrossRef] [PubMed]
- Vai, B.; Mazza, M.G.; Delli Colli, C.; Foiselle, M.; Allen, B.; Benedetti, F.; De Picker, L.J. Mental disorders and risk of COVID-19-related mortality, hospitalisation, and intensive care unit admission: A systematic review and meta-analysis. Lancet Psychiatry 2021, 8, 797–812. [Google Scholar] [CrossRef] [PubMed]
- Toubasi, A.A.; AbuAnzeh, R.B.; Tawileh, H.B.A.; Aldebei, R.H.; Alryalat, S.A.S. A meta-analysis: The mortality and severity of COVID-19 among patients with mental disorders. Psychiatry Res. 2021, 299, 113856. [Google Scholar] [CrossRef] [PubMed]
- Robertson, M.M.; Kulkarni, S.G.; Rane, M.; Kochhar, S.; Berry, A.; Chang, M.; Mirzayi, C.; You, W.; Maroko, A.; Zimba, R.; et al. Cohort profile: A national, community-based prospective cohort study of SARS-CoV-2 pandemic outcomes in the USA-the CHASING COVID Cohort study. BMJ Open 2021, 11, e048778. [Google Scholar] [CrossRef] [PubMed]
- Spitzer, R.L.; Kroenke, K.; Williams, J.B.W.; Löwe, B. A brief measure for assessing generalized anxiety disorder: The GAD-7. Arch. Intern. Med. 2006, 166, 1092–1097. [Google Scholar] [CrossRef] [PubMed]
- Kroenke, K.; Spitzer, R.L.; Williams, J.B.W.; Löwe, B. An ultra-brief screening scale for anxiety and depression: The PHQ-4. Psychosomatics 2009, 50, 613–621. [Google Scholar] [PubMed]
- Goodwin, G.M. The overlap between anxiety, depression, and obsessive-compulsive disorder. Dialogues Clin. Neurosci. 2015, 17, 249–260. [Google Scholar] [CrossRef] [PubMed]
- Bennett, N.G.; Bloom, D.E.; Ferranna, M. Factors underlying COVID-19 vaccine and booster hesitancy and refusal, and incentivizing vaccine adoption. PLoS ONE 2022, 17, e0274529. [Google Scholar] [CrossRef] [PubMed]
- COVID-19 Public Education Campaign. 2023. Available online: https://wecandothis.hhs.gov/ (accessed on 20 August 2023).


| Vaccination Status | ||||
|---|---|---|---|---|
| Un- Vaccinated | Under- Vaccinated | Vaccinated and Boosted | Chi-Square p-Value for Under- Vaccinated vs. Boosted | |
| N (col %) | N (col %) | N (col %) | ||
| Total | 441 | 572 | 3717 | |
| Age (years) | ||||
| 18–29 | 107 (24.3%) | 160 (28.0%) | 763 (20.5%) | <0.0001 |
| 30–39 | 166 (37.6%) | 195 (34.1%) | 1015 (27.3%) | |
| 40–49 | 76 (17.2%) | 95 (16.6%) | 688 (18.5%) | |
| 50+ | 92 (20.9%) | 122 (21.3%) | 1251 (33.7%) | |
| Gender | ||||
| Woman | 134 (30.4%) | 245 (42.8%) | 1727 (46.5%) | 0.008 |
| Man | 304 (68.9%) | 319 (55.8%) | 1871 (50.3%) | |
| Non-binary/Transgender/Other | 3 (0.7%) | 8 (1.4%) | 119 (3.2%) | |
| Race/ethnicity | ||||
| Black NH | 82 (18.6%) | 119 (20.8%) | 298 (8.0%) | <0.0001 |
| Hispanic | 97 (22.0%) | 138 (24.1%) | 540 (14.5%) | |
| White NH | 223 (50.6%) | 275 (48.1%) | 2460 (66.2%) | |
| Other NH | 39 (8.8%) | 40 (7.0%) | 419 (11.3%) | |
| Highest level of education | ||||
| High school or less | 139 (31.5%) | 127 (22.2%) | 273 (7.3%) | <0.0001 |
| Some college | 186 (42.2%) | 229 (40.0%) | 814 (21.9%) | |
| College or graduate degree | 116 (26.3%) | 216 (37.8%) | 2630 (70.8%) | |
| Household income | ||||
| <$50,000 | 271 (61.5%) | 311 (54.4%) | 1203 (32.4%) | <0.0001 |
| $50,000-$99,999 | 126 (28.6%) | 172 (30.1%) | 1203 (32.4%) | |
| $100,000+ | 35 (7.9%) | 74 (12.9%) | 1198 (32.2%) | |
| Unknown | 9 (2.0%) | 15 (2.6%) | 113 (3.0%) | |
| Geographic region | ||||
| Midwest | 81 (18.4%) | 95 (16.6%) | 667 (17.9%) | <0.0001 |
| Northeast/Puerto Rico | 71 (16.1%) | 114 (19.9%) | 1211 (32.6%) | |
| South | 199 (45.1%) | 243 (42.5%) | 907 (24.4%) | |
| West | 90 (20.4%) | 120 (21.0%) | 932 (25.1%) | |
| Zip code designation | ||||
| Rural | 202 (45.8%) | 202 (35.3%) | 1008 (27.1%) | <0.0001 |
| Urban | 239 (54.2%) | 370 (64.7%) | 2709 (72.9%) | |
| Employment status | ||||
| Employed | 279 (63.3%) | 401 (70.1%) | 2614 (70.3%) | 0.0001 |
| Out of work | 38 (8.6%) | 59 (10.3%) | 221 (6.0%) | |
| Homemaker/student/ retired | 124 (28.1%) | 112 (19.6%) | 882 (23.7%) | |
| Children under the age 18 of in households | ||||
| No | 157 (35.6%) | 269 (47.0%) | 2313 (62.2%) | <0.0001 |
| Yes | 284 (64.4%) | 303 (53.0%) | 1404 (37.8%) | |
| Health insurance | ||||
| No/don’t know | 91 (20.6%) | 110 (19.2%) | 255 (6.9%) | <0.0001 |
| Yes | 350 (79.4%) | 462 (80.8%) | 3462 (93.1%) | |
| Household vaccination status (not including self) | ||||
| No eligible people vaccinated/not sure | 242 (54.9%) | 75 (13.1%) | 76 (2.0%) | <0.0001 |
| All or some of the eligible people were vaccinated | 129 (29.3%) | 397 (69.4%) | 2829 (76.1%) | |
| N/A (live alone) | 70 (15.9%) | 100 (17.5%) | 812 (21.9%) | |
| Trust U.S. public health officials for reliable information regarding the COVID vaccine | ||||
| No/Unknown | 251 (56.9%) | 206 (36.0%) | 484 (13.0%) | <0.0001 |
| Yes | 190 (43.1%) | 366 (64.0%) | 3233 (87.0%) | |
| Trust your personal physician or other healthcare provider/worker for reliable information regarding the COVID vaccine | ||||
| No/Unknown | 270 (61.2%) | 289 (50.5%) | 1085 (29.2%) | <0.0001 |
| Yes | 171 (38.8%) | 283 (48.5%) | 2632 (70.8%) | |
| Moderate to severe symptoms of anxiety or depression | ||||
| No | 318 (72.1%) | 387 (67.7%) | 2921 (78.6%) | <0.0001 |
| Yes | 123 (27.9%) | 185 (32.3%) | 796 (21.4%) | |
| Items | Safety Concerns | Efficacy Concerns | Concerns about Ill Intent |
|---|---|---|---|
| The COVID vaccine can affect your fertility | 0.524 | 0.270 | 0.318 |
| I don’t need the COVID vaccine if I’ve already had COVID * | 0.285 | 0.706 | 0.196 |
| The COVID vaccine was developed too quickly | 0.711 | 0.333 | 0.203 |
| The COVID vaccine will not protect me from being hospitalized with COVID * | 0.326 | 0.565 | 0.183 |
| Getting the COVID vaccine gives you COVID | 0.301 | 0.225 | 0.572 |
| The side effects of the COVID vaccine are dangerous | 0.603 | 0.363 | 0.309 |
| The COVID vaccine changes your DNA | 0.429 | 0.269 | 0.526 |
| I don’t need a COVID vaccine booster to stay protected from severe COVID disease * | 0.266 | 0.759 | 0.189 |
| The technology used to make the COVID vaccine is too new to be safe | 0.662 | 0.336 | 0.332 |
| The COVID vaccine contains tracking devices, implants, or microchips | 0.219 | 0.162 | 0.789 |
| Receiving the COVID vaccine can make you magnetic | 0.176 | 0.142 | 0.751 |
| Unvaccinated (N = 441) | Undervaccinated (N = 572) | Vaccinated and Boosted (N = 3717) | Cronbach’s α | ||||
|---|---|---|---|---|---|---|---|
| Mean (SD) | Median (IQR) | Mean (SD) | Median (IQR) | Mean (SD) | Median (IQR) | ||
| Efficacy concerns | 1.41 (0.60) | 1.67 (1.00, 2.00) | 0.87 (0.65) | 0.67 (0.33, 1.33) | 0.21 (0.42) | 0 (0, 0.33) | 0.80 |
| Safety concerns | 1.4 (0.48) | 1.50 (1.00, 1.75) | 0.87 (0.59) | 1.00 (0.25, 1.25) | 0.30 (0.45) | 0 (0, 0.50) | 0.85 |
| Concerns about ill intent | 0.67 (0.52) | 0.75 (0.25, 1.00) | 0.38 (0.48) | 0.25 (0, 0.75) | 0.11 (0.31) | 0 (0, 0) | 0.83 |
| Total N (col%) | N with Efficacy Concerns Score > 1 (col %) | Crude Risk Ratio for Efficacy Concerns Score > 1 | Adjusted Risk Ratio for Efficacy Concerns Score > 1 * | |
|---|---|---|---|---|
| Total | 572 | 197 | ||
| Age (years) | ||||
| 18–29 | 160 (28%) | 51 (25.9%) | 0.69 (0.52–0.93) | 0.86 (0.64–1.15) |
| 30–39 | 195 (34.1%) | 62 (31.5%) | 0.69 (0.52–0.92) | 0.86 (0.66–1.12) |
| 40–49 | 95 (16.6%) | 28 (14.2%) | 0.64 (0.45–0.93) | 0.79 (0.57–1.09) |
| 50+ | 122 (21.3%) | 56 (28.4%) | REF | REF |
| Gender | ||||
| Man | 245 (42.8%) | 103 (52.3%) | REF | REF |
| Woman or Non-binary/Transgender/Other | 327 (57.2%) | 94 (47.7%) | 0.68 (0.55–0.86) | 0.76 (0.62–0.94) |
| Race/ethnicity | ||||
| Black NH | 119 (20.8%) | 34 (17.3%) | 0.73 (0.53–1.00) | 0.80 (0.59–1.07) |
| Hispanic | 138 (24.1%) | 40 (20.3%) | 0.74 (0.55–1.00) | 0.88 (0.65–1.19) |
| White NH | 275 (48.1%) | 108 (54.8%) | REF | REF |
| Other NH | 40 (7%) | 15 (7.6%) | 0.95 (0.62–1.46) | 0.91 (0.62–1.34) |
| Highest level of education | ||||
| High school or less | 127 (22.2%) | 44 (22.3%) | 0.97 (0.72–1.31) | - |
| Some college | 229 (40%) | 76 (38.6%) | 0.93 (0.72–1.20) | - |
| College or graduate degree | 216 (37.8%) | 77 (39.1%) | REF | - |
| Household income | ||||
| <$50,000 | 311 (54.4%) | 100 (50.8%) | 0.88 (0.63–1.24) | - |
| $50,000–$99,999 | 172 (30.1%) | 65 (33%) | 1.04 (0.73–1.48) | - |
| $100,000+ | 74 (12.9%) | 27 (13.7%) | REF | - |
| Unknown | 15 (2.6%) | 5 (2.5%) | 0.91 (0.42–1.99) | - |
| Geographic region | ||||
| Midwest | 95 (16.6%) | 32 (16.2%) | 0.94 (0.64–1.36) | - |
| Northeast/Puerto Rico | 114 (19.9%) | 41 (20.8%) | REF | - |
| South | 243 (42.5%) | 80 (40.6%) | 0.92 (0.68–1.24) | - |
| West | 120 (21%) | 44 (22.3%) | 1.02 (0.73–1.43) | - |
| Zip code designation | ||||
| Rural | 202 (35.3%) | 78 (39.6%) | 1.20 (0.96–1.51) | - |
| Urban | 370 (64.7%) | 119 (60.4%) | REF | - |
| Employment status | ||||
| Employed | 401 (70.1%) | 133 (67.5%) | REF | - |
| Out of work | 59 (10.3%) | 16 (8.1%) | 0.82 (0.53–1.27) | - |
| Homemaker/student/ retired | 112 (19.6%) | 48 (24.4%) | 1.29 (1.00–1.67) | - |
| Children under the age of 18 in household | ||||
| No | 269 (47%) | 89 (45.2%) | REF | - |
| Yes | 303 (53%) | 108 (54.8%) | 1.08 (0.86–1.35) | - |
| Health insurance | ||||
| No/don’t know | 110 (19.2%) | 45 (22.8%) | REF | - |
| Yes | 462 (80.8%) | 152 (77.2%) | 0.80 (0.62–1.04) | - |
| Household vaccination status (not including self) | ||||
| No eligible people have been vaccinated/not sure | 75 (13.1%) | 39 (19.8%) | 1.72 (1.32–2.24) | 1.54 (1.19–1.99) |
| All or some of the eligible people were vaccinated | 397 (69.4%) | 120 (60.9%) | REF | REF |
| N/A (live alone) | 100 (17.5%) | 38 (19.3%) | 1.26 (0.94–1.68) | 1.28 (0.97–1.70) |
| Trust U.S. public health officials for reliable information regarding the COVID vaccine | ||||
| No/Unknown | 206 (36%) | 118 (59.9%) | REF | REF |
| Yes | 366 (64%) | 79 (40.1%) | 0.38 (0.30–0.47) | 0.41 (0.32–0.51) |
| Trust your personal physician or other healthcare provider/worker for reliable information regarding the COVID vaccine | ||||
| No/Unknown | 289 (50.5%) | 110 (55.8%) | REF | REF |
| Yes | 283 (49.5%) | 87 (44.2%) | 0.81 (0.64–1.02) | 0.85 (0.69–1.06) |
| Moderate to severe symptoms of anxiety or depression | ||||
| No | 387 (67.7%) | 147 (74.6%) | REF | REF |
| Yes | 185 (32.3%) | 50 (25.4%) | 0.71 (0.54–0.93) | 0.73 (0.57–0.94) |
| Total N (col%) | N with Safety Concerns Score > 1 (col%) | Crude Risk Ratio for Safety Concerns Score > 1 | Adjusted Risk Ratio for Safety Concerns Score > 1 * | |
|---|---|---|---|---|
| Total | 572 | 182 | ||
| Age (years) | ||||
| 18–29 | 160 (28%) | 38 (20.9%) | 0.53 (0.38–0.74) | 0.65 (0.44–0.94) |
| 30–39 | 195 (34.1%) | 57 (31.3%) | 0.65 (0.48–0.87) | 0.79 (0.58–1.09) |
| 40–49 | 95 (16.6%) | 32 (17.6%) | 0.75 (0.53–1.05) | 0.95 (0.66–1.37) |
| 50+ | 122 (21.3%) | 55 (30.2%) | REF | REF |
| Gender | ||||
| Man | 245 (42.8%) | 76 (41.8%) | REF | REF |
| Woman or Non-binary/Transgender/Other | 327 (57.2%) | 106 (58.2%) | 1.04 (0.82–1.33) | 1.09 (0.85–1.38) |
| Race/ethnicity | ||||
| Black NH | 119 (20.8%) | 39 (21.4%) | 0.97 (0.71–1.32) | 1.12 (0.82–1.52) |
| Hispanic | 138 (24.1%) | 37 (20.3%) | 0.79 (0.57–1.09) | 0.96 (0.69–1.32) |
| White NH | 275 (48.1%) | 93 (51.1%) | REF | REF |
| Other NH | 40 (7%) | 13 (7.1%) | 0.96 (0.60–1.55) | 1.00 (0.64–1.56) |
| Highest level of education | ||||
| High school or less | 127 (22.2%) | 43 (23.6%) | 1.04 (0.77–1.42) | - |
| Some college | 229 (40%) | 69 (37.9%) | 0.93 (0.71–1.22) | - |
| College or graduate degree | 216 (37.8%) | 70 (38.5%) | REF | - |
| Household income | ||||
| <$50,000 | 311 (54.4%) | 97 (53.3%) | 0.82 (0.59–1.15) | - |
| $50,000–$99,999 | 172 (30.1%) | 51 (28%) | 0.78 (0.54–1.14) | - |
| $100,000+ | 74 (12.9%) | 28 (15.4%) | REF | - |
| Unknown | 15 (2.6%) | 6 (3.3%) | 1.06 (0.53–2.10) | - |
| Geographic region | ||||
| Midwest | 95 (16.6%) | 27 (14.8%) | 0.74 (0.50–1.09) | - |
| Northeast/Puerto Rico | 114 (19.9%) | 44 (24.2%) | REF | - |
| South | 243 (42.5%) | 79 (43.4%) | 0.84 (0.63–1.13) | - |
| West | 120 (21%) | 32 (17.6%) | 0.69 (0.47–1.01) | - |
| Zip code designation | ||||
| Rural | 202 (35.3%) | 73 (40.1%) | 1.23 (0.96–1.56) | - |
| Urban | 370 (64.7%) | 109 (59.9%) | REF | - |
| Employment status | ||||
| Employed | 401 (70.1%) | 115 (63.2%) | REF | REF |
| Out of work | 59 (10.3%) | 18 (9.9%) | 1.06 (0.70–1.61) | 1.17 (0.78–1.76) |
| Homemaker/student/ retired | 112 (19.6%) | 49 (26.9%) | 1.53 (1.18–1.98) | 1.36 (1.03–1.80) |
| Children under the age of 18 in household | ||||
| No | 269 (47%) | 76 (41.8%) | REF | - |
| Yes | 303 (53%) | 106 (58.2%) | 1.24 (0.97–1.58) | - |
| Health insurance | ||||
| No/don’t know | 110 (19.2%) | 34 (18.7%) | REF | - |
| Yes | 462 (80.8%) | 148 (81.3%) | 1.04 (0.76–1.41) | - |
| Household vaccination status (not including self) | ||||
| No eligible people vaccinated/not sure | 75 (13.1%) | 30 (16.5%) | 1.35 (0.98–1.85) | 1.22 (0.87–1.70) |
| All or some of the eligible people were vaccinated | 397 (69.4%) | 118 (64.8%) | REF | REF |
| N/A (live alone) | 100 (17.5%) | 34 (18.7%) | 1.14 (0.84–1.56) | 1.09 (0.80–1.48) |
| Trust U.S. public health officials for reliable information regarding the COVID vaccine | ||||
| No/Unknown | 206 (36%) | 97 (53.3%) | REF | REF |
| Yes | 366 (64%) | 85 (46.7%) | 0.49 (0.39–0.62) | 0.51 (0.40–0.64) |
| Trust your personal physician or other healthcare provider/worker for reliable information regarding the COVID vaccine | ||||
| No/Unknown | 289 (50.5%) | 97 (53.3%) | REF | REF |
| Yes | 283 (49.5%) | 85 (46.7%) | 0.89 (0.70–1.14) | 0.88 (0.70–1.12) |
| Moderate to severe symptoms of anxiety or depression | ||||
| No | 387 (67.7%) | 136 (74.7%) | REF | REF |
| Yes | 185 (32.3%) | 46 (25.3%) | 0.71 (0.53–0.94) | 0.73 (0.55–0.97) |
| Total N (col%) | N with Ill Intent Concerns Score > 1 (col%) | Crude Risk Ratio for Ill Intent Concerns Score > 1 | Adjusted Risk Ratio for Ill Intent Concerns Score > 1 * | |
|---|---|---|---|---|
| Total | 572 | 40 | ||
| Age (years) | ||||
| 18–29 | 160 (28%) | 17 (42.5%) | 2.59 (0.98–6.83) | 1.43 (0.48–4.27) |
| 30–39 | 195 (34.1%) | 16 (40%) | 2.00 (0.75–5.33) | 1.38 (0.50–3.83) |
| 40–49 | 95 (16.6%) | 2 (5%) | 0.51 (0.10–2.59) | 0.30 (0.07–1.19) |
| 50+ | 122 (21.3%) | 5 (12.5%) | REF | REF |
| Gender | ||||
| Man | 245 (42.8%) | 25 (62.5%) | REF | REF |
| Woman or Non-binary/Transgender/Other | 327 (57.2%) | 15 (37.5%) | 0.45 (0.24–0.83) | 0.52 (0.28–0.94) |
| Race/ethnicity | ||||
| Black NH | 119 (20.8%) | 14 (35%) | 2.70 (1.29–5.65) | 2.43 (1.11–5.33) |
| Hispanic | 138 (24.1%) | 9 (22.5%) | 1.49 (0.65–3.46) | 1.27 (0.54–3.02) |
| White NH | 275 (48.1%) | 12 (30%) | REF | REF |
| Other NH | 40 (7%) | 5 (12.5%) | 2.86 (1.07–7.70) | 2.62 (1.01–6.81) |
| Highest level of education | ||||
| High school or less | 127 (22.2%) | 7 (17.5%) | 0.79 (0.33–1.89) | - |
| Some college | 229 (40%) | 18 (45%) | 1.13 (0.59–2.19) | - |
| College or graduate degree | 216 (37.8%) | 15 (37.5%) | REF | - |
| Household income | ||||
| <$50,000 | 311 (54.4%) | 23 (57.5%) | 1.09 (0.43–2.78) | - |
| $50,000–$99,999 | 172 (30.1%) | 11 (27.5%) | 0.95 (0.34–2.63) | - |
| $100,000+ | 74 (12.9%) | 5 (12.5%) | REF | - |
| Unknown | 15 (2.6%) | 1 (2.5%) | 0.99 (0.12–7.85) | - |
| Geographic region | ||||
| Midwest | 95 (16.6%) | 6 (15%) | 0.51 (0.21–1.29) | 0.60 (0.24–1.54) |
| Northeast/Puerto Rico | 114 (19.9%) | 14 (35%) | REF | REF |
| South | 243 (42.5%) | 13 (32.5%) | 0.44 (0.21–0.90) | 0.36 (0.18–0.73) |
| West | 120 (21%) | 7 (17.5%) | 0.48 (0.20–1.13) | 0.51 (0.22–1.18) |
| Zip code designation | ||||
| Rural | 202 (35.3%) | 11 (27.5%) | 0.69 (0.35–1.36) | - |
| Urban | 370 (64.7%) | 29 (72.5%) | REF | - |
| Employment status | ||||
| Employed | 401 (70.1%) | 34 (85%) | REF | - |
| Out of work | 59 (10.3%) | 3 (7.5%) | 0.60 (0.19–1.89) | - |
| Homemaker/student/ retired | 112 (19.6%) | 3 (7.5%) | 0.32 (0.10–1.01) | - |
| Children under the age of 18 in household | ||||
| No | 269 (47%) | 16 (40%) | REF | - |
| Yes | 303 (53%) | 24 (60%) | 1.33 (0.72–2.45) | - |
| Health insurance | ||||
| No/don’t know | 110 (19.2%) | 18 (45%) | REF | REF |
| Yes | 462 (80.8%) | 22 (55%) | 0.29 (0.16–0.52) | 0.40 (0.21–0.77) |
| Household vaccination status (not including self) | ||||
| No eligible people vaccinated/not sure | 75 (13.1%) | 10 (25%) | 2.04 (1.02–4.04) | 2.27 (1.20–4.28) |
| All or some of the eligible people were vaccinated | 397 (69.4%) | 26 (65%) | REF | REF |
| N/A (live alone) | 100 (17.5%) | 4 (10%) | 0.61 (0.22–1.71) | 0.74 (0.25–2.20) |
| Trust U.S. public health officials for reliable information regarding the COVID vaccine | ||||
| No/Unknown | 206 (36%) | 18 (45%) | REF | REF |
| Yes | 366 (64%) | 22 (55%) | 0.69 (0.38–1.25) | 0.87 (0.48–1.59) |
| Trust personal physician or other healthcare provider/worker for reliable information regarding the COVID vaccine | ||||
| No/Unknown | 289 (50.5%) | 26 (65%) | REF | REF |
| Yes | 283 (49.5%) | 14 (35%) | 0.55 (0.29–1.03) | 0.71 (0.38–1.32) |
| Moderate to severe symptoms of anxiety or depression | ||||
| No | 387 (67.7%) | 27 (67.5%) | REF | REF |
| Yes | 185 (32.3%) | 13 (32.5%) | 1.01 (0.53–1.91) | 0.83 (0.46–1.52) |
Disclaimer/Publisher’s Note: The statements, opinions and data contained in all publications are solely those of the individual author(s) and contributor(s) and not of MDPI and/or the editor(s). MDPI and/or the editor(s) disclaim responsibility for any injury to people or property resulting from any ideas, methods, instructions or products referred to in the content. |
© 2023 by the authors. Licensee MDPI, Basel, Switzerland. This article is an open access article distributed under the terms and conditions of the Creative Commons Attribution (CC BY) license (https://creativecommons.org/licenses/by/4.0/).
Share and Cite
Piltch-Loeb, R.; Penrose, K.; Stanton, E.; Parcesepe, A.M.; Shen, Y.; Fleary, S.A.; Nash, D. Safety, Efficacy, and Ill Intent: Examining COVID-19 Vaccine Perceptions among the New Undervaccinated Moveable Middle in a U.S. Cohort, October 2022. Vaccines 2023, 11, 1665. https://doi.org/10.3390/vaccines11111665
Piltch-Loeb R, Penrose K, Stanton E, Parcesepe AM, Shen Y, Fleary SA, Nash D. Safety, Efficacy, and Ill Intent: Examining COVID-19 Vaccine Perceptions among the New Undervaccinated Moveable Middle in a U.S. Cohort, October 2022. Vaccines. 2023; 11(11):1665. https://doi.org/10.3390/vaccines11111665
Chicago/Turabian StylePiltch-Loeb, Rachael, Kate Penrose, Eva Stanton, Angela M. Parcesepe, Yanhan Shen, Sasha A. Fleary, and Denis Nash. 2023. "Safety, Efficacy, and Ill Intent: Examining COVID-19 Vaccine Perceptions among the New Undervaccinated Moveable Middle in a U.S. Cohort, October 2022" Vaccines 11, no. 11: 1665. https://doi.org/10.3390/vaccines11111665
APA StylePiltch-Loeb, R., Penrose, K., Stanton, E., Parcesepe, A. M., Shen, Y., Fleary, S. A., & Nash, D. (2023). Safety, Efficacy, and Ill Intent: Examining COVID-19 Vaccine Perceptions among the New Undervaccinated Moveable Middle in a U.S. Cohort, October 2022. Vaccines, 11(11), 1665. https://doi.org/10.3390/vaccines11111665