

COVID-19 Vaccine Hesitancy among Health Professional Students: Cross-Sectional Data from the First Wave of the HOLISTIC Cohort Study

 , and
, and
Abstract
:1. Introduction
2. Materials and Methods
2.1. Study Design
2.2. Study Population
2.3. Questionnaire
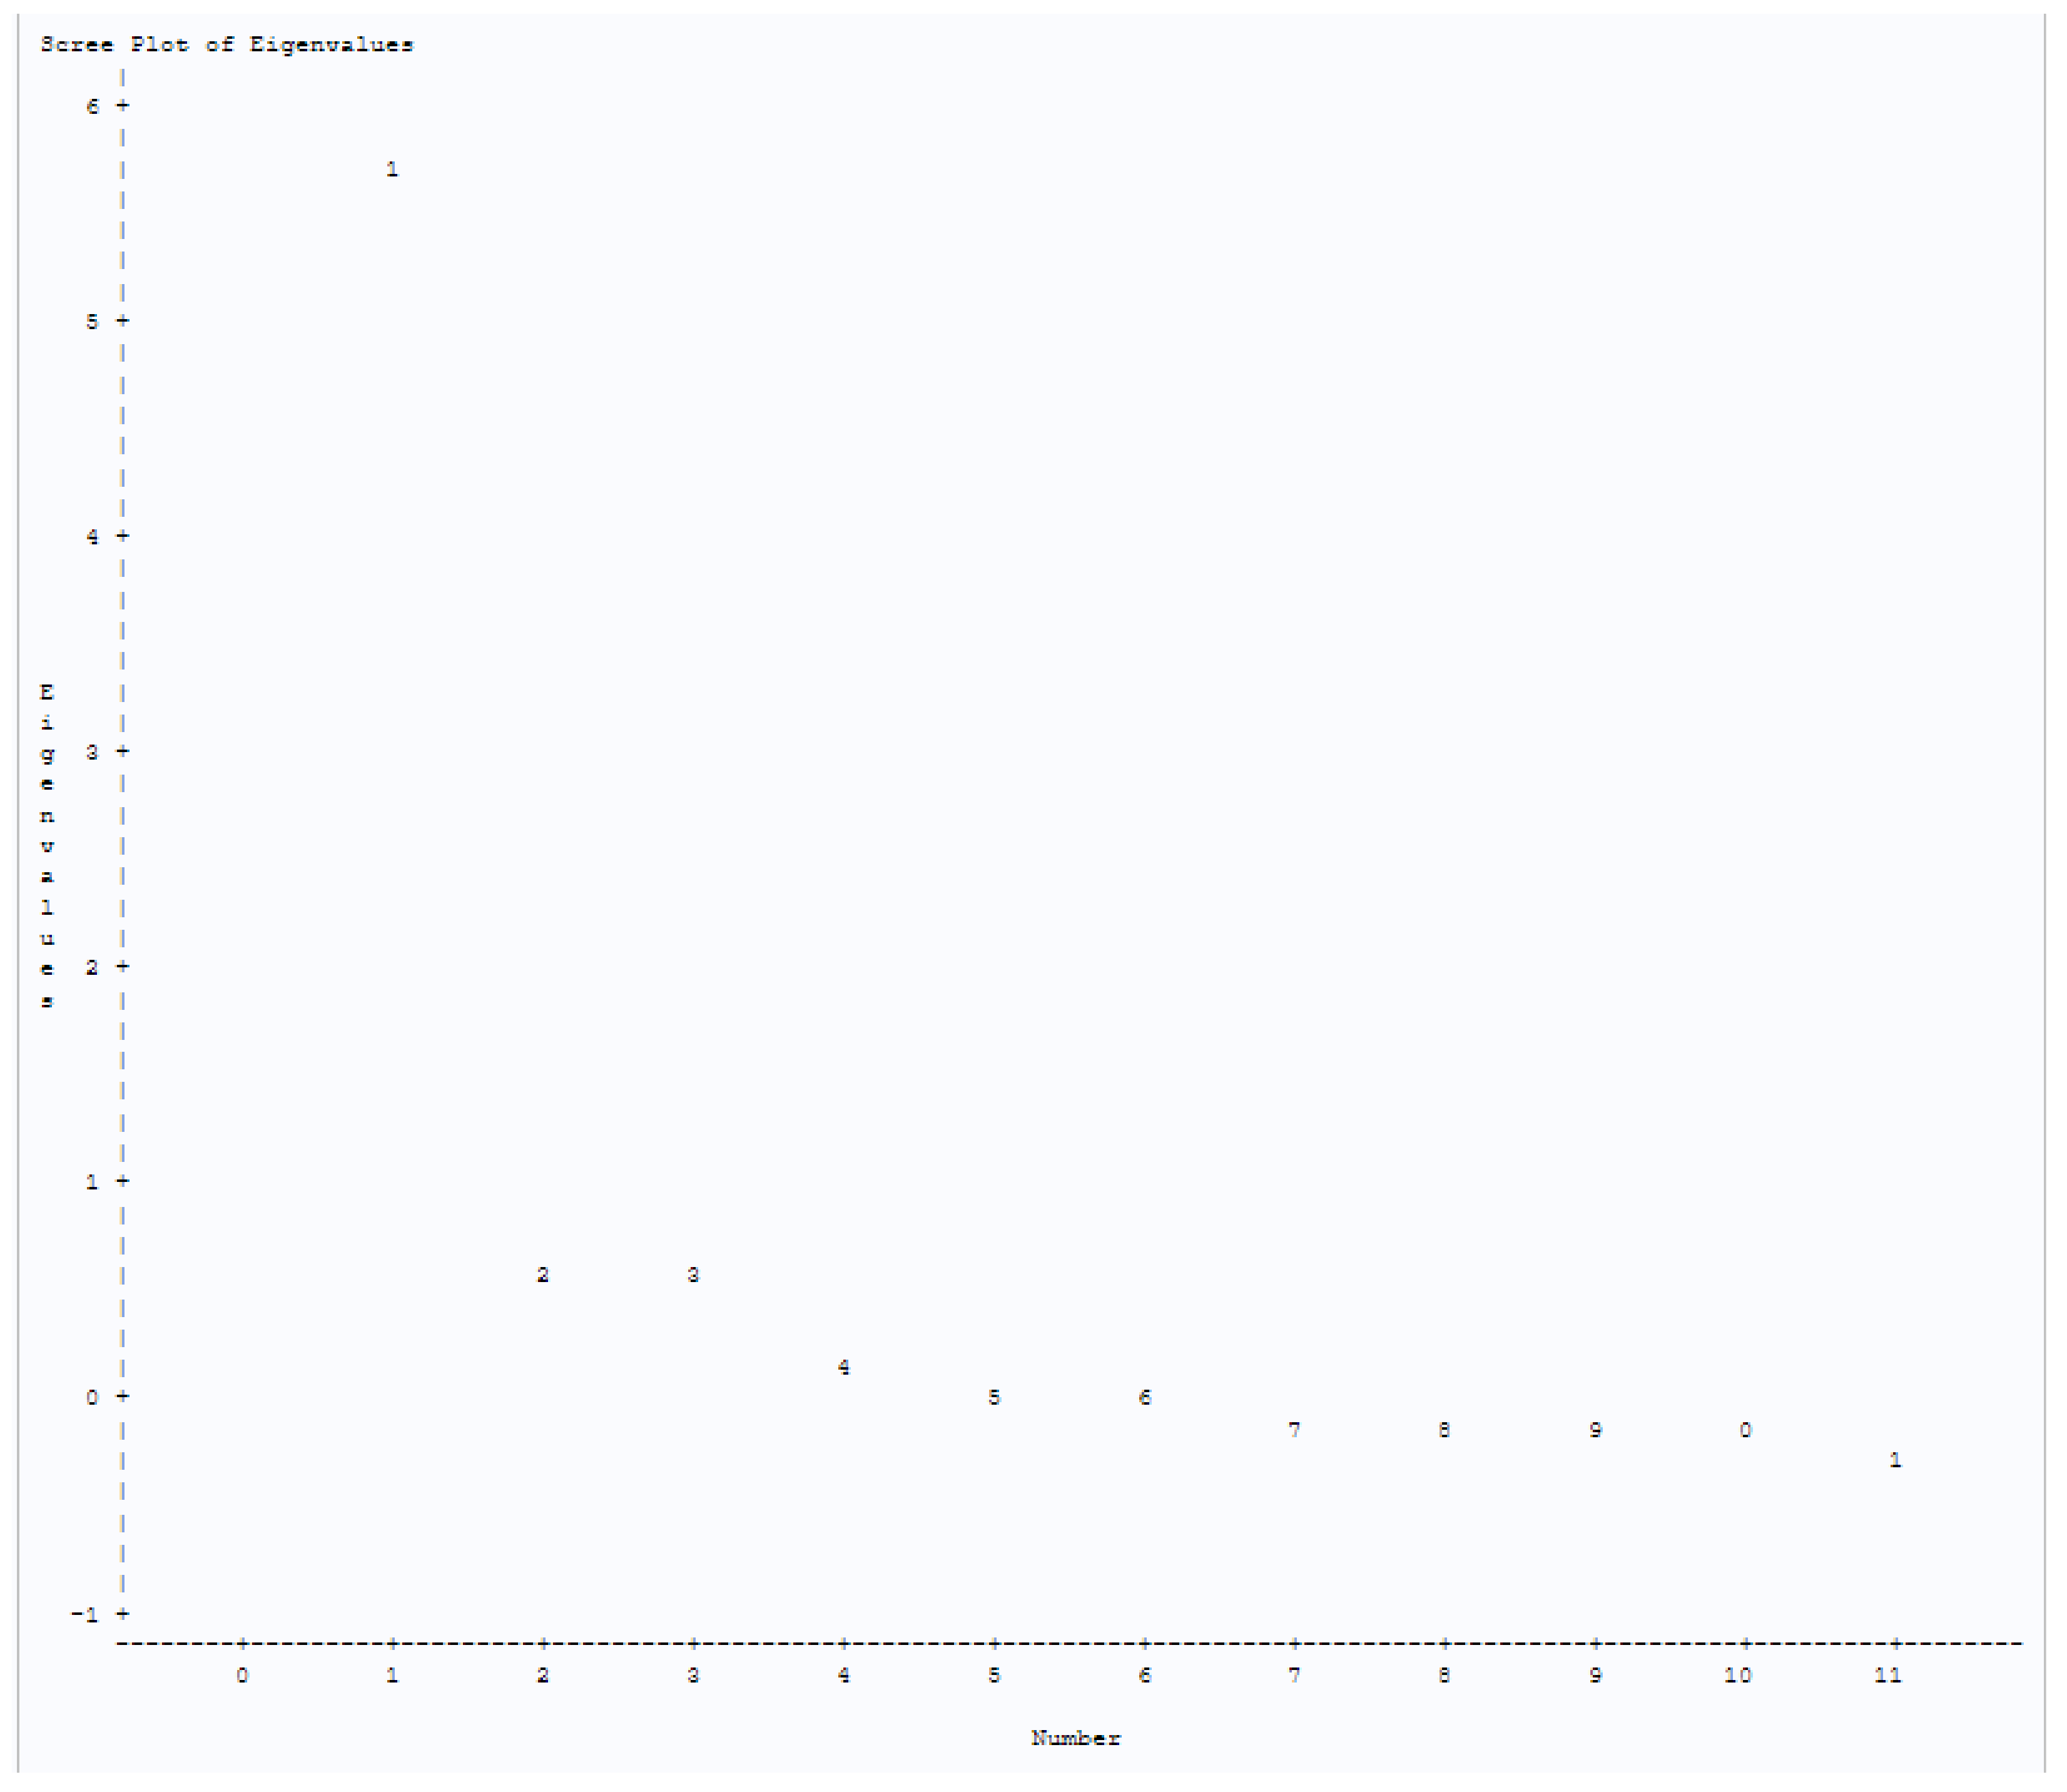
2.4. Statistical Analysis
3. Results
3.1. Survey Completion
3.2. Demographics and Vaccine History
3.3. COVID-19 Vaccine Hesitancy Domains
3.4. COVID-19 Vaccine Hesitancy by Student Demographics, Prior Vaccine Use, and Health Sciences Program
4. Discussion
5. Conclusions
Supplementary Materials
Author Contributions
Funding
Institutional Review Board Statement
Informed Consent Statement
Data Availability Statement
Acknowledgments
Conflicts of Interest
References
- Randall, T.; Sam, C.; Tartar, A.; Murray, P.; Cannon, C. More Than 11.9 Billion Shots Given: COVID-19 Tracker. Bloomberg. Available online: https://www.bloomberg.com/graphics/covid-vaccine-tracker-global-distribution/ (accessed on 1 June 2022).
- World Health Organization. Available online: https://www.who.int/emergencies/diseases/novel-coronavirus-2019/covid-19-vaccines (accessed on 25 May 2022).
- Burke, P.F.; Masters, D.; Massey, G. Enablers and barriers to COVID-19 vaccine uptake: An international study of perceptions and intentions. Vaccine 2021, 39, 5116–5128. [Google Scholar] [CrossRef] [PubMed]
- Neumann-Böhme, S.; Varghese, N.E.; Sabat, I.; Barros, P.P.; Brouwer, W.; Van Exel, J.; Schreyögg, J.; Stargardt, T. Once we have it, will we use it? A European survey on willingness to be vaccinated against COVID-19. Eur. J. Health Econ. 2020, 21, 977–982. [Google Scholar] [CrossRef] [PubMed]
- Wang, J.; Jing, R.; Lai, X.; Zhang, H.; Lyu, Y.; Knoll, M.D.; Fang, H. Acceptance of COVID-19 Vaccination during the COVID-19 Pandemic in China. Vaccines 2020, 8, 482. [Google Scholar] [CrossRef]
- Callaghan, T.; Moghtaderi, A.; Lueck, J.A.; Hotez, P.; Strych, U.; Dor, A.; Fowler, E.F.; Motta, M. Correlates and disparities of intention to vaccinate against COVID-19. Soc. Sci. Med. 2021, 272, 113638. [Google Scholar] [CrossRef] [PubMed]
- Larson, H.J.; De Figueiredo, A.; Xiahong, Z.; Schulz, W.S.; Verger, P.; Johnston, I.G.; Cook, A.R.; Jones, N.S. The State of Vaccine Confidence 2016: Global Insights Through a 67-Country Survey. EBioMedicine 2016, 12, 295–301. [Google Scholar] [CrossRef]
- Prickett, K.C.; Habibi, H.; Carr, P.A. COVID-19 Vaccine Hesitancy and Acceptance in a Cohort of Diverse New Zealanders. Lancet Reg. Health West. Pac. 2021, 14, 100241. [Google Scholar] [CrossRef]
- Albahri, A.H.; Alnaqbi, S.A.; Alshaali, A.O.; Shahdoor, S.M. COVID-19 Vaccine Acceptance in a Sample from the United Arab Emirates General Adult Population: A Cross-Sectional Survey, 2020. Front. Public Health 2021, 9, 614499. [Google Scholar] [CrossRef]
- Jamison, A.M.; Quinn, S.C.; Freimuth, V.S. “You don’t trust a government vaccine”: Narratives of institutional trust and influenza vaccination among African American and white adults. Soc. Sci. Med. 2018, 221, 87–94. [Google Scholar] [CrossRef]
- Reuben, R.; Aitken, D.; Freedman, J.L.; Einstein, G. Mistrust of the medical profession and higher disgust sensitivity predict parental vaccine hesitancy. PLoS ONE 2020, 15, e0237755. [Google Scholar] [CrossRef]
- Allen, J.D.; Feng, W.; Corlin, L.; Porteny, T.; Acevedo, A.; Schildkraut, D.; King, E.; Ladin, K.; Fu, Q.; Stopka, T.J. Why are some people reluctant to be vaccinated for COVID-19? A cross-sectional survey among U.S. Adults in May–June 2020. Prev. Med. Rep. 2021, 24, 101494. [Google Scholar] [CrossRef]
- Fu, C.; Wei, Z.; Pei, S.; Li, S.; Sun, X.; Liu, P. Acceptance and preference for COVID-19 vaccination in health-care workers: A Comparative Analysis and Discrete Choice Experiment. MedRxiv 2020. [Google Scholar] [CrossRef]
- Udow-Phillips, M.; Lantz, P.M. Trust in Public Health Is Essential Amid the COVID-19 Pandemic. J. Hosp. Med. 2020, 15, 431–433. [Google Scholar] [CrossRef] [PubMed]
- Biswas, N.; Mustapha, T.; Khubchandani, J.; Price, J.H. The Nature and Extent of COVID-19 Vaccination Hesitancy in Healthcare Workers. J. Community Health 2021, 46, 1244–1251. [Google Scholar] [CrossRef] [PubMed]
- Karafillakis, E.; Dinca, I.; Apfel, F.; Cecconi, S.; Wűrz, A.; Takacs, J.; Suk, J.; Celentano, L.P.; Kramarz, P.; Larson, H.J. Vaccine hesitancy among healthcare workers in Europe: A qualitative study. Vaccine 2016, 34, 5013–5020. [Google Scholar] [CrossRef] [PubMed]
- Roy, B.; Kumar, V.; Venkatesh, A. Health Care Workers’ Reluctance to Take the Covid-19 Vaccine: A Consumer-Marketing Approach to Identifying and Overcoming Hesitancy. NEJM Catalyst Innovations in Care Delivery 2020, 1, 6. [Google Scholar] [CrossRef]
- Courage, K.H. It’s Essential to Understand Why Some Health Care Workers Are Putting off Vaccination. Vox. Available online: https://www.vox.com/22214210/covid-vaccine-health-care-workers-safety-fears (accessed on 20 May 2022).
- Mustapha, T.; Khubchandani, J.; Biswas, N. COVID-19 Vaccination Hesitancy in Students and Trainees of Healthcare Professions: A Global Assessment and Call for Action. Brain Behav. Immun. Health 2021, 16, 100289. [Google Scholar] [CrossRef]
- Kelekar, A.K.; Lucia, V.C.; Afonso, N.M.; Mascarenhas, A.K. COVID-19 vaccine acceptance and hesitancy among dental and medical students. J. Am. Dent. Assoc. 2021, 152, 596–603. [Google Scholar] [CrossRef]
- Lucia, V.C.; Kelekar, A.; Afonso, N.M. COVID-19 vaccine hesitancy among medical students. J. Public Health 2020, 43, 445–449. [Google Scholar] [CrossRef]
- Manning, M.L.; Gerolamo, A.M.; Marino, M.A.; Hanson-Zalot, M.E.; Pogorzelska-Maziarz, M. COVID-19 vaccination readiness among nurse faculty and student nurses. Nurs. Outlook 2021, 69, 565–573. [Google Scholar] [CrossRef]
- Mascarenhas, A.K.; Lucia, V.C.; Kelekar, A.; Afonso, N.M. Dental students’ attitudes and hesitancy toward COVID-19 vaccine. J. Dent. Educ. 2021, 85, 1504–1510. [Google Scholar] [CrossRef]
- Larson, H.J.; Jarrett, C.; Eckersberger, E.; Smith, D.M.D.; Paterson, P. Understanding Vaccine Hesitancy around Vaccines and Vaccination from a Global Perspective: A Systematic Review of Published Literature, 2007–2012. Vaccine 2014, 32, 2150–2159. [Google Scholar] [CrossRef] [PubMed]
- WHO. Euro Working Group on Vaccine Communications, Istanbul, Turkey, 13–14 October 2011; WHO: Geneva, Switzerland.
- World Health Organization Regional Office for Europe. The Guide for Tailoring Immunization Programs. Increasing Coverage of Infant and Child Vaccination in the WHO European Region. Available online: https://www.euro.who.int/__data/assets/pdf_file/0003/187347/The-Guide-to-Tailoring-Immunization-Programmes-TIP.pdf (accessed on 8 September 2022).
- MacDonald, N.E.; The SAGE Working Group on Vaccine Hesitancy. Vaccine Hesitancy: Definition, Scope and Determinants. Vaccine 2015, 33, 4161–4164. [Google Scholar] [CrossRef] [PubMed]
- Akther, T.; Nur, T. A model of factors influencing COVID-19 vaccine acceptance: A synthesis of the theory of reasoned action, conspiracy theory belief, awareness, perceived usefulness, and perceived ease of use. PLoS ONE 2022, 17, e0261869. [Google Scholar] [CrossRef] [PubMed]
- Betsch, C.; Schmid, P.; Heinemeier, D.; Korn, L.; Holtmann, C.; Böhm, R. Beyond confidence: Development of a measure assessing the 5C psychological antecedents of vaccination. PLoS ONE 2018, 13, e0208601. [Google Scholar] [CrossRef]
- Thomson, A.; Robinson, K.; Vallée-Tourangeau, G. The 5As: A practical taxonomy for the determinants of vaccine uptake. Vaccine 2016, 34, 1018–1024. [Google Scholar] [CrossRef]
- U.S. Food and Drug Administration. FDA. Available online: https://www.fda.gov/emergency-preparedness-and-response/coronavirus-disease-2019-covid-19/covid-19-vaccines (accessed on 25 May 2022).
- Dommaraju, S.R.; Rivera, S.G.; Rocha, E.G.; Bicknell, S.; Loizzo, D.; Mohammad, A.; Rajan, P.; Seballos, A.; Datta, A.; Ahmed, R.; et al. Health professional students at the University of Illinois Chicago (HOLISTIC) Cohort Study: A protocol. PLoS ONE 2022, 17, e0269964. [Google Scholar] [CrossRef]
- Minority-Serving Institution Status. University of Illinois at Chicago. Available online: https://chancellor.uic.edu/minority-serving-designations/ (accessed on 25 June 2022).
- Centers for Disease Control and Prevention (CDC). Behavioral Risk Factor Surveillance System Survey Questionnaire. U.S. Department of Health and Human Services, Centers for Disease Control and Prevention. 2019. Available online: https://www.cdc.gov/brfss/questionnaires/pdf-ques/2019-BRFSS-Questionnaire-508.pdf (accessed on 29 March 2022).
- Report of the SAGE Working Group on Vaccine Hesitancy. World Health Organization. 2014. Available online: https://www.asset-scienceinsociety.eu/sites/default/files/sage_working_group_revised_report_vaccine_hesitancy.pdf (accessed on 2 September 2020).
- Shen, X.; Dong, H.; Feng, J.; Jiang, H.; Dowling, R.; Lu, Z.; Lv, C.; Gan, Y. Assessing the COVID-19 vaccine hesitancy in the Chinese adults using a generalized vaccine hesitancy survey instrument. Hum. Vaccines Immunother. 2021, 17, 4005–4012. [Google Scholar] [CrossRef]
- Sadaqat, W.; Habib, S.; Tauseef, A.; Akhtar, S.; Hayat, M.; Shujaat, S.A.; Mahmood, A. Determination of COVID-19 Vaccine Hesitancy Among University Students. Cureus 2021, 13, e17283. [Google Scholar] [CrossRef]
- Goffe, L.; Antonopoulou, V.; Meyer, C.J.; Graham, F.; Tang, M.Y.; Lecouturier, J.; Grimani, A.; Bambra, C.; Kelly, M.P.; Sniehotta, F.F. Factors associated with vaccine intention in adults living in England who either did not want or had not yet decided to be vaccinated against COVID-19. Hum. Vaccines Immunother. 2021, 17, 5242–5254. [Google Scholar] [CrossRef]
- Chen, J.-H.; Shiu, C.-S. Race, ethnicity and COVID-19 vaccine concerns: A latent class analysis of data during early phase of vaccination. SSM Popul. Health 2022, 18, 101073. [Google Scholar] [CrossRef]
- Swann, M.C.; Bendetson, J.; Johnson, A.; Jatta, M.; Schleupner, C.J.; Baffoe-Bonnie, A. Examining Drivers of COVID-19 Vaccine Hesitancy Among Healthcare Workers. Infect. Control Hosp. Epidemiol. 2022, 1–9. [Google Scholar] [CrossRef] [PubMed]
- Gautier, S.; Luyt, D.; Davido, B.; Herr, M.; Cardot, T.; Rousseau, A.; Annane, D.; Delarocque-Astagneau, E.; Josseran, L. Cross-sectional study on COVID-19 vaccine hesitancy and determinants in healthcare students: Interdisciplinary trainings on vaccination are needed. BMC Med. Educ. 2022, 22, 299. [Google Scholar] [CrossRef] [PubMed]
- Yendewa, S.A.; Ghazzawi, M.; James, P.B.; Smith, M.; Massaquoi, S.P.; Babawo, L.S.; Deen, G.F.; Russell, J.B.W.; Samai, M.; Sahr, F.; et al. COVID-19 Vaccine Hesitancy among Healthcare Workers and Trainees in Freetown, Sierra Leone: A Cross-Sectional Study. Vaccines 2022, 10, 757. [Google Scholar] [CrossRef] [PubMed]
- Wick, J.A.; Henneman, A. Pharmacy student perceptions of their preparedness to address vaccine hesitancy and refusal. Curr. Pharm. Teach. Learn. 2021, 13, 1324–1331. [Google Scholar] [CrossRef] [PubMed]
- Robertson, E.; Reeve, K.S.; Niedzwiedz, C.L.; Moore, J.; Blake, M.; Green, M.; Katikireddi, S.V.; Benzeval, M.J. Predictors of COVID-19 vaccine hesitancy in the UK household longitudinal study. Brain, Behav. Immun. 2021, 94, 41–50. [Google Scholar] [CrossRef] [PubMed]
- Saied, S.M.; Saied, E.M.; Kabbash, I.A.; Abdo, S.A.E. Vaccine hesitancy: Beliefs and barriers associated with COVID-19 vaccination among Egyptian medical students. J. Med Virol. 2021, 93, 4280–4291. [Google Scholar] [CrossRef] [PubMed]
- Sandler, K.; Srivastava, T.; Fawole, O.A.; Fasano, C.; Feemster, K.A. Understanding vaccine knowledge, attitudes, and decision-making through college student interviews. J. Am. Coll. Health 2019, 68, 593–602. [Google Scholar] [CrossRef] [PubMed]
- Domek, G.J.; O’Leary, S.T.; Bull, S.; Bronsert, M.; Contreras-Roldan, I.L.; Ventura, G.A.B.; Kempe, A.; Asturias, E.J. Measuring vaccine hesitancy: Field testing the WHO SAGE Working Group on Vaccine Hesitancy survey tool in Guatemala. Vaccine 2018, 36, 5273–5281. [Google Scholar] [CrossRef]
- Shapiro, G.K.; Tatar, O.; Dube, E.; Amsel, R.; Knauper, B.; Naz, A.; Perez, S.; Rosberger, Z. The vaccine hesitancy scale: Psychometric properties and validation. Vaccine 2018, 36, 660–667. [Google Scholar] [CrossRef]
- U.S. Food and Drug Administration. Available online: https://www.fda.gov/news-events/press-announcements/fda-takes-key-action-fight-against-covid-19-issuing-emergency-use-authorization-first-covid (accessed on 5 July 2022).
- U.S. Food and Drug Administration. Available online: https://www.fda.gov/news-events/press-announcements/fda-takes-additional-action-fight-against-covid-19-issuing-emergency-use-authorization-second-covid (accessed on 5 July 2022).
- U.S. Food and Drug Administration. Available online: https://www.fda.gov/news-events/press-announcements/fda-approves-first-covid-19-vaccine#:~:text=Since%20Dec (accessed on 5 July 2022).
- U.S. Food and Drug Administration. Available online: https://www.fda.gov/news-events/press-announcements/coronavirus-covid-19-update-fda-takes-key-action-approving-second-covid-19-vaccine (accessed on 5 July 2022).


| All | Applied Health | Dentistry | Medicine | Nursing | Pharmacy | Public Health | Social Work | |
|---|---|---|---|---|---|---|---|---|
| (n = 555) | (n = 93) | (n = 45) | (n = 133) | (n = 101) | (n = 85) | (n = 48) | (n = 50) | |
| Race/Ethnicity | ||||||||
| White, Not Hispanic | 259 (48.9%) | 51 (56.0%) | 14 (34.1%) | 60 (47.2%) | 64 (65.3%) | 23 (28.4%) | 23 (51.1%) | 24 (51.1%) |
| Asian, Not Hispanic | 132 (24.9%) | 4 (8.5%) | 15 (36.6%) | 33 (26.0%) | 15 (15.3%) | 35 (43.2%) | 7 (15.6%) | 4 (8.5%) |
| African American, Not Hispanic | 24 (4.5%) | 3 (6.4%) | 4 (9.8%) | 6 (4.7%) | 3 (3.1%) | 5 (6.2%) | 2 (4.4%) | 3 (6.4%) |
| Other Race, Not Hispanic | 43 (8.1%) | 4 (8.5%) | 6 (14.6%) | 11 (8.7%) | 5 (5.1%) | 10 (12.3%) | 1 (2.2%) | 4 (8.5%) |
| Hispanic | 72 (13.6%) | 12 (25.5%) | 2 (4.9%) | 17 (13.4%) | 11 (11.2%) | 8 (9.9%) | 12 (26.7%) | 12 (25.5%) |
| Age | ||||||||
| 20–29 years | 391 (74.9%) | 73 (83.0%) | 22 (52.4%) | 109 (87.2%) | 57 (60.6%) | 68 (87.2%) | 37 (78.7%) | 27 (56.3%) |
| >=30 years | 131 (25.1%) | 15 (17.0%) | 20 (47.6%) | 16 (12.8%) | 37 (39.4%) | 10 (12.8%) | 10 (21.3%) | 21 (43.7%) |
| Gender | ||||||||
| Male | 111 (20%) | 17 (18.3%) | 32 (72.7%) | 45 (33.8%) | 7 (6.9%) | 26 (30.6%) | 3 (6.3%) | 2 (4.0%) |
| Female | 438 (79.1%) | 76 (81.7%) | 11 (25.0%) | 86 (64.7%) | 93 (92.1%) | 58 (68.2%) | 45 (93.7%) | 48 (96.0%) |
| Other Response | 5 (0.9%) | 0 (0.0%) | 1 (2.3%) | 2 (1.5%) | 1 (1.0%) | 1 (1.2%) | 0 (0.0%) | 0 (0.0% |
| Prior Vaccine History (any vaccine) | ||||||||
| <= 2 vaccines | 242 (43.7%) | 42 (45.2%) | 23 (51.1%) | 40 (30.3%) | 37 (36.6%) | 40 (47.1%) | 29 (60.4%) | 31 (62.0%) |
| >2 vaccines | 312 (56.3%) | 51 (54.8%) | 22 (48.9%) | 92 (69.7%) | 64 (63.4%) | 45 (52.9%) | 19 (39.6%) | 19 (38.0%) |
| Healthcare Provider | ||||||||
| Yes | 380 (70.4%) | 64 (70.3%) | 32 (74.4%) | 91 (70.5%) | 78 (80.4%) | 52 (63.4%) | 33 (68.8%) | 30 (60.0%) |
| No | 160 (29.6%) | 27 (29.7%) | 11 (25.6%) | 38 (29.5%) | 17 (19.6%) | 30 (36.6%) | 15 (31.2%) | 20 (40.0%) |
| Could Not See Doctor Because of Costs | ||||||||
| Yes | 90 (16.8%) | 12 (13.0%) | 10 (23.3%) | 19 (15.2%) | 19 (19.2%) | 10 (12.3%) | 9 (18.7%) | 11 (22.5%) |
| No | 447 (83.2%) | 80 (87.0%) | 33 (76.7%) | 106 (84.8%) | 80 (80.8%) | 71 (87.7%) | 39 (81.3%) | 38 (77.5%) |
| Last Visit to Doctor for Routine Checkup | ||||||||
| <1 year ago | 329 (61.0%) | 55 (61.8%) | 24 (54.5%) | 72 (57.6%) | 65 (65.0%) | 49 (58.3%) | 32 (68.1%) | 32 (64.0%) |
| >= 1 year ago | 210 (39.0%) | 34 (38.2%) | 20 (45.5%) | 57 (42.4%) | 35 (35.0%) | 35 (41.7%) | 15 (31.9%) | 18 (36.0%) |
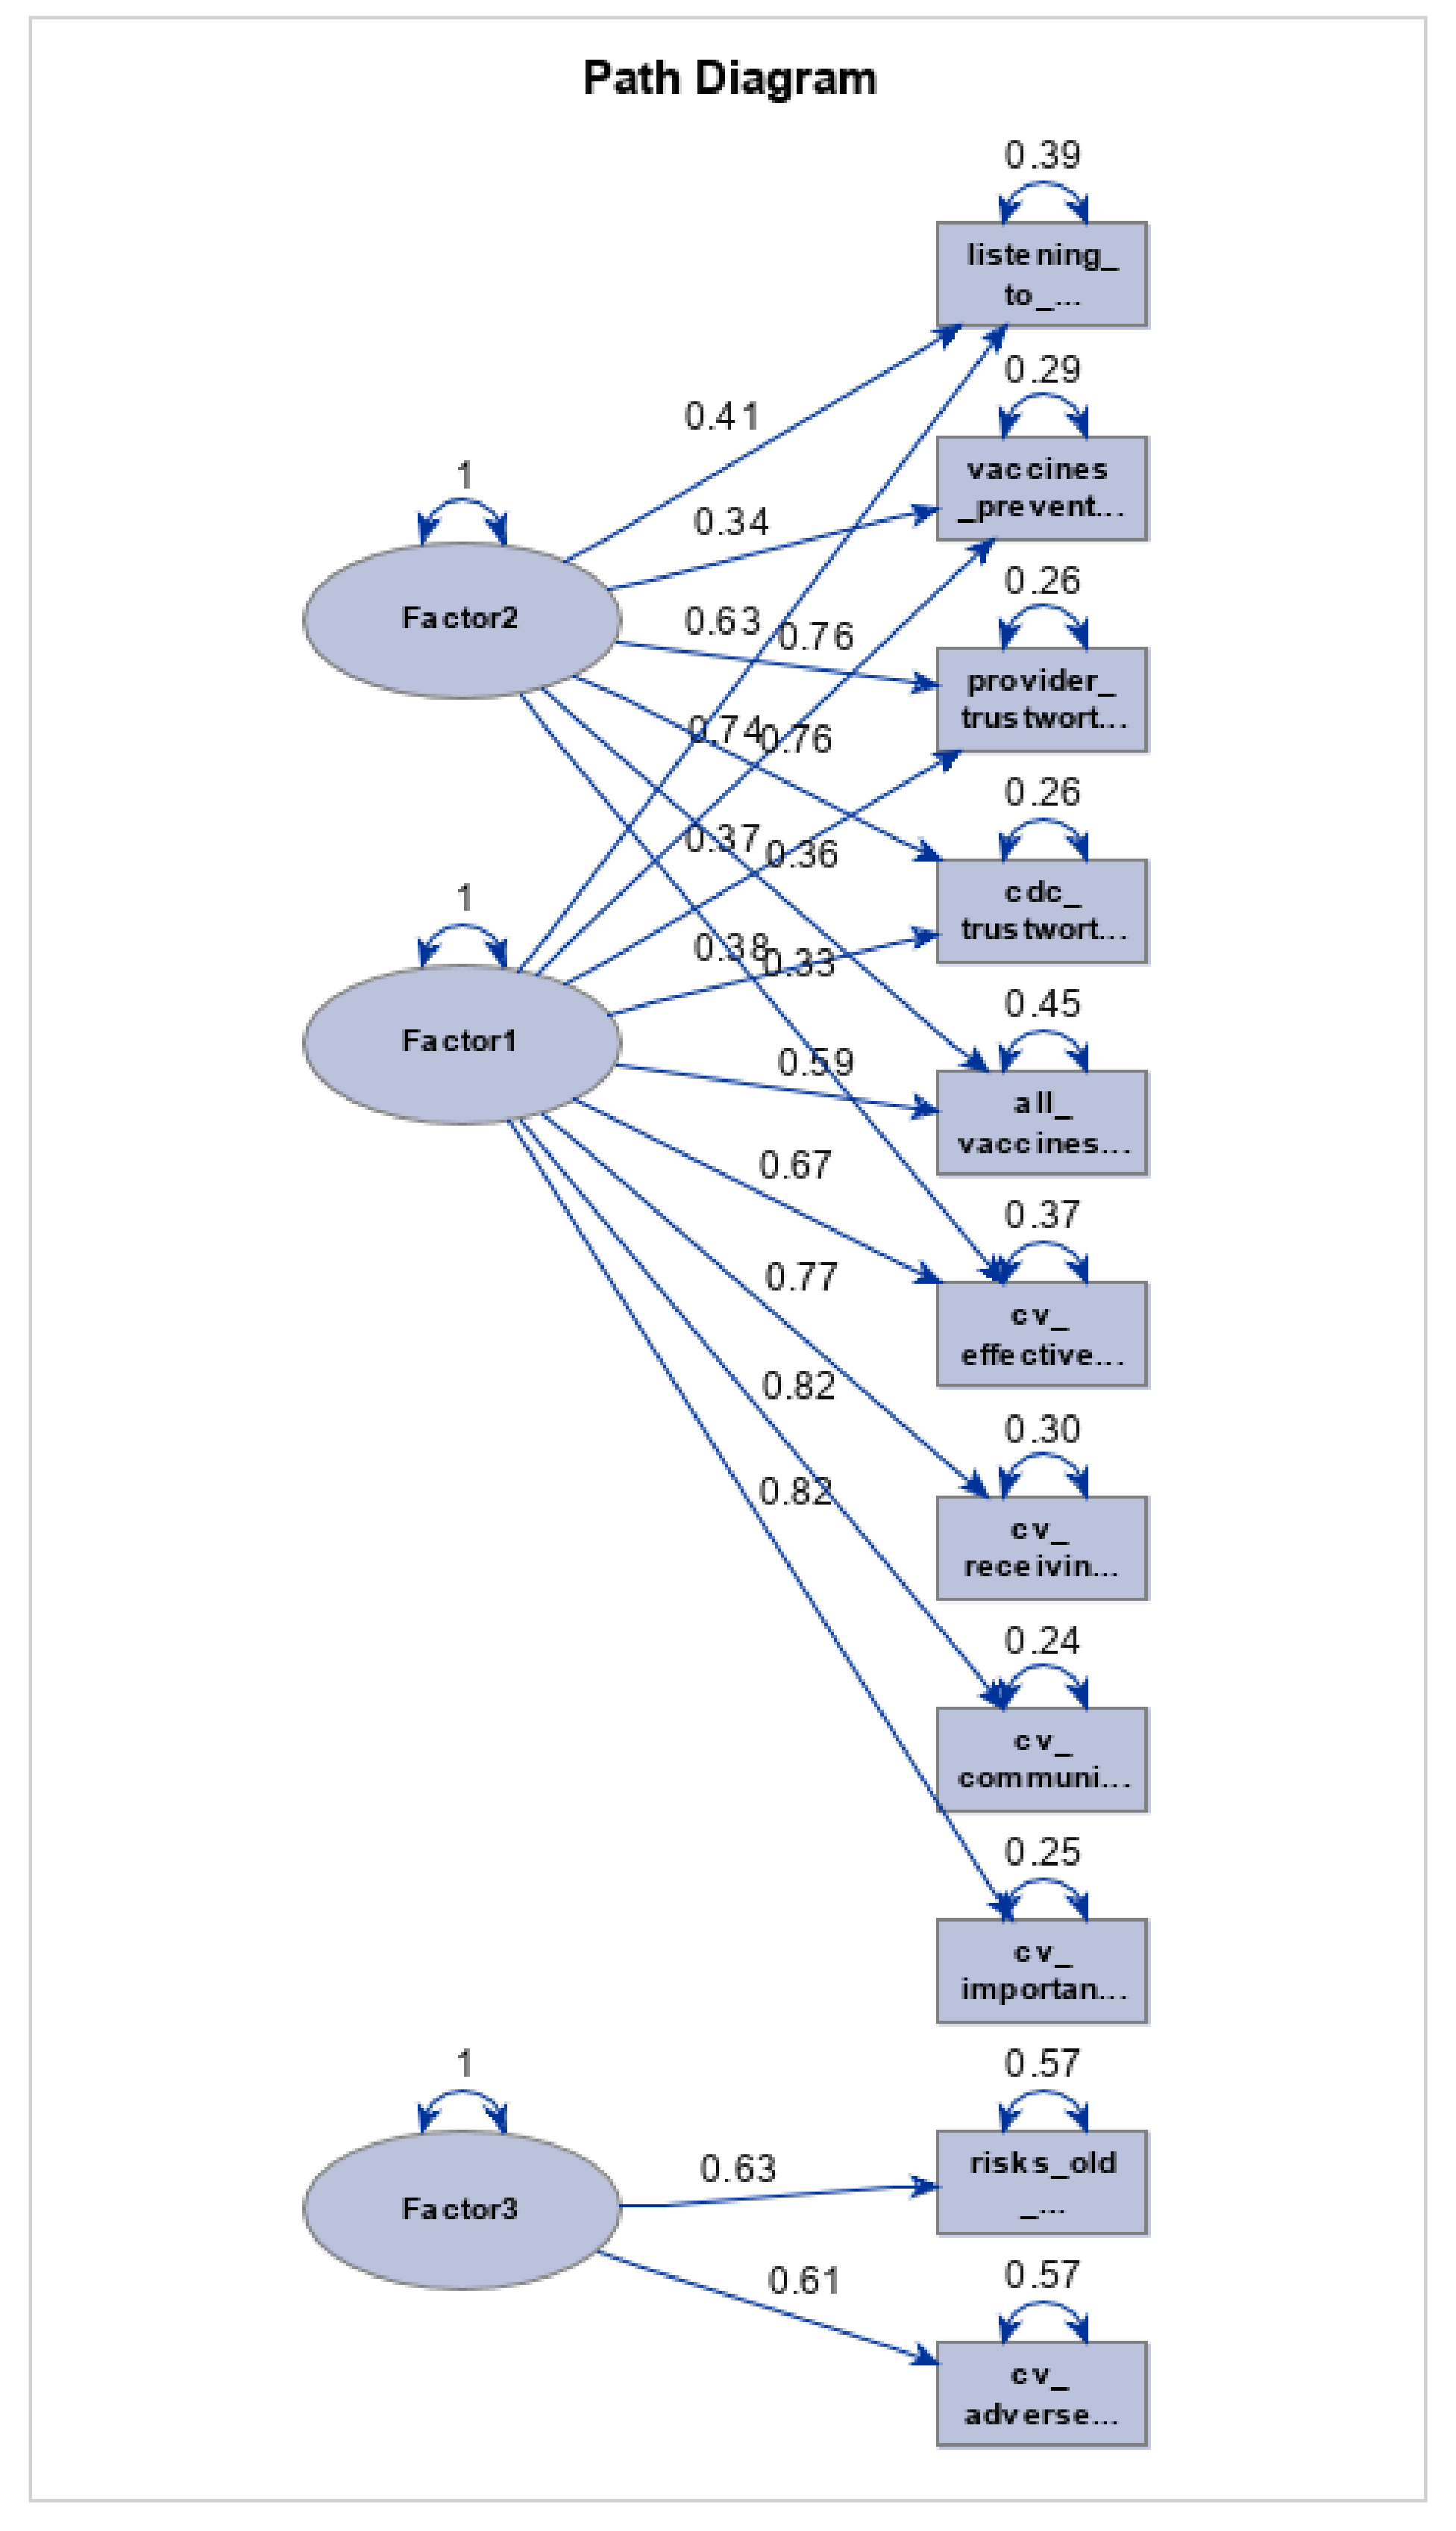
| Factors | Factor Score | Reliability |
|---|---|---|
| Factor 1: Benefit | ||
| Being vaccinated for COVID-19 or coronavirus would be important for the health of others in my community | 0.83 | 0.92 |
| A vaccine developed for COVID-19 or coronavirus would be important for my health | 0.83 | |
| I would receive a vaccine developed for COVID-19 or coronavirus | 0.71 | |
| Getting vaccines is a good way to protect me from disease | 0.69 | |
| A vaccine developed for COVID-19 or coronavirus would be effective | 0.65 | |
| All vaccines offered by the government program in my community are beneficial | 0.53 | |
| Factor 2: Trustworthy | ||
| The information I receive about vaccines from my doctor or healthcare provider is reliable and trustworthy | 0.78 | 0.87 |
| The information I receive about vaccines from public health officials is reliable and trustworthy | 0.73 | |
| Generally, I do what my doctor or healthcare provider recommends about vaccines | 0.56 | |
| Factor 3: Risk Concern | ||
| I would be concerned about serious adverse effects of a vaccine developed for COVID-19 or coronavirus | 0.59 | 0.64 |
| New vaccines carry more risks than older vaccines | 0.58 |
| Construct | Variables Removed | # of Variables Removed | Total Variables |
|---|---|---|---|
| 1 | None (original model with three factors) | 0 | 11 |
| 2 | Removal of question: getting vaccines is a good way to protect me from disease from Factor 1 | 1 | 10 |
| 3 | Removal of question: generally, I do what my doctor or healthcare provider recommends about vaccines from Factor 2 | 1 | 10 |
| 4 | Variables from Models 2 + 3 | 2 | 9 |
| 5 | Removal of questions: I would be concerned about serious adverse effects of a vaccine developed for COVID-19 or coronavirus and new vaccines carry more risks than older vaccines from Factor 3 | 2 | 9 |
| 6 | Variables from Models 4 + 5 | 4 | 7 |
| Fit Summary | Construct 1 | Construct 2 | Construct 3 | Construct 4 | Construct 5 | Construct 6 |
|---|---|---|---|---|---|---|
| Baseline Model Chi-Square (p-value) a | <0.001 | <0.001 | <0.001 | <0.001 | <0.001 | <0.001 |
| Chi-Square for Absolute Index (p-value) a | <0.001 | <0.001 | <0.001 | <0.001 | <0.001 | <0.001 |
| GFI b | 0.9100 | 0.9259 | 0.9464 | 0.9654 | 0.9000 | 0.9658 |
| AGFI b | 0.8552 | 0.8726 | 0.9079 | 0.9351 | 0.8269 | 0.9263 |
| RMSEA c | 0.1123 | 0.1113 | 0.0850 | 0.0750 | 0.1374 | 0.0908 |
| High vs. Low Health Benefit | Medium vs. Low Health Benefit | |||
|---|---|---|---|---|
| Variables | OR (CI) | p-value | OR (CI) | p-Value |
| Race/Ethnicity (ref = White, Not Hispanic) | ||||
| White, Not Hispanic | - | - | - | - |
| Asian, Not Hispanic | 1.18 (0.62–2.28) | 0.613 | 1.22 (0.60–2.45) | 0.585 |
| African American, Not Hispanic | 0.37 (0.13–1.41) | 0.585 | 0.42 (0.13–1.41) | 0.161 |
| Other Races, Not Hispanic | 0.84 (0.35–2.03) | 0.694 | 0.91 (0.35–2.34) | 0.841 |
| Hispanic | 0.43 (0.21–0.90) | 0.026 | 0.63 (0.30–1.34) | 0.232 |
| Prior Vaccine History (ref = ‘ <= 2 vaccines’) | ||||
| <= 2 vaccines | - | - | - | - |
| > 2 vaccines | 2.50 (1.50–4.15) | <0.001 | 1.66 (0.97–2.85) | 0.067 |
| Age (ref = ‘20–29’) | ||||
| 20–29 years | - | - | - | - |
| >=30 years | 1.10 (0.61–1.99) | 0.755 | 0.86 (0.45–1.63) | 0.634 |
| Health Science College (ref = ’Medicine’) | ||||
| Medicine | - | - | - | - |
| Applied Health Science | 0.43 (0.19–0.96) | 0.040 | 0.78 (0.32–1.87) | 0.574 |
| Dentistry | 0.42 (0.15–1.17) | 0.098 | 0.81 (0.27–2.40) | 0.699 |
| Nursing | 0.35 (0.16–0.78) | 0.011 | 0.54 (0.22–1.31) | 0.172 |
| Pharmacy | 0.38 (0.17–0.87) | 0.022 | 0.56 (0.22–1.40) | 0.213 |
| Public Health | 1.30 (0.40–4.24) | 0.659 | 2.55 (0.76–8.62) | 0.132 |
| Social Work | 0.30 (0.11–0.78) | 0.014 | 0.72 (0.27–1.96) | 0.523 |
| Healthcare Provider (ref = ‘No’) | ||||
| No | - | - | - | - |
| Yes | 0.69 (0.39–1.22) | 0.202 | 0.86 (0.46–1.61) | 0.633 |
| Could Not See Doctor Because of Costs (ref = ‘No’) | ||||
| No | - | - | - | - |
| Yes | 0.87 (0.45–1.66) | 0.662 | 0.85 (0.42–1.70) | 0.638 |
| Last Visit to Doctor for Routine Checkup (ref = ‘<= 1 year ago’) | ||||
| 1 year ago | - | - | - | - |
| >1 year ago | 0.83 (0.48–1.42) | 0.499 | 0.76 (0.43–1.36) | 0.358 |
| High vs. Low Trustworthy | Medium vs. Low Trustworthy | |||
|---|---|---|---|---|
| Variables | OR (CI) | p-Value | OR (CI) | p-Value |
| Race/Ethnicity (ref = White, Not Hispanic) | ||||
| White, Not Hispanic | - | - | - | - |
| Asian, Not Hispanic | 0.91 (0.45–1.82) | 0.785 | 1.30 (0.62–2.71) | 0.483 |
| African American, Not Hispanic | 0.54 (0.17–1.73) | 0.297 | 0.89 (0.26–3.02) | 0.845 |
| Other Races, Not Hispanic | 0.74 (0.28–1.93) | 0.534 | 1.23 (0.46–3.32) | 0.681 |
| Hispanic | 0.64 (0.28–1.47) | 0.292 | 1.35 (0.59–3.09) | 0.472 |
| Prior Vaccine History (ref = ‘<= 2 vaccines’) | ||||
| <=2 vaccines | - | - | - | - |
| >2 vaccines | 2.71 (1.56–4.72) | <0.001 | 2.55 (1.43–4.56) | 0.002 |
| Age Group (ref = ‘20–29′) | ||||
| 20–29 | - | - | - | - |
| >=30 | 1.13 (0.60–2.14) | 0.697 | 0.97 (0.50–1.89) | 0.927 |
| Health Science College (ref = ‘Medicine’) | ||||
| Medicine | - | - | - | - |
| Applied Health Science | 0.39 (0.17–0.94) | 0.035 | 0.70 (0.28–1.78) | 0.457 |
| Dentistry | 0.27 (0.10–0.76) | 0.013 | 0.40 (0.13–1.24) | 0.112 |
| Nursing | 0.38 (0.16–0.94) | 0.037 | 0.89 (0.35–2.30) | 0.810 |
| Pharmacy | 0.71 (0.27–1.87) | 0.493 | 0.99 (0.36–2.74) | 0.980 |
| Public Health | 1.25 (0.38–4.11) | 0.714 | 1.38 (0.39–4.94) | 0.621 |
| Social Work | 0.31 (0.11–0.86) | 0.025 | 0.75 (0.26–2.13) | 0.457 |
| Healthcare Provider (ref = ‘No’) | ||||
| No | - | - | - | - |
| Yes | 1.22 (0.66–2.25) | 0.534 | 1.02 (0.53–1.93) | 0.961 |
| Could Not See Doctor Because of Costs (ref = ‘No’) | ||||
| No | - | - | - | - |
| Yes | 0.50 (0.26–0.97) | 0.041 | 0.52 (0.26–1.04) | 0.065 |
| Last Visit to Doctor for Routine Checkup (ref = ‘<= 1 year ago’) | ||||
| 1 year ago | - | - | - | - |
| >1 year ago | 1.10 (0.61–1.98) | 0.747 | 1.00 (0.54–1.85) | 0.996 |
| High vs. Low Risk Concern | Medium vs. Low Risk Concern | |||
|---|---|---|---|---|
| Variables | OR (CI) | p-Value | OR (CI) | p-Value |
| Race/Ethnicity (ref = White, Not Hispanic) | ||||
| White, Not Hispanic | - | - | - | - |
| Asian, Not Hispanic | 3.10 (1.49–6.48) | 0.003 | 2.45 (1.37–4.40) | 0.003 |
| African American, Not Hispanic | 2.78 (0.76–10.13) | 0.121 | 1.49 (0.50–4.44) | 0.472 |
| Other Races, Not Hispanic | 1.35 (0.49–3.71) | 0.556 | 1.15 (0.53–2.49) | 0.719 |
| Hispanic | 2.34 (1.01–5.42) | 0.048 | 1.39 (0.70–2.73) | 0.345 |
| Prior Vaccine History (ref = ‘<= 2 vaccines’) | ||||
| <=2 vaccines | - | - | - | - |
| >2 vaccines | 0.69 (0.39–1.23) | 0.209 | 0.87 (0.55–1.36) | 0.535 |
| Age Group (ref = ‘20–29’) | ||||
| 20–29 | - | - | - | - |
| >=30 | 0.66 (0.33–1.34) | 0.249 | 0.82 (0.48–1.40) | 0.470 |
| Health Science College (ref = ‘Medicine’) | ||||
| Medicine | - | - | - | - |
| Applied Health Science | 2.80 (1.15–6.81) | 0.023 | 1.49 (0.77–2.89) | 0.234 |
| Dentistry | 9.12 (2.80–29.75) | <0.001 | 2.82 (0.99–8.03) | 0.052 |
| Nursing | 3.77 (1.47–9.65) | 0.006 | 2.71 (1.35–5.42) | 0.005 |
| Pharmacy | 2.06 (0.80–5.33) | 0.136 | 1.53 (0.77–3.05) | 0.227 |
| Public Health | 1.10 (0.32–3.77) | 0.879 | 1.49 (0.68–3.30) | 0.323 |
| Social Work | 3.14 (1.02–9.67) | 0.046 | 2.41 (1.04–5.57) | 0.040 |
| Healthcare Provider (ref = ‘No’) | ||||
| No | - | - | - | - |
| Yes | 2.04 (1.03–4.03) | 0.040 | 1.29 (0.79–2.11) | 0.305 |
| Could Not See Doctor Because of Costs (ref = ‘No’) | ||||
| No | - | - | - | - |
| Yes | 1.67 (0.80–3.45) | 0.170 | 0.95 (0.52–1.75) | 0.865 |
| Last Visit to Doctor for Routine Checkup (ref = ‘<= 1 year ago’) | ||||
| 1 year ago | - | - | - | - |
| >1 year ago | 1.24 (0.66–2.30) | 0.503 | 1.25 (0.78–2.02) | 0.358 |
Publisher’s Note: MDPI stays neutral with regard to jurisdictional claims in published maps and institutional affiliations. |
© 2022 by the authors. Licensee MDPI, Basel, Switzerland. This article is an open access article distributed under the terms and conditions of the Creative Commons Attribution (CC BY) license (https://creativecommons.org/licenses/by/4.0/).
Share and Cite
Loizzo, D.D.; Datta, A.; Dommaraju, S.R.; Abdulbaseer, U.; Krishnan, J.A.; Keehn, M.; Ahmed, R. COVID-19 Vaccine Hesitancy among Health Professional Students: Cross-Sectional Data from the First Wave of the HOLISTIC Cohort Study. Vaccines 2022, 10, 1566. https://doi.org/10.3390/vaccines10091566
Loizzo DD, Datta A, Dommaraju SR, Abdulbaseer U, Krishnan JA, Keehn M, Ahmed R. COVID-19 Vaccine Hesitancy among Health Professional Students: Cross-Sectional Data from the First Wave of the HOLISTIC Cohort Study. Vaccines. 2022; 10(9):1566. https://doi.org/10.3390/vaccines10091566
Chicago/Turabian StyleLoizzo, Daniel D., Avisek Datta, Sunil R. Dommaraju, Ummesalmah Abdulbaseer, Jerry A. Krishnan, Mary Keehn, and Rashid Ahmed. 2022. "COVID-19 Vaccine Hesitancy among Health Professional Students: Cross-Sectional Data from the First Wave of the HOLISTIC Cohort Study" Vaccines 10, no. 9: 1566. https://doi.org/10.3390/vaccines10091566
APA StyleLoizzo, D. D., Datta, A., Dommaraju, S. R., Abdulbaseer, U., Krishnan, J. A., Keehn, M., & Ahmed, R. (2022). COVID-19 Vaccine Hesitancy among Health Professional Students: Cross-Sectional Data from the First Wave of the HOLISTIC Cohort Study. Vaccines, 10(9), 1566. https://doi.org/10.3390/vaccines10091566