
An Economic Evaluation of the Adjuvanted Quadrivalent Influenza Vaccine Compared with Standard-Dose Quadrivalent Influenza Vaccine in the Spanish Older Adult Population


 , ,
, ,
Abstract
:1. Introduction
2. Materials and Methods
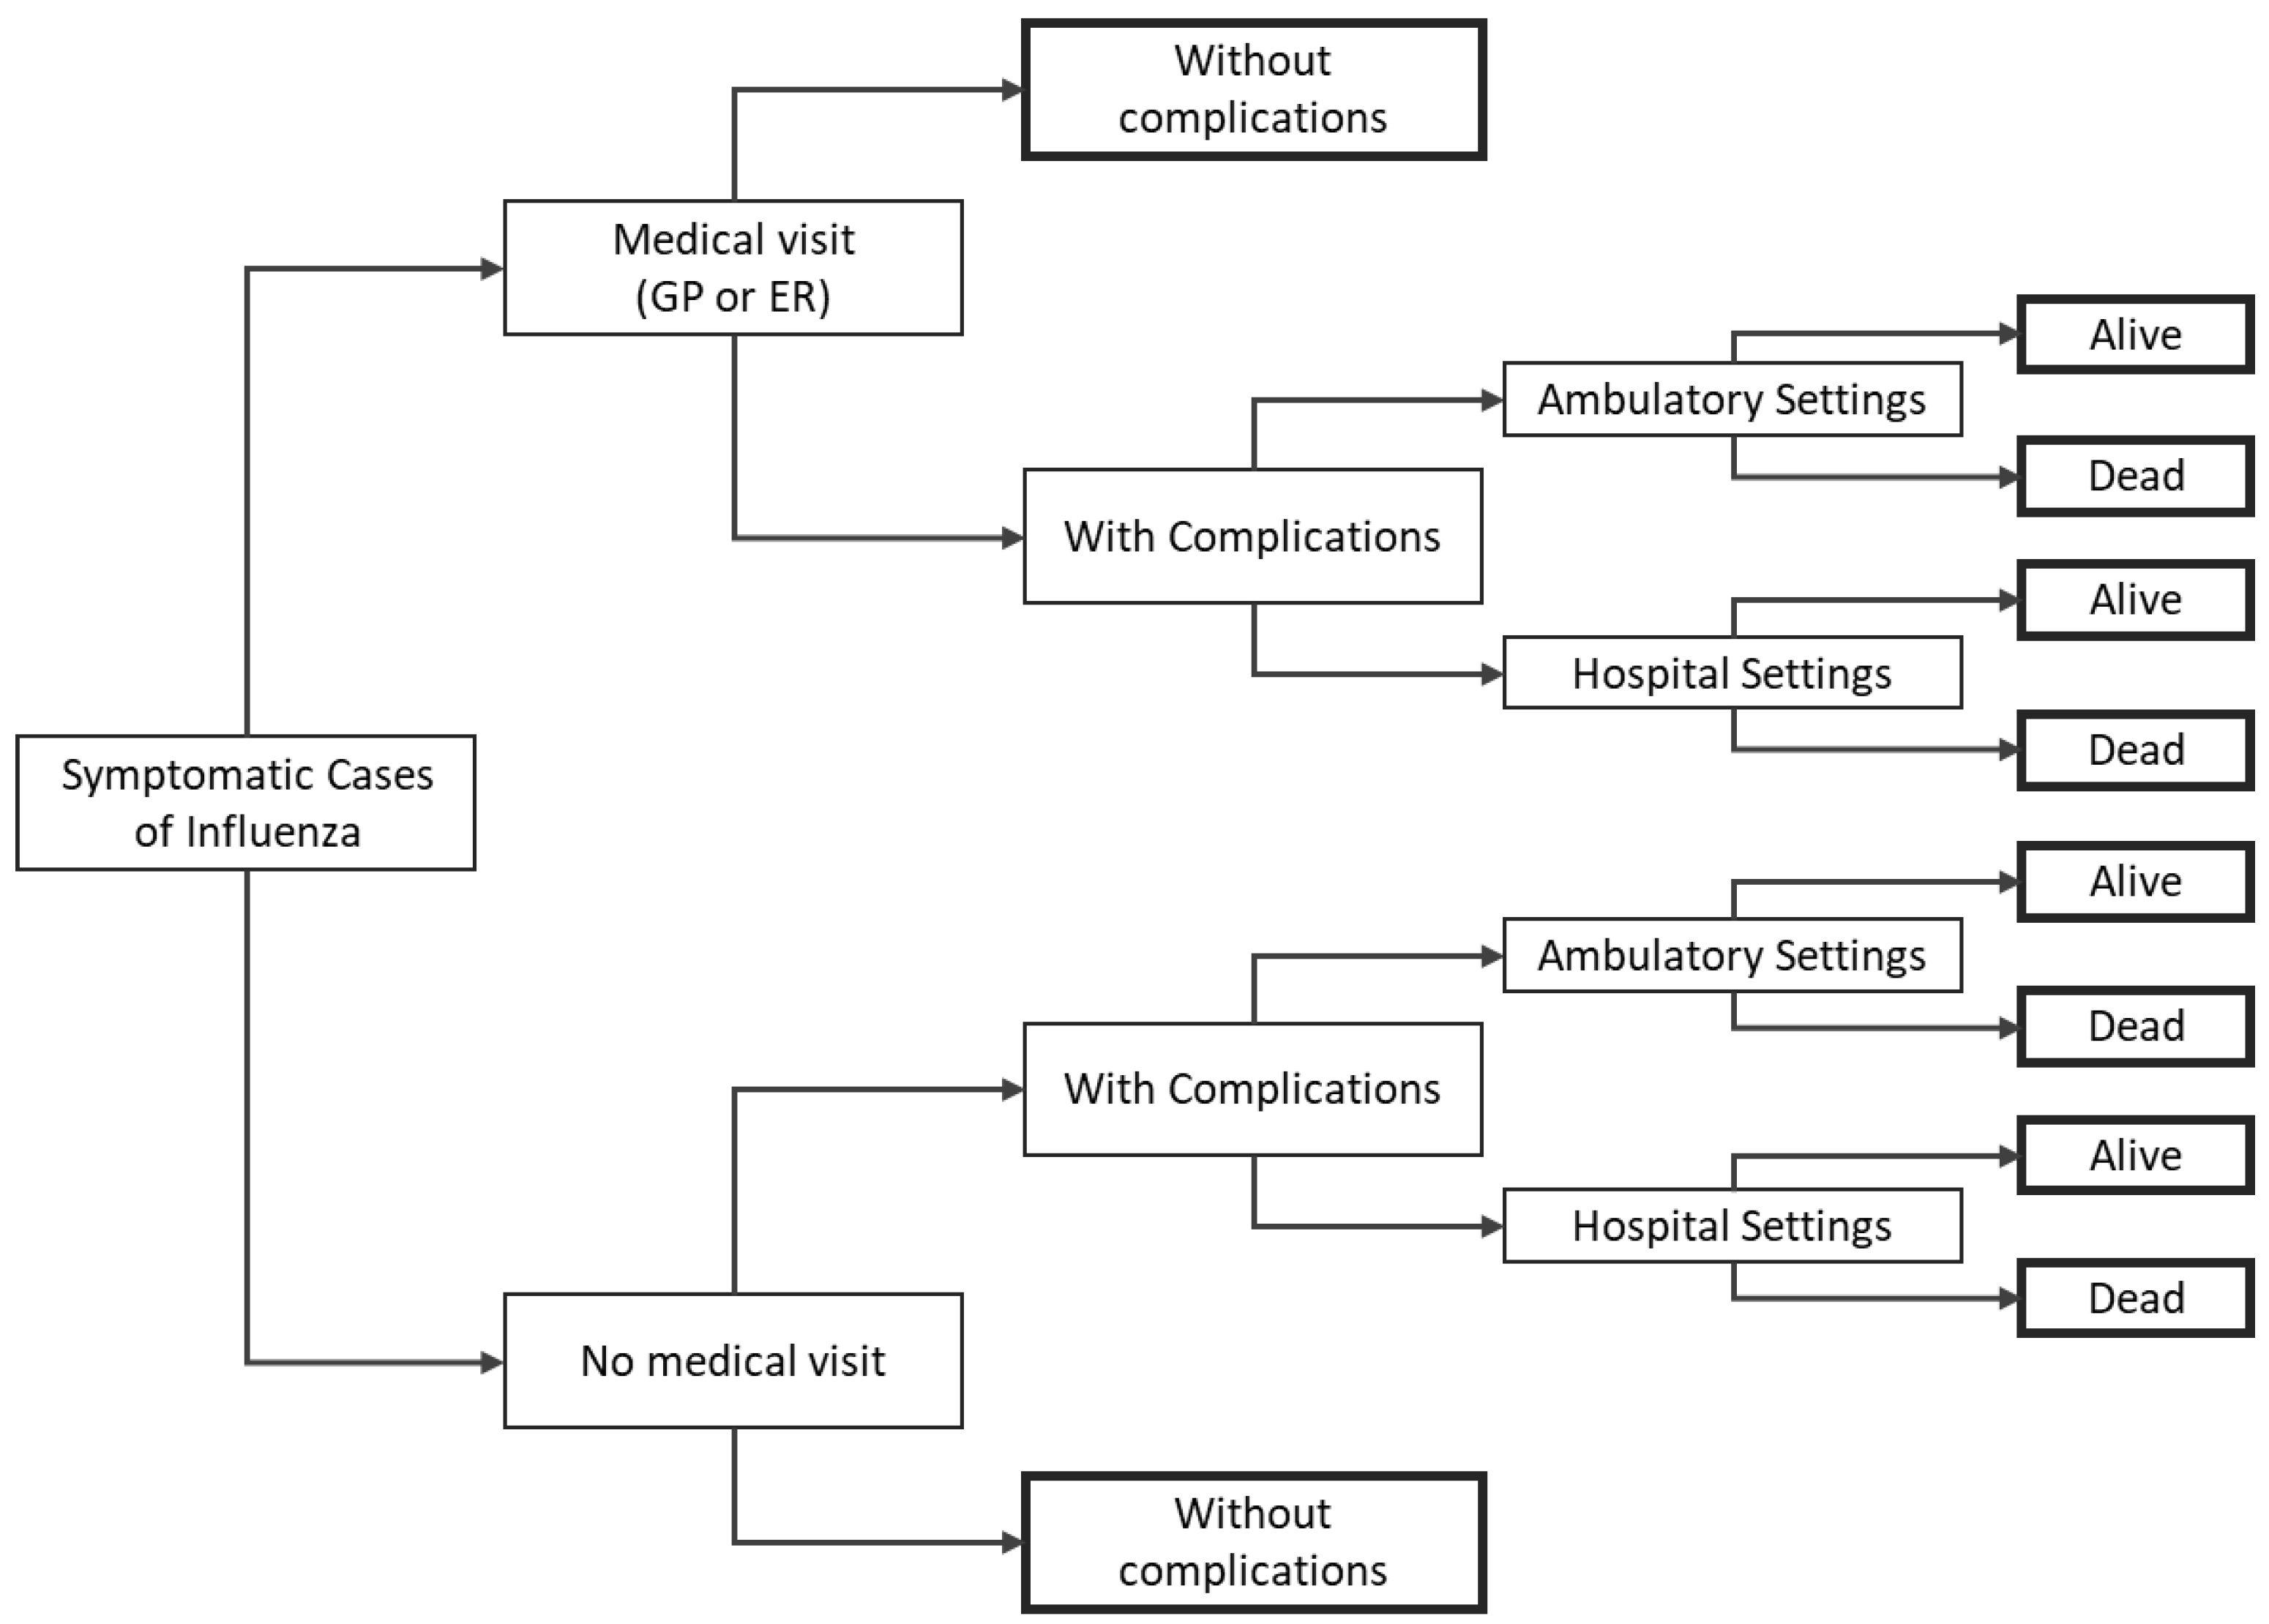
2.1. Model Structure
2.2. Epidemiological Module Inputs
2.2.1. Population
2.2.2. Vaccine Coverage
2.2.3. Effectiveness
2.3. Disease Burden Module Inputs
2.3.1. Rates of Clinical Events
2.3.2. Mortality
2.3.3. Costs
2.3.4. Utilities
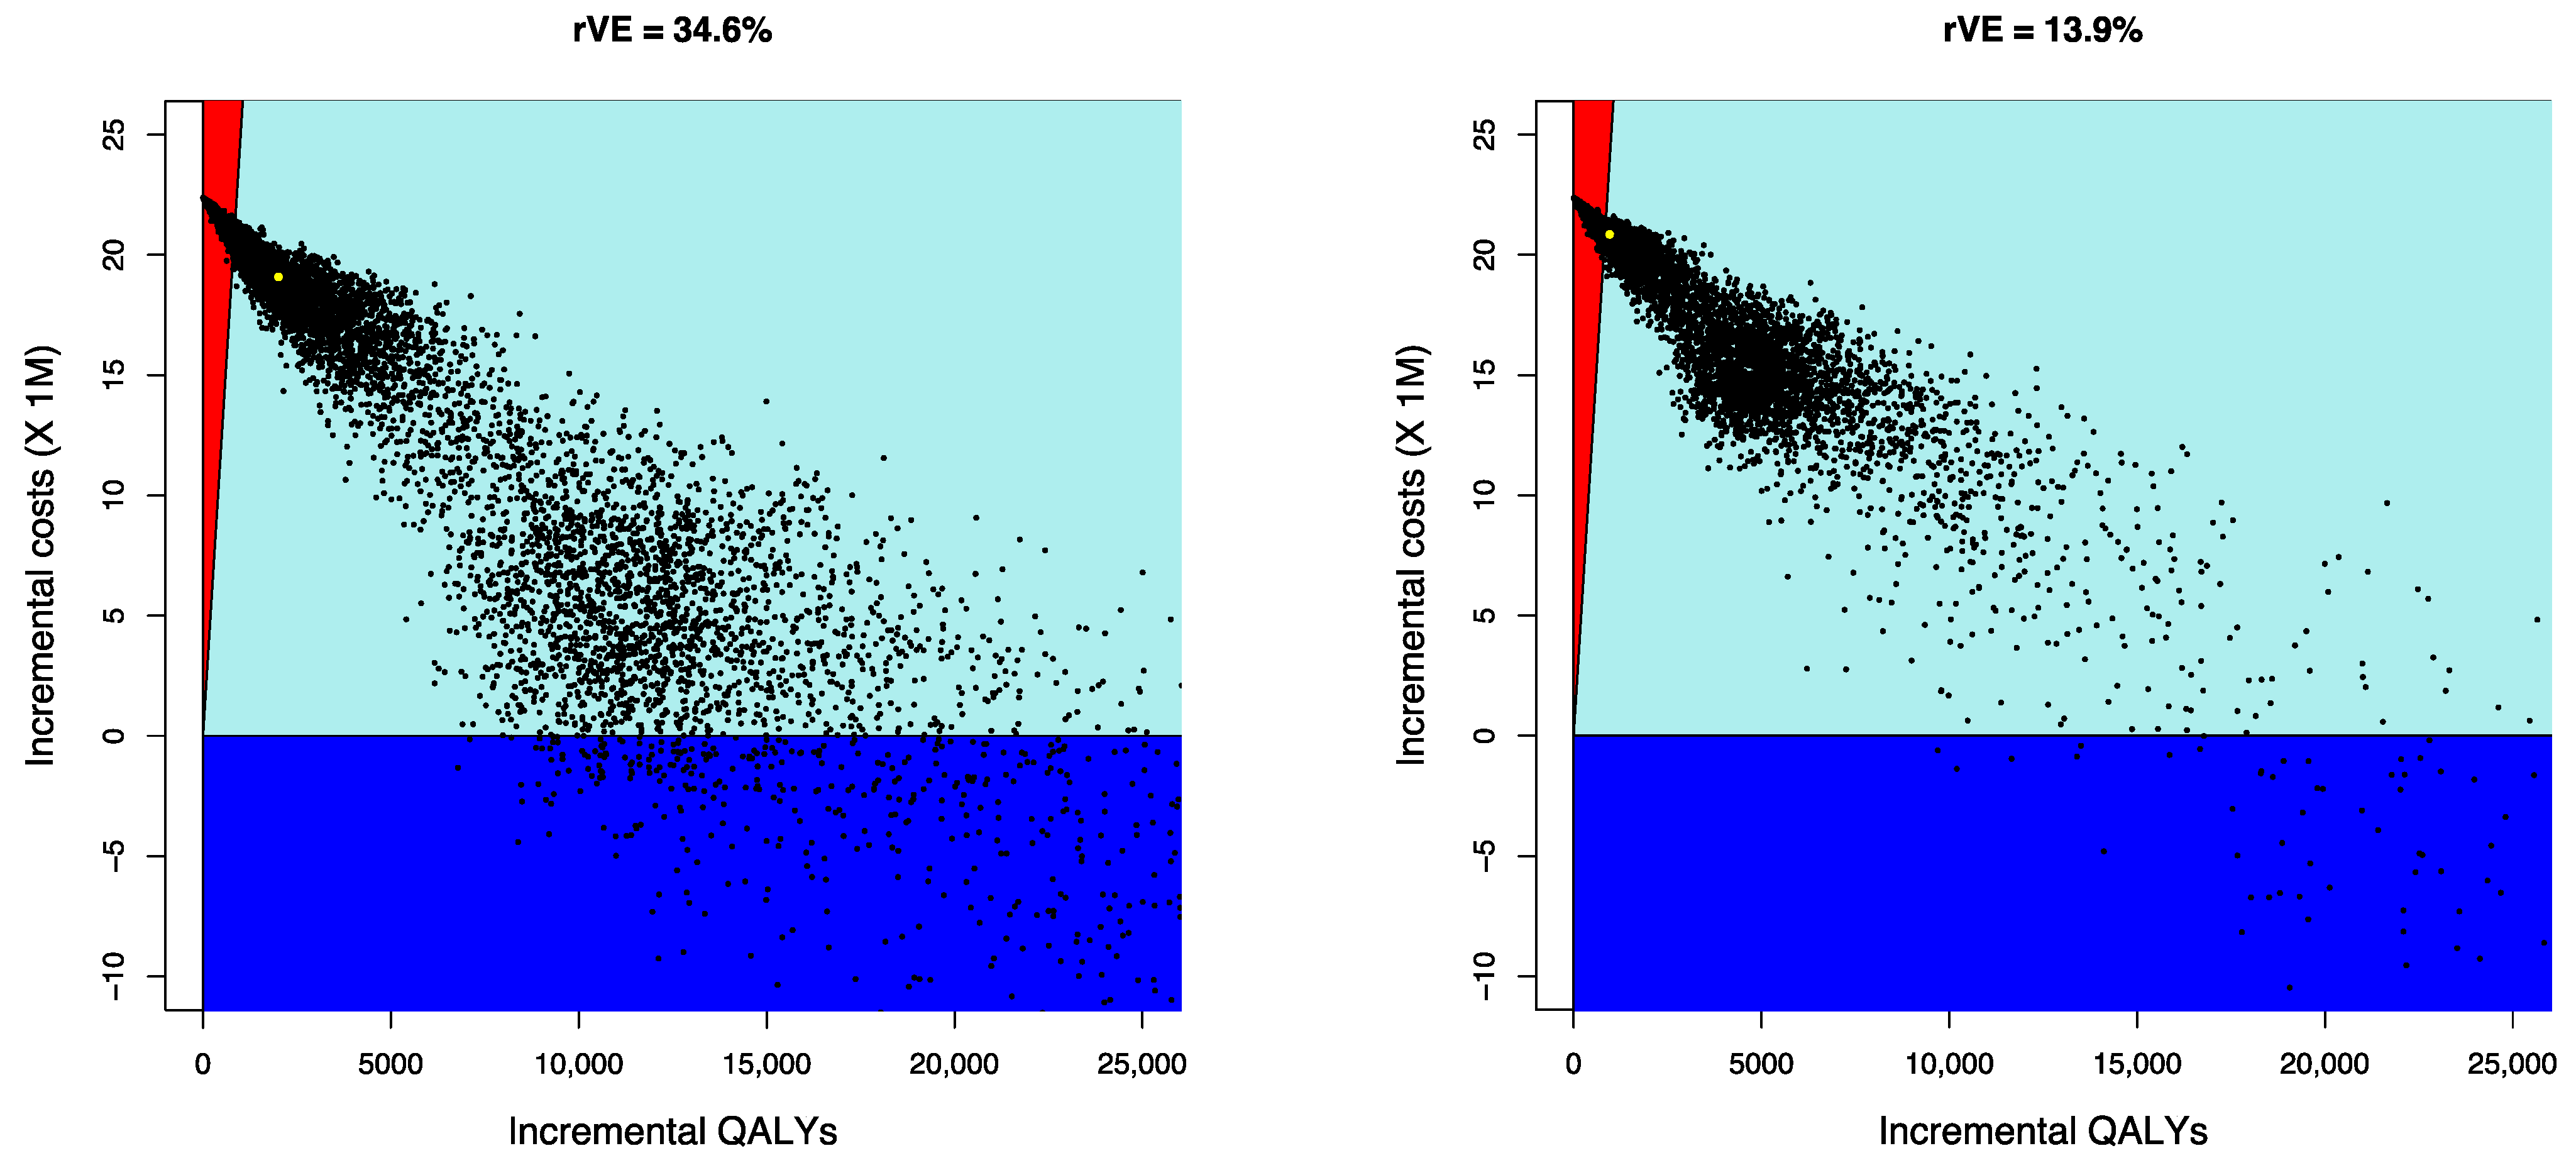
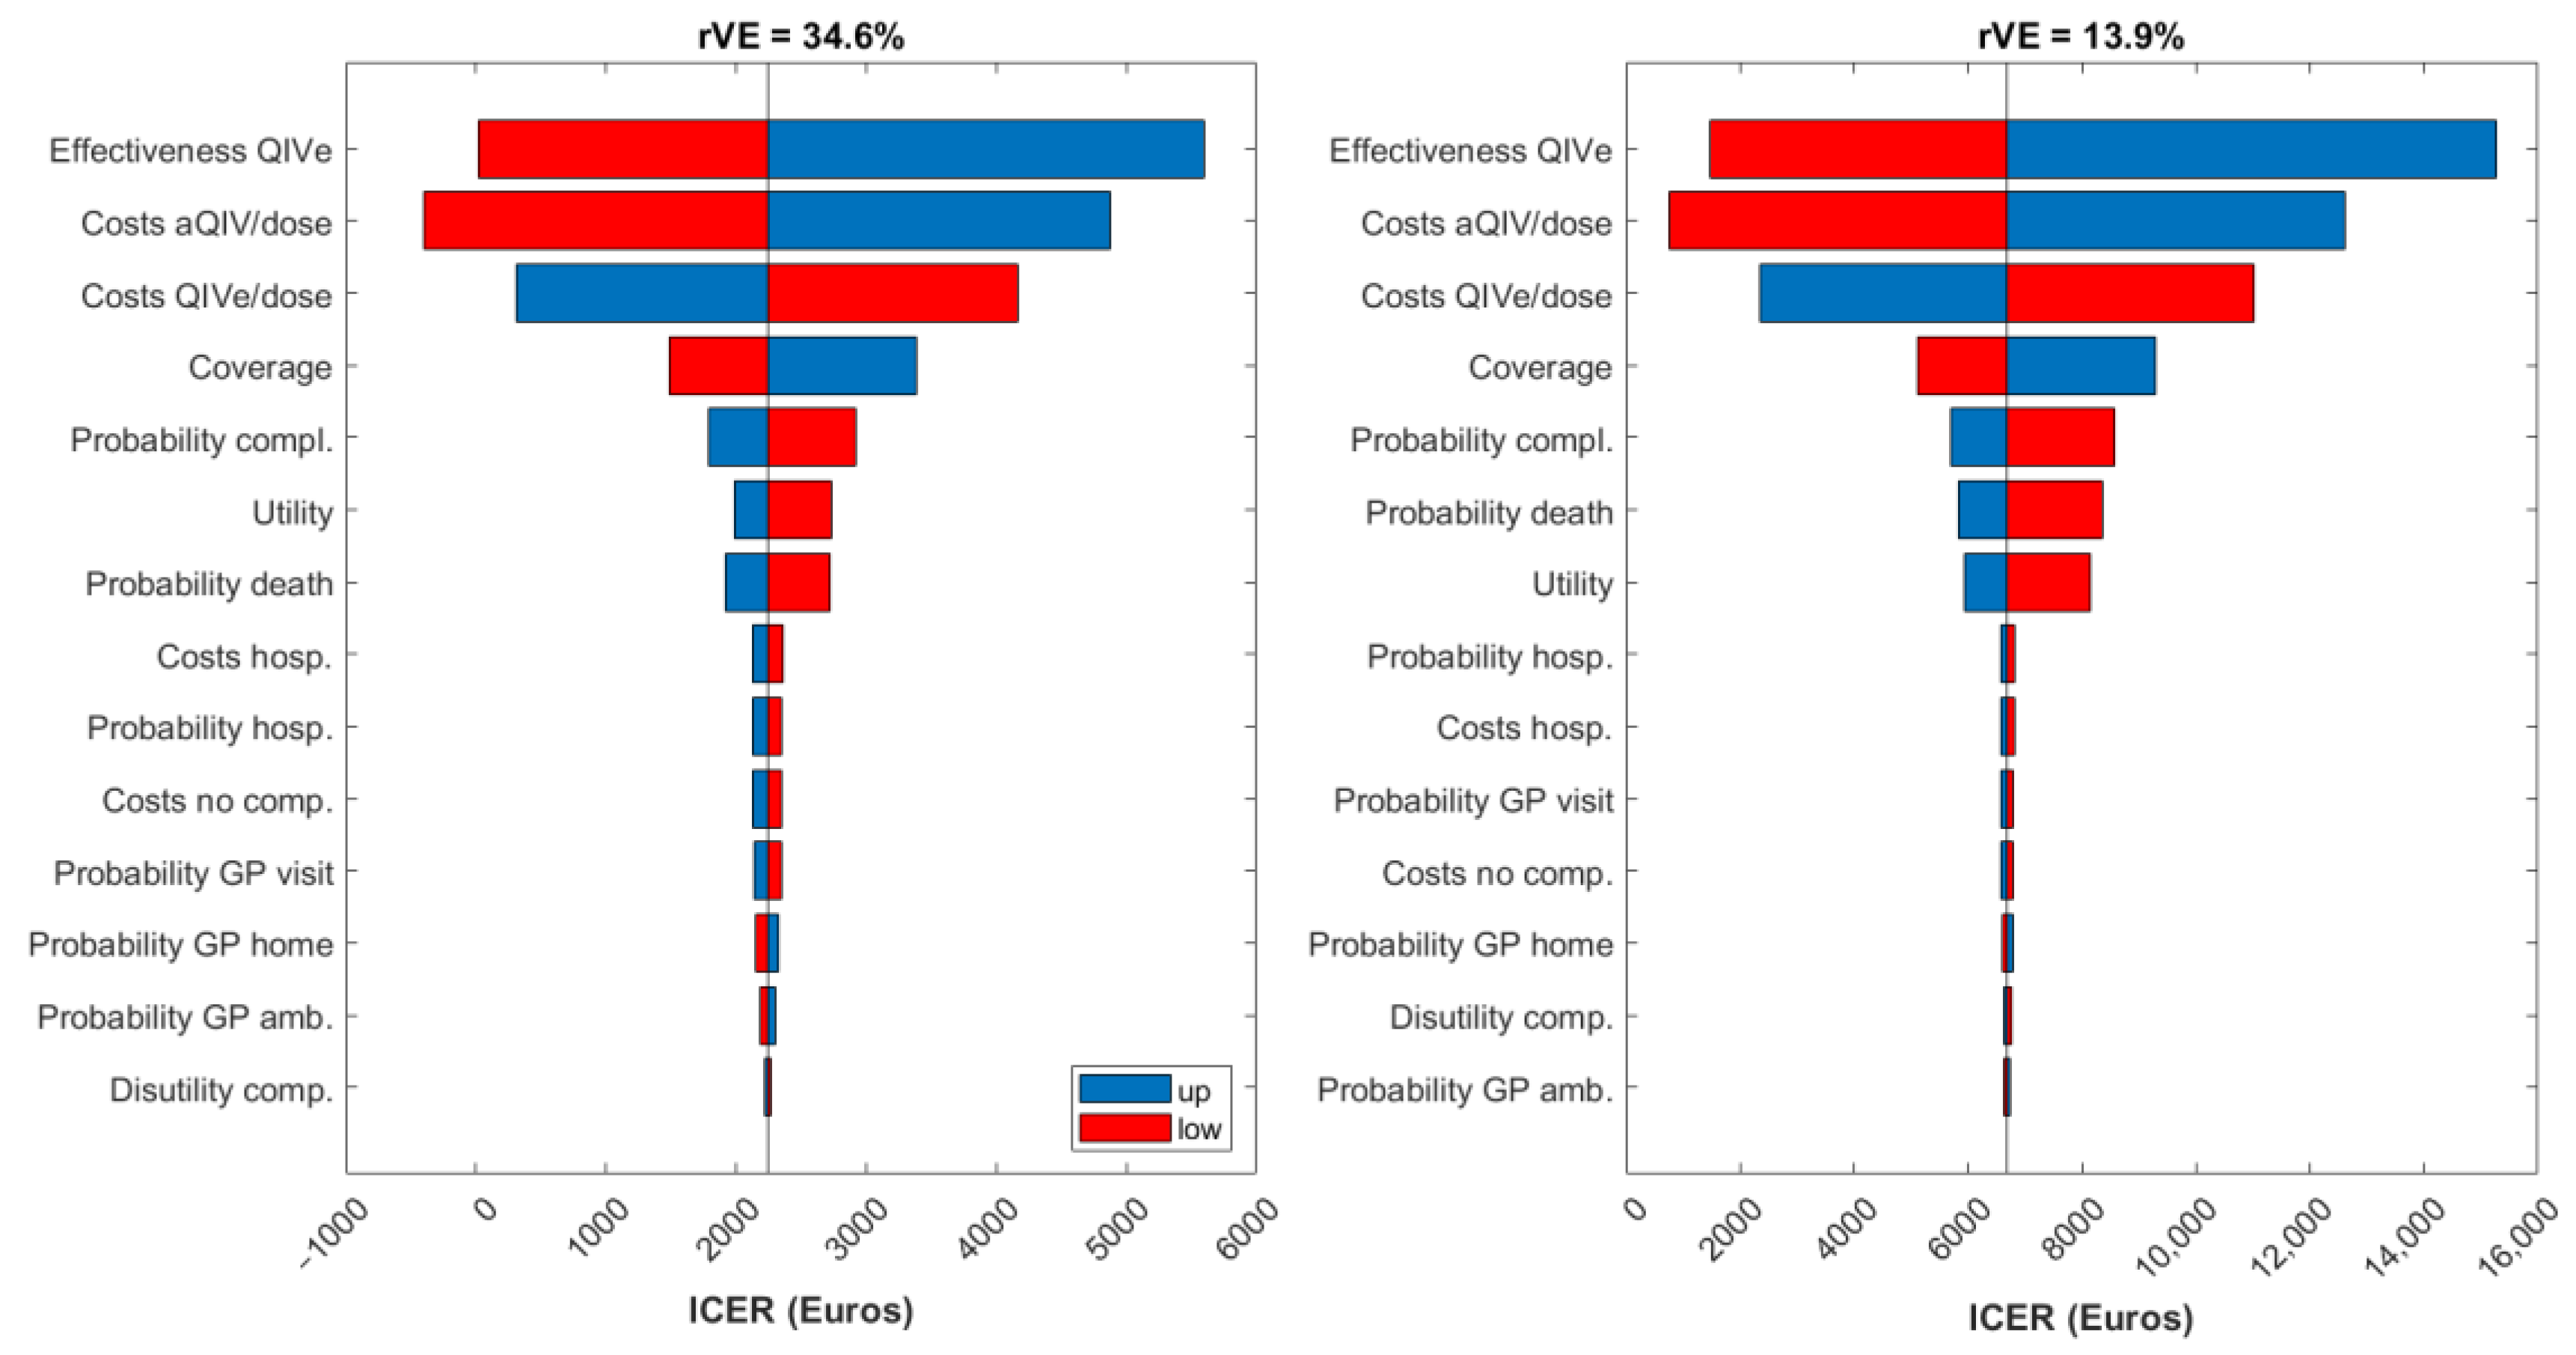
2.4. Analysis
3. Results
4. Discussion
5. Conclusions
Supplementary Materials
Author Contributions
Funding
Institutional Review Board Statement
Informed Consent Statement
Data Availability Statement
Conflicts of Interest
Appendix A

| Age Category | Medical Visits without Complications (Thousands) | Medical Visits with Complications (Thousands) | Hospitalizations (Thousands) | GP Ambulatory and Home Visits (Thousands) | ||||
|---|---|---|---|---|---|---|---|---|
| aQIV rVE = 34.6% | aQIV rVE = 13.9% | aQIV rVE = 34.6% | aQIV rVE = 13.9% | aQIV rVE = 34.6% | aQIV rVE = 13.9% | aQIV rVE = 34.6% | aQIV rVE = 13.9% | |
| 0–8 | −€23 | −€10 | −€311 | −€133 | −€421 | −€180 | −€742 | −€318 |
| 9–17 | −€22 | −€10 | −€220 | −€96 | −€193 | −€85 | −€638 | −€277 |
| 18–64 | −€28 | −€12 | −€338 | −€147 | −€1067 | −€468 | −€1106 | −€482 |
| ≥65 | −€14 | −€6 | −€362 | −€160 | −€1908 | −€838 | −€870 | −€384 |
| Total | −€88 | −€38 | −€1232 | −€536 | −€3589 | −€1570 | −€3356 | −€1460 |
| Age Category | Due to Deaths (Thousands) | Due to Workdays Lost by Diseased Workers (Thousands) | Due to Workdays Lost by Parents Assisting Diseased Children (Thousands) | |||
|---|---|---|---|---|---|---|
| aQIV rVE = 34.6% | aQIV rVE = 13.9% | aQIV rVE = 34.6% | aQIV rVE = 13.9% | aQIV rVE = 34.6% | aQIV rVE = 13.9% | |
| 0–8 | −€361 | −€361 | €0 | €0 | −€1544 | −€662 |
| 9–17 | −€471 | −€471 | €0 | €0 | −€823 | −€357 |
| 18–64 | −€11,509 | −€5035 | −€14 | −€6 | €0 | €0 |
| ≥65 | −€1090 | −€481 | €0 | €0 | €0 | €0 |
| Total | −€13,431 | −€6348 | −€14 | −€6 | −€2367 | −€1019 |
| Age Category | Influenza without Complications | Influenza with Complications | Hospitalizations | Deaths Avoided | ||||
|---|---|---|---|---|---|---|---|---|
| aQIV rVE = 34.6% | aQIV rVE = 13.9% | aQIV rVE = 34.6% | aQIV rVE = 13.9% | aQIV rVE = 34.6% | aQIV rVE = 13.9% | aQIV rVE = 34.6% | aQIV rVE = 13.9% | |
| 0–8 | 60.1 | 25.8 | 22.6 | 9.7 | 1.1 | 0.5 | 29.0 | 29.0 |
| 9–17 | 65.7 | 28.5 | 15.7 | 6.8 | 0.5 | 0.2 | 27.9 | 27.9 |
| 18–64 | 146.8 | 63.9 | 138.7 | 60.4 | 3.0 | 1.3 | 703.8 | 307.9 |
| ≥65 | 61.4 | 27.1 | 150.2 | 66.3 | 5.3 | 2.3 | 4866.8 | 2146.9 |
| Total | 334.0 | 145.3 | 327.2 | 143.2 | 10.0 | 4.4 | 5627.5 | 2511.6 |
| Base Case | Lower Bound | Upper Bound | ||||
|---|---|---|---|---|---|---|
| Age Category | At Risk—Influenza Coverage | Overall—Influenza Coverage | At Risk—Influenza Coverage | Overall—Influenza Coverage | At Risk—Influenza Coverage | Overall—Influenza Coverage |
| 0–8 | 24.20% | 4.86% | 19.36% | 3.89% | 29.04% | 5.83% |
| 9–17 | 24.24% | 5.18% | 24.24% | 5.18% | 24.24% | 5.18% |
| 18–64 | 17.15% | 7.29% | 13.72% | 5.84% | 20.58% | 8.75% |
| ≥65 | 67.70% | 67.70% | 54.16% | 54.16% | 81.24% | 81.24% |
| Base Case | |||||||||
|---|---|---|---|---|---|---|---|---|---|
| Age-Class | H1N1 | H3N2 | B | ||||||
| QIVe | aQIV (rVE = 34.6%) | AQIV (rVE = 13.9%) | QIVe | aQIV (rVE = 34.6%) | AQIV (rVE = 13.9%) | QIVe | aQIV (rVE = 34.6%) | AQIV (rVE = 13.9%) | |
| 0.5–1 | 69.00% | 69.00% | 69.00% | 43.00% | 43.00% | 43.00% | 67.00% | 67.00% | 67.00% |
| 2–6 | 69.00% | 69.00% | 69.00% | 43.00% | 43.00% | 43.00% | 67.00% | 67.00% | 67.00% |
| 7–17 | 73.00% | 73.00% | 73.00% | 35.00% | 35.00% | 35.00% | 77.00% | 77.00% | 77.00% |
| 18–64 | 73.00% | 73.00% | 73.00% | 35.00% | 35.00% | 35.00% | 77.00% | 77.00% | 77.00% |
| ≥65 | 62.00% | 75.20% | 67.30% | 24.00% | 50.40% | 34.60% | 52.00% | 68.70% | 58.70% |
| Lower Bound | |||||||||
| 0.5–1 | 49.00% | 49.00% | 49.00% | 28.00% | 28.00% | 28.00% | 57.70% | 57.70% | 57.70% |
| 2–6 | 49.00% | 49.00% | 49.00% | 28.00% | 28.00% | 28.00% | 57.70% | 57.70% | 57.70% |
| 7–17 | 49.00% | 49.00% | 49.00% | 28.00% | 28.00% | 28.00% | 57.70% | 57.70% | 57.70% |
| 18–64 | 52.00% | 52.00% | 52.00% | 14.00% | 14.00% | 14.00% | 18.00% | 18.00% | 18.00% |
| ≥65 | 36.00% | 62.76% | 63.60% | −6.00% | 25.52% | 27.19% | 41.00% | 52.96% | 54.02% |
| Upper Bound | |||||||||
| 0.5–1 | 81.00% | 81.00% | 81.00% | 55.00% | 55.00% | 55.00% | 73.60% | 73.60% | 73.60% |
| 2–6 | 81.00% | 81.00% | 81.00% | 55.00% | 55.00% | 55.00% | 73.60% | 73.60% | 73.60% |
| 7–17 | 81.00% | 81.00% | 81.00% | 55.00% | 55.00% | 55.00% | 73.60% | 73.60% | 73.60% |
| 18–64 | 84.00% | 84.00% | 84.00% | 41.00% | 41.00% | 41.00% | 94.00% | 94.00% | 94.00% |
| ≥65 | 78.00% | 87.08% | 70.93% | 45.00% | 74.16% | 41.86% | 60.80% | 83.68% | 63.28% |
| Age Category | GP Visit | ER Visit | Probability of Complications | Probability Hospitalization | Probability of Death |
|---|---|---|---|---|---|
| Base Case | |||||
| 0–8 | 65.63% | 3.04% | 22.21% | 4.14% | 0.03% |
| 9–17 | 57.63% | 1.65% | 15.09% | 2.73% | 0.01% |
| 18–64 LR | 32.03% | 0.02% | 29.98% | 0.41% | 0.15% |
| 18–64 HR | 32.03% | 0.02% | 55.33% | 2.96% | 0.19% |
| ≥65 | 36.89% | 0.02% | 63.65% | 2.96% | 2.67% |
| Lower Bound | |||||
| 0–8 | 52.50% | 2.43% | 17.77% | 3.31% | 0.02% |
| 9–17 | 46.10% | 1.32% | 12.07% | 2.18% | 0.01% |
| 18–64 LR | 25.62% | 0.01% | 23.99% | 0.33% | 0.12% |
| 18–64 HR | 25.62% | 0.01% | 44.26% | 2.37% | 0.15% |
| ≥65 | 29.51% | 0.01% | 50.92% | 2.37% | 2.13% |
| Upper Bound | |||||
| 0–8 | 78.75% | 3.65% | 26.65% | 4.97% | 0.03% |
| 9–17 | 69.15% | 1.98% | 18.11% | 3.27% | 0.02% |
| 18–64 LR | 38.43% | 0.02% | 35.98% | 0.50% | 0.18% |
| 18–64 HR | 38.43% | 0.02% | 66.39% | 3.55% | 0.23% |
| ≥65 | 44.26% | 0.02% | 76.38% | 3.55% | 3.20% |
| Base Case | Lower Bound | Upper Bound | |
|---|---|---|---|
| Cost QIVe per dose | €9.50 | €7.60 | €11.40 |
| Cost aQIV per dose | €13.00 | €10.40 | €15.60 |
| Vaccine administration cost | €25.94 | €20.75 | €31.13 |
| Cost flu without complication (all components: GP ambulatory, GP home, pharmaceutical costs, ER) | |||
| Cost GP visit at ambulatory (winter) | €59.00 | €47.20 | €70.80 |
| Cost GP visit at home (winter) | €83.00 | €66.40 | €99.60 |
| Cost pharmaceuticals | €3.21 | €2.57 | €3.85 |
| Cost ED visit per equivalent patient | €183.00 | €146.40 | €219.60 |
| Cost flu with ambulatory complications 0–17 years (URTI + LRTI) | |||
| URTI | €59.00 | €47.20 | €70.80 |
| LRTI | €171.45 | €137.16 | €205.74 |
| Costs flu with ambulatory complications ≥18 years (cost of all resources) | |||
| Antibiotic treatment (× 5 days) | €15.00 | €12.00 | €18.00 |
| Specialist visit | €215.00 | €172.00 | €258.00 |
| X-ray thorax | €23.34 | €18.67 | €28.01 |
| X-ray sinuses | €23.34 | €18.67 | €28.01 |
| X-ray others | €23.34 | €18.67 | €28.01 |
| Hematology | €4.00 | €3.20 | €4.80 |
| ECG | €15.00 | €12.00 | €18.00 |
| Blood analysis | €5.00 | €4.00 | €6.00 |
| Throat swab | €18.00 | €14.40 | €21.60 |
| Audiometry | €62.00 | €49.60 | €74.40 |
| Hospitalization costs (all conditions: URTI, pneumonia, COPD, bronchitis, cardiac) | |||
| URTI | €2607.94 | €2086.35 | €3129.52 |
| Pneumonia | €3393.23 | €2714.59 | €4071.88 |
| COPD | €3277.45 | €2621.96 | €3932.94 |
| Bronchitis | €2507.91 | €2006.33 | €3009.49 |
| Cardiac | €3439.30 | €2751.44 | €4127.16 |
| Age Category | Base Case | Lower Bound | Upper Bound |
|---|---|---|---|
| 0–8 | 0.95 | 0.76 | 1.00 |
| 9–17 | 0.95 | 0.76 | 1.00 |
| 18–64 | 0.93 | 0.75 | 1.00 |
| ≥65 | 0.87 | 0.70 | 1.00 |
| Influenza-Related Complication | Base Case | Lower Bound | Upper Bound |
|---|---|---|---|
| Influenza symptoms without medical visit | 0.005 | 0.0040 | 0.0060 |
| Influenza symptoms with medical visit | 0.006 | 0.0048 | 0.0072 |
| Influenza symptoms with complications | 0.0075 | 0.0060 | 0.0090 |
| Influenza symptoms with complications and hospitalization | 0.0090 | 0.0072 | 0.0108 |
| Lower R0 | Mean R0 | Upper R0 | |
|---|---|---|---|
| B | 1.0881 | 1.0968 | 1.1055 |
| H1N1 | 1.0029 | 1.0548 | 1.1330 |
| H3N2 | 0.9734 | 1.0439 | 1.1416 |
| Variable | Direct Costs | Indirect Costs | QALYs |
|---|---|---|---|
| Infections in age-classes 0–8 | 110.47 | 245.86 | 7.91 |
| Infections in age-classes 9–17 | 77.64 | 146.52 | 6.48 |
| Infections in age-classes 18–64 | 55.03 | 346.52 | 21.44 |
| Infections in age-classes 65+ | 100.27 | 135.04 | 161.45 |
References
- Turner, H.C.; Thwaites, G.E.; Clapham, H.E. Vaccine-preventable diseases in lower-middle-income countries. Lancet Infect. Dis. 2018, 18, 937–939. [Google Scholar] [CrossRef]
- World Health Organization. Immunization. Available online: https://www.who.int/news-room/facts-in-pictures/detail/immunization (accessed on 3 February 2022).
- Ruiz-Aragón, J.; Márquez-Peláez, S.; Gani, R.; Alvarez, P.; Guerrero-Luduena, R. Cost-Effectiveness and Burden of Disease for Adjuvanted Quadrivalent Influenza Vaccines Compared to High-Dose Quadrivalent Influenza Vaccines in Elderly Patients in Spain. Vaccines 2022, 10, 176. [Google Scholar] [CrossRef] [PubMed]
- World Health Organization. Influenza (Seasonal). Available online: https://www.who.int/news-room/fact-sheets/detail/influenza-(seasonal) (accessed on 3 February 2022).
- Putri, W.; Muscatello, D.J.; Stockwell, M.S.; Newall, A.T. Economic burden of seasonal influenza in the United States. Vaccine 2018, 36, 3960–3966. [Google Scholar] [CrossRef] [PubMed]
- García, A.; Ortiz de Lejarazu, R.; Reina, J.; Callejo, D.; Cuervo, J.; Morano Larragueta, R. Cost-effectiveness analysis of quadrivalent influenza vaccine in Spain. Hum. Vaccin. Immunother. 2016, 12, 2269–2277. [Google Scholar] [CrossRef] [PubMed] [Green Version]
- Sandmann, F.G.; van Leeuwen, E.; Bernard-Stoecklin, S.; Casado, I.; Castilla, J.; Domegan, L.; Gherasim, A.; Hooiveld, M.; Kislaya, I.; Larrauri, A.; et al. Health and economic impact of seasonal influenza mass vaccination strategies in European settings: A mathematical modelling and cost-effectiveness analysis. Vaccine 2022, 40, 1306–1315. [Google Scholar] [CrossRef] [PubMed]
- Ruiz-Aragón, J.; Gani, R.; Márquez, S.; Alvarez, P. Estimated cost-effectiveness and burden of disease associated with quadrivalent cell-based and egg-based influenza vaccines in Spain. Hum. Vaccin. Immunother. 2020, 16, 2238–2244. [Google Scholar] [CrossRef]
- Pérez-Rubio, A.; Eiros, J.M. Economic and Health impact of influenza vaccination with adjuvant MF59 in population over 64 years in Spain. Rev. Esp. Quim. 2018, 31, 43–52. [Google Scholar]
- Ruiz-Aragón, J.; Grande Tejada, A.M.; Márquez-Peláez, S.; García-Cenoz, M. Estimación del impacto de la vacunación antigripal con adyuvante MF59 en población mayor de 64 años para el Sistema Nacional de Salud: Efectos y costes. Vacunas 2015, 16, 6–11. [Google Scholar] [CrossRef]
- Haq, K.; McElhaney, J.E. Immunosenescence: Influenza vaccination and the elderly. Curr. Opin. Immunol. 2014, 29, 38–42. [Google Scholar] [CrossRef]
- Coleman, B.L.; Sanderson, R.; Haag, M.D.M.; McGovern, I. Effectiveness of the MF59-adjuvanted trivalent or quadrivalent seasonal influenza vaccine among adults 65 years of age or older, a systematic review and meta-analysis. Influenza Other Respir. Viruses 2021, 15, 813–823. [Google Scholar] [CrossRef]
- Boikos, C.; Imran, M.; Nguyen, V.H.; Ducruet, T.; Sylvester, G.C.; Mansi, J.A. Effectiveness of the Adjuvanted Influenza Vaccine in Older Adults at High Risk of Influenza Complications. Vaccines 2021, 9, 862. [Google Scholar] [CrossRef] [PubMed]
- Imran, M.; Puig-Barbera, J.; Ortiz, J.R.; Fischer, L.; O’Brien, D.; Bonafede, M.; Mansi, J.A.; Boikos, C. Relative Effectiveness of MF59 Adjuvanted Trivalent Influenza Vaccine vs Nonadjuvanted Vaccines During the 2019–2020 Influenza Season. Open Forum Infect. Dis. 2022, 9, ofac167. [Google Scholar] [CrossRef] [PubMed]
- Crépey, P.; Redondo, E.; Díez-Domingo, J.; Ortiz de Lejarazu, R.; Martinón-Torres, F.; Gil de Miguel, Á.; López-Belmonte, J.L.; Alvarez, F.P.; Bricout, H.; Solozabal, M. From trivalent to quadrivalent influenza vaccines: Public health and economic burden for different immunization strategies in Spain. PLoS ONE 2020, 15, e0233526. [Google Scholar] [CrossRef]
- Pradas-Velasco, R.; Antoñanzas-Villar, F.; Martínez-Zárate, M.P. Dynamic modelling of infectious diseases: An application to the economic evaluation of influenza vaccination. Pharmacoeconomics 2008, 26, 45–56. [Google Scholar] [CrossRef] [PubMed]
- Eichner, M.; Schwehm, M.; Eichner, L.; Gerlier, L. Direct and indirect effects of influenza vaccination. BMC Infect. Dis. 2017, 17, 308. [Google Scholar] [CrossRef] [PubMed]
- Newall, A.T.; Chaiyakunapruk, N.; Lambach, P.; Hutubessy, R.C.W. WHO guide on the economic evaluation of influenza vaccination. Influenza Other Respir. Viruses 2018, 12, 211–219. [Google Scholar] [CrossRef] [Green Version]
- Calabrò, G.E.; Boccalini, S.; Panatto, D.; Rizzo, C.; Di Pietro, M.L.; Abreha, F.M.; Ajelli, M.; Amicizia, D.; Bechini, A.; Giacchetta, I.; et al. The New Quadrivalent Adjuvanted Influenza Vaccine for the Italian Elderly: A Health Technology Assessment. Int. J. Environ. Res. Public Health 2022, 19, 4166. [Google Scholar] [CrossRef]
- Calabrò, G.E.; Boccalini, S.; Bonanni, P.; Bechini, A.; Panatto, D.; Lai, P.L. Valutazione di Health Technology Assessment (HTA) del vaccino antinfluenzale quadrivalente adiuvato: Fluad Tetra. Ital. J. Public Health 2021, 10, 97–122. [Google Scholar]
- Fumanelli, L.; Ajelli, M.; Manfredi, P.; Vespignani, A.; Merler, S. Inferring the Structure of Social Contacts from Demographic Data in the Analysis of Infectious Diseases Spread. PLoS Comput. Biol. 2012, 8, e1002673. [Google Scholar] [CrossRef] [Green Version]
- Trentini, F.; Pariani, E.; Bella, A.; Diurno, G.; Crottogini, L.; Rizzo, C.; Merler, S.; Ajelli, M. Characterizing the transmission patterns of seasonal influenza in Italy: Lessons from the last decade. BMC Public Health 2022, 22, 19. [Google Scholar] [CrossRef]
- Redondo-Bravo, L.; Delgado-Sanz, C.; Oliva, J.; Vega, T.; Lozano, J.; Larrauri, A.; The Spanish Influenza Sentinel Surveillance System. Transmissibility of influenza during the 21st-century epidemics, Spain, influenza seasons 2001/02 to 2017/18. Eurosurveillance 2020, 25, 1900364. [Google Scholar] [CrossRef] [PubMed]
- Instituto Nacional de Estadistica. Population Figures. Latest Data. Available online: https://www.ine.es/dyngs/INEbase/en/operacion.htm?c=Estadistica_C&cid=1254736176951&menu=ultiDatos&idp=1254735572981 (accessed on 10 March 2022).
- Ministerio de Sanidad. Coberturas de Vacunación. Datos Estadísticos. Available online: https://www.sanidad.gob.es/profesionales/saludPublica/prevPromocion/vacunaciones/calendario-y-coberturas/coberturas/home.htm (accessed on 10 March 2022).
- Ministerio de Sanidad Consumo y Bienestar Social. Recomendaciones de Vacunación Frente a la Gripe. 2021–2022. Available online: https://www.mscbs.gob.es/profesionales/saludPublica/prevPromocion/vacunaciones/programasDeVacunacion/docs/Recomendaciones_vacunacion_gripe.pdf (accessed on 3 February 2022).
- Boccalini, S.; Pariani, E.; Calabrò, G.E.; De Waure, C.; Panatto, D.; Amicizia, D.; Lai, P.L.; Rizzo, C.; Amodio, E.; Vitale, F.; et al. Health Technology Assessment (HTA) of the introduction of influenza vaccination for Italian children with Fluenz Tetra(®). J. Prev. Med. Hyg. 2021, 62, E1–E118. [Google Scholar] [CrossRef] [PubMed]
- Zipfel, C.; Colizza, V.; Bansal, S. Double trouble? When a pandemic and seasonal virus collide. medRxiv 2021, preprint. [Google Scholar] [CrossRef] [Green Version]
- European Medicines Agency. Fluad Tetra. Summary of Product Characteristics. Available online: https://www.ema.europa.eu/en/documents/product-information/fluad-tetra-epar-product-information_en.pdf (accessed on 3 February 2022).
- Perrotta, D.; Bella, A.; Rizzo, C.; Paolotti, D. Participatory Online Surveillance as a Supplementary Tool to Sentinel Doctors for Influenza-Like Illness Surveillance in Italy. PLoS ONE 2017, 12, e0169801. [Google Scholar] [CrossRef] [PubMed] [Green Version]
- Sessa, A.; Costa, B.; Bamfi, F.; Bettoncelli, G.; D’Ambrosio, G. The incidence, natural history and associated outcomes of influenza-like illness and clinical influenza in Italy. Fam. Pr. 2001, 18, 629–634. [Google Scholar] [CrossRef] [Green Version]
- Esposito, S.; Cantarutti, L.; Molteni, C.G.; Daleno, C.; Scala, A.; Tagliabue, C.; Pelucchi, C.; Giaquinto, C.; Principi, N. Clinical manifestations and socio-economic impact of influenza among healthy children in the community. J. Infect. 2011, 62, 379–387. [Google Scholar] [CrossRef]
- Istituto Superiore di Sanità. Sorveglianza Passi d’Argento. Available online: https://www.epicentro.iss.it/passi-argento/dati/croniche#dati (accessed on 3 February 2022).
- Meier, C.R.; Napalkov, P.N.; Wegmüller, Y.; Jefferson, T.; Jick, H. Population-based study on incidence, risk factors, clinical complications and drug utilisation associated with influenza in the United Kingdom. Eur J. Clin. Microbiol. Infect. Dis. 2000, 19, 834–842. [Google Scholar] [CrossRef]
- Lucioni, C.; Costa, B.; Sessa, A. I costi dell’influenza in Italia. Farmeconomia 2001, 2. [Google Scholar] [CrossRef] [Green Version]
- Marchetti, M.; Kühnel, U.M.; Colombo, G.L.; Esposito, S.; Principi, N. Cost-effectiveness of adjuvanted influenza vaccination of healthy children 6 to 60 months of age. Hum. Vaccin. 2007, 3, 14–22. [Google Scholar] [CrossRef]
- Rosano, A.; Bella, A.; Gesualdo, F.; Acampora, A.; Pezzotti, P.; Marchetti, S.; Ricciardi, W.; Rizzo, C. Investigating the impact of influenza on excess mortality in all ages in Italy during recent seasons (2013/14-2016/17 seasons). Int. J. Infect. Dis. 2019, 88, 127–134. [Google Scholar] [CrossRef] [Green Version]
- Ministerio de Sanidad. Acuerdo Marco para la Seleccion de Suministradores de Vacunas Frente a la Gripe Estacional 2021–2025. Available online: https://contrataciondelestado.es/wps/wcm/connect/7c41cd41-00c8-4c07-be3d-272d29585268/DOC20210419131140PCAP+Gripe+2021-2025.pdf?MOD=AJPERES (accessed on 3 February 2022).
- Consejería de Hacienda. Boletin Oficial de la Region de Murcia. Numero 54, Miercoles 6 de Marzo de 2019. Available online: https://www.borm.es/services/anuncio/ano/2019/numero/1263/pdf (accessed on 3 February 2022).
- Departamento de Salud. Pais Vasco: Gobierno Vasco. Osakidetza. Tarifas para Facturacion de Servicios Sanitarios y Docentes de Osakidetza para el Año 2021. Available online: https://www.osakidetza.euskadi.eus/servicios-on-line/-/servicios-para-empresas/ (accessed on 3 February 2022).
- Ministerio de Sanidad. Registro de Altas de los Hospitales Generales del Sistema Nacional de Salud. CMBD. Norma Estatal. NORMA APR-GRD 2019 V.35. Available online: https://www.mscbs.gob.es/estadEstudios/estadisticas/cmbd.htm (accessed on 3 February 2022).
- Dal Negro, R.W.; Turco, P.; Povero, M. Cost of influenza and influenza-like syndromes (I-LSs) in Italy: Results of a cross-sectional telephone survey on a representative sample of general population. Respir. Med. 2018, 141, 144–149. [Google Scholar] [CrossRef] [PubMed]
- Mennini, F.S.; Bini, C.; Marcellusi, A.; Rinaldi, A.; Franco, E. Cost-effectiveness of switching from trivalent to quadrivalent inactivated influenza vaccines for the at-risk population in Italy. Hum. Vaccines Immunother. 2018, 14, 1867–1873. [Google Scholar] [CrossRef] [PubMed]
- Scalone, L.; Cortesi, P.A.; Ciampichini, R.; Cesana, G.; Mantovani, L.G. Health Related Quality of Life norm data of the Italian general population: Results using the EQ-5D-3L and EQ-5D-5L instruments. Epidemiol. Biostat. Public Health 2015. [Google Scholar] [CrossRef]
- Bilcke, J.; Coenen, S.; Beutels, P. Influenza-like-illness and clinically diagnosed flu: Disease burden, costs and quality of life for patients seeking ambulatory care or no professional care at all. PLoS ONE 2014, 9, e102634. [Google Scholar] [CrossRef] [PubMed] [Green Version]
- López Bastida, J.; Oliva, J.; Antoñanzas, F.; García-Altés, A.; Gisbert, R.; Mar, J.; Puig-Junoy, J. Propuesta de guía para la evaluación económica aplicada a las tecnologías sanitarias. Gac. Sanit. 2010, 24, 154–170. [Google Scholar] [CrossRef] [PubMed] [Green Version]
- Sacristán, J.A.; Oliva, J.; Campillo-Artero, C.; Puig-Junoy, J.; Pinto-Prades, J.L.; Dilla, T.; Rubio-Terrés, C.; Ortún, V. What is an efficient health intervention in Spain in 2020? Gac. Sanit. 2020, 34, 189–193. [Google Scholar] [CrossRef]
- Vallejo-Torres, L.; García-Lorenzo, B.; Serrano-Aguilar, P. Estimating a cost-effectiveness threshold for the Spanish NHS. Health Econ. 2018, 27, 746–761. [Google Scholar] [CrossRef]
- Angelis, A.; Lange, A.; Kanavos, P. Using health technology assessment to assess the value of new medicines: Results of a systematic review and expert consultation across eight European countries. Eur. J. Health Econ. 2018, 19, 123–152. [Google Scholar] [CrossRef] [Green Version]
- World Health Organization. Regional Office for Europe Recommendations on Influenza Vaccination for the 2020/2021 Season. Available online: https://apps.who.int/iris/bitstream/handle/10665/335721/WHO-EURO-2020-1141-40887-55342-eng.pdf?sequence=1&isAllowed=y (accessed on 3 February 2022).
- Leidner, A.J.; Murthy, N.; Chesson, H.W.; Biggerstaff, M.; Stoecker, C.; Harris, A.M.; Acosta, A.; Dooling, K.; Bridges, C.B. Cost-effectiveness of adult vaccinations: A systematic review. Vaccine 2019, 37, 226–234. [Google Scholar] [CrossRef]

| Season | Strain Circulation in Spain | Strain Circulation in Italy |
|---|---|---|
| 2010/11 | H1N1 | H1N1/B |
| 2011/12 | H3N2 | H3N2 |
| 2012/13 | B | H1N1/B |
| 2013/14 | H1N1/H3N2 | H1N1/H3N2 |
| 2014/15 | H3N2 | H1N1/H3N2/B |
| 2015/16 | H1N1 | H1N1/H3N2/B |
| 2016/17 | H3N2 | H3N2 |
| 2017/18 | B/H3N2 | H1N1/B |
| 2018/19 | Not available | H1N1/H3N2 |
| Age | N | % Healthy | % at Risk | At-Risk—Influenza Coverage | Overall—Influenza Coverage |
|---|---|---|---|---|---|
| 0–8 | 3,662,079 | 79.93% | 20.07% | 24.20% | 4.86% |
| 9–17 | 4,500,901 | 78.63% | 21.37% | 24.24% | 5.18% |
| 18–64 | 29,719,673 | 57.46% | 42.54% | 17.15% | 7.29% |
| ≥65 | 9,444,037 | 0 | 100% | 67.7% | 67.7% |
| Age Category | 0–4 | 5–17 | 18–49 | 50–64 | 65–69 | 70–74 | 75–79 | 80–84 | 85+ |
|---|---|---|---|---|---|---|---|---|---|
| Influenza vaccine coverage | 4.55% | 5.18% | 2.91% | 15.66% | 59.84% | 67.41% | 68.36% | 76.39% | 72.23% |
| Age Category | Viral Strain | ||
|---|---|---|---|
| H1N1 | H3N2 | B | |
| 0.5–1 | 69.0 (49.0–81.0) | 43.0 (28.0–55.0) | 66.5 (57.7–73.6) |
| 2–6 | 69.0 (49.0–81.0) | 43.0 (28.0–55.0) | 66.5 (57.7–73.6) |
| 7–17 | 73.0 (52.0–84.0) | 35.0 (14.0–41.0) | 77.0 (18.0–94.0) |
| 18–64 | 73.0 (49.0–81.0) | 35.0 (14.0–41.0) | 77.0 (18.0–94.0) |
| ≥65 | 62.0 (36.0–78.0) | 24.0 (−6.0–45.0) | 52.1 (41.5–60.8) |
| Meta-Analysis | rVE | Notes |
|---|---|---|
| Calabrò et al., 2021 [20] | 34.6% (95% CI: 2.0–66.0%) | Synthetized three studies that reported the relative effectiveness of aTIV against TIV, based on laboratory-confirmed influenza studies. |
| Coleman et al., 2021 [12] | 13.9% (95% CI 4.2–23.5%) | Studied the effectiveness of aTIV relative to vaccination with TIV. It included influenza-like-illness outcomes using influenza-related medical encounters for influenza with or without pneumonia in various clinical settings including outpatient, hospital, or emergency department. |
| Age Category | Probability of Medical Support Seeking, by Type | |||
|---|---|---|---|---|
| GP Visit [30] | GP Ambulatory [31] | GP Home Visit [31] | Emergency Room [31,32] | |
| 0–8 | 65.63% | 34.02% | 65.98% | 3.04% |
| 9–17 | 57.63% | 34.02% | 65.98% | 1.65% |
| 18–64 | 32.03% | 34.02% | 65.98% | 0.02% |
| ≥65 | 36.89% | 34.02% | 65.98% | 0.02% |
| Age Category | Probability of Influenza-Related Complications [31,33,34] | Distribution of Influenza Complications [31,32] | |||
|---|---|---|---|---|---|
| URTI | Bronchitis | Pneumonia | Other Respiratory | ||
| 0–8 | 22.21% | 54.46% | 43.31% | 2.23% | 0.00% |
| 9–17 | 15.09% | 54.55% | 43.64% | 1.82% | 0.00% |
| 18–64 LR | 29.98% | 52.33% | 39.52% | 3.63% | 4.52% |
| 18–64 HR | 55.33% | 52.33% | 39.52% | 3.63% | 4.52% |
| ≥65 | 63.65% | 52.33% | 39.52% | 3.63% | 4.52% |
| Hospitalizations by Complications [35,36] | |||||||
|---|---|---|---|---|---|---|---|
| Age Category | Probability Hosp. [31,32] | URTI | Bronchitis | Pneumonia w/o Comp. | Pneumonia with Comp. | COPD | Cardiac |
| 0–8 | 4.14% | 0.00% | 0.00% | 100.00% | 0.00% | 0.00% | 0.00% |
| 9–17 | 2.73% | 0.00% | 0.00% | 100.00% | 0.00% | 0.00% | 0.00% |
| 18–64 LR | 0.41% | 23.53% | 5.88% | 29.41% | 41.18% | 0.00% | 0.00% |
| 18–64 HR | 2.96% | 23.53% | 5.88% | 29.41% | 41.18% | 0.00% | 0.00% |
| ≥65 | 2.96% | 15.38% | 3.85% | 19.23% | 26.92% | 19.23% | 15.38% |
| Age Category | Resource | Probability (%) | Cost |
|---|---|---|---|
| 0–17 | URTI costs | N/A | €59.00 [40] |
| LRTI costs | €171.45 [39] | ||
| ≥ 18 [40] | Antibiotic treatment (×5 days) | 95.48% | €3.00 |
| Specialist visit | 1.04% | €215.00 | |
| X-ray thorax | 7.72% | €23.34 | |
| X-ray sinuses | 0.52% | €23.34 | |
| X-ray others | 0.28% | €23.34 | |
| Hematology | 0.61% | €4.00 | |
| ECG | 0.24% | €15.00 | |
| Blood analysis | 0.09% | €5.00 | |
| Throat swab | 0.05% | €18.00 | |
| Audiometry | 0.05% | €62.00 |
| Age Category | Utility [43,44] |
|---|---|
| 0–8 | 0.95 |
| 9–17 | 0.95 |
| 18–64 | 0.93 |
| ≥65 | 0.87 |
| Age Category | Medical Visits without Complications | Medical Visits with Complications | Hospitalizations | Deaths | ||||
|---|---|---|---|---|---|---|---|---|
| aQIV rVE = 34.6% | aQIV rVE = 13.9% | aQIV rVE = 34.6% | aQIV rVE = 13.9% | aQIV rVE = 34.6% | aQIV rVE = 13.9% | aQIV rVE = 34.6% | aQIV rVE = 13.9% | |
| 0–8 | 7253 | 3110 | 3015 | 1293 | 124 | 53 | 1 | 1 |
| 9–17 | 6964 | 3021 | 2089 | 906 | 57 | 25 | 1 | 1 |
| 18–64 | 8833 | 3847 | 18,529 | 8070 | 338 | 147 | 32 | 14 |
| ≥65 | 4221 | 1862 | 20,031 | 8835 | 592 | 261 | 535 | 236 |
| Total | 27,271 | 11,840 | 43,664 | 19,104 | 1111 | 486 | 569 | 252 |
| Age Category | Direct Medical Costs (Thousands) | Indirect Costs (Thousands) | QALYs | |||
|---|---|---|---|---|---|---|
| rVE = 34.6% | rVE = 13.9% | rVE = 34.6% | rVE = 13.9% | rVE = 34.6% | rVE = 13.9% | |
| 0–8 | −€1497 | −€642 | −€1905 | −€1023 | 112.8 | 64.9 |
| 9–17 | −€1074 | −€467 | −€1294 | −€828 | 109.8 | 63.4 |
| 18–64 | −€2540 | −€1109 | −€13,507 | −€5905 | 992.4 | 433.6 |
| ≥65 | €19,224 | €20,990 | −€1103 | −€487 | 5083.8 | 2242.6 |
| Total | €14,112 | €18,773 | −€17,808 | −€8243 | 6298.7 | 2804.5 |
| Age Category | Administration (Thousands) | Acquisition (Thousands) | |
|---|---|---|---|
| QIVe | aQIV | ||
| 0–8 | €9227 | €3379 | €3379 |
| 9–17 | €6048 | €2215 | €2215 |
| 18–64 | €56,236 | €20,595 | €20,595 |
| ≥65 | €165,850 | €60,739 | €83,117 |
| Total | €237,361 | €86,929 | €109,306 |
Publisher’s Note: MDPI stays neutral with regard to jurisdictional claims in published maps and institutional affiliations. |
© 2022 by the authors. Licensee MDPI, Basel, Switzerland. This article is an open access article distributed under the terms and conditions of the Creative Commons Attribution (CC BY) license (https://creativecommons.org/licenses/by/4.0/).
Share and Cite
Fochesato, A.; Sottile, S.; Pugliese, A.; Márquez-Peláez, S.; Toro-Diaz, H.; Gani, R.; Alvarez, P.; Ruiz-Aragón, J. An Economic Evaluation of the Adjuvanted Quadrivalent Influenza Vaccine Compared with Standard-Dose Quadrivalent Influenza Vaccine in the Spanish Older Adult Population. Vaccines 2022, 10, 1360. https://doi.org/10.3390/vaccines10081360
Fochesato A, Sottile S, Pugliese A, Márquez-Peláez S, Toro-Diaz H, Gani R, Alvarez P, Ruiz-Aragón J. An Economic Evaluation of the Adjuvanted Quadrivalent Influenza Vaccine Compared with Standard-Dose Quadrivalent Influenza Vaccine in the Spanish Older Adult Population. Vaccines. 2022; 10(8):1360. https://doi.org/10.3390/vaccines10081360
Chicago/Turabian StyleFochesato, Anna, Sara Sottile, Andrea Pugliese, Sergio Márquez-Peláez, Hector Toro-Diaz, Ray Gani, Piedad Alvarez, and Jesús Ruiz-Aragón. 2022. "An Economic Evaluation of the Adjuvanted Quadrivalent Influenza Vaccine Compared with Standard-Dose Quadrivalent Influenza Vaccine in the Spanish Older Adult Population" Vaccines 10, no. 8: 1360. https://doi.org/10.3390/vaccines10081360
APA StyleFochesato, A., Sottile, S., Pugliese, A., Márquez-Peláez, S., Toro-Diaz, H., Gani, R., Alvarez, P., & Ruiz-Aragón, J. (2022). An Economic Evaluation of the Adjuvanted Quadrivalent Influenza Vaccine Compared with Standard-Dose Quadrivalent Influenza Vaccine in the Spanish Older Adult Population. Vaccines, 10(8), 1360. https://doi.org/10.3390/vaccines10081360