
Economic-Related Inequalities in Zero-Dose Children: A Study of Non-Receipt of Diphtheria–Tetanus–Pertussis Immunization Using Household Health Survey Data from 89 Low- and Middle-Income Countries

 ,
,  , , ,
, , ,  , , and
Abstract
:1. Introduction
2. Materials and Methods
2.1. Data
2.2. Country Selection
2.3. Statistical Analysis
3. Results
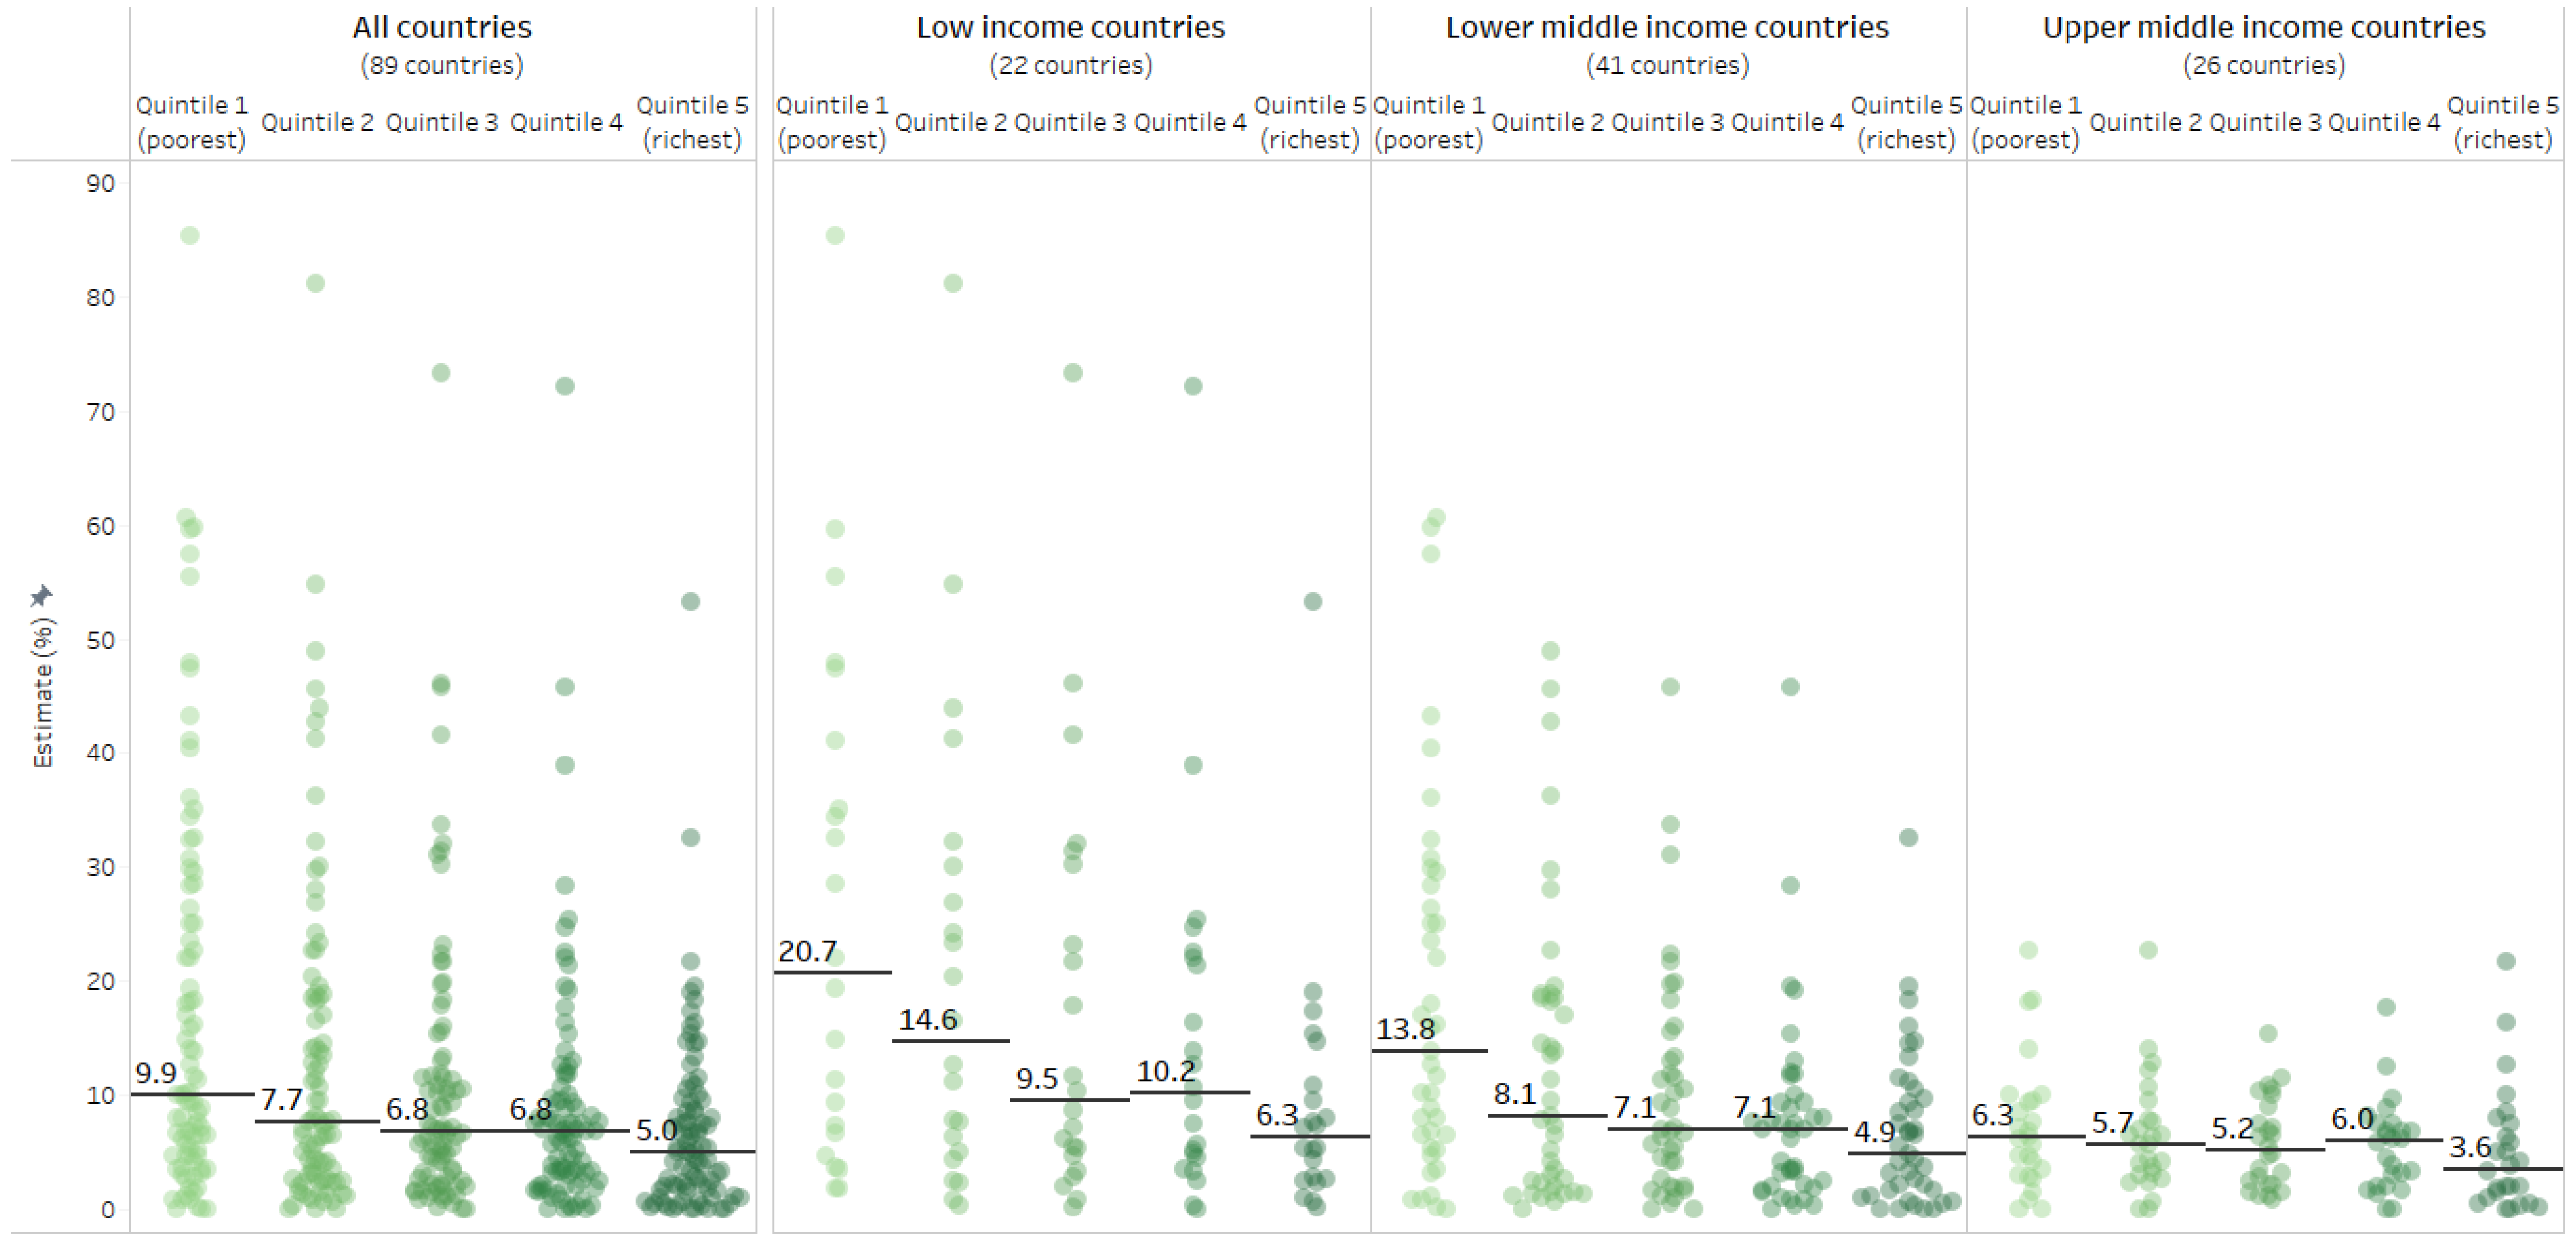
3.1. Latest Situation
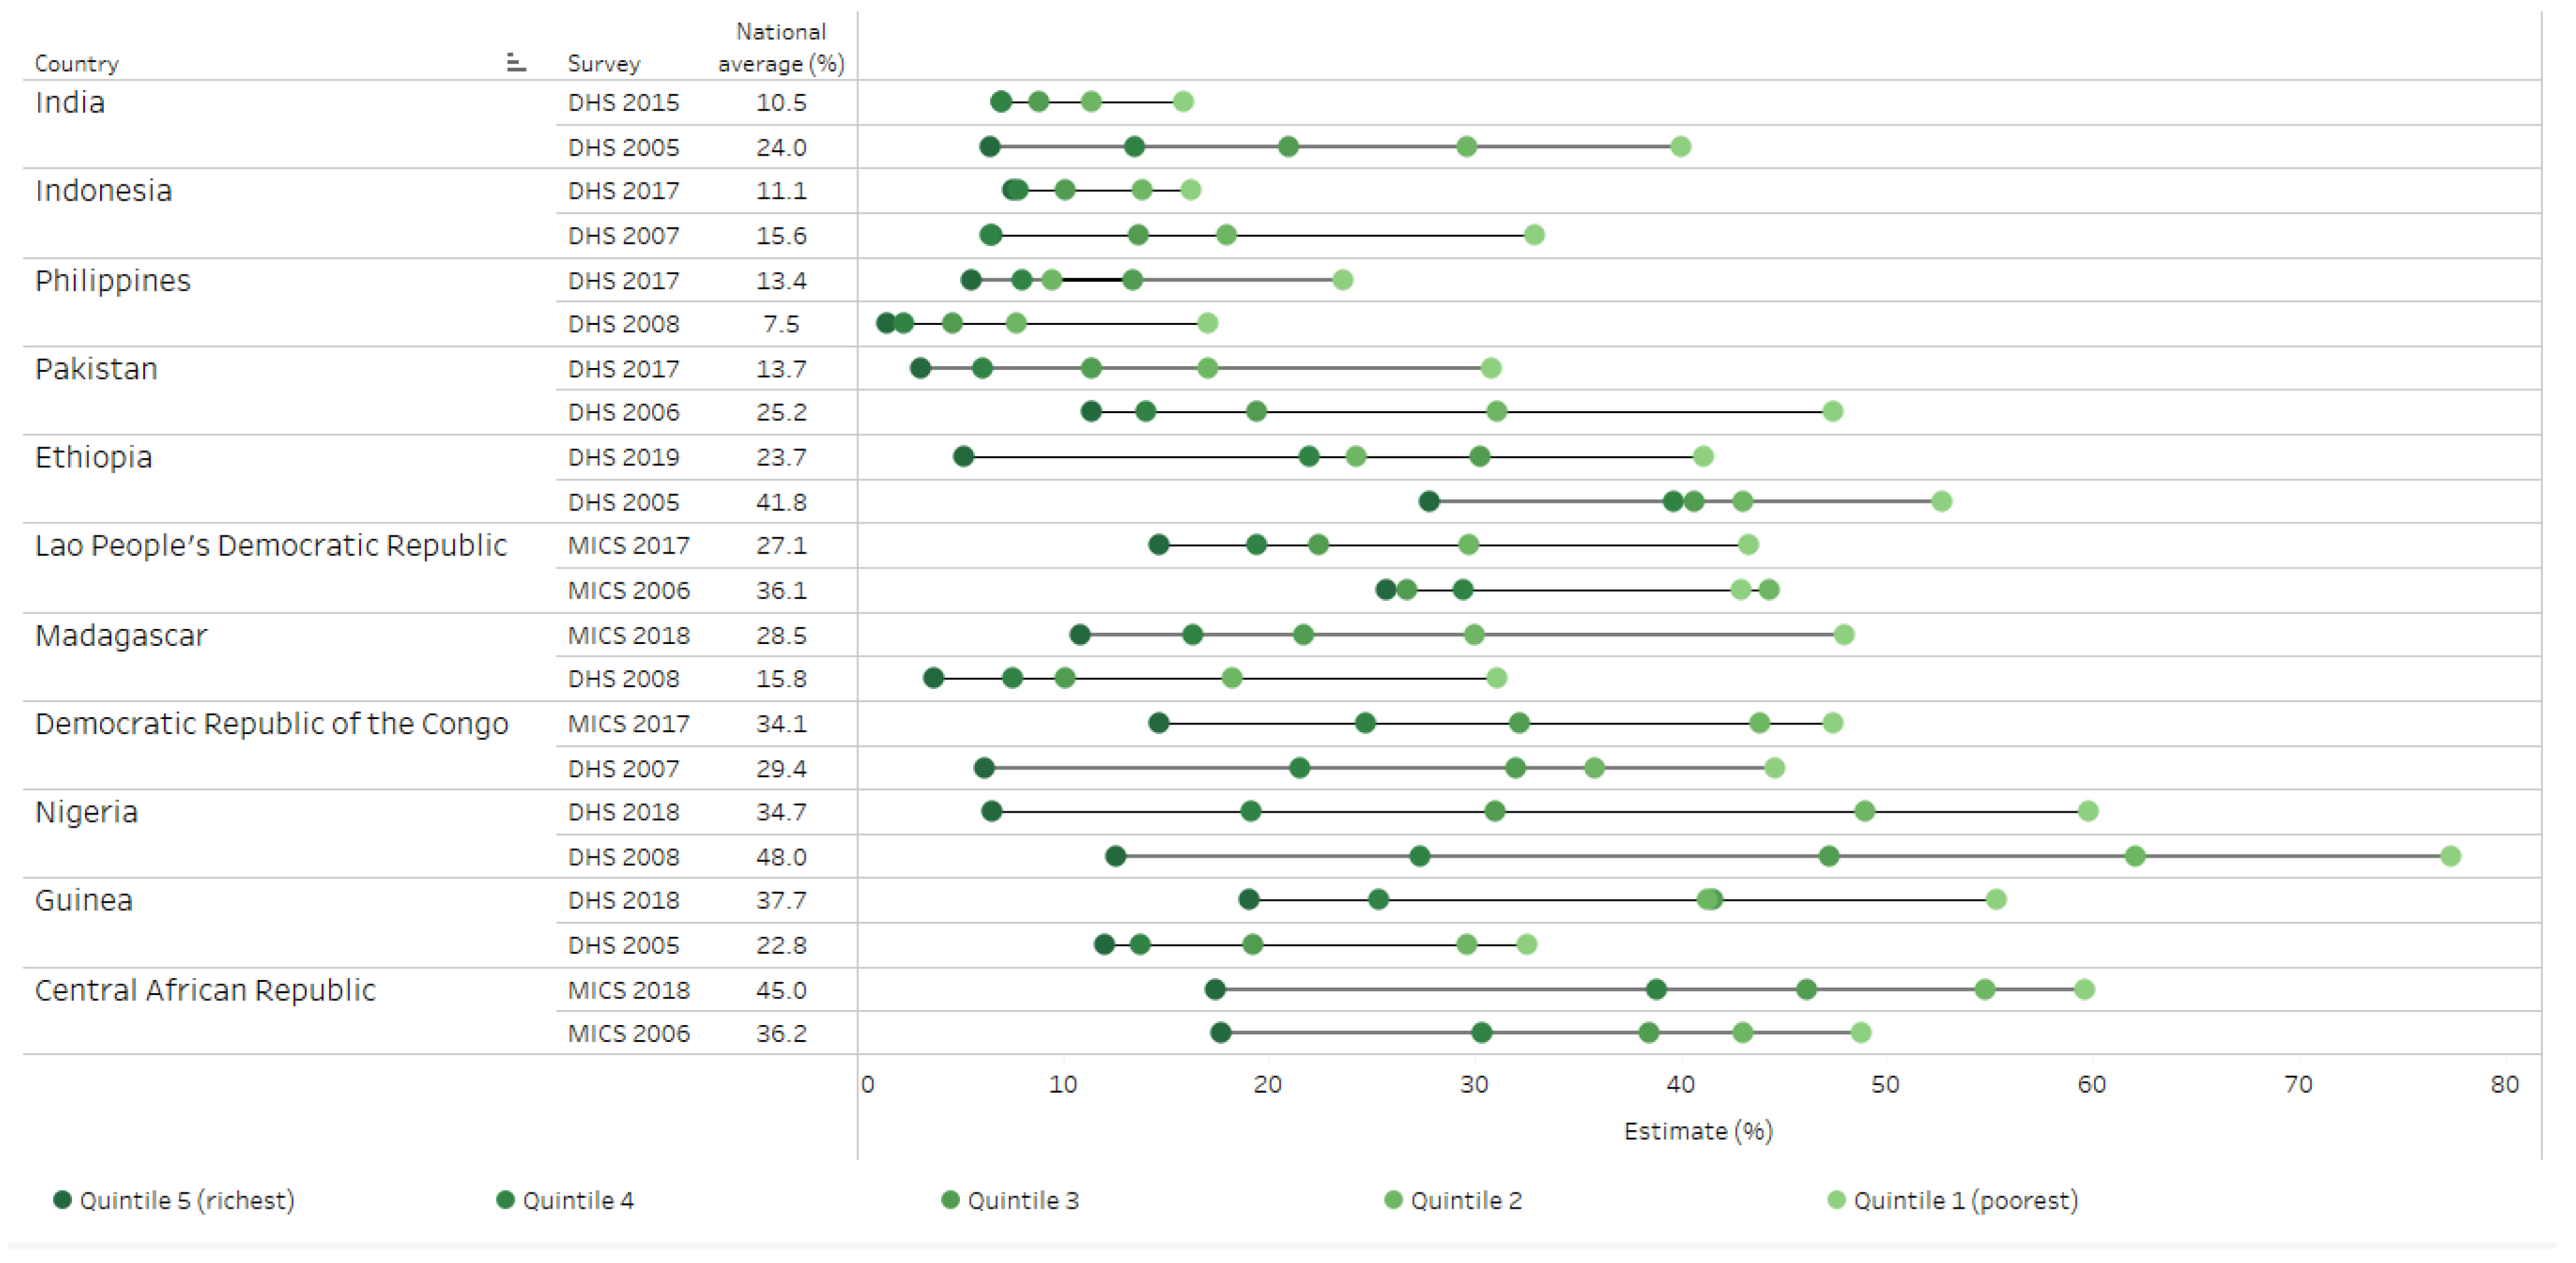
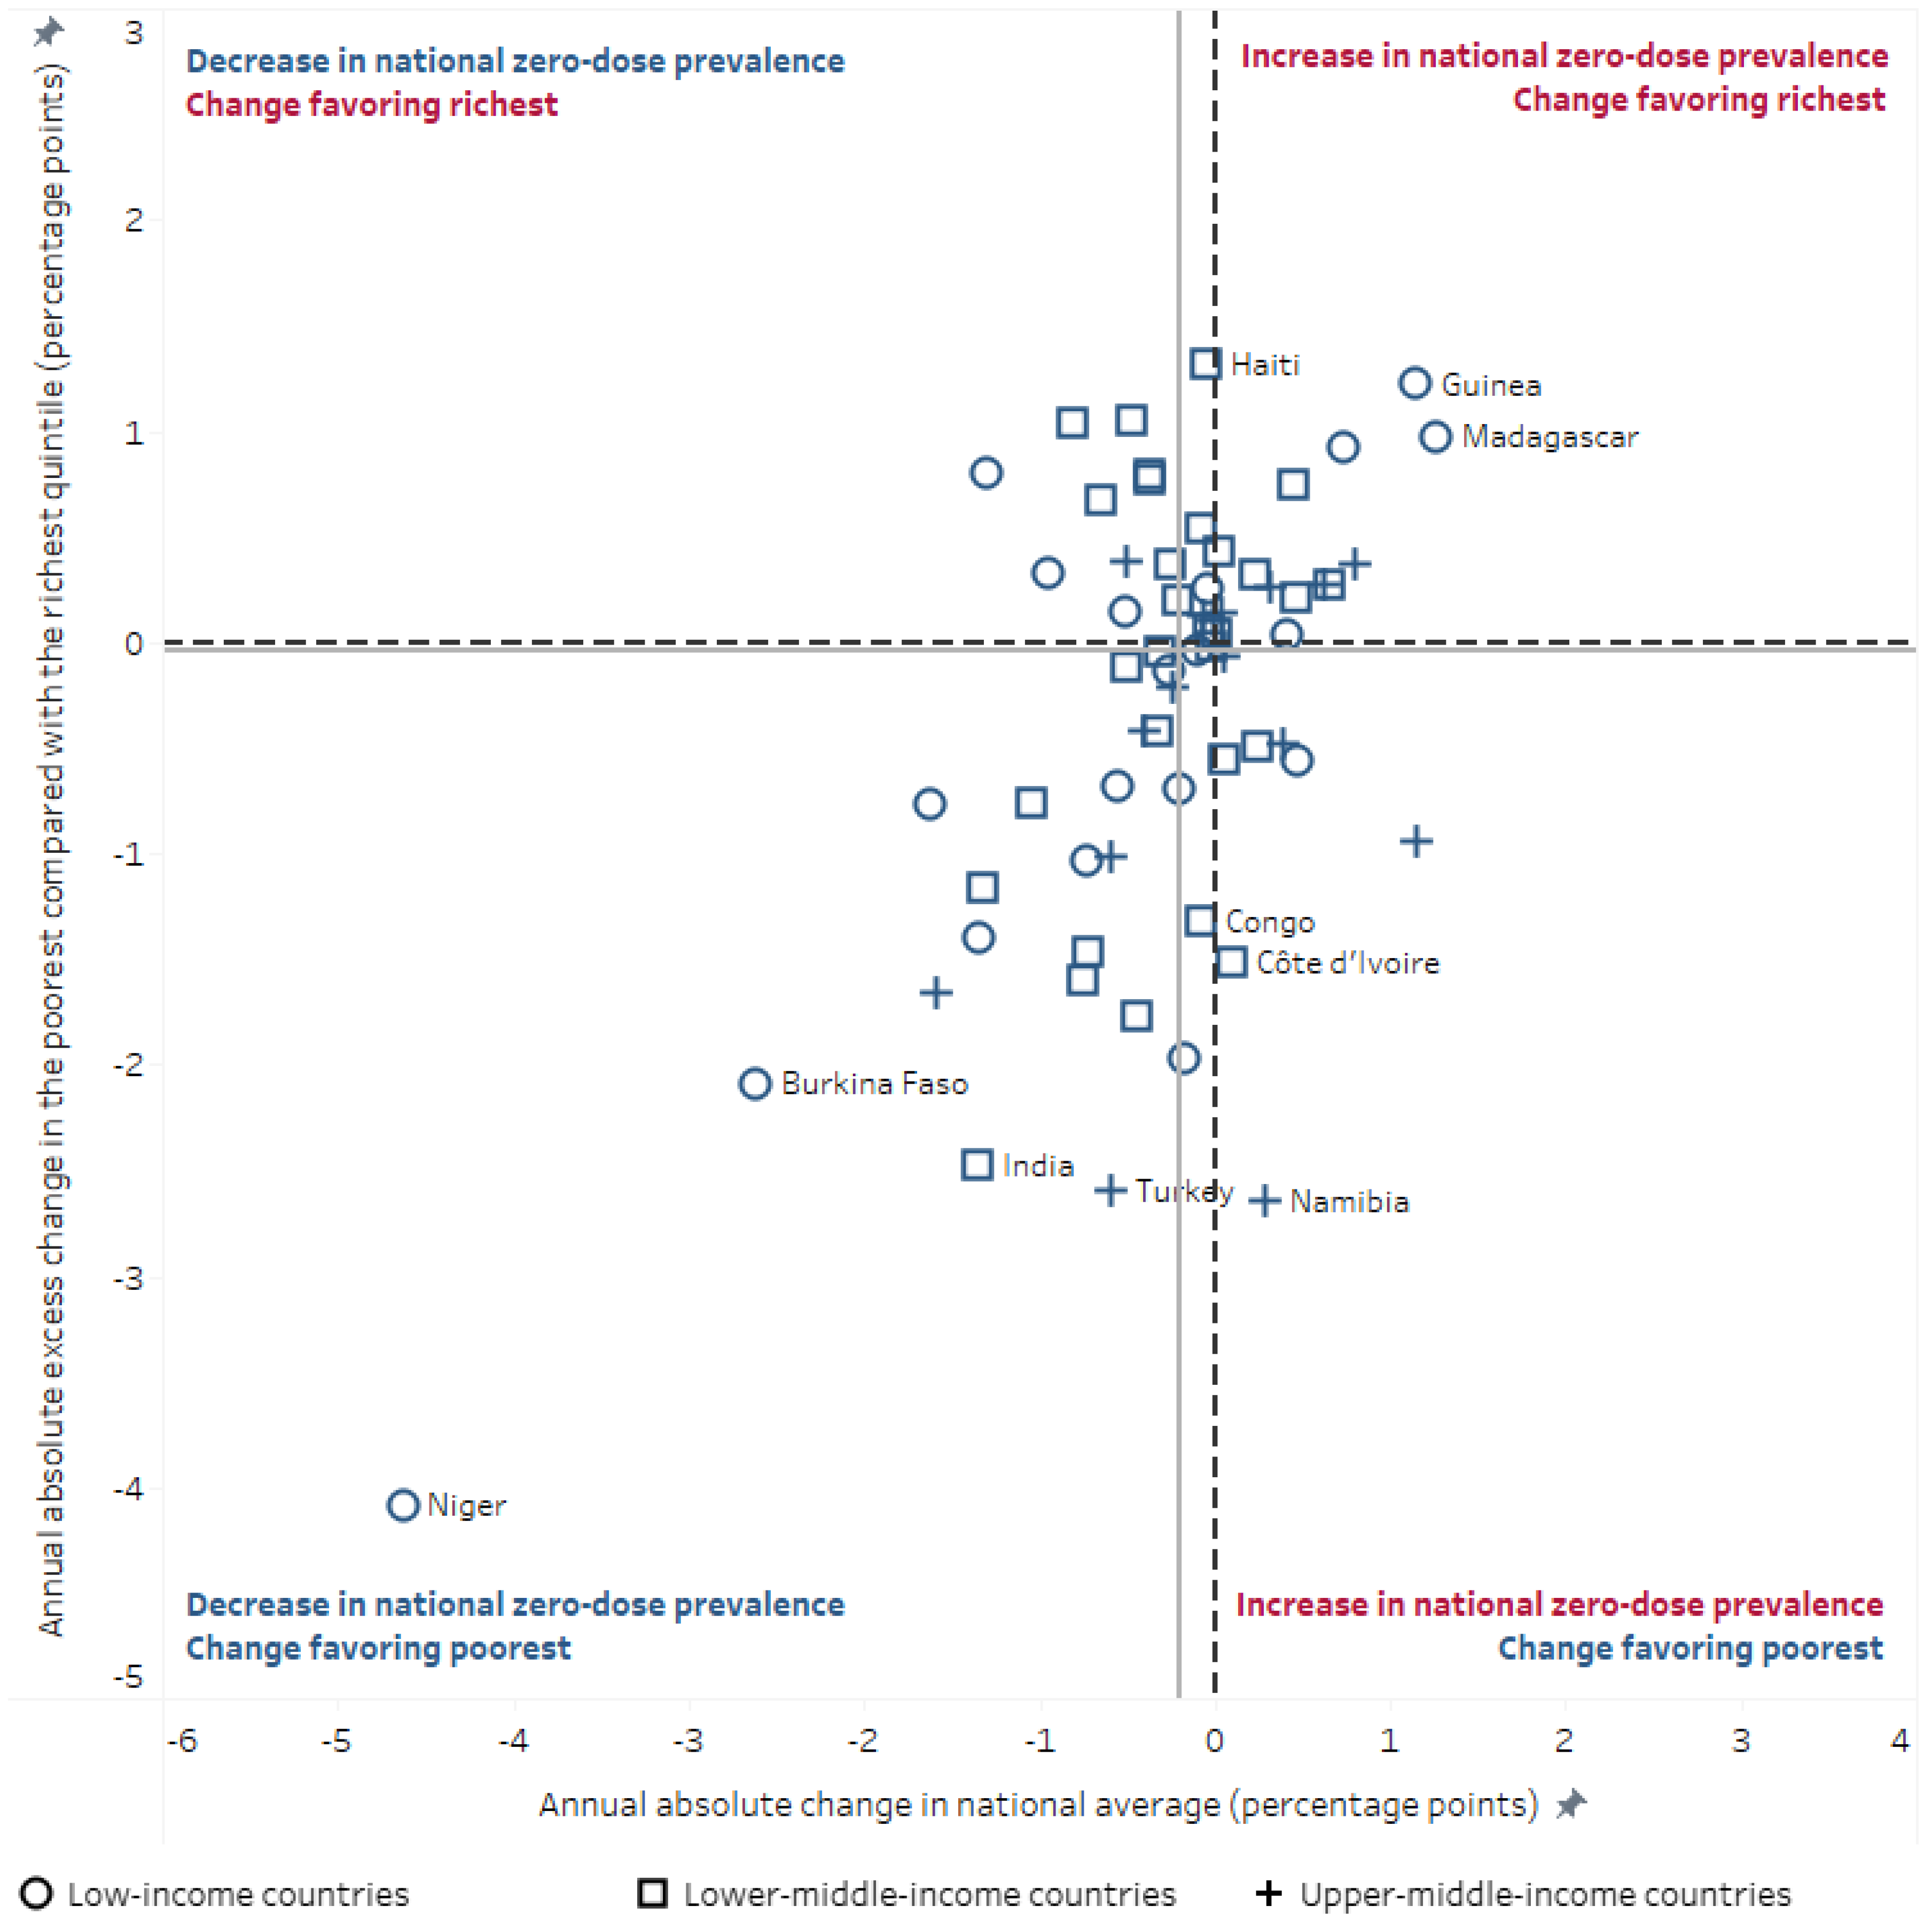
3.2. Change over Time
3.3. Countries with High Prevalence or Number of Children with Zero-Dose DTP
4. Discussion
5. Conclusions
Author Contributions
Funding
Institutional Review Board Statement
Informed Consent Statement
Data Availability Statement
Acknowledgments
Conflicts of Interest
References
- World Health Organization. Immunization Agenda 2030: A Global Strategy to Leave No One Behind. 2020. Available online: https://www.who.int/publications/m/item/immunization-agenda-2030-a-global-strategy-to-leave-no-one-behind (accessed on 6 January 2022).
- World Health Organization. Essential Programme on Immunization: Reducing Missed Opportunities for Vaccination (MOV). 2022. Available online: https://www.who.int/teams/immunization-vaccines-and-biologicals/essential-programme-on-immunization/implementation/reducing-missed-opportunities-for-vaccination-(mov) (accessed on 6 January 2022).
- Galles, N.C.; Liu, P.Y.; Updike, R.L.; Fullman, N.; Nguyen, J.; Rolfe, S.; Sbarra, A.N.; Schipp, M.F.; Marks, A.; Abady, G.G.; et al. Measuring routine childhood vaccination coverage in 204 countries and territories, 1980–2019: A systematic analysis for the Global Burden of Disease Study 2020, Release 1. Lancet 2021, 398, 503–521. [Google Scholar] [CrossRef]
- Shet, A.; Carr, K.; Danovaro-Holliday, M.C.; Sodha, S.V.; Prosperi, C.; Wunderlich, J.; Wonodi, C.; Reynolds, H.W.; Mirza, I.; Gacic-Dobo, M.; et al. Impact of the SARS-CoV-2 pandemic on routine immunisation services: Evidence of disruption and recovery from 170 countries and territories. Lancet Glob. Health 2021, 10, e186–e194. [Google Scholar] [CrossRef]
- Causey, K.; Fullman, N.; Sorensen, R.J.D.; Galles, N.C.; Zheng, P.; Aravkin, A.; Danovaro-Holliday, M.C.; Martinez-Piedra, R.; Sodha, S.V.; Velandia-González, M.P.; et al. Estimating global and regional disruptions to routine childhood vaccine coverage during the COVID-19 pandemic in 2020: A modelling study. Lancet 2021, 398, 522–534. [Google Scholar] [CrossRef]
- Muhoza, P.; Danovaro-Holliday, M.C.; Diallo, M.S.; Murphy, P.; Sodha, S.V.; Requejo, J.H.; Wallace, A.S. Routine vaccination coverage—Worldwide, 2020. Morb. Mortal Wkly. Rep. 2021, 70, 1495–1500. [Google Scholar] [CrossRef]
- Santos, T.M.; Cata-Preta, B.O.; Victora, C.G.; Barros, A.J.D. Finding children with high risk of non-vaccination in 92 low- and middle-income countries: A decision tree approach. Vaccines 2021, 9, 646. [Google Scholar] [CrossRef]
- Shenton, L.M.; Wagner, A.L.; Bettampadi, D.; Masters, N.B.; Carlson, B.F.; Boulton, M.L. Factors associated with vaccination status of children aged 12–48 months in India, 2012–2013. Matern. Child Health J. 2018, 22, 419–428. [Google Scholar] [CrossRef]
- Cata-Preta, B.O.; Santos, T.M.; Mengistu, T.; Hogan, D.R.; Barros, A.J.D.; Victora, C.G. Zero-dose children and the immunisation cascade: Understanding immunisation pathways in low and middle-income countries. Vaccines 2021, 39, 4564–4570. [Google Scholar] [CrossRef]
- Gavi, the Vaccine Alliance. Reaching Zero-Dose Children. 2021. Available online: https://www.gavi.org/our-alliance/strategy/phase-5-2021-2025/equity-goal/zero-dose-children-missed-communities (accessed on 6 January 2022).
- Equity Reference Group for Immunization. A Focus on “Zero Dose” Children: Key Issues for Consideration. Equity Reference Group for Immunization. 2020. Available online: https://irp.cdn-website.com/44236788/files/uploaded/ERG%20Discussion%20Paper%209%20Zero%20Dose%20FINAL.pdf (accessed on 7 January 2022).
- Bobo, F.T.; Asante, A.; Woldie, M.; Dawson, A.; Hayen, A. Child vaccination in sub-Saharan Africa: Increasing coverage addresses inequalities. Vaccines 2022, 40, 141–150. [Google Scholar] [CrossRef]
- Bosch-Capblanch, X.; Banerjee, K.; Burton, A. Unvaccinated children in years of increasing coverage: How many and who are they? Evidence from 96 low- and middle-income countries: Unvaccinated children in years of increasing coverage. Trop. Med. Int. Health 2012, 17, 697–710. [Google Scholar] [CrossRef] [Green Version]
- Feletto, M.; Sharkey, A. The influence of gender on immunisation: Using an ecological framework to examine intersecting inequities and pathways to change. BMJ Glob. Health 2019, 4, e001711. [Google Scholar] [CrossRef] [Green Version]
- Johri, M.; Rajpal, S.; Subramanian, S.V. Progress in reaching unvaccinated (zero-dose) children in India, 1992–2016: A multilevel, geospatial analysis of repeated cross-sectional surveys. Lancet Glob. Health 2021, 9, e1697–e1706. [Google Scholar] [CrossRef]
- Ghosh, A.; Laxminarayan, R. Demand- and supply-side determinants of diphtheria-pertussis-tetanus nonvaccination and dropout in rural India. Vaccines 2017, 35, 1087–1093. [Google Scholar] [CrossRef] [PubMed]
- World Health Organization and UNICEF; UNICEF Immunization Unit. Immunization Coverage: Are We Losing Ground? 2020. Available online: https://data.unicef.org/resources/immunization-coverage-are-we-losing-ground/ (accessed on 7 January 2022).
- Schlotheuber, A.; Hosseinpoor, A.R. Summary measures of health inequality: A review of existing measures and their application. Int. J. Environ. Res. Public Health 2022, 19, 3697. [Google Scholar] [CrossRef] [PubMed]
- Alhassan, J.A.K.; Wariri, O.; Onuwabuchi, E.; Mark, G.; Kwarshak, Y.; Dase, E. Access to skilled attendant at birth and the coverage of the third dose of diphtheria-tetanus-pertussis vaccine across 14 West African countries—An equity analysis. Int. J. Equity Health 2020, 19, 78. [Google Scholar] [CrossRef]
- Hosseinpoor, A.R.; Bergen, N.; Schlotheuber, A.; Gacic-Dobo, M.; Hansen, P.M.; Senouci, K.; Boerma, T.; Barros, A.J.D. State of inequality in diphtheria-tetanus-pertussis immunisation coverage in low-income and middle-income countries: A multicountry study of household health surveys. Lancet Glob. Health 2016, 4, e617–e626. [Google Scholar] [CrossRef] [Green Version]
- Arsenault, C.; Harper, S.; Nandi, A.; Mendoza Rodríguez, J.M.; Hansen, P.M.; Johri, M. Monitoring equity in vaccination coverage: A systematic analysis of demographic and health surveys from 45 Gavi-supported countries. Vaccines 2017, 35, 951–959. [Google Scholar] [CrossRef]
- Casey, R.M.; Hampton, L.M.; Anya, B.-P.M.; Gacic-Dobo, M.; Diallo, M.S.; Wallace, A.S. State of equity: Childhood immunization in the World Health Organization African region. PAN Afr. Med. J. 2017, 27, 5. [Google Scholar] [CrossRef]
- Chopra, M.; Bhutta, Z.; Blanc, D.C.; Checchi, F.; Gupta, A.; Lemango, E.T.; Levine, O.S.; Lyimo, D.; Nandy, R.; O’Brien, K.L.; et al. Addressing the persistent inequities in immunization coverage. Bull. World Health Organ. 2020, 98, 146–148. [Google Scholar] [CrossRef]
- Merten, S.; Hilber, A.M.; Biaggi, C.; Secula, F.; Bosch-Capblanch, X.; Namgyal, P.; Hombach, J. Gender determinants of vaccination status in children: Evidence from a meta-ethnographic systematic review. PLoS ONE 2015, 10, e0135222. [Google Scholar] [CrossRef]
- Bangura, J.B.; Xiao, S.; Qiu, D.; Ouyang, F.; Chen, L. Barriers to childhood immunization in sub-Saharan Africa: A systematic review. BMC Public Health 2020, 20, 1108. [Google Scholar] [CrossRef]
- Hajizadeh, M. Socioeconomic inequalities in child vaccination in low/middle-income countries: What accounts for the differences? J. Epidemiol. Community Health 2018, 72, 719–725. [Google Scholar] [CrossRef] [PubMed]
- Arsenault, C.; Johri, M.; Nandi, A.; Mendoza Rodríguez, J.M.; Hansen, P.M.; Harper, S. Country-level predictors of vaccination coverage and inequalities in Gavi-supported countries. Vaccines 2017, 35, 2479–2488. [Google Scholar] [CrossRef] [PubMed]
- Patenaude, B.; Odihi, D.; Sriudomporn, S.; Mak, J.; Watts, E.; de Broucker, G. A Standardized Approach for Measuring multi-Dimensional Equity in Vaccination Coverage, Cost-of-Illness, and Health Outcomes: Evidence from the Vaccine Economics Research for Sustainability & Equity (VERSE) Project. SSRN Electron. J. 2021. Available online: https://www.ssrn.com/abstract=3945450 (accessed on 9 February 2022).
- Ozawa, S.; Yemeke, T.T.; Evans, D.R.; Pallas, S.E.; Wallace, A.S.; Lee, B.Y. Defining hard-to-reach populations for vaccination. Vaccines 2019, 37, 5525–5534. [Google Scholar] [CrossRef] [PubMed]
- Cutts, F.T.; Danovaro-Holliday, M.C.; Rhoda, D.A. Challenges in measuring supplemental immunization activity coverage among measles zero-dose children. Vaccine 2021, 39, 1359–1363. [Google Scholar] [CrossRef] [PubMed]


| Country | Source | National Average (95% CI) | Quintile 1 (Poorest) (95% CI) | Quintile 2 (95% CI) | Quintile 3 (95% CI) | Quintile 4 (95% CI) | Quintile 5 (Richest) (95% CI) | Difference (95% CI) | Ratio (95% CI) | Slope Index of Inequality (95% CI) | Concentration Index (95% CI) |
|---|---|---|---|---|---|---|---|---|---|---|---|
| Median (All Countries) | 7.6 (4.3–10.9) | 9.9 (5.0–14.9) | 7.7 (3.7–11.8) | 6.8 (3.4–10.2) | 6.8 (4.0–9.7) | 5.0 (2.9–7.1) | 6.3 (2.6–10.0) | 2.59 (0.19–4.98) | −7.8 (−12.2–−3.4) | −18.8 (−23.6–−14.1) | |
| Low-Income Countries | |||||||||||
| Median (Low-Income Countries) | 11.9 (2.1–21.7) | 20.7 (8.4–33.0) | 14.6 (3.4–25.8) | 9.5 (−1.1–20.2) | 10.2 (1.3–19.1) | 6.3 (0.2–12.4) | 15.7 (8.0–23.4) | 2.97 (−4.83–10.78) | −19.1 (−28.0–−10.2) | −19.5 (−25.5–−13.6) | |
| Afghanistan | DHS 2015 | 27.0 (23.8–30.5) | 34.3 (29.8–39.2) | 32.3 (26.8–38.2) | 31.3 (24.4–39.3) | 22.6 (18.0–28.0) | 15.3 (12.0–19.3) | 19.1 (13.1–25.0) | 2.25 (1.71–2.95) | −22.5 (−29.9–−15.0) | −14.6 (−19.8–−9.5) |
| Burkina Faso | DHS 2010 | 5.6 (4.5–7.1) | 9.3 (6.5–13.3) | 6.3 (4.4–9.1) | 5.6 (3.9–7.8) | 3.4 (2.0–5.8) | 2.8 (1.3–5.7) | 6.5 (2.6–10.5) | 3.35 (1.48–7.56) | −7.8 (−12.2–−3.3) | −21.8 (−32.4–−11.1) |
| Burundi | DHS 2016 | 0.8 (0.5–1.2) | 1.9 (0.9–3.6) | 0.8 (0.3–2.0) | 0.2 (0.0–1.3) | 0.4 (0.1–1.5) | 0.7 (0.3–2.0) | 1.1 (−0.3–2.6) | 2.59 (0.76–8.84) | −1.5 (−3.0–0.1) | −32.7 (−58.7–−6.7) |
| Central African Republic | MICS 2018 | 45.0 (41.7–48.3) | 59.6 (52.9–66.0) | 54.8 (48.0–61.5) | 46.1 (39.6–52.8) | 38.8 (33.1–44.9) | 17.4 (13.3–22.5) | 42.2 (34.2–50.2) | 3.42 (2.57–4.56) | −44.9 (−53.8–−36.0) | −17.3 (−20.6–−13.9) |
| Democratic Republic of the Congo | MICS 2017 | 34.1 (30.2–38.2) | 47.4 (41.1–53.8) | 43.8 (37.4–50.4) | 32.1 (25.6–39.4) | 24.7 (17.6–33.5) | 14.7 (10.3–20.6) | 32.7 (24.5–40.9) | 3.22 (2.22–4.68) | −38.4 (−48.5–−28.4) | −20.5 (−25.5–−15.5) |
| Ethiopia | DHS 2019 | 23.7 (19.2–28.9) | 41.2 (30.4–52.8) | 24.2 (16.3–34.3) | 30.3 (20.5–42.3) | 22.0 (13.3–34.1) | 5.2 (2.2–12.0) | 35.9 (23.8–48.1) | 7.89 (3.22–19.33) | −39.5 (−52.6–−26.5) | −28.2 (−36.9–−19.5) |
| Gambia | MICS 2018 | 3.2 (2.2–4.7) | 3.7 (1.9–6.9) | 2.6 (1.1–6.0) | 2.9 (1.4–5.9) | 4.8 (1.9–11.4) | 2.3 (0.6–8.5) | 1.4 (−2.4–5.3) | 1.63 (0.36–7.26) | −0.4 (−5.0–4.2) | 1.3 (−20.6–23.2) |
| Guinea | DHS 2018 | 37.7 (34.1–41.4) | 55.4 (47.2–63.2) | 41.3 (35.1–47.7) | 41.6 (34.6–48.8) | 25.4 (19.9–31.8) | 19.0 (13.6–26.0) | 36.3 (26.2–46.5) | 2.91 (2.04–4.15) | −41.5 (−52.2–−30.8) | −19.8 (−24.7–−15.0) |
| Guinea-Bissau | MICS 2018 | 7.0 (5.2–9.4) | 7.4 (4.1–12.9) | 7.8 (5.0–12.2) | 3.3 (1.5–6.8) | 9.6 (6.1–14.8) | 7.6 (3.6–15.3) | −0.2 (−7.2–6.7) | 0.97 (0.39–2.45) | 0.6 (−7.2–8.5) | 1.0 (−17.3–19.2) |
| Liberia | DHS 2019 | 8.6 (6.3–11.5) | 11.4 (8.1–15.9) | 7.7 (4.5–12.9) | 8.7 (3.7–19.2) | 10.7 (5.5–19.7) | 0.2 (0.0–1.2) | 11.3 (7.5–15.1) | 70.75 (9.53–525.14) | −7.9 (−15.8–0.1) | −15.7 (−32.6–1.1) |
| Madagascar | MICS 2018 | 28.5 (25.9–31.2) | 48.0 (43.2–52.8) | 30.0 (25.5–34.8) | 21.7 (17.5–26.5) | 16.3 (12.1–21.6) | 10.9 (7.6–15.3) | 37.1 (31.0–43.3) | 4.42 (3.08–6.34) | −44.8 (−51.9–−37.7) | −27.5 (−31.8–−23.3) |
| Malawi | DHS 2015 | 2.6 (1.9–3.5) | 3.5 (2.0–5.9) | 2.3 (1.3–4.1) | 1.9 (1.0–3.5) | 2.6 (1.3–5.1) | 2.5 (1.2–5.2) | 1.0 (−1.6–3.6) | 1.39 (0.56–3.43) | −1.2 (−4.0–1.6) | −6.6 (−22.5–9.4) |
| Mali | DHS 2018 | 17.9 (15.1–21.1) | 28.6 (21.7–36.7) | 20.4 (15.2–26.7) | 17.8 (13.6–22.9) | 13.9 (10.0–19.1) | 7.4 (4.8–11.2) | 21.2 (13.1–29.4) | 3.87 (2.36–6.35) | −23.7 (−33.2–−14.3) | −22.6 (−29.5–−15.7) |
| Mozambique | DHS 2015 | 10.0 (6.8–14.4) | 19.4 (13.0–27.9) | 12.7 (6.5–23.4) | 5.4 (2.9–9.6) | 4.5 (1.8–10.8) | 2.7 (1.1–6.4) | 16.7 (8.9–24.5) | 7.09 (2.78–18.13) | −22.9 (−34.9–−11.0) | −35.7 (−46.0–−25.5) |
| Niger | DHS 2012 | 13.8 (11.6–16.5) | 22.0 (17.4–27.4) | 16.5 (12.3–21.8) | 11.6 (8.4–16.0) | 12.7 (8.1–19.4) | 7.2 (4.9–10.7) | 14.7 (9.0–20.5) | 3.04 (1.93–4.78) | −15.8 (−22.7–−8.9) | −20.6 (−28.0–−13.2) |
| Rwanda | DHS 2014 | 0.9 (0.5–1.7) | 1.9 (0.8–4.5) | 0.4 (0.1–2.9) | 0.9 (0.2–3.9) | 0.0 (0.0–0.0) | 1.1 (0.3–3.2) | 0.9 (−1.2–2.9) | 1.81 (0.44–7.42) | −1.3 (−3.5–1.0) | −25.5 (−61.7–10.8) |
| Sierra Leone | DHS 2019 | 5.4 (4.2–6.9) | 6.6 (4.4–9.9) | 4.4 (2.5–7.5) | 7.2 (4.6–11.0) | 3.5 (1.8–6.7) | 4.4 (2.0–9.5) | 2.3 (−2.1–6.6) | 1.52 (0.62–3.68) | −2.6 (−7.2–2.1) | −6.7 (−20.5–7.1) |
| South Sudan * | MICS 2010 | 72.7 (69.6–75.5) | 85.3 (79.7–89.6) | 81.2 (76.2–85.4) | 73.3 (67.1–78.8) | 72.2 (66.5–77.3) | 53.2 (46.4–59.9) | 32.1 (23.8–40.5) | 1.60 (1.40–1.84) | −36.2 (−45.5–−26.9) | −8.6 (−10.9–−6.3) |
| Sudan | MICS 2014 | 16.8 (14.3–19.6) | 35.0 (28.1–42.5) | 23.4 (18.8–28.7) | 10.4 (7.6–13.9) | 7.5 (5.0–11.0) | 5.4 (3.0–9.5) | 29.6 (21.8–37.5) | 6.53 (3.51–12.15) | −38.2 (−47.5–−28.9) | −36.7 (−43.7–−29.7) |
| Togo | MICS 2017 | 9.2 (6.8–12.2) | 14.9 (10.4–20.9) | 11.1 (5.9–19.9) | 6.2 (3.2–11.8) | 5.2 (2.1–12.1) | 8.0 (4.0–15.3) | 6.9 (−0.6–14.4) | 1.86 (0.87–3.96) | −10.4 (−19.8–−1.0) | −16.5 (−34.0–0.9) |
| Uganda | DHS 2016 | 5.1 (4.1–6.3) | 4.7 (3.2–6.9) | 5.1 (3.3–7.7) | 4.7 (2.8–7.8) | 5.6 (3.6–8.7) | 5.4 (3.2–9.0) | −0.6 (−4.0–2.7) | 0.88 (0.46–1.68) | 0.9 (−2.9–4.6) | 1.7 (−10.7–14.1) |
| Yemen | DHS 2013 | 23.4 (21.2–25.8) | 32.5 (26.9–38.6) | 26.8 (22.8–31.3) | 23.3 (19.1–28.0) | 21.4 (17.2–26.2) | 9.5 (7.0–12.9) | 23.0 (16.4–29.5) | 3.41 (2.39–4.87) | −24.6 (−32.4–−16.8) | −19.2 (−24.2–−14.3) |
| Lower–Middle-Income Countries | |||||||||||
| Median (Lower–Middle-Income Countries) | 9.4 (5.3–13.4) | 13.8 (7.2–20.4) | 8.1 (2.8–13.4) | 7.1 (3.0–11.1) | 7.1 (3.8–10.4) | 4.9 (2.1–7.6) | 8.4 (2.7–14.1) | 3.23 (1.26–5.20) | −11.3 (−18.2–−4.4) | −23.8 (−31.7–−15.9) | |
| Algeria | MICS 2018 | 4.5 (3.7–5.5) | 6.9 (5.0–9.5) | 3.1 (2.0–4.6) | 5.2 (3.3–8.3) | 3.4 (2.0–5.9) | 3.3 (1.6–6.4) | 3.6 (0.5–6.8) | 2.12 (1.00–4.49) | −3.8 (−7.6–0.0) | −15.7 (−28.5–−3.0) |
| Angola | DHS 2015 | 31.2 (28.6–34.0) | 57.5 (51.6–63.2) | 42.7 (37.9–47.6) | 21.7 (17.6–26.4) | 12.1 (7.6–18.6) | 9.4 (5.8–14.8) | 48.1 (40.8–55.4) | 6.13 (3.81–9.86) | −59.7 (−67.1–−52.4) | −33.4 (−37.9–−28.9) |
| Belize | MICS 2015 | 7.1 (4.4–11.2) | 10.2 (4.7–21.0) | 1.5 (0.5–4.5) | 1.9 (0.5–7.7) | 7.1 (1.8–23.8) | 16.1 (7.2–32.3) | −5.9 (−20.3–8.6) | 0.64 (0.22–1.86) | 6.0 (−10.6–22.6) | 10.7 (−23.1–44.5) |
| Benin | DHS 2017 | 15.8 (13.8–17.9) | 32.4 (26.8–38.6) | 18.2 (14.7–22.3) | 11.8 (9.1–15.3) | 8.8 (6.3–12.0) | 6.9 (4.6–10.2) | 25.5 (19.1–32.0) | 4.71 (3.05–7.27) | −30.3 (−37.7–−22.9) | −32.6 (−38.8–−26.4) |
| Cambodia | DHS 2014 | 6.0 (4.6–7.9) | 11.7 (8.3–16.2) | 8.1 (5.0–13.0) | 6.9 (3.5–13.2) | 0.8 (0.2–2.9) | 0.6 (0.2–1.7) | 11.0 (7.1–15.0) | 18.82 (6.37–55.59) | −17.1 (−23.3–−10.9) | −43.2 (−53.4–−33.1) |
| Cameroon | DHS 2018 | 16.7 (14.2–19.5) | 29.9 (23.8–36.8) | 18.6 (13.7–24.7) | 15.6 (11.9–20.2) | 10.0 (6.8–14.6) | 4.9 (2.8–8.2) | 25.0 (18.0–32.0) | 6.15 (3.45–10.97) | −28.1 (−36.3–−19.9) | −29.1 (−35.7–−22.6) |
| Comoros | DHS 2012 | 17.8 (14.1–22.2) | 26.4 (16.9–38.7) | 22.6 (15.2–32.4) | 11.6 (6.8–18.9) | 11.8 (5.8–22.3) | 14.5 (7.9–25.1) | 11.9 (−1.9–25.7) | 1.82 (0.89–3.72) | −17.6 (−31.3–−3.9) | −15.7 (−28.4–−2.9) |
| Congo | MICS 2014 | 14.0 (12.0–16.3) | 28.5 (23.9–33.4) | 14.1 (10.6–18.6) | 7.2 (4.2–12.1) | 7.4 (4.2–12.8) | 8.7 (4.7–15.7) | 19.7 (12.6–26.8) | 3.26 (1.74–6.11) | −25.4 (−33.5–−17.4) | −32.6 (−42.1–−23.0) |
| Côte d’Ivoire | MICS 2016 | 19.6 (17.3–22.2) | 29.6 (24.7–34.9) | 18.9 (14.7–23.9) | 19.7 (15.2–25.1) | 11.8 (7.6–17.9) | 11.3 (6.4–19.0) | 18.3 (10.3–26.3) | 2.63 (1.48–4.66) | −22.2 (−30.9–−13.5) | −19.2 (−26.8–−11.7) |
| Egypt | DHS 2014 | 0.6 (0.3–1.1) | 1.2 (0.4–4.0) | 0.7 (0.2–2.4) | 0.5 (0.2–1.6) | 0.3 (0.1–1.2) | 0.3 (0.0–1.7) | 0.9 (−0.6–2.5) | 4.23 (0.49–36.52) | −1.0 (−2.5–0.5) | −33.6 (−68.2–1.0) |
| El Salvador | MICS 2014 | 1.1 (0.5–2.5) | 0.2 (0.0–1.5) | 0.9 (0.3–2.9) | 1.1 (0.4–2.7) | 3.3 (0.8–12.1) | 0.0 (0.0–0.0) | 0.2 (−0.2–0.6) | NA | 1.5 (−1.3–4.2) | 19.4 (−11.5–50.3) |
| Eswatini | MICS 2014 | 3.4 (2.1–5.6) | 4.7 (1.9–11.3) | 1.3 (0.3–5.3) | 1.9 (0.5–7.4) | 7.6 (3.0–18.0) | 2.6 (0.7–8.8) | 2.1 (−3.3–7.4) | 1.78 (0.39–8.23) | 0.4 (−6.2–6.9) | −3.2 (−37.6–31.2) |
| Ghana | MICS 2017 | 4.0 (2.8–5.8) | 5.4 (2.9–9.8) | 5.2 (2.5–10.4) | 4.1 (2.2–7.8) | 3.3 (1.4–7.3) | 2.2 (0.9–5.5) | 3.2 (−0.7–7.0) | 2.45 (0.81–7.44) | −4.4 (−9.7–1.0) | −17.1 (−34.4–0.2) |
| Haiti | DHS 2016 | 16.5 (13.3–20.1) | 25.1 (18.9–32.5) | 19.6 (13.1–28.3) | 16.1 (11.3–22.4) | 9.4 (5.4–15.7) | 4.4 (1.3–14.1) | 20.7 (12.1–29.3) | 5.73 (1.64–20.05) | −25.5 (−36.3–−14.6) | −25.5 (−34.7–−16.3) |
| Honduras | DHS 2011 | 0.9 (0.5–1.5) | 0.8 (0.2–2.6) | 1.3 (0.6–3.2) | 1.2 (0.4–3.3) | 0.9 (0.3–3.0) | 0.0 (0.0–0.0) | 0.8 (−0.2–1.8) | NA | −0.7 (−2.1–0.7) | −13.4 (−39.7–12.8) |
| India | DHS 2015 | 10.5 (10.1–10.9) | 15.8 (15.0–16.7) | 11.4 (10.5–12.2) | 8.8 (8.0–9.7) | 7.0 (6.2–7.9) | 7.1 (5.8–8.5) | 8.8 (7.2–10.4) | 2.24 (1.84–2.74) | −11.5 (−13.2–−9.8) | −18.9 (−21.7–−16.1) |
| Indonesia | DHS 2017 | 11.1 (9.8–12.7) | 16.2 (13.3–19.7) | 13.9 (10.9–17.5) | 10.2 (7.7–13.3) | 7.9 (5.6–10.9) | 7.6 (5.4–10.6) | 8.6 (4.6–12.7) | 2.14 (1.45–3.15) | −12.0 (−17.0–−6.9) | −18.6 (−25.6–−11.6) |
| Kenya | DHS 2014 | 2.5 (1.9–3.3) | 5.2 (3.8–6.9) | 1.6 (0.9–2.8) | 1.7 (0.5–5.8) | 0.8 (0.4–1.6) | 2.2 (0.8–5.9) | 3.0 (0.3–5.7) | 2.38 (0.83–6.86) | −3.8 (−6.8–−0.8) | −27.9 (−51.9–−3.9) |
| Kiribati | MICS 2018 | 40.1 (35.1–45.4) | 40.4 (29.3–52.5) | 36.3 (26.7–47.0) | 45.8 (35.2–56.7) | 45.8 (35.1–56.9) | 32.6 (22.0–45.4) | 7.7 (−8.9–24.4) | 1.24 (0.78–1.97) | −3.0 (−21.7–15.6) | −1.3 (−9.0–6.4) |
| Kyrgyzstan | MICS 2018 | 9.4 (6.7–12.9) | 10.2 (4.9–20.0) | 4.2 (1.8–9.6) | 7.1 (3.1–15.1) | 9.3 (4.7–17.5) | 18.3 (11.1–28.7) | −8.1 (−19.4–3.2) | 0.56 (0.24–1.30) | 8.7 (−3.0–20.4) | 18.0 (−0.7–36.8) |
| Lao People’s Democratic Republic | MICS 2017 | 27.1 (24.7–29.7) | 43.3 (38.0–48.7) | 29.7 (24.9–35.1) | 22.4 (18.1–27.4) | 19.5 (15.2–24.5) | 14.6 (10.8–19.5) | 28.7 (21.7–35.6) | 2.96 (2.14–4.08) | −34.5 (−42.3–−26.6) | −22.1 (−26.9–−17.2) |
| Lesotho | MICS 2018 | 8.5 (6.3–11.2) | 17.0 (11.0–25.3) | 7.4 (3.6–14.8) | 5.5 (2.5–11.5) | 3.7 (1.7–8.0) | 8.5 (3.8–18.2) | 8.4 (−1.3–18.2) | 1.99 (0.81–4.86) | −11.5 (−22.0–−1.1) | −19.8 (−37.7–−1.8) |
| Mauritania | MICS 2015 | 14.2 (12.1–16.6) | 25.0 (19.0–32.2) | 18.5 (14.6–23.3) | 13.0 (9.6–17.4) | 8.1 (5.3–12.1) | 4.1 (1.8–8.9) | 20.9 (13.6–28.3) | 6.10 (2.66–14.01) | −27.7 (−36.8–−18.6) | −31.3 (−39.8–−22.8) |
| Mongolia | MICS 2018 | 3.0 (1.9–4.5) | 3.6 (1.8–6.9) | 2.0 (0.9–4.3) | 4.1 (1.8–9.3) | 3.2 (1.2–7.8) | 1.6 (0.4–6.3) | 2.0 (−1.3–5.3) | 2.25 (0.48–10.55) | −1.1 (−4.9–2.6) | −3.2 (−25.8–19.4) |
| Myanmar | DHS 2015 | 13.1 (10.1–16.9) | 18.1 (12.1–26.1) | 18.9 (12.7–27.2) | 18.3 (10.7–29.4) | 2.2 (0.7–7.0) | 3.7 (1.2–10.9) | 14.4 (6.3–22.5) | 4.88 (1.51–15.74) | −21.6 (−32.5–−10.6) | −27.0 (−38.8–−15.3) |
| Nepal | MICS 2019 | 10.5 (8.5–13.0) | 13.8 (10.1–18.7) | 14.5 (10.1–20.4) | 9.4 (5.5–15.4) | 7.1 (3.9–12.4) | 6.6 (3.6–12.0) | 7.2 (1.3–13.1) | 2.09 (1.06–4.13) | −11.1 (−18.2–−4.1) | −16.8 (−27.2–−6.4) |
| Nigeria | DHS 2018 | 34.7 (32.7–36.7) | 59.8 (56.0–63.4) | 48.9 (44.8–53.1) | 31.0 (27.7–34.5) | 19.1 (16.3–22.3) | 6.6 (4.9–8.8) | 53.2 (49.0–57.4) | 9.08 (6.69–12.32) | −62.4 (−66.9–−57.9) | −32.5 (−35.0–−30.0) |
| Pakistan | DHS 2017 | 13.7 (11.2–16.5) | 30.8 (23.7–38.9) | 17.1 (12.2–23.3) | 11.4 (7.9–16.3) | 6.1 (3.8–9.7) | 3.1 (1.6–6.0) | 27.6 (19.7–35.6) | 9.85 (4.85–20.03) | −36.1 (−46.5–−25.7) | −39.7 (−47.1–−32.2) |
| Papua New Guinea | DHS 2016 | 36.1 (32.2–40.2) | 60.7 (51.9–68.9) | 45.6 (37.7–53.9) | 33.8 (27.6–40.6) | 28.4 (22.7–34.9) | 13.4 (9.1–19.1) | 47.3 (37.4–57.2) | 4.54 (3.06–6.75) | −51.9 (−61.7–−42.1) | −25.7 (−30.3–−21.1) |
| Philippines | DHS 2017 | 13.4 (11.5–15.5) | 23.6 (19.8–28.0) | 9.4 (6.5–13.5) | 13.4 (8.8–19.7) | 8.0 (4.6–13.4) | 5.6 (2.6–11.5) | 18.0 (12.2–23.9) | 4.22 (1.97–9.07) | −20.1 (−27.3–−12.9) | −26.4 (−35.2–−17.5) |
| Republic of Moldova | MICS 2012 | 0.0 (0.0–0.0) | 0.0 (0.0–0.0) ** | 0.0 (0.0–0.0) | 0.0 (0.0–0.0) | 0.0 (0.0–0.0) | 0.0 (0.0–0.0) | 0.0 (0.0–0.0) | NA | ||
| Sao Tome and Principe | MICS 2019 | 2.3 (1.1–4.7) | 6.5 (2.7–14.8) | 1.3 (0.2–8.8) | 0.0 (0.0–0.0) | 2.0 (0.3–12.4) | 0.0 (0.0–0.0) | 6.5 (1.0–12.0) | NA | −8.3 (−19.7–3.1) | −47.0 (−91.0–−3.0) |
| Senegal | DHS 2019 | 3.8 (2.6–5.6) | 8.9 (5.3–14.6) | 2.3 (1.0–5.5) | 4.5 (1.6–12.0) | 1.9 (0.6–5.5) | 0.5 (0.1–2.4) | 8.4 (3.8–13.0) | 17.91 (3.44–93.24) | −9.3 (−15.8–−2.9) | −41.9 (−61.2–−22.7) |
| Tajikistan | DHS 2017 | 7.6 (6.1–9.4) | 8.1 (5.1–12.6) | 6.5 (3.8–10.9) | 6.4 (4.2–9.8) | 7.7 (4.9–11.7) | 10.5 (7.3–14.8) | −2.4 (−7.6–2.8) | 0.77 (0.43–1.38) | 2.3 (−3.2–7.9) | 5.1 (−7.0–17.1) |
| Timor-Leste | DHS 2016 | 21.6 (18.8–24.7) | 36.0 (29.2–43.4) | 28.1 (22.4–34.6) | 19.8 (14.9–25.9) | 15.4 (11.5–20.4) | 9.8 (5.8–15.9) | 26.2 (17.6–34.9) | 3.69 (2.15–6.32) | −30.7 (−39.8–−21.6) | −25.6 (−32.7–−18.6) |
| Tunisia | MICS 2018 | 4.6 (3.1–6.7) | 0.8 (0.1–5.4) | 1.1 (0.3–4.4) | 6.7 (3.3–13.2) | 4.2 (1.8–9.5) | 11.5 (6.4–19.7) | −10.7 (−17.3–−4.1) | 0.07 (0.01–0.52) | 12.4 (4.9–19.9) | 45.4 (30.4–60.4) |
| Ukraine | MICS 2012 | 15.6 (12.1–20.0) | 22.1 (14.5–32.2) | 13.5 (6.8–25.1) | 10.4 (5.8–18.2) | 13.0 (6.3–25.0) | 19.5 (11.8–30.7) | 2.6 (−10.3–15.5) | 1.13 (0.61–2.12) | −1.5 (−15.8–12.9) | −0.0 (−15.6–15.5) |
| United Republic of Tanzania | DHS 2015 | 3.0 (2.2–4.2) | 6.6 (4.4–9.7) | 3.6 (1.9–6.7) | 2.7 (1.4–5.1) | 0.3 (0.1–1.4) | 1.2 (0.4–3.8) | 5.4 (2.5–8.3) | 5.55 (1.62–18.96) | −7.8 (−11.8–−3.9) | −41.4 (−55.5–−27.2) |
| Viet Nam | MICS 2013 | 3.8 (2.6–5.5) | 12.7 (8.2–19.3) | 2.6 (1.0–6.9) | 2.0 (0.5–8.0) | 1.7 (0.4–7.1) | 0.7 (0.1–5.0) | 12.0 (6.4–17.7) | 17.98 (2.39–135.16) | −12.8 (−19.8–−5.8) | −55.3 (−77.2–−33.5) |
| Zambia | DHS 2018 | 2.1 (1.4–3.1) | 3.1 (1.8–5.5) | 2.5 (1.2–5.1) | 1.8 (0.8–3.7) | 1.6 (0.5–5.1) | 1.0 (0.2–4.1) | 2.2 (−0.1–4.4) | 3.23 (0.67–15.59) | −2.7 (−5.6–0.2) | −22.2 (−43.0–−1.3) |
| Zimbabwe | MICS 2019 | 5.5 (3.9–7.6) | 8.0 (4.3–14.4) | 7.8 (4.3–13.7) | 5.8 (3.0–10.8) | 2.5 (1.0–6.0) | 1.7 (0.6–4.6) | 6.3 (1.2–11.4) | 4.65 (1.47–14.75) | −9.1 (−16.1–−2.0) | −26.4 (−40.9–−11.9) |
| Upper–Middle-Income Countries | |||||||||||
| Median (Upper–Middle-Income Countries) | 4.8 (2.7–6.9) | 6.3 (3.5–9.1) | 5.7 (3.2–8.1) | 5.2 (3.2–7.1) | 6.0 (4.1–8.0) | 3.6 (0.9–6.3) | 2.4 (−0.0–4.8) | 1.92 (−1.12–4.95) | −3.6 (−6.9–−0.4) | −9.1 (−17.7–−0.5) | |
| Albania | DHS 2017 | 0.5 (0.1–1.8) | 0.9 (0.1–6.2) | 0.0 (0.0–0.0) | 1.1 (0.2–7.5) | 0.0 (0.0–0.0) | 0.0 (0.0–0.0) ** | 0.9 (−0.9–2.7) | NA | −20.8 (−40.5–−1.0) | −5.2 (−9.7–−0.8) |
| Armenia | DHS 2015 | 1.5 (0.7–3.3) | 1.6 (0.4–6.2) | 2.4 (0.3–14.9) | 2.2 (0.7–7.0) | 2.0 (0.5–8.0) | 0.0 (0.0–0.0) | 1.6 (−0.6–3.7) | NA | −2.1 (−5.4–1.2) | −26.3 (−55.9–3.4) |
| Bosnia and Herzegovina | MICS 2011 | 3.0 (1.8–4.9) | 4.7 (1.7–12.3) | 5.7 (2.5–12.4) | 0.8 (0.1–5.7) | 3.0 (1.1–8.2) | 1.6 (0.4–6.1) | 3.1 (−2.1–8.2) | 2.99 (0.54–16.57) | −4.3 (−10.3–1.6) | −25.5 (−57.7–6.7) |
| Costa Rica | MICS 2018 | 2.3 (1.1–4.7) | 4.1 (2.2–7.6) | 3.2 (0.8–12.1) | 1.2 (0.3–5.3) | 0.1 (0.0–0.6) | 2.0 (0.5–7.4) | 2.1 (−1.6–5.8) | 2.03 (0.47–8.64) | −5.2 (−9.3–−1.1) | −33.6 (−51.1–−16.0) |
| Cuba | MICS 2019 | 2.6 (1.3–5.0) | 4.7 (1.5–14.0) | 4.3 (1.2–14.0) | 1.6 (0.4–6.0) | 1.3 (0.3–4.7) | 0.3 (0.0–2.0) | 4.4 (−0.9–9.8) | 17.28 (1.77–169.02) | −6.4 (−13.8–1.1) | −36.2 (−57.2–−15.1) |
| Dominican Republic | MICS 2014 | 8.9 (7.7–10.2) | 14.1 (11.5–17.1) | 9.6 (7.0–13.0) | 5.5 (3.8–7.9) | 6.9 (4.8–9.8) | 6.3 (4.1–9.7) | 7.7 (3.8–11.7) | 2.22 (1.38–3.60) | −10.0 (−14.6–−5.4) | −20.0 (−27.7–−12.3) |
| Gabon | DHS 2012 | 11.6 (9.0–14.7) | 18.1 (13.9–23.3) | 12.2 (7.5–19.2) | 9.1 (4.8–16.4) | 7.6 (3.1–17.5) | 8.5 (2.3–26.5) | 9.7 (−1.8–21.1) | 2.14 (0.60–7.56) | −12.9 (−24.0–−1.8) | −18.8 (−34.6–−3.0) |
| Guatemala | DHS 2014 | 2.5 (1.8–3.3) | 2.8 (1.7–4.6) | 3.0 (1.7–5.3) | 2.2 (1.2–3.8) | 2.0 (0.7–5.5) | 2.0 (0.8–5.3) | 0.8 (−1.6–3.2) | 1.38 (0.47–4.08) | −1.3 (−3.9–1.3) | −10.4 (−27.0–6.2) |
| Guyana | MICS 2014 | 4.4 (2.7–7.2) | 6.3 (3.6–10.7) | 2.7 (1.0–7.2) | 6.5 (2.0–19.5) | 3.2 (1.1–9.0) | 1.9 (0.5–7.3) | 4.4 (0.2–8.7) | 3.40 (0.76–15.17) | −3.9 (−9.4–1.6) | −10.8 (−31.7–10.1) |
| Iraq | MICS 2018 | 13.3 (11.4–15.5) | 18.4 (15.0–22.4) | 14.0 (10.5–18.4) | 15.4 (11.0–21.2) | 12.5 (8.2–18.5) | 5.0 (2.9–8.4) | 13.4 (8.8–18.0) | 3.70 (2.08–6.56) | −13.2 (−19.0–−7.4) | −18.5 (−25.9–−11.2) |
| Jamaica | MICS 2011 | 4.8 (2.5–9.3) | 5.7 (1.6–17.9) | 0.6 (0.1–4.3) | 10.0 (2.9–28.8) | 6.5 (2.3–16.7) | 0.9 (0.1–6.6) | 4.7 (−2.4–11.8) | 6.08 (0.59–62.25) | −0.8 (−8.3–6.6) | −6.2 (−33.5–21.2) |
| Jordan | DHS 2017 | 7.4 (5.7–9.7) | 9.4 (6.3–13.9) | 7.9 (4.8–12.8) | 4.7 (2.6–8.4) | 7.5 (3.4–15.8) | 7.5 (2.5–20.0) | 2.0 (−6.7–10.6) | 1.26 (0.41–3.86) | −3.8 (−12.2–4.5) | −7.8 (−25.4–9.7) |
| Kazakhstan | MICS 2015 | 4.4 (3.2–6.0) | 3.6 (1.6–7.6) | 2.4 (1.1–5.0) | 2.9 (1.4–5.9) | 6.3 (3.5–10.9) | 8.0 (3.9–15.7) | −4.4 (−10.6–1.8) | 0.45 (0.16–1.27) | 5.8 (−0.3–12.0) | 19.2 (−0.0–38.4) |
| Maldives | DHS 2016 | 9.2 (6.6–12.8) | 9.5 (6.0–14.8) | 7.8 (4.5–13.1) | 10.9 (6.8–17.0) | 1.7 (0.5–5.7) | 16.4 (6.7–34.8) ** | −6.9 (−21.2–7.4) | 0.58 (0.23–1.50) | 2.2 (−10.2–14.5) | 4.3 (−18.2–26.9) |
| Mexico | MICS 2015 | 7.8 (5.6–10.7) | 8.5 (4.2–16.8) | 6.3 (3.8–10.1) | 10.6 (5.9–18.2) | 6.9 (3.5–13.2) | 5.8 (1.7–18.0) | 2.7 (−6.4–11.9) | 1.47 (0.37–5.84) | −1.3 (−10.5–7.9) | −1.6 (−19.9–16.8) |
| Namibia | DHS 2013 | 7.3 (5.5–9.7) | 2.6 (1.2–5.6) | 7.0 (3.5–13.7) | 6.8 (3.6–12.4) | 8.8 (4.2–17.7) | 12.7 (7.4–21.0) | −10.1 (−17.1–−3.1) | 0.21 (0.08–0.53) | 10.2 (2.5–17.9) | 24.0 (9.3–38.8) |
| North Macedonia | MICS 2018 | 4.1 (1.7–9.5) | 0.0 (0.0–0.0) | 12.9 (4.3–32.7) | 3.1 (0.7–12.3) | 5.9 (1.1–25.6) | 0.6 (0.1–4.3) | −0.6 (−1.7–0.6) | 0.00 | −3.5 (−12.2–5.3) | −11.7 (−34.0–10.5) |
| Panama | MICS 2013 | 7.7 (5.5–10.8) | 10.1 (6.3–15.6) | 5.6 (2.4–12.9) | 10.4 (5.2–19.7) | 6.2 (1.9–18.1) | 2.0 (0.6–6.8) | 8.0 (2.9–13.2) | 5.00 (1.34–18.70) | −5.4 (−15.0–4.1) | −7.7 (−27.2–11.9) |
| Paraguay | MICS 2016 | 5.2 (3.9–6.9) | 6.8 (4.2–11.1) | 3.7 (1.6–8.6) | 2.6 (1.1–5.8) | 8.2 (5.1–13.2) | 3.8 (1.6–8.7) | 3.1 (−1.6–7.7) | 1.81 (0.68–4.82) | −0.4 (−5.8–5.0) | −3.4 (−20.6–13.8) |
| Peru | DHS 2019 | 4.7 (3.9–5.7) | 6.3 (4.7–8.3) | 4.0 (2.6–6.0) | 4.9 (3.1–7.6) | 3.3 (2.1–5.4) | 5.0 (2.6–9.2) | 1.3 (−2.3–4.9) | 1.26 (0.63–2.51) | −2.0 (−5.4–1.3) | −6.6 (−18.8–5.6) |
| Serbia | MICS 2019 | 3.5 (1.8–6.7) | 7.6 (2.9–18.6) | 6.5 (1.7–21.9) | 1.5 (0.2–10.6) | 4.5 (1.1–16.9) | 0.5 (0.1–3.9) | 7.1 (−0.1–14.3) | 14.01 (1.59–123.87) | −8.4 (−17.0–0.2) | −41.4 (−68.6–−14.3) |
| South Africa | DHS 2016 | 8.8 (6.4–12.2) | 9.9 (5.4–17.5) | 10.7 (6.1–18.1) | 6.3 (3.0–13.0) | 6.8 (2.8–16.0) | 10.1 (3.3–26.8) | −0.1 (−12.3–12.0) | 0.99 (0.29–3.30) | −3.0 (−14.2–8.2) | −5.6 (−27.7–16.5) |
| Suriname | MICS 2018 | 19.7 (15.5–24.7) | 22.7 (16.3–30.8) | 22.7 (15.7–31.6) | 11.6 (6.2–20.5) | 17.7 (9.0–31.7) | 21.6 (10.8–38.8) | 1.1 (−14.7–16.9) | 1.05 (0.51–2.16) | −6.9 (−22.7–8.9) | −4.8 (−18.4–8.8) |
| Thailand | MICS 2019 | 3.1 (1.8–5.4) | 3.1 (1.8–5.4) | 4.1 (1.1–14.4) | 3.6 (1.0–12.2) | 3.8 (1.9–7.5) | 0.1 (0.1–0.4) | 2.9 (1.2–4.7) | 22.11 (6.88–71.01) | −2.4 (−6.2–1.4) | −11.1 (−25.2–3.0) |
| Tonga | MICS 2019 | 3.6 (1.4–8.8) | 0.0 (0.0–0.0) | 0.0 (0.0–0.0) ** | 7.1 (1.5–27.2) ** | 9.7 (2.2–34.5) ** | 4.2 (1.0–16.2) ** | −4.2 (−10.0–1.7) | 0.00 | 10.8 (0.1–21.4) | 39.8 (16.5–63.1) |
| Turkey | DHS 2013 | 5.6 (3.7–8.3) | 7.2 (3.9–12.8) | 6.5 (2.9–13.9) | 7.5 (2.9–17.8) | 1.7 (0.5–5.2) | 3.3 (0.9–11.5) | 3.9 (−2.1–9.8) | 2.16 (0.53–8.75) | −5.5 (−12.1–1.0) | −20.9 (−41.2–−0.7) |
| National Average | Quintile 1 (Poorest) | Quintile 5 (Richest) | Excess Change | |||||||||
|---|---|---|---|---|---|---|---|---|---|---|---|---|
| Country | Source 1 | Source 2 | Year 1 (95% CI) | Year 2 (95% CI) | Absolute Annual Change (95% CI) | Year 1 (95% CI) | Year 2 (95% CI) | Absolute Annual Change (95% CI) | Year 1 (95% CI) | Year 2 (95% CI) | Absolute Annual Change (95% CI) | Absolute Annual Excess Change (95% CI) |
| Median (All Countries) | 10⋅2 (6.6–13.8) | 7.3 (4.1–10.5) | −0.20 (−0.47–0.07) | 13.1 (7.3–18.8) | 9.4 (4.2–14.6) | −0.16 (−0.53–0.22) | 4.3 (2.2–6.4) | 4.4 (2.8–6.0) | −0.04 (−0.26–0.18) | −0.03 (−0.38–0.31) | ||
| Low-Income Countries | ||||||||||||
| Median (Low-Income Countries) | 15.8 (8.8–22.8) | 9.2 (0.9–17.4) | −0.26 (−1.05–0.54) | 26.1 (16.7–35.5) | 14.9 (3.1–26.7) | −0.44 (−1.40–0.51) | 6.7 (2.6–10.8) | 5.4 (2.2–8.6) | −0.04 (−0.49–0.41) | −0.13 (−0.88–0.62) | ||
| Burkina Faso | DHS 2003 | DHS 2010 | 23.9 (19.9–28.5) | 5.6 (4.5–7.1) | −2.61 (−3.25–−1.97) | 32.9 (25.7–41.1) | 9.3 (6.5–13.3) | −3.37 (−4.58–−2.17) | 11.8 (7.6–17.9) | 2.8 (1.3–5.7) | −1.28 (−2.06–−0.51) | −2.09 (−3.52–−0.65) |
| Burundi | MICS 2005 | DHS 2016 | 11.2 (9.2–13.5) | 0.8 (0.5–1.2) | −0.94 (−1.14–−0.75) | 10.8 (7.4–15.6) | 1.9 (0.9–3.6) | −0.82 (−1.20–−0.43) | 13.3 (8.5–20.3) | 0.7 (0.3–2.0) | −1.14 (−1.68–−0.61) | 0.33 (−0.33–0.98) |
| Central African Republic | MICS 2006 | MICS 2018 | 36.2 (31.8–40.8) | 45.0 (41.7–48.3) | 0.73 (0.27–1.20) | 48.8 (39.6–58.0) | 59.6 (52.9–66.0) | 0.90 (−0.05–1.85) | 17.7 (12.0–25.3) | 17.4 (13.3–22.5) | −0.02 (−0.69–0.65) | 0.92 (−0.24–2.09) |
| Democratic Republic of the Congo | DHS 2007 | MICS 2017 | 29.4 (25.1–34.1) | 34.1 (30.2–38.2) | 0.46 (−0.13–1.06) | 44.6 (36.2–53.3) | 47.4 (41.1–53.8) | 0.28 (−0.79–1.35) | 6.2 (3.7–10.3) | 14.7 (10.3–20.6) | 0.85 (0.24–1.45) | −0.57 (−1.80–0.66) |
| Ethiopia | DHS 2005 | DHS 2019 | 41.8 (37.8–45.9) | 23.7 (19.2–28.9) | −1.29 (−1.74–−0.84) | 52.6 (46.3–58.9) | 41.2 (30.4–52.8) | −0.82 (−1.75–0.11) | 27.8 (20.4–36.8) | 5.2 (2.2–12.0) | −1.62 (−2.28–−0.95) | 0.79 (−0.35–1.94) |
| Gambia | MICS 2005 | MICS 2018 | 3.7 (2.8–5.0) | 3.2 (2.2–4.7) | −0.04 (−0.17–0.09) | 2.4 (1.3–4.6) | 3.7 (1.9–6.9) | 0.10 (−0.12–0.31) | 4.3 (2.2–8.0) | 2.3 (0.6–8.5) | −0.15 (−0.47–0.16) | 0.25 (−0.13–0.63) |
| Guinea | DHS 2005 | DHS 2018 | 22.8 (19.3–26.6) | 37.7 (34.1–41.4) | 1.15 (0.75–1.54) | 32.5 (23.8–42.7) | 55.4 (47.2–63.2) | 1.76 (0.80–2.71) | 12.1 (7.0–20.0) | 19.0 (13.6–26.0) | 0.54 (−0.14–1.22) | 1.22 (0.05–2.39) |
| Guinea-Bissau | MICS 2006 | MICS 2018 | 15.8 (13.2–18.8) | 7.0 (5.2–9.4) | −0.73 (−1.02–−0.44) | 19.0 (13.4–26.1) | 7.4 (4.1–12.9) | −0.96 (−1.59–−0.33) | 6.7 (3.4–12.8) | 7.6 (3.6–15.3) | 0.07 (−0.52–0.67) | −1.04 (−1.90–−0.17) |
| Liberia | DHS 2007 | DHS 2019 | 24.7 (20.4–29.5) | 8.6 (6.3–11.5) | −1.34 (−1.77–−0.91) | 39.3 (30.8–48.5) | 11.4 (8.1–15.9) | −2.32 (−3.12–−1.52) | 11.2 (6.2–19.3) | 0.2 (0.0–1.2) | −0.92 (−1.45–−0.39) | −1.41 (−2.37–−0.44) |
| Madagascar | DHS 2008 | MICS 2018 | 15.8 (13.7–18.2) | 28.5 (25.9–31.2) | 1.27 (0.92–1.62) | 31.1 (26.1–36.6) | 48.0 (43.2–52.8) | 1.69 (0.98–2.40) | 3.7 (1.9–7.1) | 10.9 (7.6–15.3) | 0.71 (0.26–1.16) | 0.98 (0.13–1.82) |
| Malawi | MICS 2006 | DHS 2015 | 3.6 (2.9–4.4) | 2.6 (1.9–3.5) | −0.11 (−0.23–0.02) | 4.1 (2.6–6.5) | 3.5 (2.0–5.9) | −0.07 (−0.37–0.22) | 2.9 (1.7–4.8) | 2.5 (1.2–5.2) | −0.04 (−0.30–0.23) | −0.03 (−0.43–0.36) |
| Mali | MICS 2009 | DHS 2018 | 14.2 (12.7–15.9) | 17.9 (15.1–21.1) | 0.41 (0.04–0.78) | 25.9 (21.9–30.3) | 28.6 (21.7–36.7) | 0.31 (−0.65–1.27) | 5.0 (3.0–8.1) | 7.4 (4.8–11.2) | 0.27 (−0.17–0.71) | 0.04 (−1.02–1.09) |
| Mozambique | DHS 2003 | DHS 2015 | 12.4 (10.1–15.2) | 10.0 (6.8–14.4) | −0.20 (−0.58–0.17) | 26.1 (20.2–32.9) | 19.4 (13.0–27.9) | −0.56 (−1.37–0.26) | 1.0 (0.2–4.9) | 2.7 (1.1–6.4) | 0.14 (−0.09–0.38) | −0.70 (−1.55–0.15) |
| Niger | DHS 2006 | DHS 2012 | 41.6 (37.6–45.7) | 13.8 (11.6–16.5) | −4.63 (−5.42–−3.84) | 54.1 (44.9–63.0) | 22.0 (17.4–27.4) | −5.35 (−7.07–−3.63) | 14.8 (10.8–20.0) | 7.2 (4.9–10.7) | −1.27 (−2.16–−0.37) | −4.08 (−6.02–−2.14) |
| Rwanda | DHS 2005 | DHS 2014 | 3.2 (2.0–5.2) | 0.9 (0.5–1.7) | −0.26 (−0.44–−0.08) | 4.0 (1.6–9.2) | 1.9 (0.8–4.5) | −0.23 (−0.65–0.19) | 1.9 (0.9–4.1) | 1.1 (0.3–3.2) | −0.09 (−0.30–0.12) | −0.13 (−0.60–0.34) |
| Sierra Leone | DHS 2008 | DHS 2019 | 23.2 (19.9–26.8) | 5.4 (4.2–6.9) | −1.62 (−1.96–−1.29) | 25.7 (18.7–34.1) | 6.6 (4.4–9.9) | −1.73 (−2.47–−0.98) | 14.9 (9.7–22.2) | 4.4 (2.0–9.5) | −0.96 (−1.60–−0.31) | −0.77 (−1.76–0.21) |
| Togo | MICS 2006 | MICS 2017 | 15.3 (12.3–18.9) | 9.2 (6.8–12.2) | −0.56 (−0.94–−0.18) | 19.0 (13.0–26.8) | 14.9 (10.4–20.9) | −0.37 (−1.15–0.41) | 4.6 (1.9–10.8) | 8.0 (4.0–15.3) | 0.31 (−0.30–0.92) | −0.68 (−1.68–0.31) |
| Uganda | DHS 2006 | DHS 2016 | 10.2 (8.5–12.2) | 5.1 (4.1–6.3) | −0.51 (−0.72–−0.30) | 9.1 (6.1–13.4) | 4.7 (3.2–6.9) | −0.44 (−0.84–−0.04) | 11.2 (7.5–16.3) | 5.4 (3.2–9.0) | −0.58 (−1.09–−0.07) | 0.14 (−0.51–0.79) |
| Yemen | MICS 2006 | DHS 2013 | 24.6 (20.0–29.9) | 23.4 (21.2–25.8) | −0.17 (−0.95–0.60) | 40.4 (30.8–50.8) | 32.5 (26.9–38.6) | −1.14 (−2.80–0.52) | 3.7 (1.5–8.7) | 9.5 (7.0–12.9) | 0.83 (0.21–1.46) | −1.97 (−3.74–−0.19) |
| Lower–Middle-Income Countries | ||||||||||||
| Median (Lower–Middle-Income Countries) | 9.0 (3.9–14.1) | 8.0 (4.2–11.9) | −0.23 (−0.45–−0.01) | 16.8 (8.8–24.9) | 13.3 (6.6–20.0) | −0.10 (−0.49–0.29) | 4.1 (1.4–6.8) | 3.6 (1.8–5.4) | −0.13 (−0.38–0.12) | 0.05 (−0.39–0.49) | ||
| Benin | DHS 2006 | DHS 2017 | 16.0 (14.3–17.9) | 15.8 (13.8–17.9) | −0.02 (−0.27–0.22) | 30.2 (26.0–34.7) | 32.4 (26.8–38.6) | 0.20 (−0.46–0.87) | 4.4 (2.8–6.9) | 6.9 (4.6–10.2) | 0.23 (−0.08–0.53) | −0.02 (−0.76–0.71) |
| Cambodia | DHS 2005 | DHS 2014 | 9.4 (7.7–11.6) | 6.0 (4.6–7.9) | −0.38 (−0.66–−0.10) | 13.1 (9.4–17.8) | 11.7 (8.3–16.2) | −0.16 (−0.79–0.48) | 9.0 (5.0–15.7) | 0.6 (0.2–1.7) | −0.93 (−1.51–−0.35) | 0.77 (−0.08–1.63) |
| Cameroon | MICS 2006 | DHS 2018 | 11.3 (9.0–14.2) | 16.7 (14.2–19.5) | 0.45 (0.14–0.75) | 19.5 (13.7–27.0) | 29.9 (23.8–36.8) | 0.87 (0.09–1.64) | 3.4 (1.2–9.3) | 4.9 (2.8–8.2) | 0.12 (−0.24–0.49) | 0.74 (−0.11–1.60) |
| Congo | DHS 2005 | MICS 2014 | 14.7 (11.3–18.9) | 14.0 (12.0–16.3) | −0.08 (−0.56–0.40) | 31.9 (22.3–43.3) | 28.5 (23.9–33.4) | −0.38 (−1.66–0.89) | 0.3 (0.0–2.1) | 8.7 (4.7–15.7) | 0.94 (0.35–1.53) | −1.32 (−2.73–0.08) |
| Côte d’Ivoire | MICS 2006 | MICS 2016 | 18.7 (14.9–23.0) | 19.6 (17.3–22.2) | 0.10 (−0.37–0.57) | 35.3 (26.7–45.0) | 29.6 (24.7–34.9) | −0.58 (−1.63–0.48) | 1.9 (0.7–5.3) | 11.3 (6.4–19.0) | 0.94 (0.29–1.58) | −1.51 (−2.75–−0.27) |
| Egypt | DHS 2005 | DHS 2014 | 0.9 (0.3–2.4) | 0.6 (0.3–1.1) | −0.03 (−0.09–0.03) | 1.0 (0.1–8.0) | 1.2 (0.4–4.0) | 0.03 (−0.17–0.22) | 0.6 (0.0–11.4) | 0.3 (0.0–1.7) | −0.04 (−0.15–0.07) | 0.06 (−0.16–0.29) |
| Eswatini | DHS 2006 | MICS 2014 | 4.0 (2.4–6.7) | 3.4 (2.1–5.6) | −0.08 (−0.41–0.25) | 3.6 (1.3–9.2) | 4.7 (1.9–11.3) | 0.14 (−0.54–0.82) | 5.8 (2.0–15.6) | 2.6 (0.7–8.8) | −0.40 (−1.25–0.44) | 0.54 (−0.54–1.62) |
| Ghana | DHS 2008 | MICS 2017 | 2.0 (1.1–3.6) | 4.0 (2.8–5.8) | 0.23 (0.02–0.44) | 1.6 (0.5–5.6) | 5.4 (2.9–9.8) | 0.42 (−0.01–0.84) | 1.3 (0.2–9.3) | 2.2 (0.9–5.5) | 0.09 (−0.28–0.47) | 0.32 (−0.24–0.89) |
| Haiti | DHS 2005 | DHS 2016 | 17.0 (13.9–20.6) | 16.5 (13.3–20.1) | −0.05 (−0.48–0.39) | 18.5 (14.0–24.0) | 25.1 (18.9–32.5) | 0.60 (−0.17–1.36) | 12.2 (6.8–21.0) | 4.4 (1.3–14.1) | −0.71 (−1.51–0.08) | 1.31 (0.21–2.41) |
| Honduras | DHS 2005 | DHS 2011 | 0.8 (0.4–1.5) | 0.9 (0.5–1.5) | 0.02 (−0.10–0.13) | 0.4 (0.1–1.5) | 0.8 (0.2–2.6) | 0.07 (−0.11–0.25) | 2.2 (0.7–6.8) | 0.0 (0.0–0.0) | −0.36 (−0.78–0.06) | 0.43 (−0.03–0.89) |
| India | DHS 2005 | DHS 2015 | 24.0 (22.6–25.5) | 10.5 (10.1–10.9) | −1.35 (−1.51–−1.20) | 40.0 (36.7–43.3) | 15.8 (15.0–16.7) | −2.42 (−2.76–−2.07) | 6.5 (5.1–8.2) | 7.1 (5.8–8.5) | 0.06 (−0.15–0.27) | −2.47 (−2.87–−2.07) |
| Indonesia | DHS 2007 | DHS 2017 | 15.6 (13.9–17.5) | 11.1 (9.8–12.7) | −0.45 (−0.68–−0.21) | 32.9 (28.7–37.4) | 16.2 (13.3–19.7) | −1.67 (−2.21–−1.13) | 6.6 (4.4–9.7) | 7.6 (5.4–10.6) | 0.10 (−0.26–0.46) | −1.77 (−2.42–−1.12) |
| Kenya | DHS 2003 | DHS 2014 | 10.8 (8.4–13.7) | 2.5 (1.9–3.3) | −0.75 (−1.00–−0.51) | 25.7 (18.6–34.3) | 5.2 (3.8–6.9) | −1.86 (−2.59–−1.14) | 5.1 (2.6–9.8) | 2.2 (0.8–5.9) | −0.27 (−0.63–0.10) | −1.60 (−2.41–−0.78) |
| Lao People’s Democratic Republic | MICS 2006 | MICS 2017 | 36.1 (30.6–41.9) | 27.1 (24.7–29.7) | −0.81 (−1.37–−0.25) | 42.9 (33.8–52.6) | 43.3 (38.0–48.7) | 0.03 (−0.96–1.02) | 25.7 (15.2–40.0) | 14.6 (10.8–19.5) | −1.01 (−2.20–0.19) | 1.04 (−0.52–2.59) |
| Lesotho | DHS 2009 | MICS 2018 | 4.3 (3.0–6.1) | 8.5 (6.3–11.2) | 0.46 (0.15–0.78) | 9.0 (5.7–13.9) | 17.0 (11.0–25.3) | 0.89 (−0.01–1.79) | 2.4 (0.6–9.2) | 8.5 (3.8–18.2) | 0.68 (−0.16–1.51) | 0.21 (−1.02–1.44) |
| Mauritania | MICS 2007 | MICS 2015 | 19.3 (16.8–22.1) | 14.2 (12.1–16.6) | −0.64 (−1.08–−0.21) | 29.3 (23.7–35.6) | 25.0 (19.0–32.2) | −0.53 (−1.64–0.59) | 13.7 (9.5–19.5) | 4.1 (1.8–8.9) | −1.20 (−1.94–−0.46) | 0.68 (−0.66–2.01) |
| Mongolia | MICS 2005 | MICS 2018 | 2.9 (1.7–4.9) | 3.0 (1.9–4.5) | 0.00 (−0.15–0.16) | 4.5 (2.0–10.1) | 3.6 (1.8–6.9) | −0.07 (−0.41–0.27) | 3.0 (0.7–12.2) | 1.6 (0.4–6.3) | −0.11 (−0.49–0.27) | 0.04 (−0.47–0.55) |
| Nepal | DHS 2006 | MICS 2019 | 7.3 (5.1–10.5) | 10.5 (8.5–13.0) | 0.25 (−0.02–0.51) | 16.6 (10.5–25.1) | 13.8 (10.1–18.7) | −0.21 (−0.85–0.43) | 3.0 (0.7–12.4) | 6.6 (3.6–12.0) | 0.28 (−0.17–0.74) | −0.49 (−1.28–0.29) |
| Nigeria | DHS 2008 | DHS 2018 | 48.0 (45.7–50.2) | 34.7 (32.7–36.7) | −1.33 (−1.63–−1.03) | 77.4 (74.0–80.4) | 59.8 (56.0–63.4) | −1.76 (−2.25–−1.27) | 12.5 (10.1–15.5) | 6.6 (4.9–8.8) | −0.60 (−0.93–−0.27) | −1.17 (−1.75–−0.58) |
| Pakistan | DHS 2006 | DHS 2017 | 25.2 (22.7–27.9) | 13.7 (11.2–16.5) | −1.05 (−1.39–−0.71) | 47.4 (40.8–54.2) | 30.8 (23.7–38.9) | −1.51 (−2.44–−0.59) | 11.4 (7.6–16.8) | 3.1 (1.6–6.0) | −0.75 (−1.21–−0.30) | −0.76 (−1.79–0.27) |
| Philippines | DHS 2008 | DHS 2017 | 7.5 (6.1–9.3) | 13.4 (11.5–15.5) | 0.65 (0.37–0.94) | 17.1 (13.0–22.1) | 23.6 (19.8–28.0) | 0.73 (0.05–1.40) | 1.5 (0.3–6.7) | 5.6 (2.6–11.5) | 0.46 (−0.07–0.98) | 0.27 (−0.59–1.13) |
| Republic of Moldova | DHS 2005 | MICS 2012 | 1.7 (0.7–4.1) | 0.0 (0.0–0.0) | −0.25 (−0.46–−0.03) | 0.0 (0.0–0.0) * | 0.0 (0.0–0.0) * | 0.00 (0.00–0.00) | 2.6 (0.6–10.2) | 0.0 (0.0–0.0) | −0.37 (−0.88–0.14) | 0.37 (−0.14–0.88) |
| Sao Tome and Principe | DHS 2008 | MICS 2019 | 6.4 (4.0–10.0) | 2.3 (1.1–4.7) | −0.37 (−0.67–−0.07) | 6.0 (2.6–13.4) | 6.5 (2.7–14.8) | 0.05 (−0.62–0.72) | 8.1 (3.0–20.2) | 0.0 (0.0–0.0) | −0.74 (−1.44–−0.04) | 0.79 (−0.18–1.76) |
| Senegal | DHS 2005 | DHS 2019 | 6.8 (5.4–8.6) | 3.8 (2.6–5.6) | −0.21 (−0.37–−0.06) | 8.2 (5.5–11.9) | 8.9 (5.3–14.6) | 0.05 (−0.34–0.45) | 2.5 (0.9–6.5) | 0.5 (0.1–2.4) | −0.14 (−0.32–0.04) | 0.19 (−0.24–0.63) |
| Tajikistan | MICS 2005 | DHS 2017 | 7.0 (4.9–9.9) | 7.6 (6.1–9.4) | 0.05 (−0.20–0.30) | 9.6 (4.9–17.9) | 8.1 (5.1–12.6) | −0.12 (−0.72–0.48) | 5.3 (2.6–10.5) | 10.5 (7.3–14.8) | 0.43 (−0.00–0.87) | −0.55 (−1.30–0.19) |
| Timor-Leste | DHS 2009 | DHS 2016 | 24.9 (22.2–27.9) | 21.6 (18.8–24.7) | −0.47 (−1.05–0.11) | 35.6 (30.2–41.4) | 36.0 (29.2–43.4) | 0.05 (−1.24–1.35) | 16.7 (12.2–22.5) | 9.8 (5.8–15.9) | −0.99 (−2.00–0.02) | 1.05 (−0.60–2.69) |
| United Republic of Tanzania | DHS 2004 | DHS 2015 | 6.7 (4.9–9.0) | 3.0 (2.2–4.2) | −0.33 (−0.53–−0.12) | 12.4 (8.2–18.3) | 6.6 (4.4–9.7) | −0.53 (−1.04–−0.02) | 2.4 (0.6–8.7) | 1.2 (0.4–3.8) | −0.11 (−0.42–0.20) | −0.42 (−1.01–0.18) |
| Viet Nam | DHS 2002 | MICS 2013 | 11.7 (8.3–16.3) | 3.8 (2.6–5.5) | −0.72 (−1.10–−0.34) | 28.1 (19.4–38.9) | 12.7 (8.2–19.3) | −1.40 (−2.41–−0.39) | 0.0 (0.0–0.0) | 0.7 (0.1–5.0) | 0.06 (−0.06–0.19) | −1.46 (−2.48–−0.44) |
| Zambia | DHS 2007 | DHS 2018 | 7.7 (5.9–10.0) | 2.1 (1.4–3.1) | −0.51 (−0.71–−0.31) | 7.2 (4.5–11.5) | 3.1 (1.8–5.5) | −0.37 (−0.72–−0.02) | 3.7 (1.6–8.4) | 1.0 (0.2–4.1) | −0.25 (−0.56–0.06) | −0.12 (−0.58–0.34) |
| Zimbabwe | MICS 2009 | MICS 2019 | 8.6 (7.0–10.6) | 5.5 (3.9–7.6) | −0.31 (−0.57–−0.05) | 12.3 (8.7–17.3) | 8.0 (4.3–14.4) | −0.43 (−1.08–0.21) | 5.6 (2.8–10.8) | 1.7 (0.6–4.6) | −0.38 (−0.80–0.03) | −0.05 (−0.81–0.72) |
| Upper–Middle-Income Countries | ||||||||||||
| Median (Upper–Middle-Income Countries) | 5.2 (0.6–9.7) | 4.6 (1.6–7.6) | 0.02 (−0.38–0.42) | 8.5 (0.3–16.6) | 6.3 (2.3–10.2) | −0.05 (−0.78–0.68) | 2.3 (−2.1–6.6) | 4.2 (0.1–8.3) | 0.06 (−0.48–0.61) | −0.14 (−0.80–0.52) | ||
| Albania | DHS 2008 | DHS 2017 | 0.5 (0.1–3.4) | 0.5 (0.1–1.8) | 0.00 (−0.12–0.12) | 0.0 (0.0–0.0) | 0.9 (0.1–6.2) | 0.10 (−0.10–0.30) | 0.0 (0.0–0.0) * | 0.0 (0.0–0.0) * | 0.00 (0.00–0.00) | 0.10 (−0.10–0.30) |
| Armenia | DHS 2005 | DHS 2015 | 5.5 (2.9–10.0) | 1.5 (0.7–3.3) | −0.39 (−0.74–−0.04) | 6.5 (2.1–18.4) | 1.6 (0.4–6.2) | −0.49 (−1.23–0.24) | 0.7 (0.1–5.1) * | 0.0 (0.0–0.0) | −0.07 (−0.21–0.07) | −0.42 (−1.17–0.32) |
| Bosnia and Herzegovina | MICS 2006 | MICS 2011 | 6.0 (4.2–8.3) | 3.0 (1.8–4.9) | −0.59 (−1.09–−0.09) | 12.5 (7.6–19.8) | 4.7 (1.7–12.3) | −1.57 (−3.09–−0.05) | 4.3 (1.9–9.6) | 1.6 (0.4–6.1) | −0.55 (−1.37–0.28) | −1.02 (−2.75–0.71) |
| Dominican Republic | DHS 2002 | MICS 2014 | 5.0 (4.0–6.2) | 8.9 (7.7–10.2) | 0.32 (0.18–0.46) | 9.4 (7.2–12.2) | 14.1 (11.5–17.1) | 0.39 (0.07–0.70) | 4.8 (2.3–9.6) | 6.3 (4.1–9.7) | 0.13 (−0.24–0.49) | 0.26 (−0.22–0.74) |
| Gabon | DHS 2000 | DHS 2012 | 30.6 (27.0–34.5) | 11.6 (9.0–14.7) | −1.59 (−1.98–−1.20) | 50.8 (45.2–56.4) | 18.1 (13.9–23.3) | −2.72 (−3.33–−2.12) | 21.2 (13.7–31.3) | 8.5 (2.3–26.5) | −1.06 (−2.19–0.08) | −1.67 (−2.95–−0.38) |
| Guyana | MICS 2006 | MICS 2014 | 6.3 (4.0–10.0) | 4.4 (2.7–7.2) | −0.23 (−0.69–0.22) | 8.2 (4.1–15.7) | 6.3 (3.6–10.7) | −0.24 (−1.05–0.57) | 2.1 (0.3–13.7) | 1.9 (0.5–7.3) | −0.03 (−0.63–0.57) | −0.21 (−1.22–0.80) |
| Jordan | DHS 2007 | DHS 2017 | 1.1 (0.6–2.3) | 7.4 (5.7–9.7) | 0.63 (0.41–0.84) | 1.3 (0.4–3.7) | 9.4 (6.3–13.9) | 0.82 (0.42–1.21) | 2.0 (0.3–12.4) | 7.5 (2.5–20.0) | 0.55 (−0.32–1.41) | 0.27 (−0.68–1.22) |
| Kazakhstan | MICS 2006 | MICS 2015 | 0.9 (0.4–2.0) | 4.4 (3.2–6.0) | 0.38 (0.21–0.56) | 0.9 (0.2–3.6) | 3.6 (1.6–7.6) | 0.29 (−0.04–0.63) | 1.0 (0.1–6.9) | 8.0 (3.9–15.7) | 0.77 (0.12–1.43) | −0.48 (−1.22–0.26) |
| Maldives | DHS 2009 | DHS 2016 | 1.2 (0.6–2.4) | 9.2 (6.6–12.8) | 1.15 (0.70–1.60) | 1.0 (0.2–4.3) | 9.5 (6.0–14.8) | 1.21 (0.56–1.87) | 1.3 (0.2–8.2) | 16.4 (6.7–34.8) * | 2.16 (0.18–4.14) | −0.95 (−3.03–1.13) |
| Namibia | DHS 2006 | DHS 2013 | 5.3 (3.8–7.4) | 7.3 (5.5–9.7) | 0.29 (−0.11–0.68) | 10.2 (5.8–17.2) | 2.6 (1.2–5.6) | −1.08 (−1.92–−0.25) | 1.8 (0.6–4.8) | 12.7 (7.4–21.0) | 1.56 (0.57–2.55) | −2.65 (−3.94–−1.35) |
| North Macedonia | MICS 2005 | MICS 2018 | 10.6 (6.9–16.0) | 4.1 (1.7–9.5) | −0.50 (−0.94–−0.07) | 12.6 (8.9–17.5) | 0.0 (0.0–0.0) | −0.97 (−1.30–−0.64) | 18.2 (10.0–30.9) | 0.6 (0.1–4.3) | −1.35 (−2.15–−0.55) | 0.38 (−0.48–1.25) |
| Peru | DHS 2009 | DHS 2019 | 4.3 (3.2–5.6) | 4.7 (3.9–5.7) | 0.05 (−0.10–0.20) | 4.3 (2.8–6.6) | 6.3 (4.7–8.3) | 0.19 (−0.07–0.45) | 2.4 (0.5–10.5) | 5.0 (2.6–9.2) | 0.26 (−0.23–0.74) | −0.06 (−0.61–0.48) |
| Serbia | MICS 2005 | MICS 2019 | 4.3 (2.9–6.5) | 3.5 (1.8–6.7) | −0.06 (−0.26–0.15) | 8.7 (4.7–15.6) | 7.6 (2.9–18.6) | −0.08 (−0.71–0.56) | 3.4 (1.1–9.9) | 0.5 (0.1–3.9) | −0.20 (−0.48–0.07) | 0.13 (−0.56–0.82) |
| Suriname | MICS 2006 | MICS 2018 | 10.1 (7.3–13.9) | 19.7 (15.5–24.7) | 0.80 (0.33–1.27) | 9.0 (4.9–15.9) | 22.7 (16.3–30.8) | 1.14 (0.39–1.89) | 12.4 (6.4–22.4) | 21.6 (10.8–38.8) | 0.77 (−0.56–2.11) | 0.37 (−1.16–1.89) |
| Thailand | MICS 2005 | MICS 2019 | 2.5 (1.7–3.8) | 3.1 (1.8–5.4) | 0.04 (−0.10–0.18) | 3.4 (1.9–6.2) | 3.1 (1.8–5.4) | −0.03 (−0.22–0.17) | 2.4 (0.6–9.4) | 0.1 (0.1–0.4) | −0.16 (−0.41–0.08) | 0.14 (−0.17–0.45) |
| Turkey | DHS 2003 | DHS 2013 | 11.5 (9.0–14.7) | 5.6 (3.7–8.3) | −0.59 (−0.96–−0.23) | 31.0 (23.6–39.6) | 7.2 (3.9–12.8) | −2.38 (−3.28–−1.48) | 1.1 (0.2–5.2) | 3.3 (0.9–11.5) | 0.22 (−0.23–0.68) | −2.60 (−3.61–−1.59) |
Publisher’s Note: MDPI stays neutral with regard to jurisdictional claims in published maps and institutional affiliations. |
© World Health Organization 2022. Licensee MDPI. This article is dis-tributed under the terms of the Creative Commons Attribution IGO License (http://creativecommons.org/licenses/by/3.0/igo/), which permits unrestricted use, distribution, and reproduction in any medium, provided the original work is properly cited. In any reproduction of this article there should not be any suggestion that WHO or this article endorse any specific organisation or products. The use of the WHO logo is not permitted. This notice should be preserved along with the article's original URL.
Share and Cite
Bergen, N.; Cata-Preta, B.O.; Schlotheuber, A.; Santos, T.M.; Danovaro-Holliday, M.C.; Mengistu, T.; Sodha, S.V.; Hogan, D.R.; Barros, A.J.D.; Hosseinpoor, A.R. Economic-Related Inequalities in Zero-Dose Children: A Study of Non-Receipt of Diphtheria–Tetanus–Pertussis Immunization Using Household Health Survey Data from 89 Low- and Middle-Income Countries. Vaccines 2022, 10, 633. https://doi.org/10.3390/vaccines10040633
Bergen N, Cata-Preta BO, Schlotheuber A, Santos TM, Danovaro-Holliday MC, Mengistu T, Sodha SV, Hogan DR, Barros AJD, Hosseinpoor AR. Economic-Related Inequalities in Zero-Dose Children: A Study of Non-Receipt of Diphtheria–Tetanus–Pertussis Immunization Using Household Health Survey Data from 89 Low- and Middle-Income Countries. Vaccines. 2022; 10(4):633. https://doi.org/10.3390/vaccines10040633
Chicago/Turabian StyleBergen, Nicole, Bianca O. Cata-Preta, Anne Schlotheuber, Thiago M. Santos, M. Carolina Danovaro-Holliday, Tewodaj Mengistu, Samir V. Sodha, Daniel R. Hogan, Aluisio J. D. Barros, and Ahmad Reza Hosseinpoor. 2022. "Economic-Related Inequalities in Zero-Dose Children: A Study of Non-Receipt of Diphtheria–Tetanus–Pertussis Immunization Using Household Health Survey Data from 89 Low- and Middle-Income Countries" Vaccines 10, no. 4: 633. https://doi.org/10.3390/vaccines10040633
APA StyleBergen, N., Cata-Preta, B. O., Schlotheuber, A., Santos, T. M., Danovaro-Holliday, M. C., Mengistu, T., Sodha, S. V., Hogan, D. R., Barros, A. J. D., & Hosseinpoor, A. R. (2022). Economic-Related Inequalities in Zero-Dose Children: A Study of Non-Receipt of Diphtheria–Tetanus–Pertussis Immunization Using Household Health Survey Data from 89 Low- and Middle-Income Countries. Vaccines, 10(4), 633. https://doi.org/10.3390/vaccines10040633