
Endothelial Monocyte-Activating Polypeptide-II Is an Indicator of Severity and Mortality in COVID-19 Patients

 and
and
Abstract
1. Introduction
2. Subjects and Methods
2.1. Study Population
2.2. Patients
2.3. Laboratory Assay
2.4. RNA Extraction and qRT-PCR
2.5. Statistical Analysis
3. Results
3.1. Demographic and Clinical Results
3.2. Laboratory Characteristics
3.3. Detectable EMAP-II RNA in Severe COVID-19 Patients
3.4. Association between EMAP-II and Clinical and Laboratory Parameters
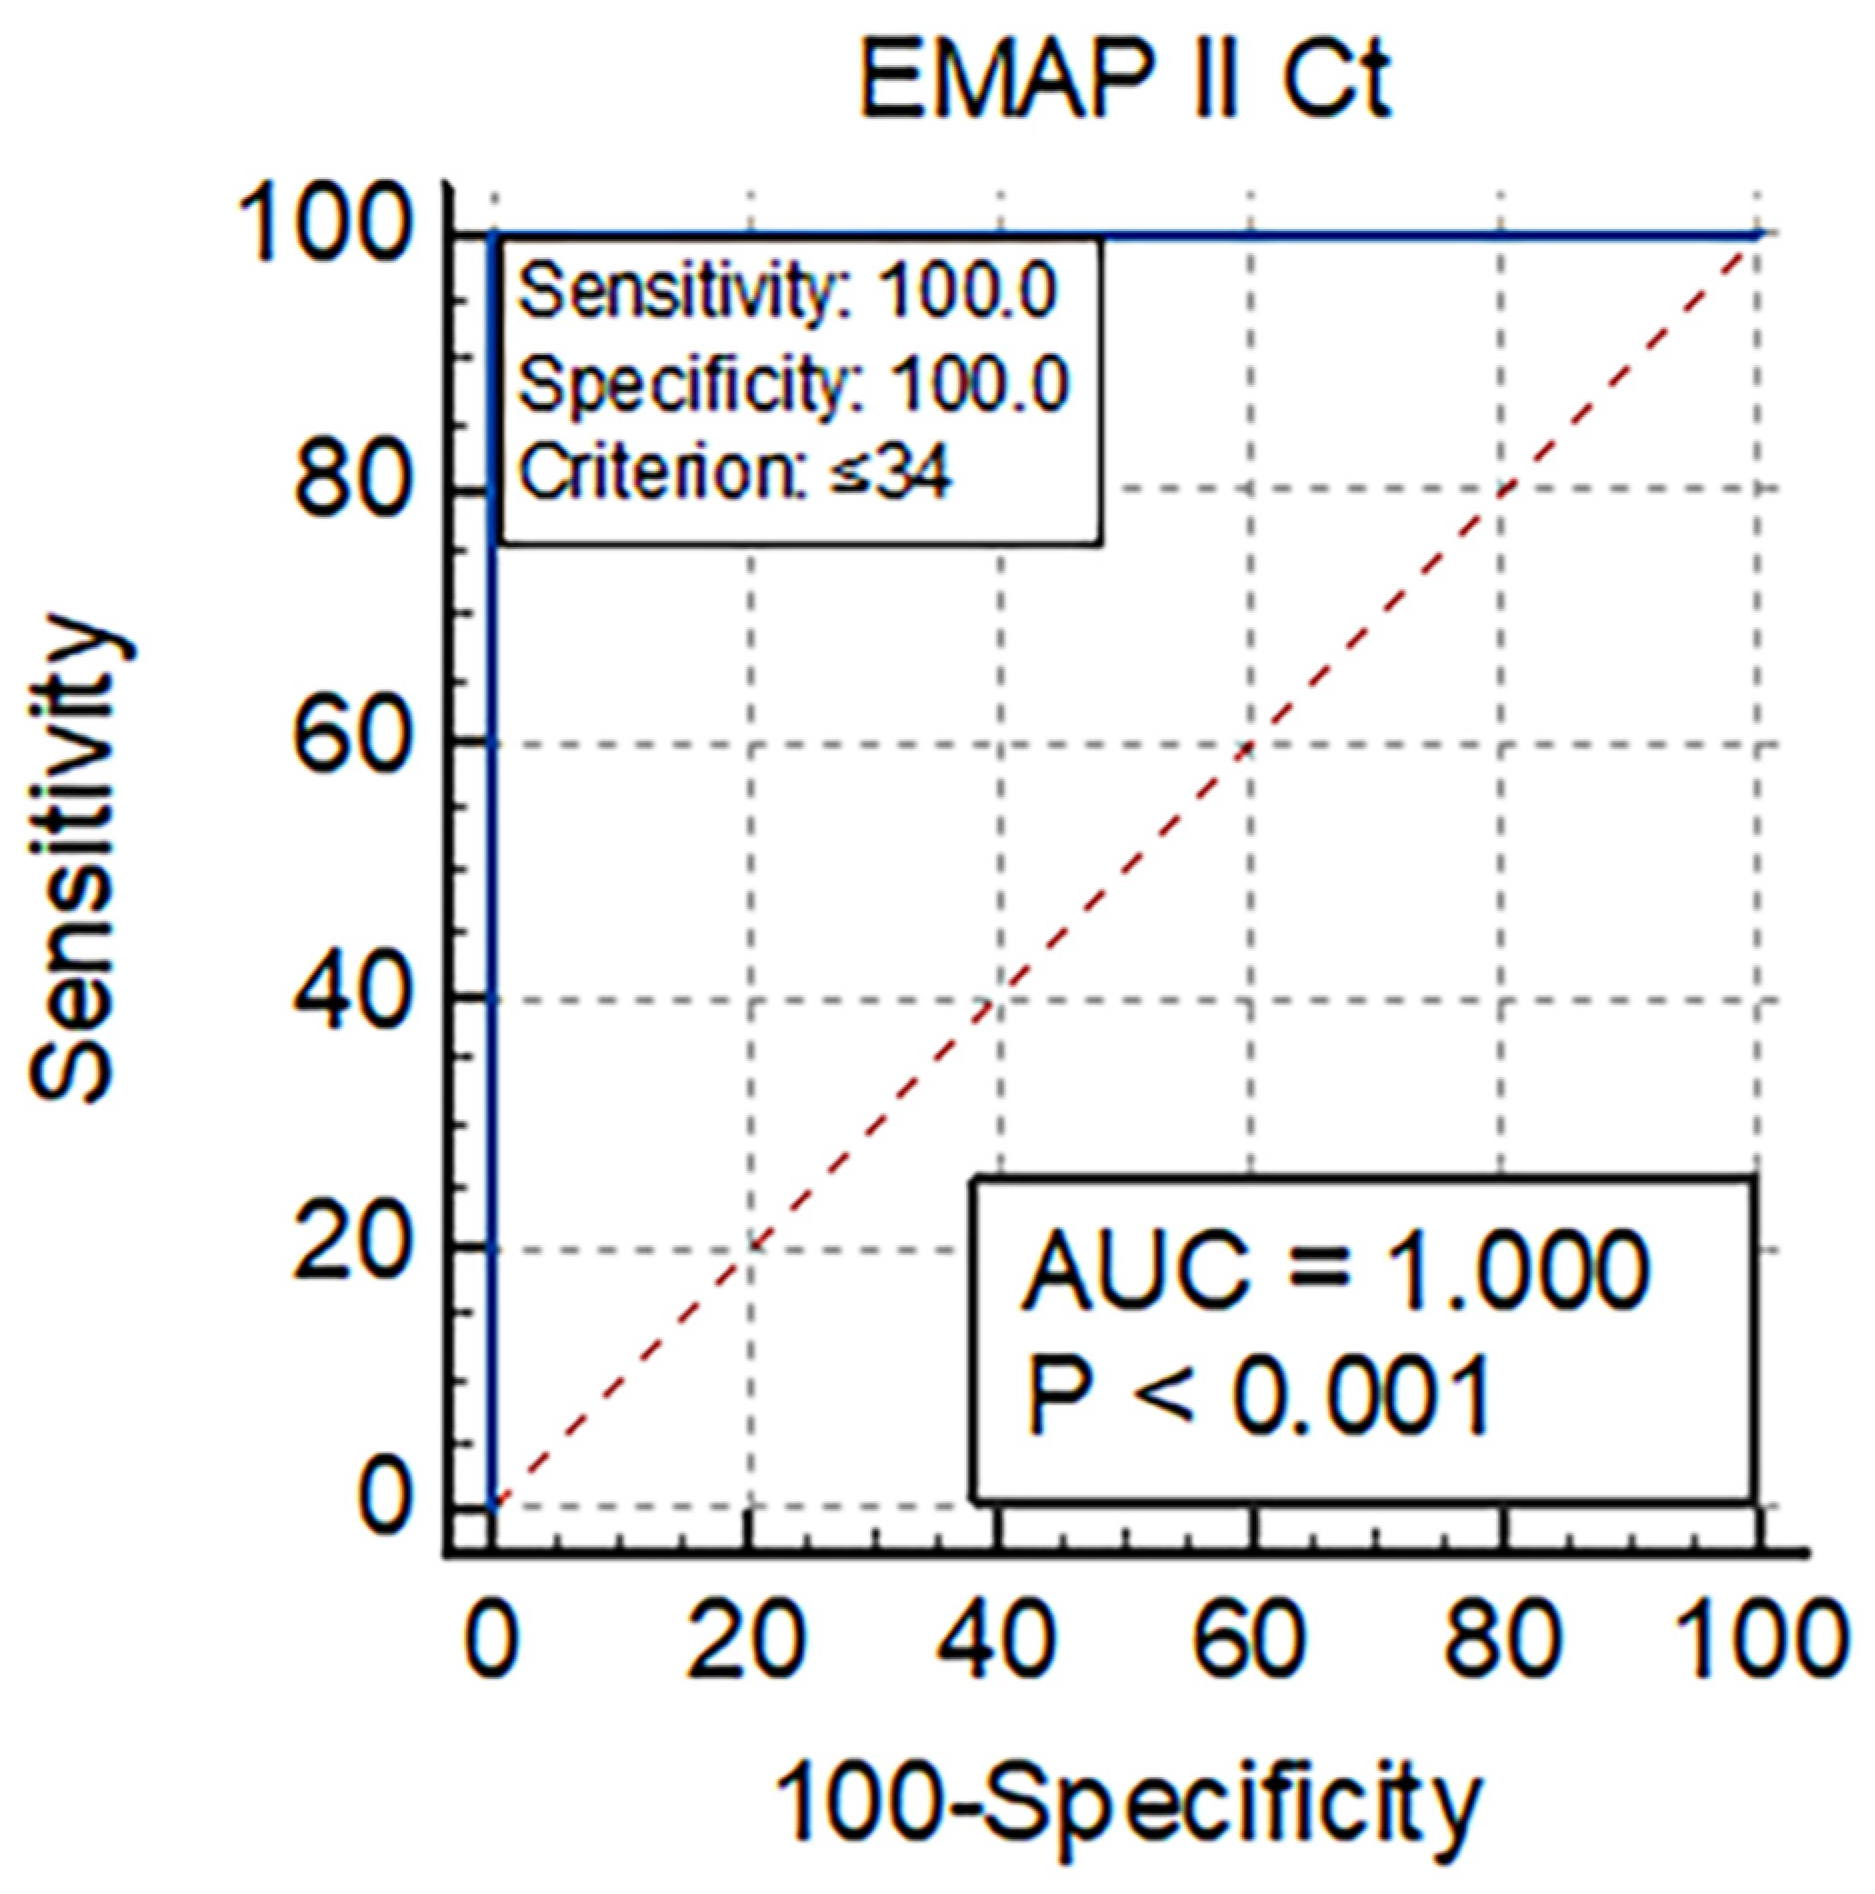
3.5. Diagnostic Utility of EMAP-II for Mortality in COVID-19 Patients
4. Discussion
5. Study Limitations
6. Conclusions
Supplementary Materials
Author Contributions
Funding
Institutional Review Board Statement
Informed Consent Statement
Data Availability Statement
Conflicts of Interest
References
- Salian, V.S.; Wright, J.A.; Vedell, P.T.; Nair, S.; Li, C.; Kandimalla, M.; Tang, X.; Carmona Porquera, E.M.; Kalari, K.R.; Kandimalla, K.K. COVID-19 transmission, current treatment, and future therapeutic strategies. Mol. Pharm. 2021, 18, 754–771. [Google Scholar] [CrossRef] [PubMed]
- Kumar, A.; Singh, R.; Kaur, J.; Pandey, S.; Sharma, V.; Thakur, L.; Sati, S.; Mani, S.; Asthana, S.; Sharma, T.K.; et al. Wuhan to world: The COVID-19 pandemic. Front. Cell. Infect. Microbiol. 2021, 11, 596201. [Google Scholar] [CrossRef] [PubMed]
- Huang, C.; Wang, Y.; Li, X.; Ren, L.; Zhao, J.; Hu, Y.; Zhang, L.; Fan, G.; Xu, G.; Gu, X.; et al. Clinical features of patients infected with 2019 novel coronavirus in Wuhan, China. Lancet 2020, 395, 497–506. [Google Scholar] [CrossRef] [PubMed]
- World Health Organization. Clinical Management of Severe Acute Respiratory Infection (SARI) when COVID-19 Disease Is Suspected: Interim Guidance; WHO: Geneva, Switzerland, 2020. [Google Scholar]
- Ramos-Casals, M.; Brito-Zerón, P.; Mariette, X. Systemic and organ-specific immune-related manifestations of COVID-19. Nat. Rev. Rheumatol. 2021, 17, 315–332. [Google Scholar] [CrossRef]
- Osuchowski, M.F.; Winkler, M.S.; Skirecki, T.; Cajander, S.; Shankar-Hari, M.; Lachmann, G.; Monneret, G.; Venet, F.; Bauer, M.; Brunkhorst, F.M.; et al. The COVID-19-puzzle: Deciphering pathophysiology and phenotypes of a new disease entity. Lancet Respir. Med. 2021, 9, 622–642. [Google Scholar] [CrossRef]
- Bartleson, J.M.; Radenkovic, D.; Covarrubias, A.J.; Furman, D.; Winer, D.A.; Verdin, E. SARS-CoV-2, COVID-19, and the aging immune system. Nat. Aging 2021, 1, 769–782. [Google Scholar] [CrossRef]
- Chen, N.; Zhou, M.; Dong, X.; Qu, J.; Gong, F.; Han, Y.; Qiu, Y.; Wang, J.; Liu, Y.; Wei, Y.; et al. Epidemiological and clinical characteristics of 99 cases of 2019 novel coronavirus pneumonia in Wuhan, China: A descriptive study. Lancet 2020, 395, 507–513. [Google Scholar] [CrossRef]
- Kelleni, M.T. SARS-CoV-2 viral load might not be the right predictor of COVID-19 mortality. J. Infect. 2020, 82, e35. [Google Scholar] [CrossRef]
- Hagman, K.; Hedenstierna, M.; Gille-Johnson, P.; Hammas, B.; Grabbe, M.; Dillner, J.; Ursing, J. SARS-CoV-2 RNA in serum as a predictor of severe outcome in COVID-19: A retrospective cohort study. Clin. Infect. Dis. 2020, 73, e2995–e3001. [Google Scholar] [CrossRef]
- Pujadas, E.; Chaudhry, F.; McBride, R.; Richter, F.; Zhao, S.; Wajnberg, A.; Nadkarni, G.; Glicksberg, B.S.; Houldsworth, J.; Cordon-Cardo, C. SARS-CoV-2 viral load predicts COVID-19 mortality. Lancet Respir. Med. 2020, 8, e70. [Google Scholar] [CrossRef]
- Tan, C.; Li, S.; Liang, Y.; Chen, M.; Liu, J. SARS-CoV-2 viremia may predict rapid deterioration of COVID-19 patients. Braz. J. Infect. Dis. 2020, 24, 565–569. [Google Scholar] [CrossRef] [PubMed]
- Clauss, M.; Voswinckel, R.; Rajashekhar, G.; Sigua, N.L.; Fehrenbach, H.; Rush, N.I.; Schweitzer, K.S.; Yildirim, A.Ö.; Kamocki, K.; Fisher, A.J.; et al. Lung endothelial monocyte-activating protein 2 is a mediator of cigarette smoke-induced emphysema in mice. J. Clin. Investig. 2011, 121, 2470–2479. [Google Scholar] [CrossRef] [PubMed]
- Quintos-Alagheband, M.L.; White, C.W.; Schwarz, M.A. Potential role for antiangiogenic proteins in the evolution of bronchopulmonary dysplasia. Antioxid. Redox Signal. 2004, 6, 137–145. [Google Scholar] [CrossRef]
- Lu, H.; Chelvanambi, S.; Poirier, C.; Saliba, J.; March, K.L.; Clauss, M.; Bogatcheva, N.M. EMAP II Monoclonal Antibody Ameliorates Influenza A Virus-Induced Lung Injury. Mol. Ther. 2015, 26, 2060–2069. [Google Scholar] [CrossRef] [PubMed]
- Kao, J.; Ryan, J.; Brett, G.; Chen, J.; Shen, H.; Fan, Y.-G.; Godman, G.; Famillettill, P.C.; Wangll, F.; PanlI, Y.-C.E.; et al. Endothelial monocyte-activating polypeptide II. A novel tumor-derived polypeptide that activates host-response mechanisms. J. Biol. Chem. 1992, 267, 20239–20247. [Google Scholar] [CrossRef]
- Berger, A.C.; Tang, G.; Alexander, H.R.; Libutti, S.K. Endothelial monocyte-activating polypeptide II, a tumor-derived cytokine that plays an important role in inflammation, apoptosis, and angiogenesis. J. Immunother. 2000, 23, 519–527. [Google Scholar] [CrossRef]
- Murray, J.C.; Tas, M.P.R. Endothelial monocyte-activating polypeptide 2: A novel injury signal? In The New Angiotherapy; Fan, T.P., Kohn, E.C., Eds.; Humana: Clifton, NJ, USA, 2001; pp. 491–498. [Google Scholar]
- Kao, J.; Houck, K.; Fan, Y.; Haehnel, I.; Libutti, S.K.; Kaytonn, M.L.; Grikscheit, T.; Chabot, J.; Nowygrod, N.; Greenberg, S.; et al. Characterization of a novel tumor-derived cytokine. Endothelial-monocyte activating polypeptide II. J. Biol. Chem. 1994, 269, 25106–25119. [Google Scholar] [CrossRef]
- Kim, E.; Kim, S.H.; Kim, S.; Kim, T.S. The novel cytokine p43 induces IL-12 production in macrophages via NF-κB activation, leading to enhanced IFN-γ production in CD4+T cells. J. Immunol. 2006, 176, 256–264. [Google Scholar] [CrossRef]
- Kim, E.; Kim, S.H.; Kim, S.; Cho, D.; Kim, T.S. AIMP1/p 43 protein induces the maturation of bone marrow-derived dendritic cells with T helper type 1-polarizing ability. J. Immunol. 2008, 180, 2894–2902. [Google Scholar] [CrossRef]
- Schwarz, M.A.; Kandel, J.; Brett, J.; Li, J.; Hayward, J.; Schwarz, R.E.; Chappey, O.; Wautier, J.L.; Chabot, J.; Gerfo, P.L.O.; et al. Endothelial monocyte activating polypeptide II, a novel antitumor cytokine that suppresses primary and metastatic tumor growth and induces apoptosis in growing endothelial cells. J. Exp. Med. 1999, 190, 341–354. [Google Scholar] [CrossRef]
- Berger, A.C.; Alexander, H.R.; Tang, G.; Wu, P.S.; Hewitt, S.M.; Turner, E.; Kruger, E.; Figg, W.D.; Grove, A.; Kohn, E.; et al. Endothelial monocyte activating polypeptide II induces endothelial cell apoptosis and may inhibit tumor angiogenesis. Microvasc. Res. 2000, 60, 70–80. [Google Scholar] [CrossRef] [PubMed]
- Tas, M.P.R.; Houghton, J.; Jakobsen, A.M.; Tolmachova, T.; Carmichael, J.; Murray, J.C. Cloning and expression of human endothelial-monocyte-activating polypeptide 2 (emap-2) and identification of its putative precursor. Cytokine 1997, 9, 535–539. [Google Scholar] [CrossRef] [PubMed]
- Behrensdorf, H.A.; van de Craen, M.; Knies, U.E.; Vandenabeele, P.; Clauss, M. The endothelial monocyte-activating polypeptide II (EMAP II) is a substrate for caspase-7. FEBS Lett. 2000, 466, 143–147. [Google Scholar] [CrossRef] [PubMed]
- Zhang, F.R.; Schwarz, M.A. Pro-EMAP II is not primarily cleaved by caspase-3 and -7. Am. J. Physiol. Lung Cell. Mol. Physiol. 2002, 282, L1239–L1244. [Google Scholar] [CrossRef] [PubMed][Green Version]
- Liu, J.; Schwarz, M.A. Identification of protease-sensitive sites in human endothelial-monocyte activating polypeptide II protein. Exp. Cell. Res. 2006, 312, 2231–2237. [Google Scholar] [CrossRef]
- Shalak, V.; Kaminska, M.; Mitnacht-Kraus, R.; Vandenabeele, P.; Clauss, M.; Mirande, M. The EMAPII cytokine is released from the mammalian multisynthetase complex after cleavage of its p43/proEMAPII component. J. Biol. Chem. 2001, 276, 23769–23776. [Google Scholar] [CrossRef]
- Murray, J.C.; Barnett, G.; Tas, M.; Jakobsen, A.; Brown, J.; Powe, D.; Clelland, C. Immunohistochemical Analysis of Endothelial-Monocyte-Activating Polypeptide-II Expression in Vivo. Am. J. Pathol. 2000, 157, 2045–2053. [Google Scholar] [CrossRef][Green Version]
- Wakasugi, K.; Schimmel, P. Two distinct cytokines released from a human aminoacyl-tRNA synthetase. Science 1999, 284, 147–151. [Google Scholar] [CrossRef]
- Quevillon, S.; Agou, F.; Robinson, J.C.; Mirande, M. The p43 component of the mammalian multi-synthetase complex is likely to be the precursor of the endothelial monocyte-activating polypeptide II cytokine. J. Biol. Chem. 1997, 272, 32573–32579. [Google Scholar] [CrossRef]
- Schwarz, M.; Lee, M.; Zhang, F.; Zhao, J.; Jin, Y.; Smith, S.; Bhuva, J.; Stern, D.; Warburton, D.; Starnes, V. EMAP II: A modulator of neovascularization in the developing lung. Am. J. Physiol. 1999, 276, L365–L375. [Google Scholar] [CrossRef]
- Ghobrial, I.M.; McCormick, D.J.; Kaufmann, S.H.; Leontovich, A.A.; Loegering, D.A.; Dai, N.T.; Krajnik, K.L.; Stenson, M.J.; Melhem, M.F.; Novak, A.J.; et al. Proteomic analysis of mantle-cell lymphoma by protein microarray. Blood 2005, 105, 3722–3730. [Google Scholar] [CrossRef] [PubMed]
- Marvin, M.R.; Libutti, S.K.; Kayton, M.; Kao, J.; Hayward, J.; Grikscheit, T.; Fan, Y.; Brett, J.; Weinberg, A.; Nowygrod, R.; et al. A novel tumor-derived mediator that sensitizes cytokine-resistant tumors to tumor necrosis factor. J. Surg. Res. 1996, 63, 248–255. [Google Scholar] [CrossRef] [PubMed][Green Version]
- Gao, W.; An, C.; Xue, X.; Zheng, X.; Niu, M.; Zhang, Y.; Liu, H.; Zhang, C.; Lu, Y.; Cui, J.; et al. Mass spectrometric analysis identifies AIMP1 and LTA4H as FSCN1-binding proteins in laryngeal squamous cell carcinoma. Proteomics 2019, 19, e1900059. [Google Scholar] [CrossRef]
- Knies, U.E.; Behrensdorf, H.A.; Mitchell, C.A.; Deutsch, U.; Risau, W.; Drexler, H.C.; Clauss, M. Regulation of endothelial monocyte-activating polypeptide II release by apoptosis. Proc. Natl. Acad. Sci. USA 1998, 95, 12322–12327. [Google Scholar] [CrossRef]
- Barnett, G.; Jakobsen, A.M.; Tas, M.; Rice, K.; Carmichael, J.; Murray, J.C. Prostate adenocarcinoma cells release the novel proinflammatory polypeptide EMAP-II in response to stress. Cancer Res. 2000, 60, 2850–2857. [Google Scholar] [PubMed]
- Matschurat, S.; Knies, U.E.; Person, V.; Fink, L.; Stoelcker, B.; Ebenebe, C.; Behrensdorf, H.A.; Schaper, J.; Clauss, M. Regulation of EMAP II by Hypoxia. Am. J. Pathol. 2003, 162, 93–103. [Google Scholar] [CrossRef] [PubMed]
- Journeay, W.S.; Janardhan, K.S.; Singh, B. Expression and function of endothelial monocyte-activating polypeptide-II in acute lung inflammation. Inflamm. Res. 2007, 56, 175–181. [Google Scholar] [CrossRef] [PubMed]
- Mueller, C.A.; Richt, J.A.; Meyermann, A.; Deininger, M.; Schluesener, H. Accumulation of the proinflammatory cytokine endothelial-monocyte-activating polypeptide II in ramified microglial cells in brains of Borna virus infected Lewis rats. Neurosci. Lett. 2003, 339, 215–218. [Google Scholar] [CrossRef]
- Green, L.A.; Yi, R.; Petrusca, D.; Wang, T.; Elghouche, A.; Gupta, S.K.; Petrache, I.; Clauss, M. HIV envelope protein gp120-induced apoptosis in lung microvascular endothelial cells by concerted upregulation of EMAP II and its receptor, CXCR3. Am. J. Physiol. Lung Cell. Mol. Physiol. 2014, 306, L372–L382. [Google Scholar] [CrossRef] [PubMed][Green Version]
- Saber, M.M.; Clauss, M. Serum levels of Endothelial Monocyte-Activating Polypeptide in Hepatitis C Patients. Immunome Res. 2017, 12, 117. [Google Scholar]
- Murray, J.C.; Symonds, P.; Ward, W.; Huggins, M.; Tiga, A.; Rice, K.; Heng, Y.M.; Todd, I.; Robins, R.A. Colorectal cancer cells induce lymphocyte apoptosis by an endothelial monocyte-activating polypeptide-II-dependent mechanism. J. Immunol. 2004, 172, 274–281. [Google Scholar] [CrossRef] [PubMed]
- Youssef, M.M.S.; Symonds, P.; Ellis, I.O.; Murray, J.C. EMAP-II-dependent lymphocyte killing is associated with hypoxia in colorectal cancer. Br. J. Cancer 2006, 95, 735–743. [Google Scholar] [CrossRef] [PubMed]
- Murray, J.C.; Heng, Y.M.; Symonds, P.; Rice, K.; Ward, W.; Huggins, M.; Todd, I.; Robins, R.A. Endothelial monocyte-activating polypeptide-II (EMAP-II): A novel inducer of lymphocyte apoptosis. J. Leukoc. Biol. 2004, 75, 772–776. [Google Scholar] [CrossRef] [PubMed]
- Faisel, W.; Symonds, P.; Panjwani, S.; Heng, Y.; Murray, J.C. Cell-surface associated p43/endothelial-monocyte-activating-polypeptide-II in hepatocellular carcinoma cells induces apoptosis in T-lymphocytes. Asian J. Surg. 2007, 30, 13–22. [Google Scholar] [CrossRef][Green Version]
- Chelvanambi, S.; Bogatcheva, N.V.; Bednorz, M.; Agarwal, S.; Maier, B.; Alves, N.J.; Li, W.; Syed, F.; Saber, M.M.; Dahl, N.; et al. HIV-Nef Protein Persists in the Lungs of Aviremic Patients with HIV and Induces Endothelial Cell Death. Am. J. Respir. Cell. Mol. Biol. 2019, 60, 357–366. [Google Scholar] [CrossRef]
- Koike, K.; Beatman, E.L.; Schweitzer, K.S.; Justice, M.J.; Mikosz, A.M.; Ni, K.; Clauss, M.A.; Petrache, I. Subcutaneous administration of neutralizing antibodies to endothelial 2 monocyte-activating protein II attenuates cigarette smoke-induced lung. Am. J. Physiol. Lung Cell. Mol. Physiol. 2019, 316, L558–L566. [Google Scholar] [CrossRef]
- World Health Organization. Laboratory Testing Strategy Recommendations for COVID-19: Interim Guidance, 21 March 2020. Available online: https://apps.who.int/iris/handle/10665/331509 (accessed on 24 May 2020).
- The Guideline of Diagnosis and Treatment on Novel Coronavirus Pneumonia. Available online: http://www.nhc.gov.cn/yzygj/s7652m/202003/a31191442e29474b98bfed5579d5af95.shtml (accessed on 3 March 2020).
- Schmithausen, R.M.; Dohla, M.; Schoβler, H.; Diegmann, C.; Schulte, B.; Richter, E.; Eis-Hübinger, A.-M.; Streeck, H. Characteristic Temporary Loss of Taste and Olfactory Senses in SARS-CoV-2-positive-Individuals with Mild Symptoms. Pathog. Immun. 2020, 5, 117–120. [Google Scholar] [CrossRef]
- Berlin, D.A.; Gulick, R.M.; Martinez, F.J. Severe COVID-19. N. Engl. J. Med. 2020, 383, 2451–2460. [Google Scholar] [CrossRef]
- Gandhi, R.T.; Lynch, J.B.; Del Rio, C. Mild or Moderate COVID-19. N. Engl. J. Med. 2020, 383, 1757–1766. [Google Scholar] [CrossRef]
- Rao, S.N.; Manissero, D.; Steele, V.R.; Pareja, J. A Systematic Review of the Clinical Utility of Cycle Threshold Values in the Context of COVID-19. Infect. Dis. Ther. 2020, 9, 573–586. [Google Scholar] [CrossRef]
- Bonacorsi, S.; Visseaux, B.; Bouzid, D.; Pareja, J.; Rao, S.N.; Manissero, D.; Hansen, G.; Vila, J. Systematic Review on the Correlation of Quantitative PCR Cycle Threshold Values of Gastrointestinal Pathogens with Patient Clinical Presentation and Outcomes. Front. Med. 2021, 8, 711809. [Google Scholar] [CrossRef] [PubMed]
- Maggi, E.; Canonica, G.W.; Moretta, L. COVID-19: Unanswered questions on immune response and pathogenesis. J. Allergy Clin. Immunol. 2020, 146, 18–22. [Google Scholar] [CrossRef] [PubMed]
- Gudbjartsson, D.F.; Helgason, A.; Jonsson, H. Spread of SARS-CoV-2 in the Icelandic population. N. Engl. J. Med. 2020, 328, 2302–2315. [Google Scholar] [CrossRef]
- Kashani, K.B. Hypoxia in COVID-19: Sign of Severity or Cause for Poor Outcomes. Mayo Clin. Proc. 2020, 95, 1094–1096. [Google Scholar] [CrossRef]
- Secil Deniz, S.; Uysal, T.K.; Capasso, C.; Supuran, C.T.; Guler, O.O. Is carbonic anhydrase inhibition useful as a complementary therapy of COVID-19 infection? J. Enzym. Inhib. Med. Chem. 2021, 36, 1230–1235. [Google Scholar] [CrossRef] [PubMed]
- Duan, F.; Wang, Y.; Chen, T.; Zhu, Z.; Yu, M.; Dai, H.; Zheng, S. A novel strategy for identifying biomarker in serum of a patient with COVID-19 using immune complex. Signal Transduct. Target. Ther. 2022, 7, 63. [Google Scholar] [CrossRef] [PubMed]
- Bader, S.M.; Cooney, J.P.; Pellegrini, M.; Doerflinger, M. Programmed cell death: The pathways to severe COVID-19? Biochem. J. 2022, 479, 609–628. [Google Scholar] [CrossRef]
- Wege, H.; Schluesener, H.; Meyermann, R.; Barac-Latas, V.; Suchanek, G.; Lassmann, H. Coronavirus infection, and demyelination. Development of inflammatory lesions in Lewis rats. Adv. Exp. Med. Biol. 1998, 440, 437–444. [Google Scholar]
- Kao, J.; Fan, Y.G.; Haehnel, I.; Clauss, M.; Stern, D. Endothelial-monocyte activating polypeptides (EMAPs): Tumor derived mediators which activate the host inflammatory response. Behring Inst. Mitt. 1993, 92, 92–106. [Google Scholar]
- Mortaz, E.; Tabarsi, E.; Varahram, M.; Folkerts, G.; Adcock, I.M. The immune response and immunopathology of COVID-19. Front. Immunol. 2020, 11, 2037. [Google Scholar] [CrossRef]
- Huang, I.; Pranata, R.; Lim, M.A.; Oehadian, A.; Alisjahbana, B. C-reactive protein, procalcitonin, D-dimer, and ferritin in severe coronavirus disease-2019: A meta-analysis. Ther. Adv. Respir. Dis. 2020, 14, 1753466620937175. [Google Scholar] [CrossRef] [PubMed]
- Cizmecioglu, A.; Cizmecioglu, H.A.; Goktepe, M.H.; Emsen, A.; Korkmaz, A.C.; Tasbent, F.E.; Colkesen, F.; Artac, H. Apoptosis-induced T-cell lymphopenia is related to COVID-19 severity. J. Med. Virol. 2021, 93, 2867–2874. [Google Scholar] [CrossRef] [PubMed]
- André, S.; Picard, M.; Cezar, R.; Roux-Dalvai, F.; Alleaume-Butaux, A.; Soundaramourty, C.; Cruz, A.S. T cell apoptosis characterizes severe COVID-19 disease. Cell Death Differ. 2022, 29, 1486–1499. [Google Scholar] [CrossRef] [PubMed]


| Severe (I) | Mild (II) | Asymptomatic (III) | Control | p-Value a | ||||
|---|---|---|---|---|---|---|---|---|
| (N = 20) | (N = 20) | (N = 20) | (N = 20) | p1 (I vs. II) | p2 (I vs. III) | p3 (II vs. III) | ||
| Age | 65.5 (56.5–68) | 30.5 ‡ (27.5–53.5) | 35 ‡ (26.5–48) | 63 (57.5–66) | <0.001 ** | <0.001 ** | <0.001 * | 0.542 |
| <65 year | 8 (40%) | 17 (85%) | 20 (100%) | 12 (60%) | <0.001 ** | 0.003 * | <0.001 ** | 0.231 |
| ≥65 year | 12 (60%) | 3 (15%) | 0 (0%)‡ | 8 (40%) | ||||
| Sex | ||||||||
| Male | 11 (55%) | 11 (55%) | 11 (55%) | 12 (60%) | 0.985 | <0.99 | <0.99 | <0.99 |
| Female | 9 (45%) | 9 (45%) | 9 (45%) | 8 (40%) | ||||
| Chronic disease | ||||||||
| Asthma | 1 (5%) | 0 (0%) | 0 (0%) | 0 (0%) | 0.388 | 0.567 | 0.439 | 0.615 |
| BPH | 1 (5%) | 0 (0%) | 0 (0%) | 0 (0%) | ||||
| Cardiac disease | 3 (15%) | 2 (10%) | 1 (5%) | 0 (0%) | ||||
| Cholecystitis | 0 (0%) | 1 (5%) | 0 (0%) | 0 (0%) | ||||
| DVT | 1 (5%) | 0 (0%) | 0 (0%) | 0 (0%) | ||||
| Renal disease | 1 (5%) | 1 (5%) | 2 (10%) | 0 (0%) | ||||
| Stroke | 1 (5%) | 0 (0%) | 0 (0%) | 0 (0%) | ||||
| Thyroid disease | 0 (0%) | 0 (0%) | 1 (5%) | 0 (0%) | ||||
| Hypertension | 10 (50%) ‡ | 6 (30%) ‡ | 2 (10%) | 0 (0%) | <0.001 ** | 0.197 | 0.006 * | 0.235 |
| Diabetes Mellitus | 10 (50%) ‡ | 4 (20%) | 5 (25%) | 0 (0%) | 0.003 * | 0.047 * | 0.102 | >0.99 |
| Cough | 19 (95%) ‡ | 16 (80%) ‡ | 0 (0%) | 0 (0%) | <0.001 ** | 0.342 | <0.001 ** | <0.001 ** |
| Fever | 18 (90%) ‡ | 12 (60%) ‡ | 0 (0%) | 0 (0%) | <0.001 ** | 0.028 * | <0.001 ** | <0.001 ** |
| Dyspnea | 18 (90%) ‡ | 2 (10%) | 0 (0%) | 0 (0%) | <0.001 ** | <0.001 ** | <0.001 ** | 0.487 |
| Loss of smell and taste | 4 (20%) | 7 (35%) ‡ | 0 (0%) | 0 (0%) | 0.002 * | 0.288 | 0.106 | 0.008 * |
| Sore throat | 14 (70%) ‡ | 10 (50%) ‡ | 0 (0%) | 0 (0%) | <0.001 ** | 0.197 | <0.001 ** | <0.001 ** |
| Number of symptoms | 4 ‡ (3–4) | 3 ‡ (2–3) | 0 (0–0) | 0 (0–0) | <0.001 ** | <0.001 ** | <0.001 ** | <0.001 ** |
| O2 Saturation | 73.5 ‡ (61–84.5) | 96 (95–97.5) | 98 ‡ (97–98) | 97 (96–97.5) | <0.001 ** | <0.001 ** | <0.001 ** | 0.009 * |
| Outcome | ||||||||
| Survived | 10 (50%) ‡ | 20 (100%) | 20 (100%) | 20 (100%) | <0.001 ** | <0.001 ** | <0.001 ** | … |
| Died | 10 (50%) | 0 (0%) | 0 (0%) | 0 (0%) |
| Severe (I) | Mild (II) | Asymptomatic (III) | Control | p-Value a | ||||
|---|---|---|---|---|---|---|---|---|
| (N = 20) | (N = 20) | (N = 20) | (N = 20) | p1 (I vs. II) | p2 (I vs. III) | p3 (II vs. III) | ||
| Hb (g/dl) | 12.2 ‡ (11.2–13.2) | 13.1 ‡ (12.6–14.2) | 14.1 (13.1–15.5) | 14.1 (13.7–15.1) | <0.001 ** | 0.017 * | <0.001 ** | 0.076 |
| TLC × 103/mm3 | 12.1 ‡ (8.6–13.1) | 6 ‡ (4–7) | 5.7 ‡ (4.1–7.5) | 7.6 (6.3–8.9) | <0.001 ** | <0.001 ** | <0.001 ** | 0.818 |
| PLT × 103/ mm3 | 277 (223–338) | 273 (214–333) | 342 (242–381) | 309 (268–349) | 0.176 | 0.715 | 0.172 | 0.066 |
| Lymphocyte percentage | 10 ‡ (6.5–12) | 17 ‡ (14–21.5) | 14.5 ‡ (13–17) | 35.5 (30–41) | <0.001 ** | <0.001 ** | <0.001 ** | 0.103 |
| ESR 1st | 55.5 ‡ (40.5–90) | 30 ‡ (23–41) | 23 ‡ (18.5–28) | 6 (5–7) | <0.001 ** | <0.001 ** | <0.001 ** | 0.008 * |
| ESR 2nd | 99.5 (83.5–130) ‡ | 64.5 ‡ (50–76.5) | 45 ‡ (39.5–55) | 13 (10.5–15) | <0.001 ** | <0.001 ** | <0.001 ** | 0.006 * |
| Urea (mg/dL) | 55.5 ‡ (38.5–69.5) | 33.5 (30–38) | 27 (24–31.5) | 30 (28.5–33.5) | <0.001 ** | 0.001 * | <0.001 ** | 0.003 * |
| Creatinine (mg/dL) | 1.2 ‡ (1.1–1.4) | 0.9 (0.7–1.1) | 0.8 (0.7–0.9) | 0.9 (0.8–0.9) | <0.001 ** | 0.002 * | <0.001 ** | 0.068 |
| ALT (U/L) | 38 ‡ (27.5–62) | 31 ‡ (24–37.5) | 24.5 (20–33.5) | 22 (18.5–28) | <0.001 ** | 0.096 | 0.004 * | 0.07 |
| AST (U/L) | 38.5 (29.5–46.5) ‡ | 26 (22.5–29.5) | 21.5 (17.5–31) | 24 (19–29.5) | <0.001 ** | <0.001 ** | <0.001 ** | 0.249 |
| Albumin (g/dL) | 3.7 ‡ (3.5–3.9) | 4.1 (4–4.3) | 4.2 (4–4.4) | 4.1 (3.9–4.4) | <0.001 ** | <0.001 ** | <0.001 ** | 0.173 |
| Total bilirubin (mg/dL) | 0.8 ‡ (0.6–0.9) | 0.6 (0.5–0.9) | 0.7 (0.5–0.8) | 0.6 (0.5–0.8) | 0.133 | 0.166 | 0.068 | 0.722 |
| Direct bilirubin (mg/dL) | 0.2 ‡ (0.2–0.3) | 0.2 (0.1–0.2) | 0.2 (0.1–0.2) | 0.2 (0.1–0.2) | 0.078 | 0.235 | 0.102 | 0.654 |
| RBS (mg/dl) | 145.5 ‡ (119.5–195) | 121.5 (104–139) | 115 (94.5–131.5) | 115.5 (103–126) | 0.009 * | 0.107 | 0.006 * | 0.273 |
| D-dimer (µg/mL) | 6 ‡ (3.3–10.5) | 1.3 ‡ (0.9–1.8) | 0.5 ‡ (0.4–0.6) | 0.3 (0.2–0.3) | <0.001 ** | <0.001 * | <0.001 ** | <0.001 ** |
| Ferritin (ng/mL) | 923 ‡ (642.5–1362.5) | 431.5 ‡ (370–540) | 207 ‡ (138–328) | 106.5 (79–124.5) | <0.001 ** | <0.001 ** | <0.001 ** | <0.001 ** |
| CRP (mg/L) | 130 (105–198) ‡ | 23 ‡ (15.9–33.9) | 16.3 ‡ (12.7–18.6) | 2 (1.6–2.2) | <0.001 ** | <0.001 ** | <0.001 ** | 0.012 * |
| EMAP II Ct | 34.3 (32.9–36.1) |
| EMAPII Ct ≤ 34 | EMAPII Ct > 34 | p Value | |
|---|---|---|---|
| (N = 10) | (N = 10) | ||
| Mortality | 10 (100%) | 0 (0%) | <0.001 ** |
| Age | 67.5 (66–70) | 58 (55–65) | 0.007 * |
| <60 year | 1 (10%) | 7 (70%) | 0.020 * |
| ≥65 year | 9 (90%) | 3 (3%) | |
| Sex | |||
| Male | 4 (40%) | 7 (70%) | 0.37 |
| Female | 6 (60%) | 3 (30%) | |
| Hypertension | 5 (50%) | 5 (50%) | >0.99 |
| Diabetes Mellitus | 6 (60%) | 4 (40%) | 0.371 |
| Cough | 10 (100%) | 9 (90%) | >0.99 |
| Fever | 9 (90%) | 9 (90%) | >0.99 |
| Dyspnea | 10 (100%) | 8 (80%) | 0.474 |
| Loss of smell and taste | 3 (30%) | 1 (10%) | 0.582 |
| Sore throat | 6 (60%) | 8 (80%) | 0.628 |
| Number of symptoms | 4 (3–5) | 4 (3–4) | 0.304 |
| O2 saturation | 61 (60–70) | 84.5 (80–86) | <0.001 ** |
| Hb (g/dl) | 12 (11.4–12.7) | 12.5 (10.8–13.5) | 0.733 |
| TLC × 103/mm3 | 11.2 (9.9–12.5) | 12.6 (8.1–14.2) | 0.52 |
| PLT × 103/mm3 | 273 (176–362) | 304 (246–334) | 0.705 |
| Lymphocyte percentage | 6.5 (5–8) | 12 (11–13) | <0.001 ** |
| ESR 1st | 60.5 (45–90) | 50.5 (40–90) | 0.52 |
| ESR 2nd | 107 (94–135) | 92.5 (78–125) | 0.52 |
| Urea (mg/dl) | 63.5 (49–70) | 50.5 (38–57) | 0.345 |
| Creatinine (mg/dl) | 1.3 (1.1–1.4) | 1.1 (1–1.2) | 0.147 |
| ALT (U/L) | 40 (27–66) | 38 (29–55) | 0.97 |
| AST (U/L) | 37 (29–48) | 38.5 (34–43) | 0.733 |
| Albumin (g/dl) | 3.6 (3.6–3.7) | 3.9 (3.3–4) | 0.249 |
| Total bilirubin (mg/dl) | 0.8 (0.6–0.8) | 0.8 (0.6–1) | 0.415 |
| Direct bilirubin (mg/dl) | 0.2 (0.2–0.2) | 0.2 (0.2–0.3) | 0.297 |
| RBS (mg/dl) | 148.5 (110–180) | 139 (128–220) | 0.705 |
| D-dimer (ug/mL) | 10.5 (6.4–10.9) | 3.3 (3.2–4.9) | <0.001 ** |
| Ferritin (ng/mL) | 1346 (941–1434) | 642.5 (591–812) | <0.001 ** |
| CRP (mg/L) | 198 (175–380) | 115.5 (102–128) | 0.011 * |
| EMAP II Ct | 32.9 (31.6–34) | 36.1 (35.1–36.5) | <0.001 ** |
| EMAP II Ct | ||
|---|---|---|
| rho | p | |
| Age | −0.505 | 0.023 * |
| Number of symptoms | −0.162 | 0.494 |
| O2 saturation | 0.968 | <0.001 ** |
| Hb (g/dL) | 0.079 | 0.741 |
| TLC × 103/mm3 | 0.123 | 0.605 |
| PLT × 103/mm3 | 0.212 | 0.37 |
| Lymphocyte percentage | 0.836 | <0.001 ** |
| ESR 1st | 0.111 | 0.643 |
| ESR 2nd | 0.082 | 0.73 |
| Urea (mg/dL) | 0.065 | 0.786 |
| Creatinine (mg/dL) | −0.105 | 0.659 |
| ALT (U/L) | −0.13 | 0.585 |
| AST (U/L) | 0.023 | 0.922 |
| Albumin (g/dL) | 0.026 | 0.915 |
| T bilirubin (mg/dL) | 0.175 | 0.46 |
| D bilirubin (mg/dL) | 0.279 | 0.234 |
| RBS (mg/dL) | 0.158 | 0.505 |
| D dimer (µg/mL) | −0.898 | <0.001 ** |
| Ferritin (ng/mL) | −0.833 | <0.001 ** |
| CRP (mg/L) | −0.725 | <0.001 ** |
Publisher’s Note: MDPI stays neutral with regard to jurisdictional claims in published maps and institutional affiliations. |
© 2022 by the authors. Licensee MDPI, Basel, Switzerland. This article is an open access article distributed under the terms and conditions of the Creative Commons Attribution (CC BY) license (https://creativecommons.org/licenses/by/4.0/).
Share and Cite
Saber, M.M.; Nomair, A.M.; Osman, A.M.; Nomeir, H.M.; Farag, N.M. Endothelial Monocyte-Activating Polypeptide-II Is an Indicator of Severity and Mortality in COVID-19 Patients. Vaccines 2022, 10, 2177. https://doi.org/10.3390/vaccines10122177
Saber MM, Nomair AM, Osman AM, Nomeir HM, Farag NM. Endothelial Monocyte-Activating Polypeptide-II Is an Indicator of Severity and Mortality in COVID-19 Patients. Vaccines. 2022; 10(12):2177. https://doi.org/10.3390/vaccines10122177
Chicago/Turabian StyleSaber, Manal Mohamed, Azhar Mohamed Nomair, Ashraf M. Osman, Hanan Mohamed Nomeir, and Naglaa M. Farag. 2022. "Endothelial Monocyte-Activating Polypeptide-II Is an Indicator of Severity and Mortality in COVID-19 Patients" Vaccines 10, no. 12: 2177. https://doi.org/10.3390/vaccines10122177
APA StyleSaber, M. M., Nomair, A. M., Osman, A. M., Nomeir, H. M., & Farag, N. M. (2022). Endothelial Monocyte-Activating Polypeptide-II Is an Indicator of Severity and Mortality in COVID-19 Patients. Vaccines, 10(12), 2177. https://doi.org/10.3390/vaccines10122177