Article

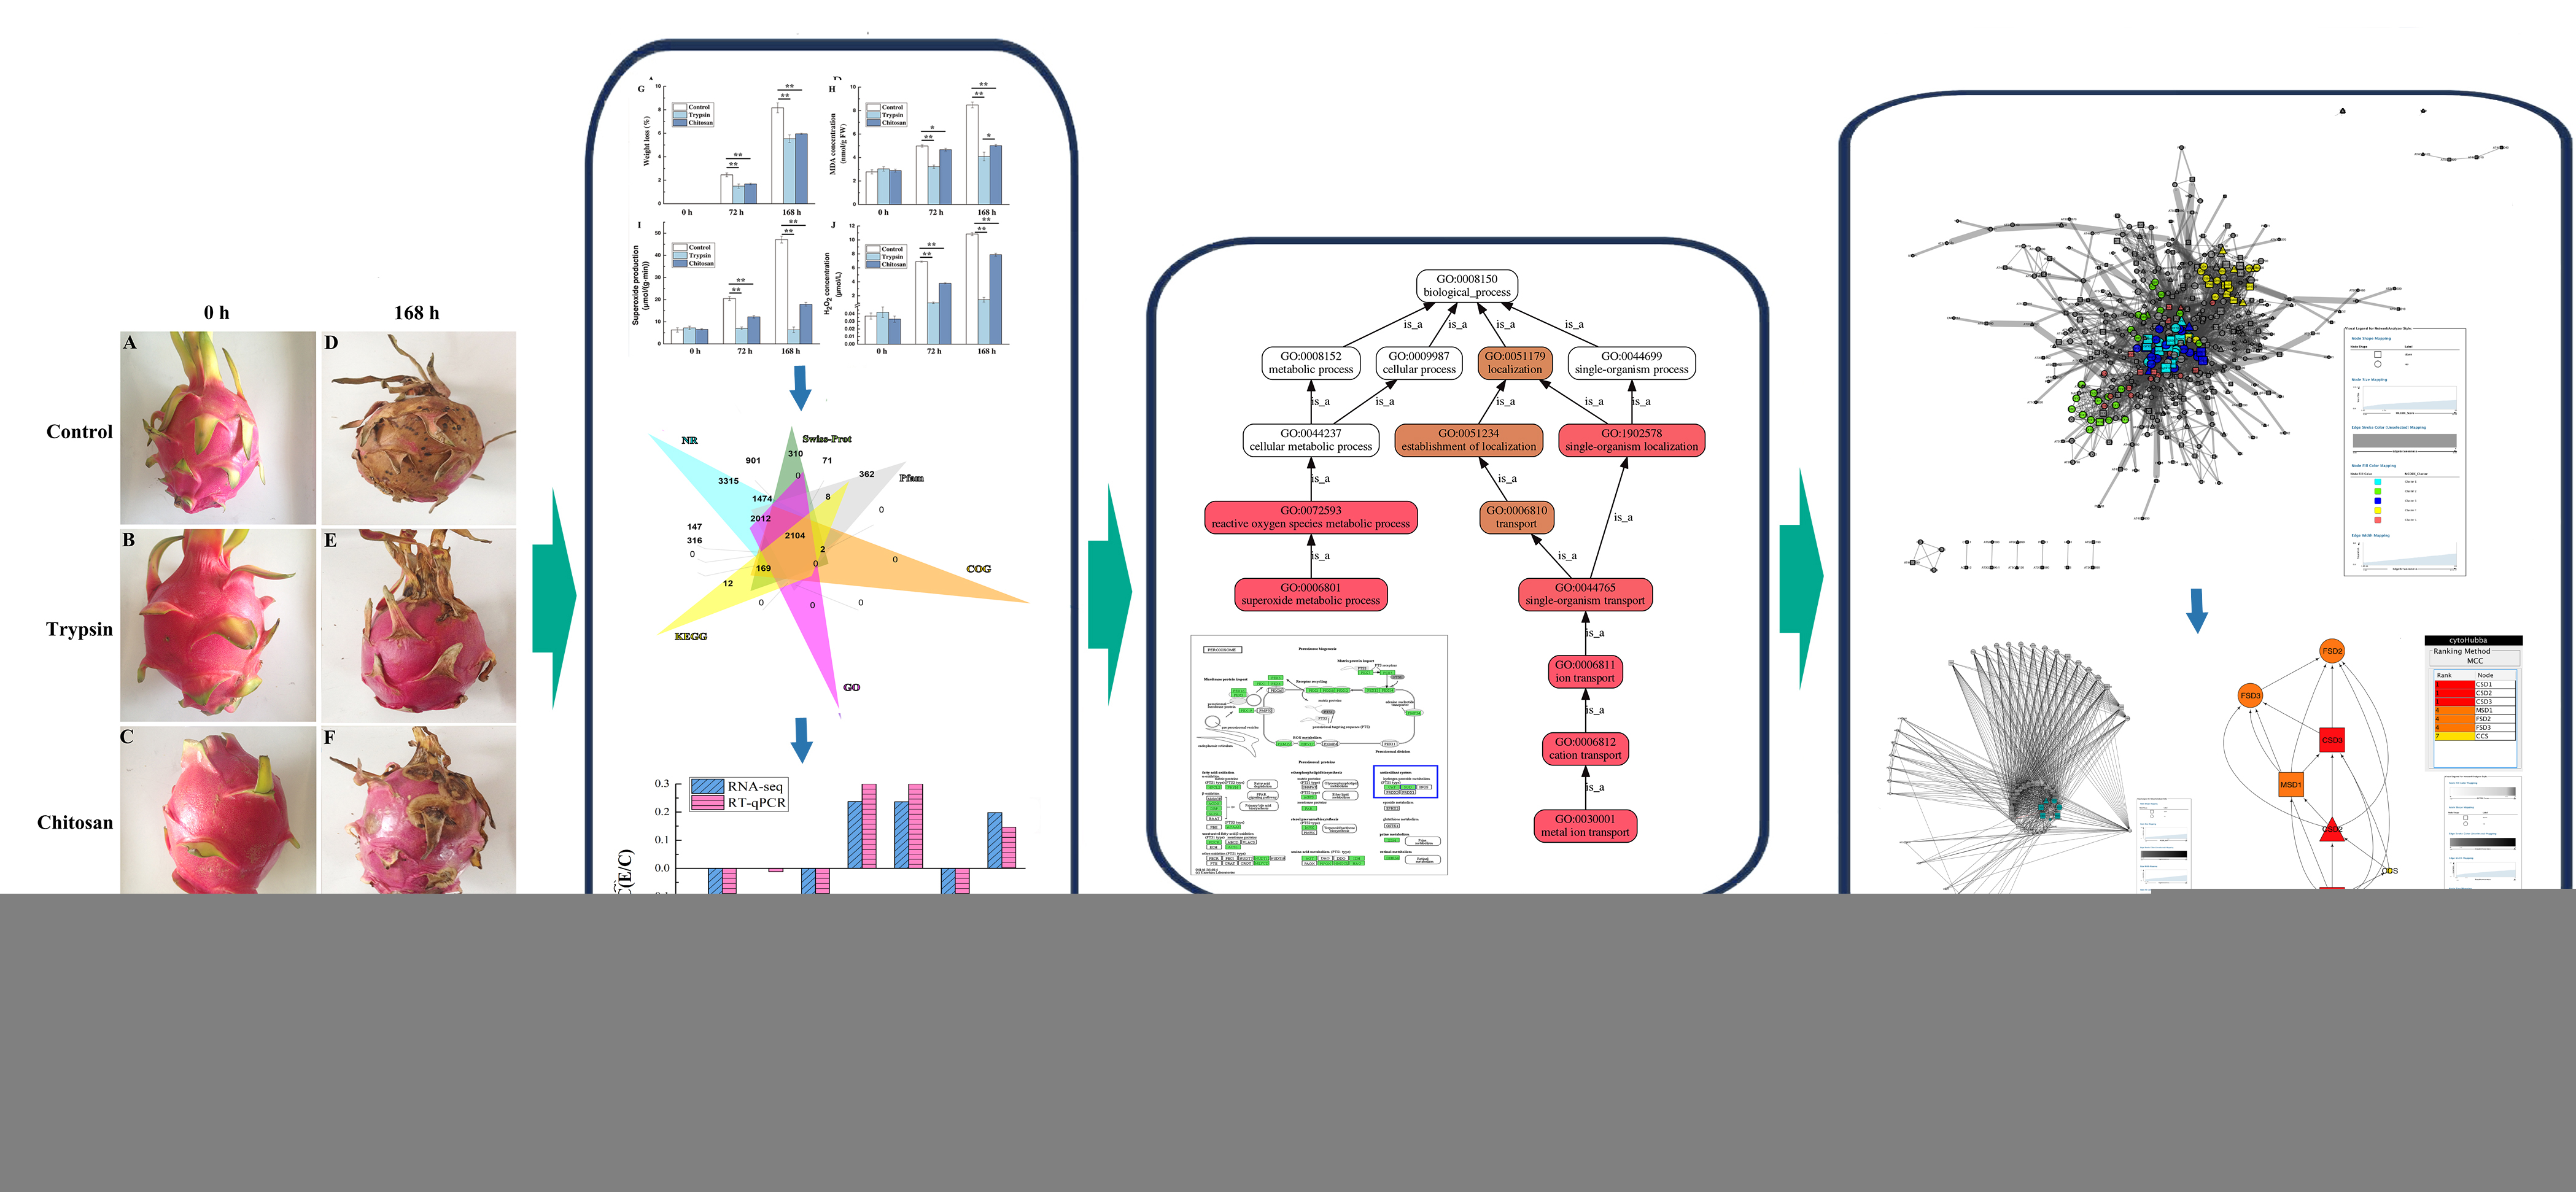
Transcriptomic Analysis Reveals Cu/Zn SODs Acting as Hub Genes of SODs in Hylocereus undatus Induced by Trypsin during Storage

1
College of Medical Technology and Engineering, Henan University of Science and Technology, Luoyang 471023, China
2
College of Food and Bioengineering, Henan University of Science and Technology, Luoyang 471023, China
3
Henan Engineering Research Center of Food Microbiology, Luoyang 471000, China
4
National Demonstration Center for Experimental Food Processing and Safety Education, Luoyang 471000, China
*
Author to whom correspondence should be addressed.
These authors contributed equally to this work.
Antioxidants 2020, 9(2), 162; https://doi.org/10.3390/antiox9020162
Submission received: 2 January 2020 / Revised: 14 February 2020 / Accepted: 15 February 2020 / Published: 17 February 2020

Abstract

:
It has been revealed by us that superoxide scavenging is a new activity of trypsin. In this study, the synergistic mechanisms of trypsin and superoxide dismutases (SODs) were evaluated in Hylocereus undatus (pitaya). Trypsin significantly improved the storage quality of H. undatus, including weight loss impediment and decrease of cellular injury. The regulatory mechanisms of 16 SOD genes by trypsin were revealed using transcriptomic analysis on H. undatus. Results revealed that important physiological metabolisms, such as antioxidant activities or metal ion transport were induced, and defense responses were inhibited by trypsin. Furthermore, the results of protein–protein interaction (PPI) networks showed that besides the entire ROS network, the tiny SODs sub-network was also a scale-free network. Cu/Zn SODs acted as the hub that SODs synergized with trypsin during the storage of H. undatus.

Graphical Abstract

1. Introduction

Hylocereus undatus (H. undatus), is a species of Cactaceae [1]. Based on the commercial value and outstanding nutritional properties, H. undatus is becoming increasingly important to the world [2]. Likes most of fruits, the quality of H. undatus decreases with time during storage. Till now, few works have aimed to increase the storage quality of H. undatus [3].
The disequilibrium of reactive oxygen species (ROS) production and scavenging will lead to elevated ROS levels, and further induce an increase of cellular injury and finally result in fruit spoilage by the end of storage of fruit [4,5]. As the primary antioxidant enzyme, SODs play important roles in plant physiology [6]. The activities of superoxide dismutase (SOD) have been reported to be induced during fruit spoilage [7], while the regulatory mechanisms among three groups (iron SOD (FSD), copper/zinc SOD (CSD), and manganese SOD (MSD)) during fruit storage have not been elucidated to date.
Trypsin is a widely used protease. It has been confirmed that trypsin significantly impacts on the free radical scavenging activities of flavonoids [8]. Our previous results also showed that trypsin scavenges superoxide anions (O2) and protects cells [9].
In the area of phytopathology, transcriptomic analysis has been successful used on lots of plants [10,11,12,13]. However, few of transcriptomic works have been focused on the preservation of fruits. The mechanisms of betalain biosynthesis have been investigated in H. undatus [2], and the concision analysis of antioxidant system induced by trypsin has also been investigated in our previous paper [14]. Considering the superoxide scavenging activity of trypsin, the function and synergistic mechanisms of trypsin with SODs impact on the quality of H. undatus during storage is an interesting work. The mechanisms of postharvest quality of fruits still need more works.
Protein–protein interaction (PPI) networks analyses help us to figure out the regulatory mechanisms of proteins [15]. Plugins of Cytoscape, including NetworkAnalyzer, Molecular Complex Detection (MCODE), and cytoHubba, could score and rank the nodes or obtain clusters in the PPI network [16].
In the current work, the regulatory mechanisms of trypsin on the H. undatus by cooperating with SODs were investigated. The changes in expression of SODs of H. undatus peels were analyzed. Analyses of gene ontology (GO) and KEGG enrichment of ROS or SOD related genes were performed, and the PPI network of ROS related genes and sub-network of SODs and their first neighbors were constructed. The hub genes of SODs regulated by trypsin during storage were further screened by cytoHubba and MCODE of cytoscape.

2. Materials and Methods

2.1. Main Materials

H. undatus (Vietnam No.1 cultivar) was harvested from the county in Ruyang, Luoyang city in China. Trypsin (bovine, 500 units/mg, crystalline) was purchased from Amersco (Solon, OH, USA).

2.2. H. undatus Treatment

Forty-five fruits (about 15 cm in diameter) of H. undatus were divided into 3 groups, including trypsin, chitosan, and control group. Trypsin, chitosan, or PBS buffer were brushed evenly for 80 s onto the peels [14,17]. The storage conditions of incubator were 25 °C, 85% relative humidity. The indices of fruit quality were detected. The final concentration of trypsin was 2.41 × 10⁻⁶ mol/L.

2.3. Library Construction and Illumina RNA-Sequencing

Total RNA extraction and transcriptome libraries for RNA-seq of trypsin and control group were performed as reported by us [14].

2.4. Difference of Gene Expression

To identify the change of expression of ROS or SOD related genes between control and trypsin treated samples, the expression level of each transcript was calculated by the fragments per kilobase of exon per million mapped reads (FRKM) method. Differential expression analysis was performed by EdgeR software (Empirical analysis of Digital Gene Expression in R, http://www.bioconductor.org/packages/2.12/bioc/html/edgeR.html) from the R statistical package. The false discovery rate (FDR) was used to adjust the resulting p-values using the Benjamini and Hochberg approach [18,19].

2.5. GO and KEGG Enrichment Analyses

GO and Kyoto Encyclopedia of Genes and Genomes pathway (KEGG) information were enriched as described by Candar-Cakir et al. [20]. The enriched GO terms were shown with bar charts and DAGs (directed acyclic hierarchical graph) [20].

2.6. Gene Expression Analysis by Reverse Transcription-qPCR

Reverse transcription-qPCR was performed as described by Yang et al. [21]. The information of primer was shown in Table 6. Gene expression was normalized by internal control, β-actin. The relative copy numbers of the genes were calculated by the 2−∆∆Ct method [11,21].

2.7. Protein-Protein Interaction (PPI) Analyse

2.7.1. PPI Network Generation

Proteins were exported from the cloud platform of I-Sanger and loaded into cytoscape to construct a network. The interactions between ROS or SOD related proteins regulated by trypsin were shown by the nodes and edges in the networks of ROS, the first neighbors of SODs or SODs of H. undatus using cytoscape [22].

2.7.2. Network Topological Parameters

NetworkAnalyzer showed the basic network parameters in this study [22]. Here, the edges in the networks constructed in the current study were calculated as undirected. The power law curve was formed as y = βxα [23].

2.7.3. Module

The clusters of the entire ROS related network were identified by MCODE [24]. The edges in networks were set as directed for MCODE or next hub node analysis.

2.7.4. Analysis of Hub Nodes in the PPI Network

The cytoHubba plugin of cytoscape was used to identify the high degree nodes [25] by 11 topological analysis methods [26].

2.8. Weight Loss Rate

The rates of weight loss of samples were obtained using 3 parallel experiments and were recorded at 72 and 168 h (25 °C).

2.9. Quantification of Lipid Peroxides

Malondialdehyde (MDA) contents were measured as described by Zhou et al. [27].

2.10. Determination of ROS of H. undatus Peel

The production of O2 or hydrogen peroxide (H2O2) accumulation was determined as described by Schneider and Schlegel [14,28] or Li and Imlay in 2018 [29], respectively.

2.11. Statistical Analyses

The statistical analyses were performed by SPSS statistical software package (11.0.1) (15 November 2001, SPSS Inc., Chicago, IL, USA). The differences between samples were analyzed by paired sample t-test. Significant or highly significant difference was evaluated by p < 0.05 or p < 0.01, respectively.

3. Results

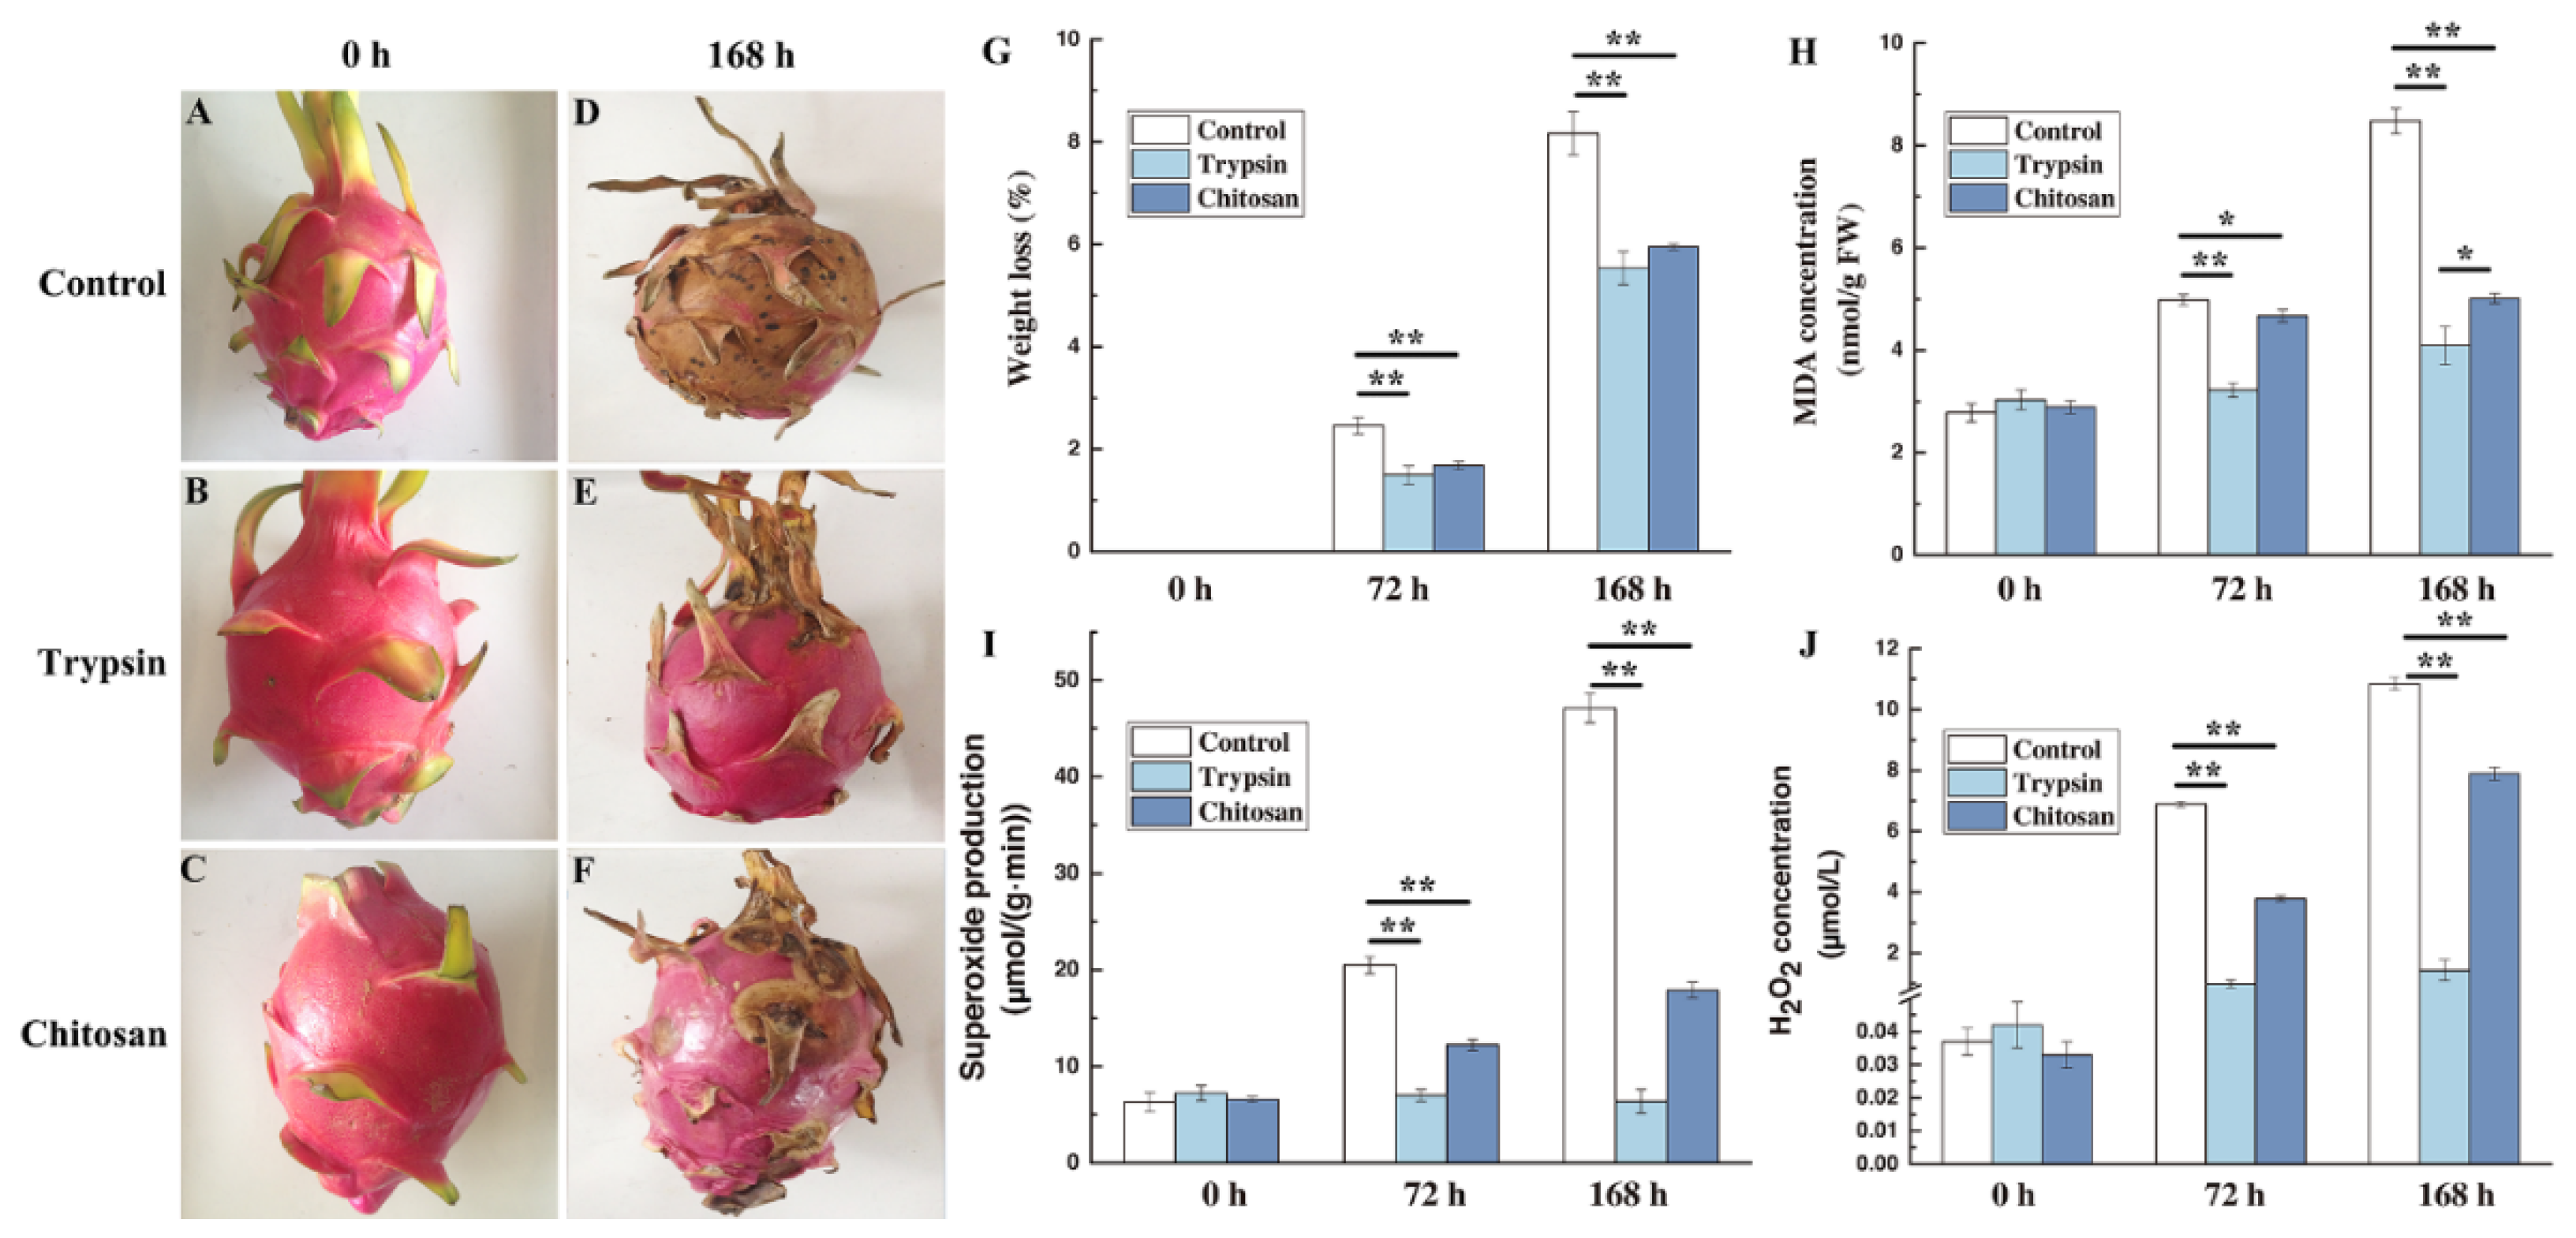
3.1. Effect on Fruit Quality of H. undatus

The appearance of three groups of H. undatus was bright and fresh at 0 h (Figure 1A–C). After 168 h of storage, the fruit of control group were entirely decayed (Figure 1D). The peel of fruit of trypsin group was preserved well and similar to that at the beginning of storage (Figure 1E). The decay of chitosan treated pitaya was much less than the control, while there were multiple rotting spots on the fruits (Figure 1F).
The weight loss of each group showed a significant increasing with increasing storage time (Figure 1G). The weight loss rates were 1.15%, 0.78%, or 0.84% in control, trypsin or chitosan group (Figure 1G). The difference between the two preservative groups (trypsin and chitosan) was not significant. While both trypsin and chitosan group exhibited a highly significant difference with the control group at 72 or 168 h (p < 0.01).

3.2. Impact on the Cell Injury

In control group, results showed that the MDA contents sharply increased by 305% after 168 h of storage (Figure 1H). The increase of MDA was entirely inhibited by trypsin. The effect of trypsin was much better than that of chitosan (p < 0.05) (Figure 1H). The difference between the control group and the trypsin or chitosan group was highly significant at 168 h (p < 0.01). The result suggested that trypsin can significantly impede the formation of MDA contents, which represents the lipid peroxidation of cellular membrane. In other words, trypsin significantly inhibits the cell injury by excess ROS during storage.

3.3. Impact on the ROS of H. undatus

As shown in Figure 1I,J, the rate of O2 production and H2O2 levels in the fruits of the control group increased with storage. Either trypsin or chitosan inhibited the accumulation of ROS (p < 0.01) (Figure 1I,J). Trypsin completely inhibited the accumulation of O2 and H2O2.

3.4. Transcriptomic Analyses

3.4.1. Differentially Expressed Genes

Since there was still no reference genome for H. undatus, transcripts and unigenes were blasted against 6 major databases (Figure S1A,C). A total of 30,222 (34.81%) unigenes were annotated (E value < 10−6) (Figure S1B).

3.4.2. Functional Annotation and Analyses

Sixteen superoxide related genes were screened, including four up- and five down-regulated genes (Figure S2 and Table S1).
Based on clusters of orthologous groups of proteins (COG) classifications, seven unigenes were assigned into only one functional category, inorganic ion transport and metabolism, which belongs to the metabolism type. All 16 superoxide related unigenes were mainly classified into three categories of gene ontology (GO) i.e., biological process (BP), molecular function (MF), and cellular component (CC) on level 2 (Figure S3). The main functions were gathered in catalytic activity (12 unigenes, 75%), binding (13 unigenes, 81.25%), and antioxidant activity (8 unigenes, 50%) of MF classification. As for the BP, they were focused on cellular process (6 unigenes, 37.50%), metabolic process (5 unigenes, 31.25%), and localization (5 unigenes, 31.25%) (Table S2). In the cellular component, cell part (3 unigenes, 18.75%) and cell (3 unigenes, 18.75%) were the major parts (Figure S3 and Table S2).
Sixteen unigenes were assigned to 5 KEGG pathways (Table S3). SOD was annotated in the hydrogen peroxide metabolism (PTS1 type) belonging to the antioxidant system which is represented in the peroxisome biogenesis pathway (map04146) (Figure S4). Serine-protein kinase ATM (EC:2.7.11.1) play key roles in the recognition part of pathway homologous recombination (map03440) (Figure S5). The signal recognition particle receptor subunit beta (SRPRB) was the key protein in the sec dependent pathway of the protein export pathway (map03060) (Figure S6). Nonsense-mediated mRNA decay protein 3 (NMD3) played key roles (Figures S7 and S8) either in pathway RNA transport (map03013) or ribosome biogenesis in eukaryotes (map03008).

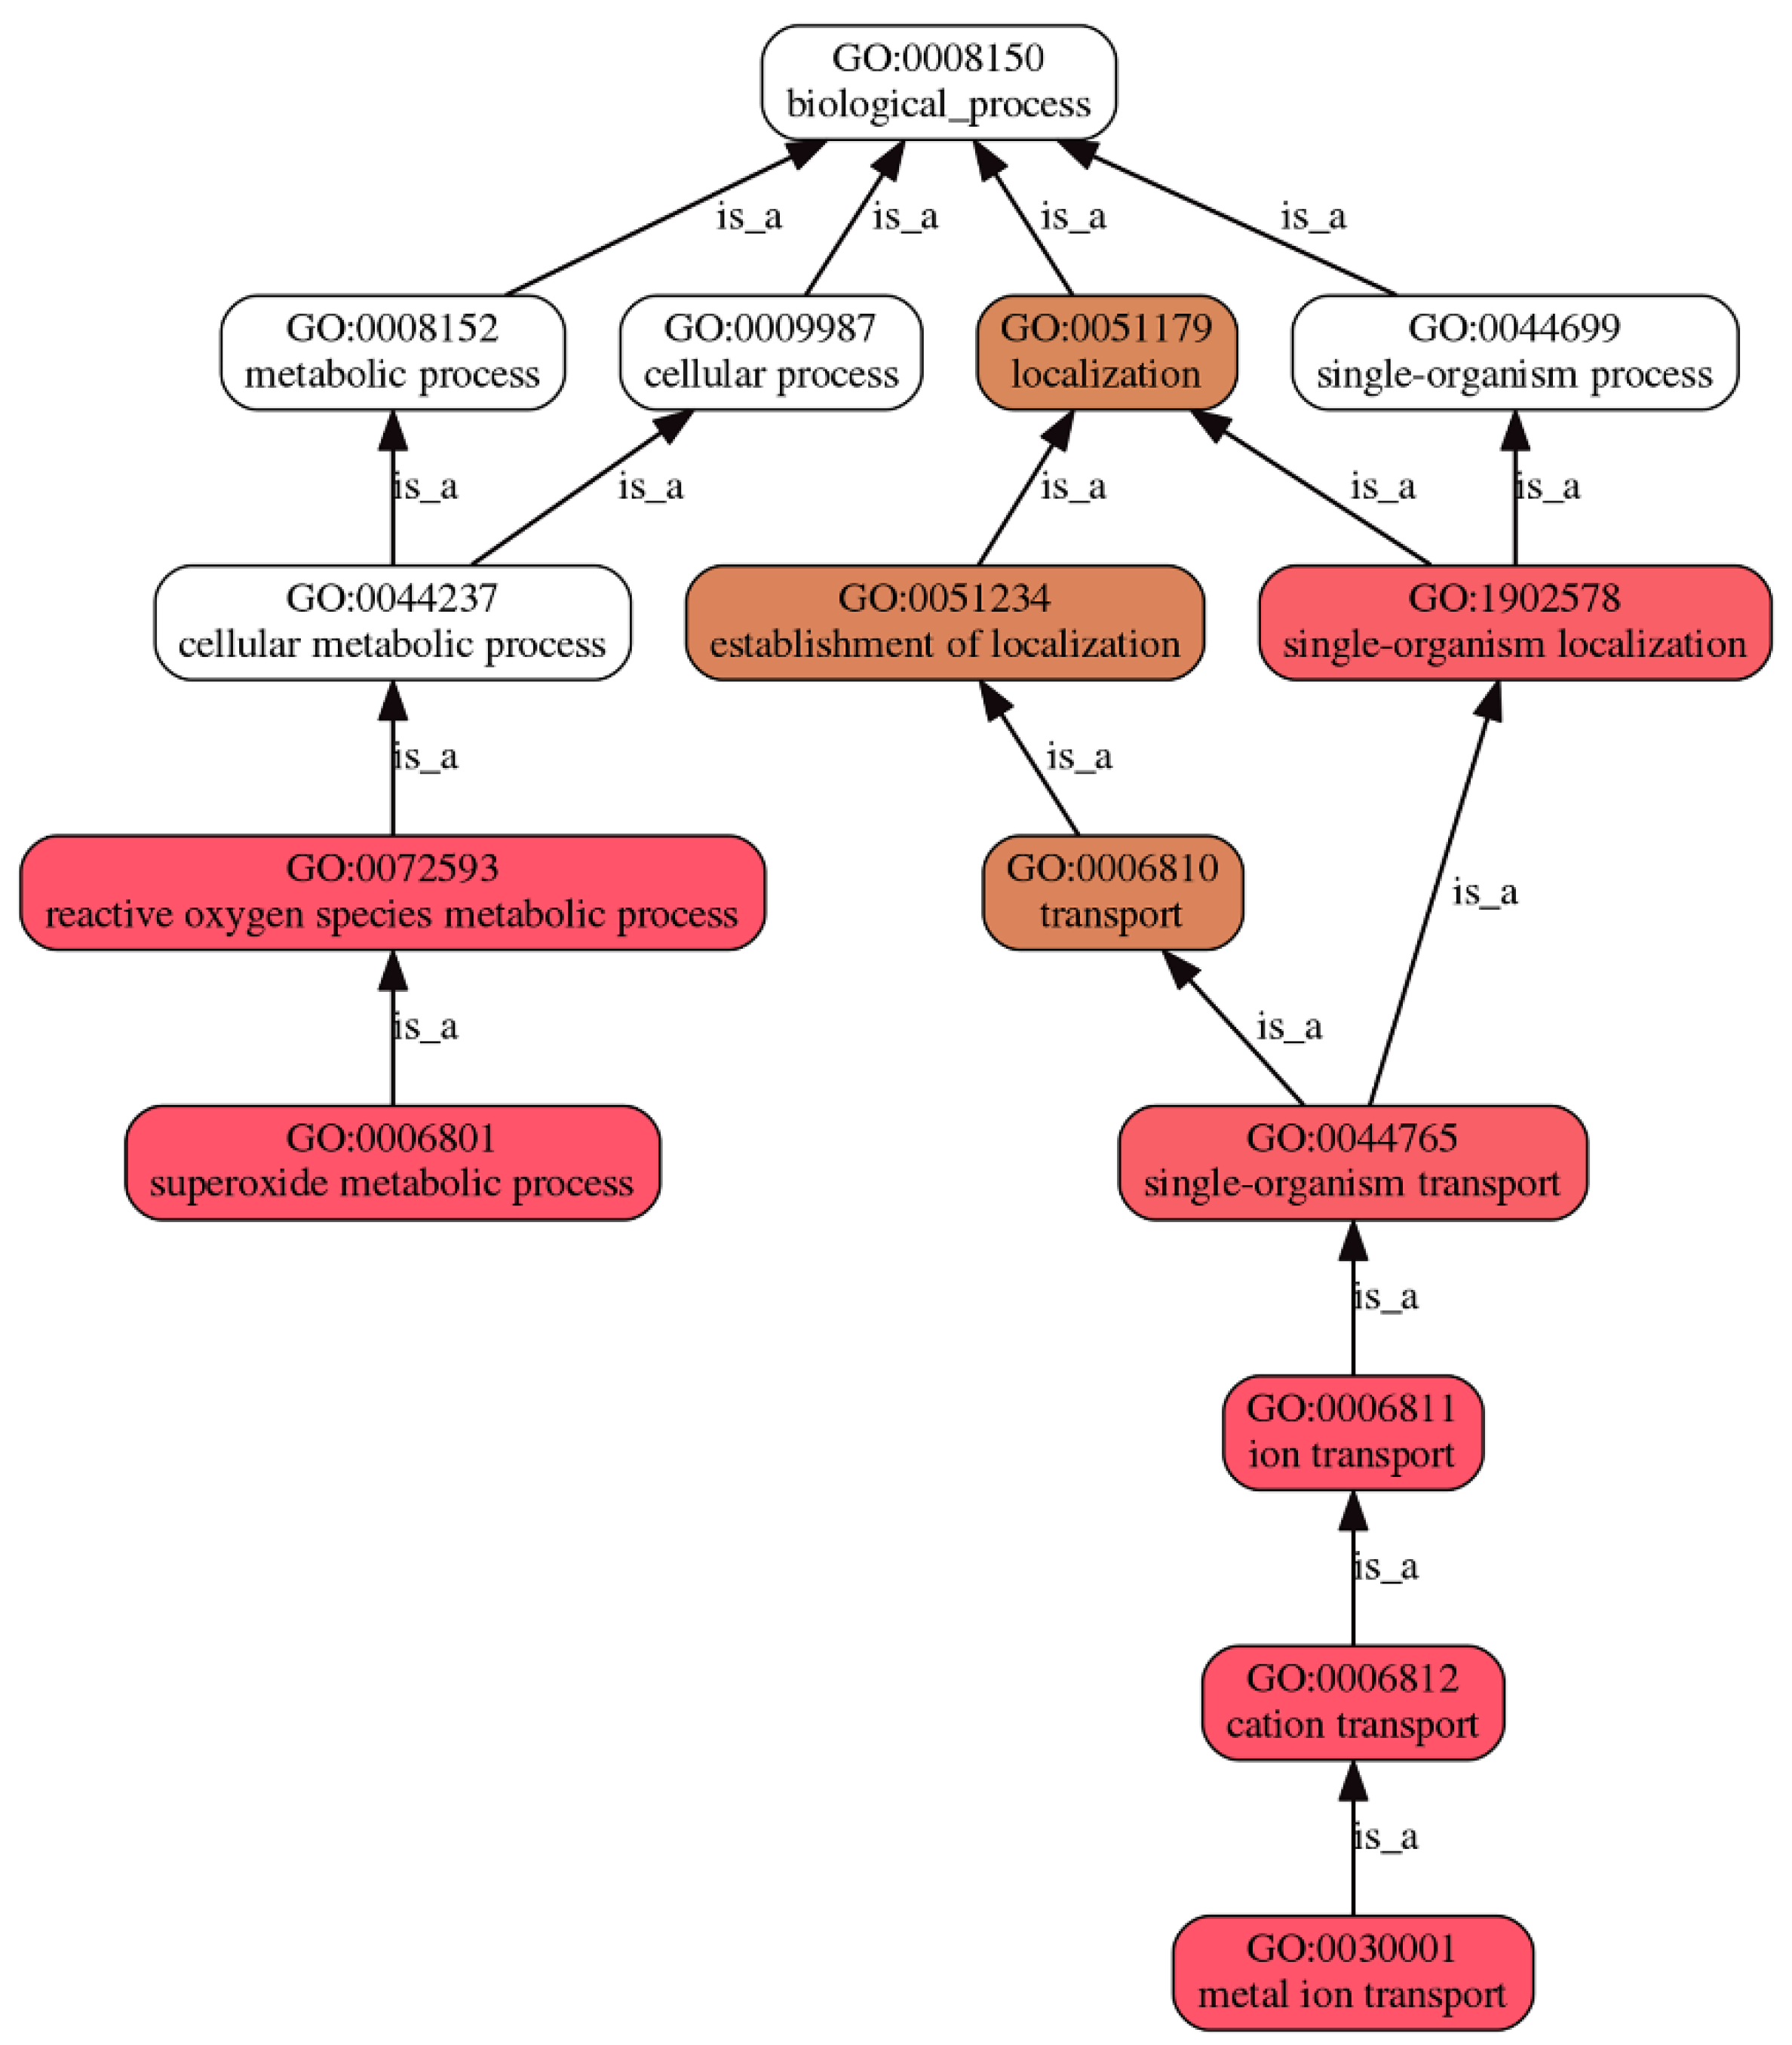
3.4.3. GO Enrichment Analyses

GO-based enrichment analysis showed the biological functions of the patterns up- or down-regulated by treatment with trypsin. The top 10 significantly enriched GO terms in the two expression patterns are shown in Table 1 (p-value < 0.01). The up-regulated pattern was enriched with GO terms of superoxide metabolic process (GO:0006801), metal ion transport (GO:0030001), superoxide dismutase activity (GO:0004784) and oxidoreductase activity, acting on superoxide radicals as acceptor (GO: 0016721). On the other hand, besides GO: 0004784 and GO:0016721, antioxidant activity (GO:0016209), oxidoreductase activity (GO:0016491), cellular response to UV-B (GO:0071493), or cellular response to ozone (GO:0071457), were down-regulated (Table 1, Table S4).
The pathways related to superoxide involved in trypsin regulation can be summarized in a DAG (Figure 2). For example, the GO biological process “superoxide metabolic process (GO:0006801)” is a child of one term: “reactive oxygen species metabolic process (GO:0072593)”. The GO biological process “metal ion transport (GO:0030001)” is a child of one term: “cation transport (GO:0006812)”. When the GO enrichment was analyzed separated by two patterns, more information exhibited. Cellular responses including to ozone (GO:0071457), to high light intensity (GO:0071486) or to UV-B (GO:0071493) were down-regulated (Figure S9). Besides “superoxide metabolic process (GO:0006801)”, “metal ion transport (GO:0030001)” was shown in up-regulated “biological process (GO:0008150)” of GO process (Figure S10). Furthermore, “superoxide dismutase activity (GO:0004784)”, and “metal ion binding (GO:0046872)” was shown in up-regulated “molecular function (GO:0003674)” of GO process (Figure S10).

3.4.4. KEGG Enrichment Analyses

Table 2 showed all of the KEGG pathway enrichment regulated by trypsin. No matter up- or down-regulated genes were enriched in the peroxisome pathway (map04146) (Figure S11). Protein export pathway (map03060) and homologous recombination (map03440) were up regulated (Figure S11A), while RNA transport (map03013) and ribosome biogenesis in eukaryotes (map03008) were down regulated (Figure S11B). The statistical significance of these pathways is listed in Table 2.

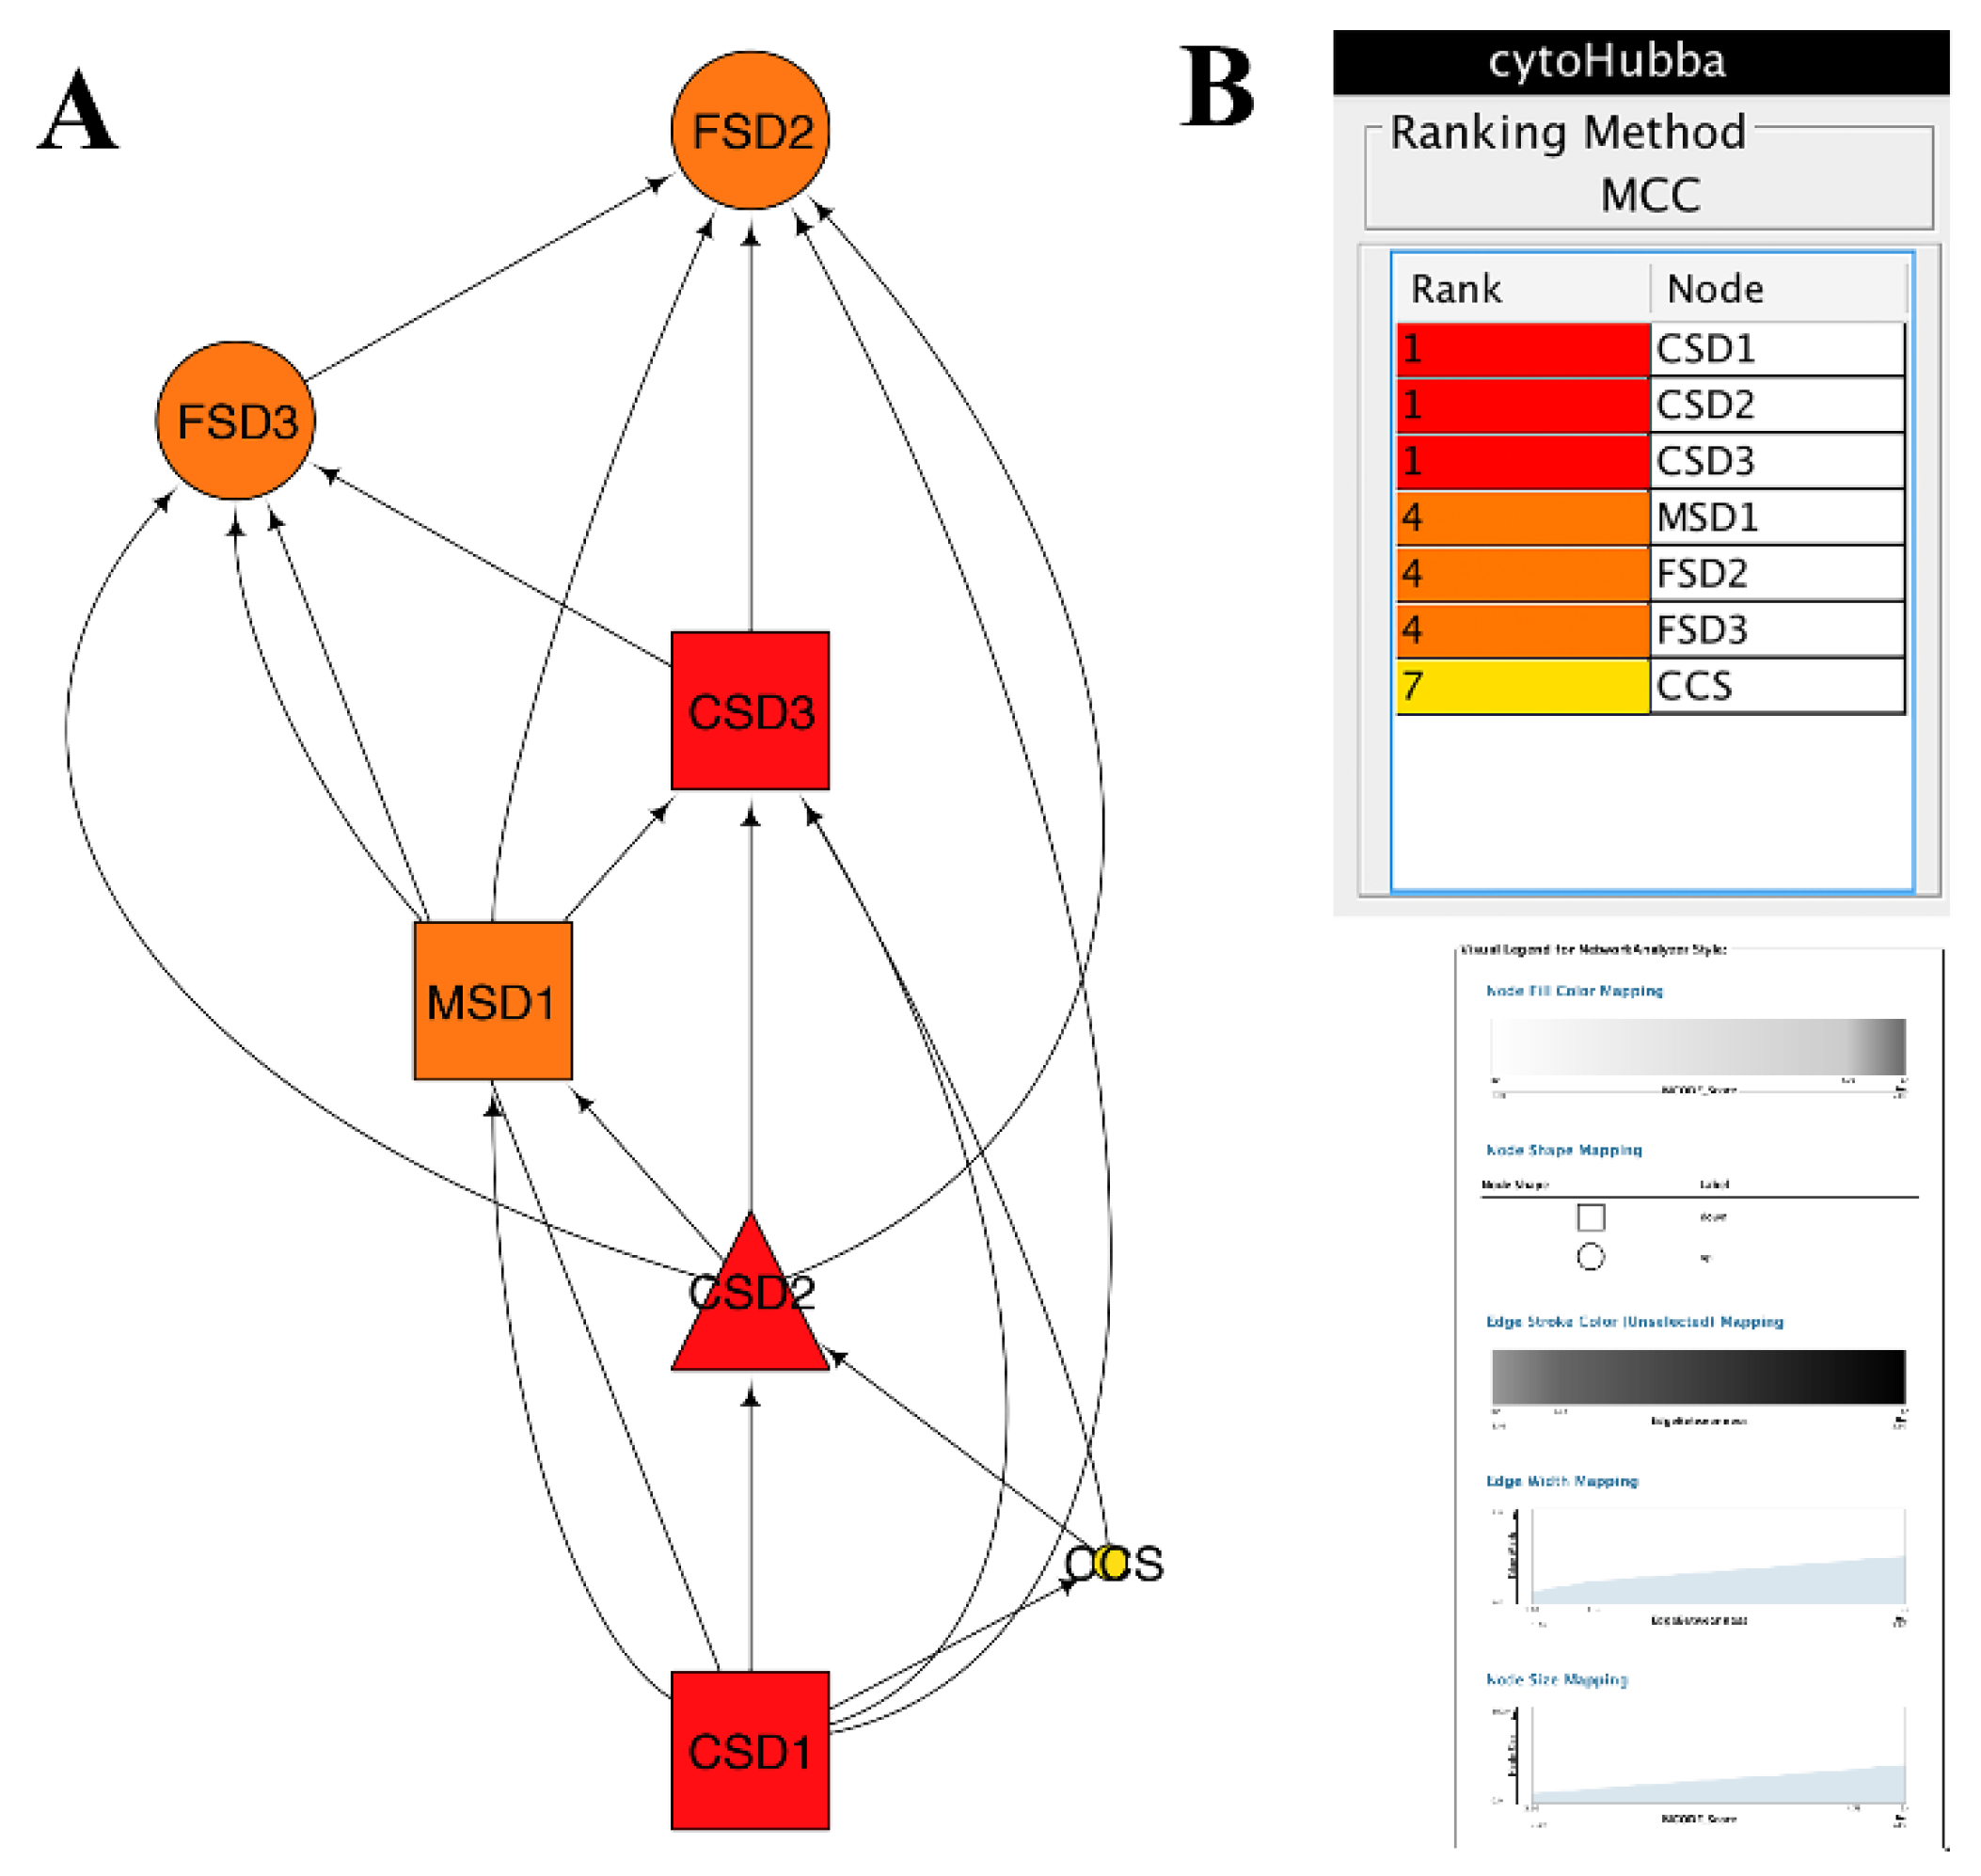
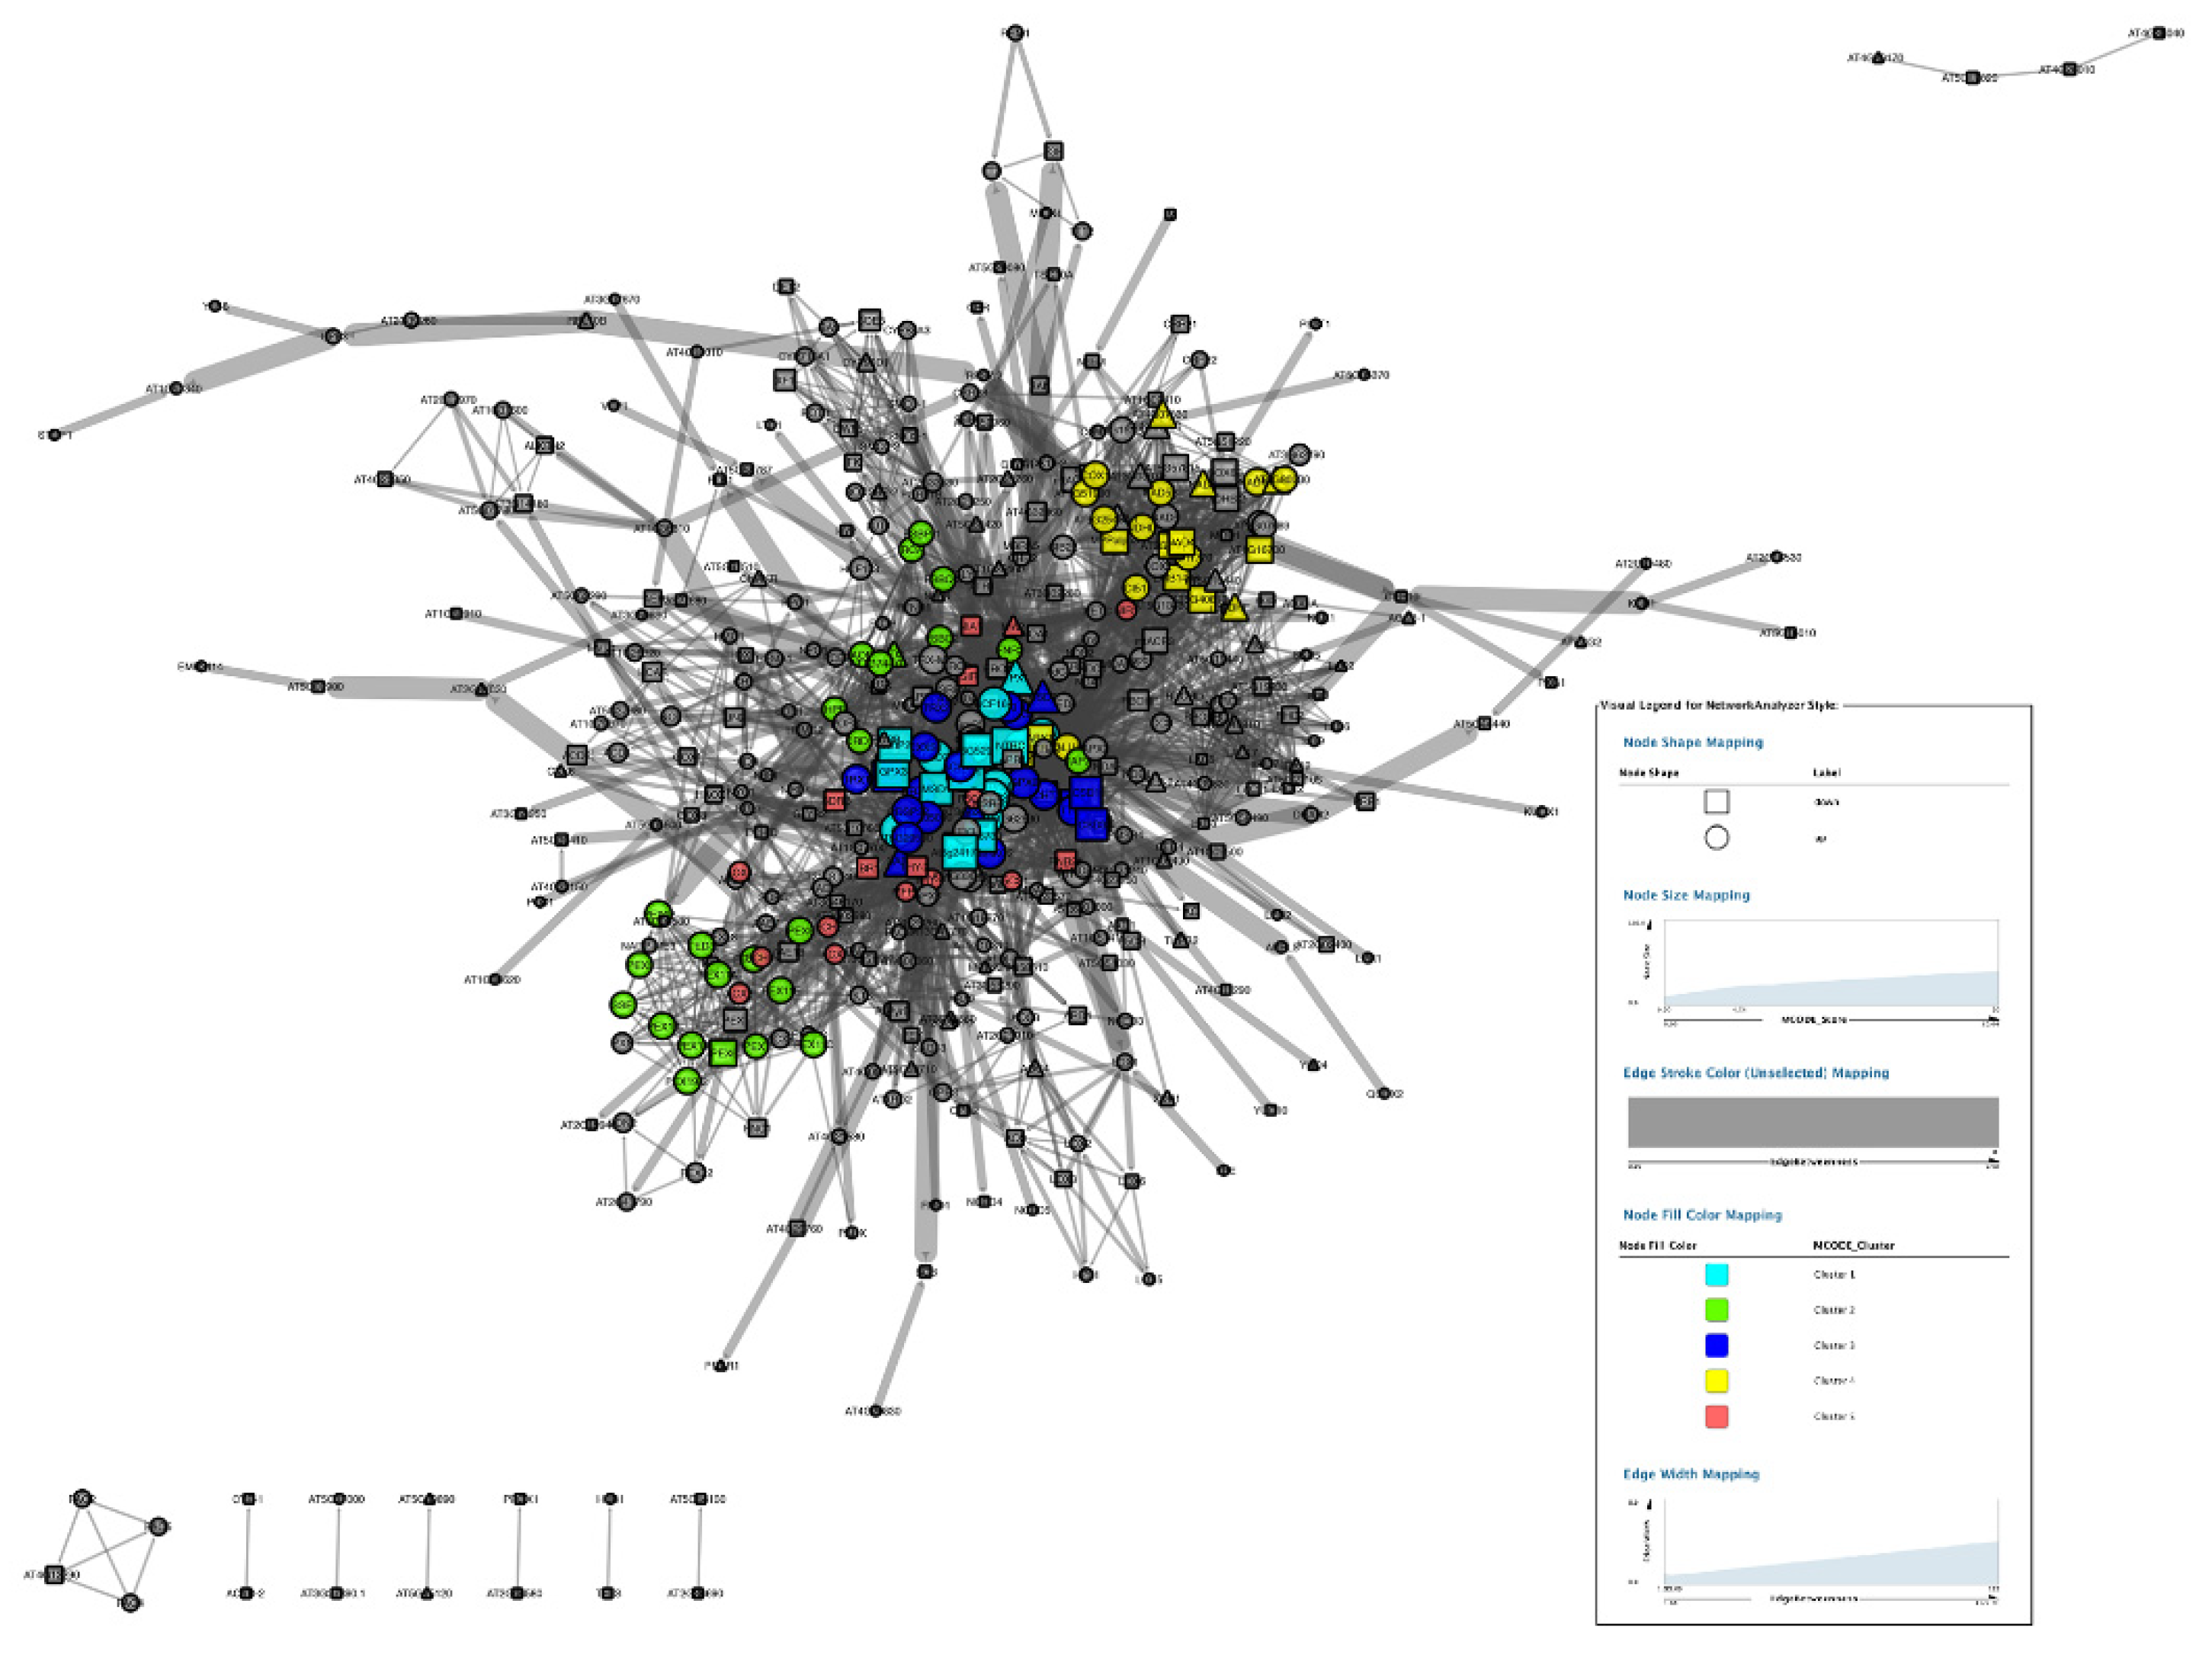
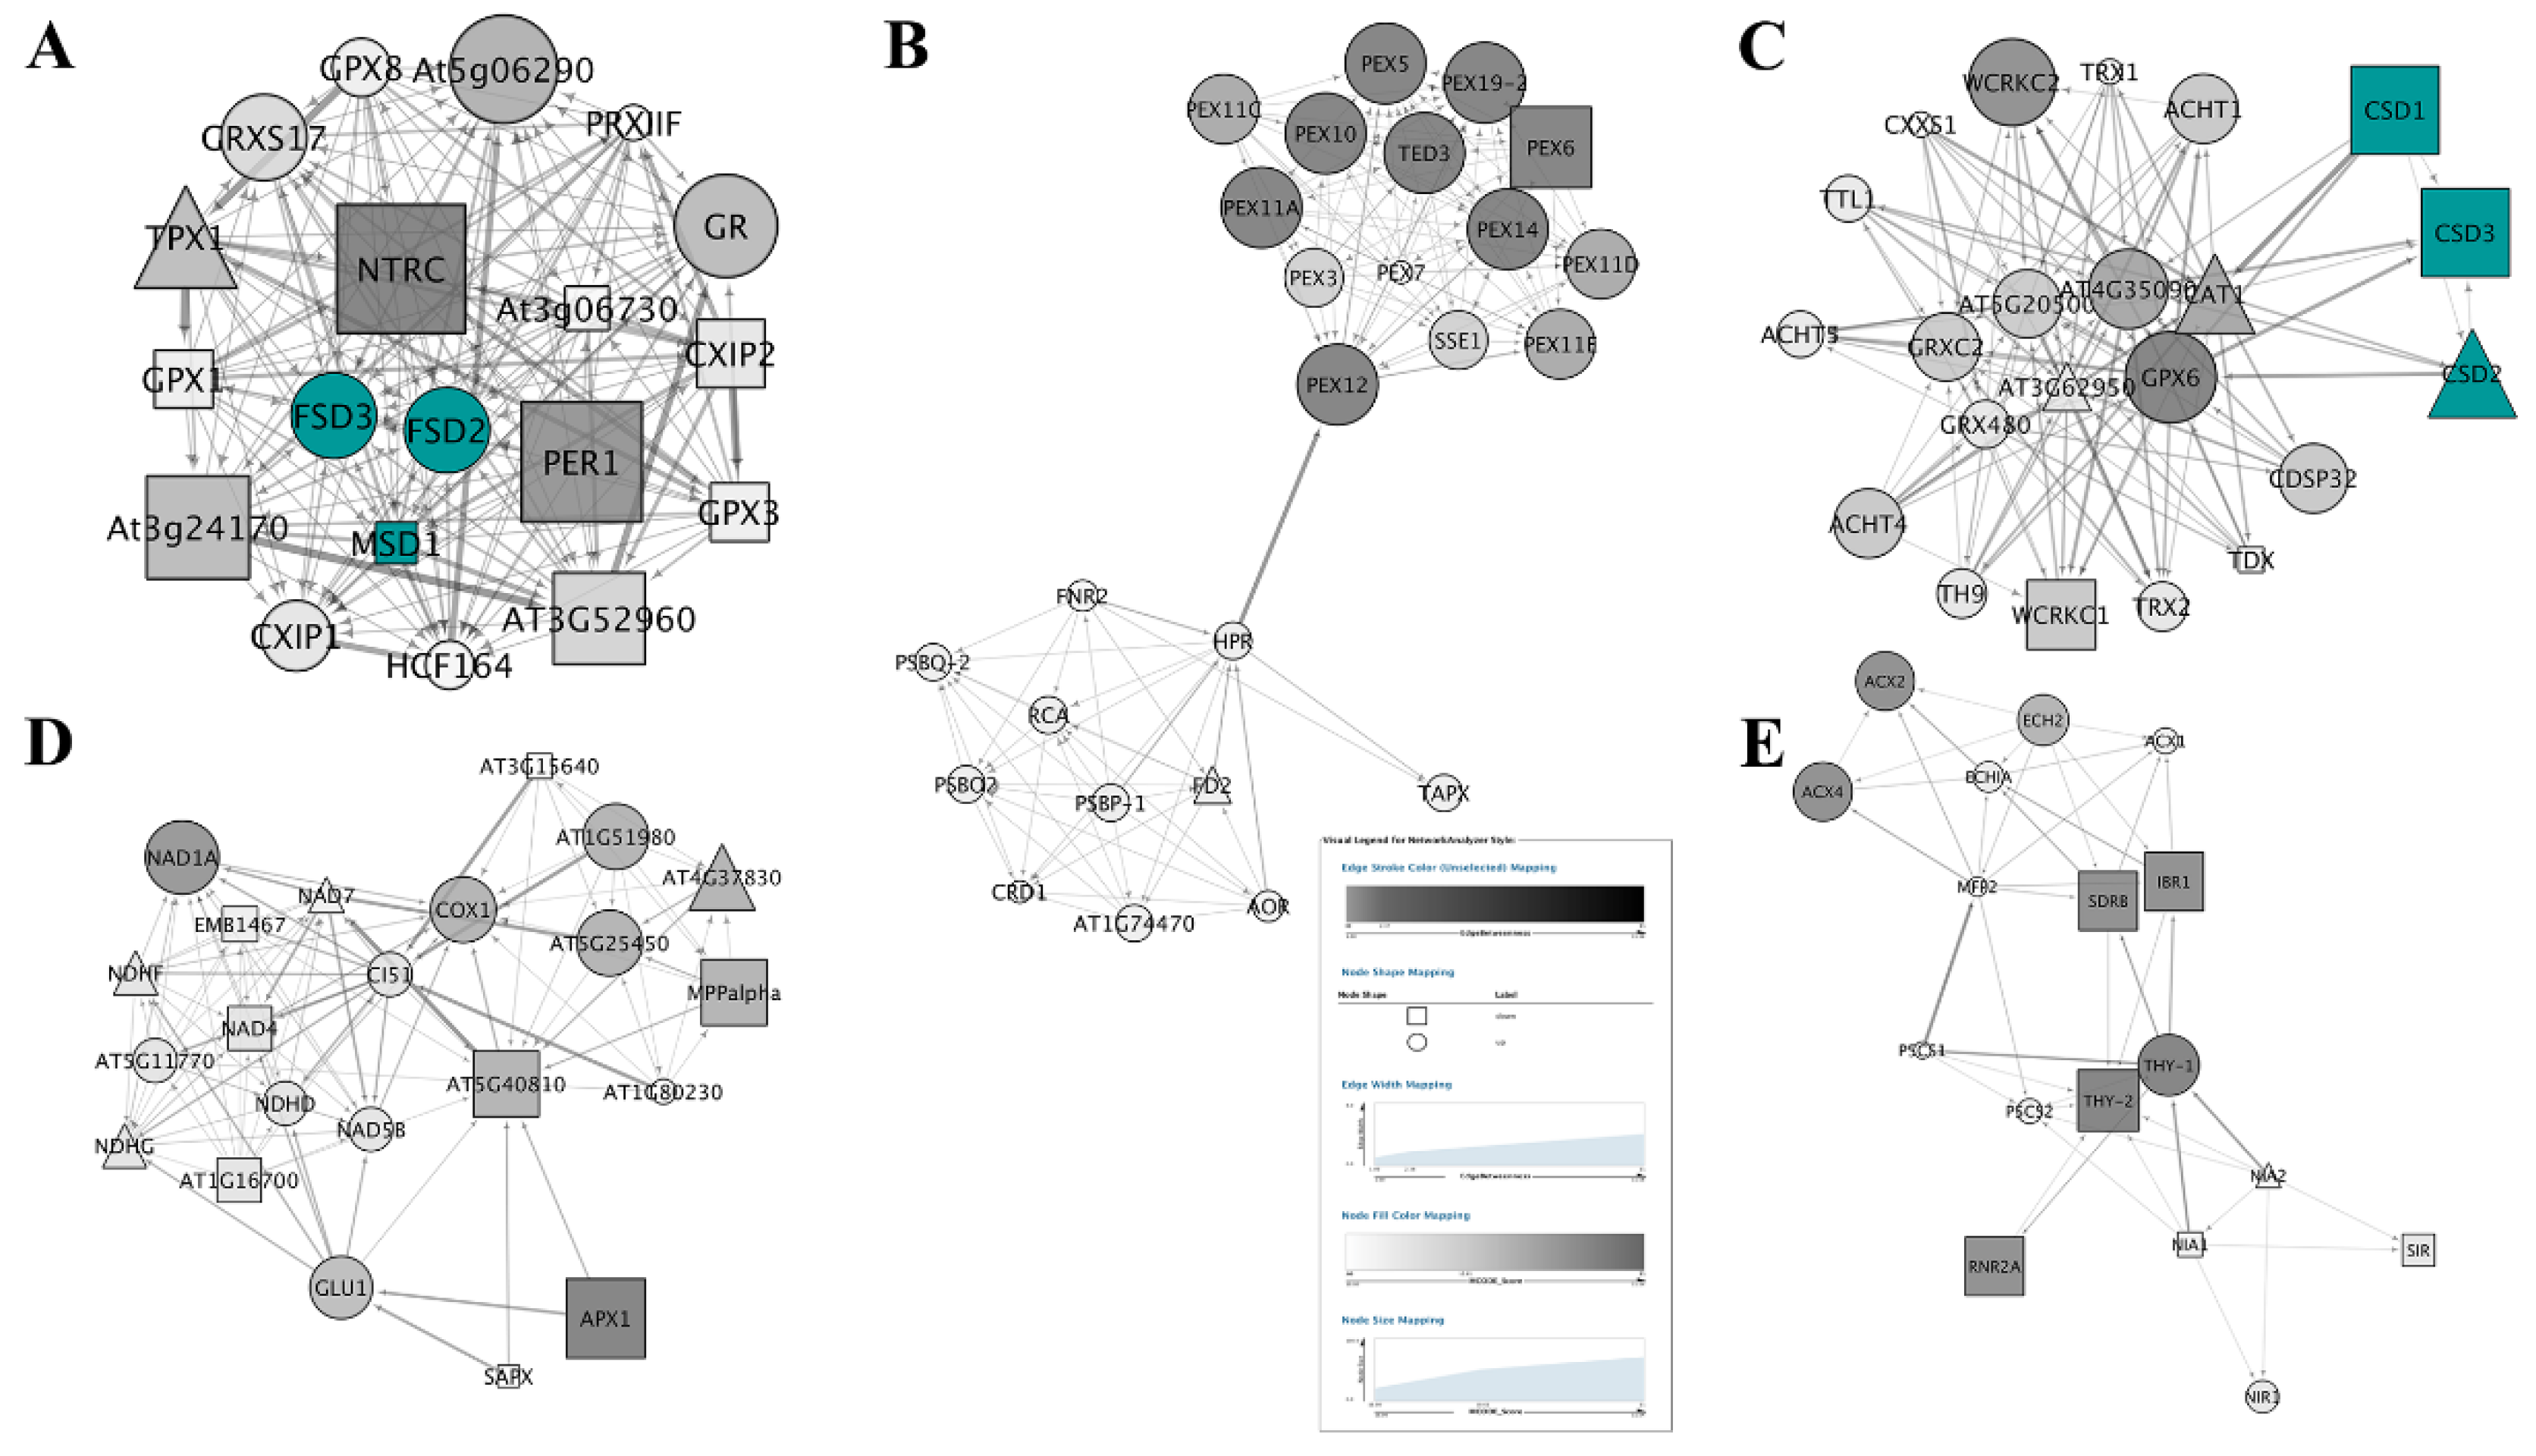
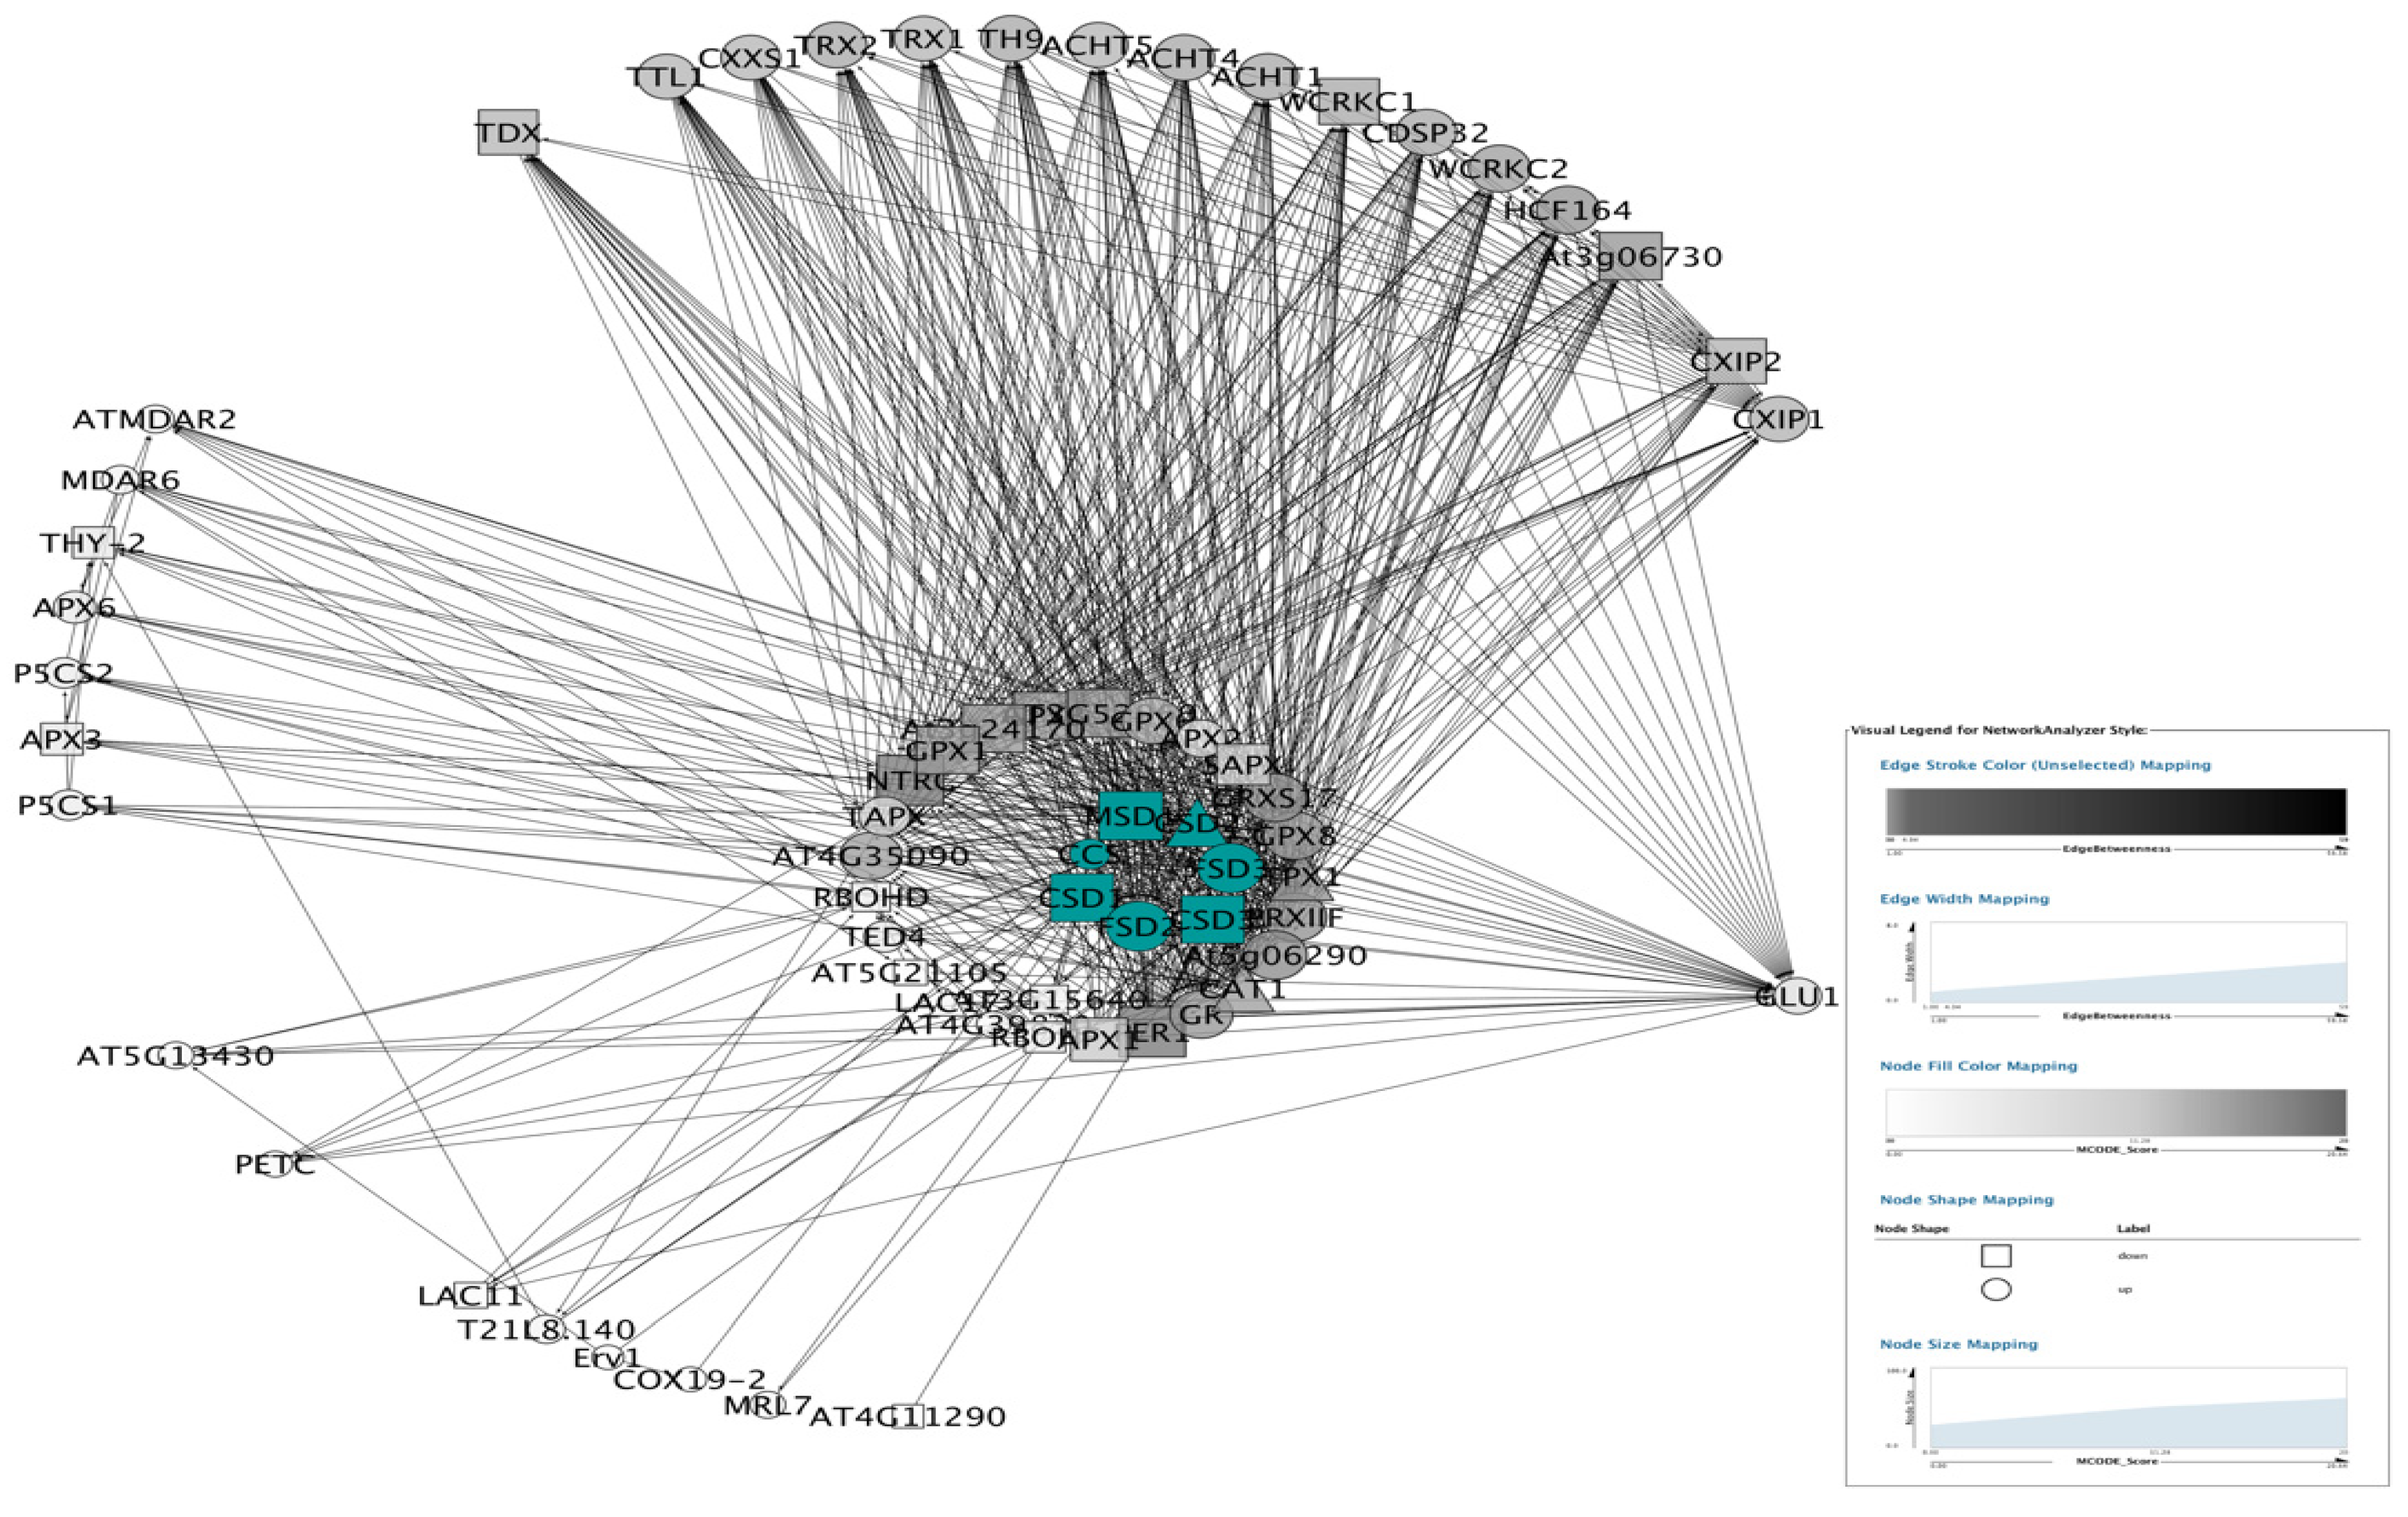
3.5. PPI Network Analysis

3.5.1. PPI Networks of SODs

Totally, we obtained 16 unigenes of SODs (four up- and five down-regulated, Table S1) involved in 1027 ROS related genes (FC > 0.8), including 432 up-regulated genes and 377 down-regulated genes (Table S5). Seven of the 16 SODs constructed a sub-network (Figure 3 and Table S6).
The PPI subnetwork of total ROS genes was composed of 447 nodes and the first 3000 edges (Figure 4 and Table S7). The cytoscape plugin MCODE was layered on and obtained 17 clusters (Table S8). Nodes belonging to the top five clusters were labeled by different colors (Figure 4). Among these, six of the SODs were highlighted by blue color in cluster 1 and cluster 3 of Figure 5. The CCS (copper chaperone for SOD) was not represented in the clusters of the whole ROS network.
The sub-network of the first neighbors of SODs were further screened from the PPI network of ROS (Figure 6). The first neighbors of SODs PPI sub-network contained 65 nodes and 693 edges, including 38 up-regulated and 23 down-regulated proteins (Table S9). Analyzed by MCODE, 23, 14, and 3 nodes were gathered in three clusters, respectively (Figure S12, and Tables S9 and S10). Six SODs were gathered in cluster1 of the SOD first neighbor sub-network (Figure S12A), and CCS was still absent (Figure S12B,C).
Furthermore, the sub-network of SODs was constructed on I-Sanger cloud platform and figured by cytoscape (Figure 3A). Two FSDs (Fe-SOD) were up-regulated, while two of three CSDs (Cu/Zn SOD) and MSD1 (Mn-SOD) were down-regulated. Based on 11 ranked methods including Maximal Clique Centrality (MCC), Density of Maximum Neighborhood Component (DMNC), Maximum Neighborhood Component (MNC), Degree, Closeness, Betweenness, Radiality, EcCentricity, Stress, Clustering Coefficient, EPC, and BottleNeck in cytoHubba, 7 SODs were ranked (Table S11). Results showed that seven SODs were ranked into three classes by most of these methods. Three CSDs were classified into the first class. Two FSDs and MSD1 were classified into the second class. CCS was classified as the last one (Figure 3B and Table S11).

3.5.2. Topological Properties of Networks.

The node degree distributions of the total ROS related genes network followed power law fit distributions (R2 = 0.816) (Figure S13A,B and Table 3). Other subnetwork topological parameters, such as clustering coefficient, and network density were shown in Table 3.
The correlation of the first neighbor of SODs sub-network was decreased to −0.006 (R2 = 0.000) with the decreasing of nodes (Figure S13C and Table 3). Although the seven SODs constructed a tiny sub-network, either the Clustering coefficient or the Network density was much higher (0.914 and 0.857, respectively) than that of the first neighbor of SODs sub-network (0.598 and 0.333, respectively) or even total ROS network (0.384 and 0.030, respectively). The correlation of the SODs sub-network was 0.924 (R2 = 0.936) (Figure S13D and Table 3).

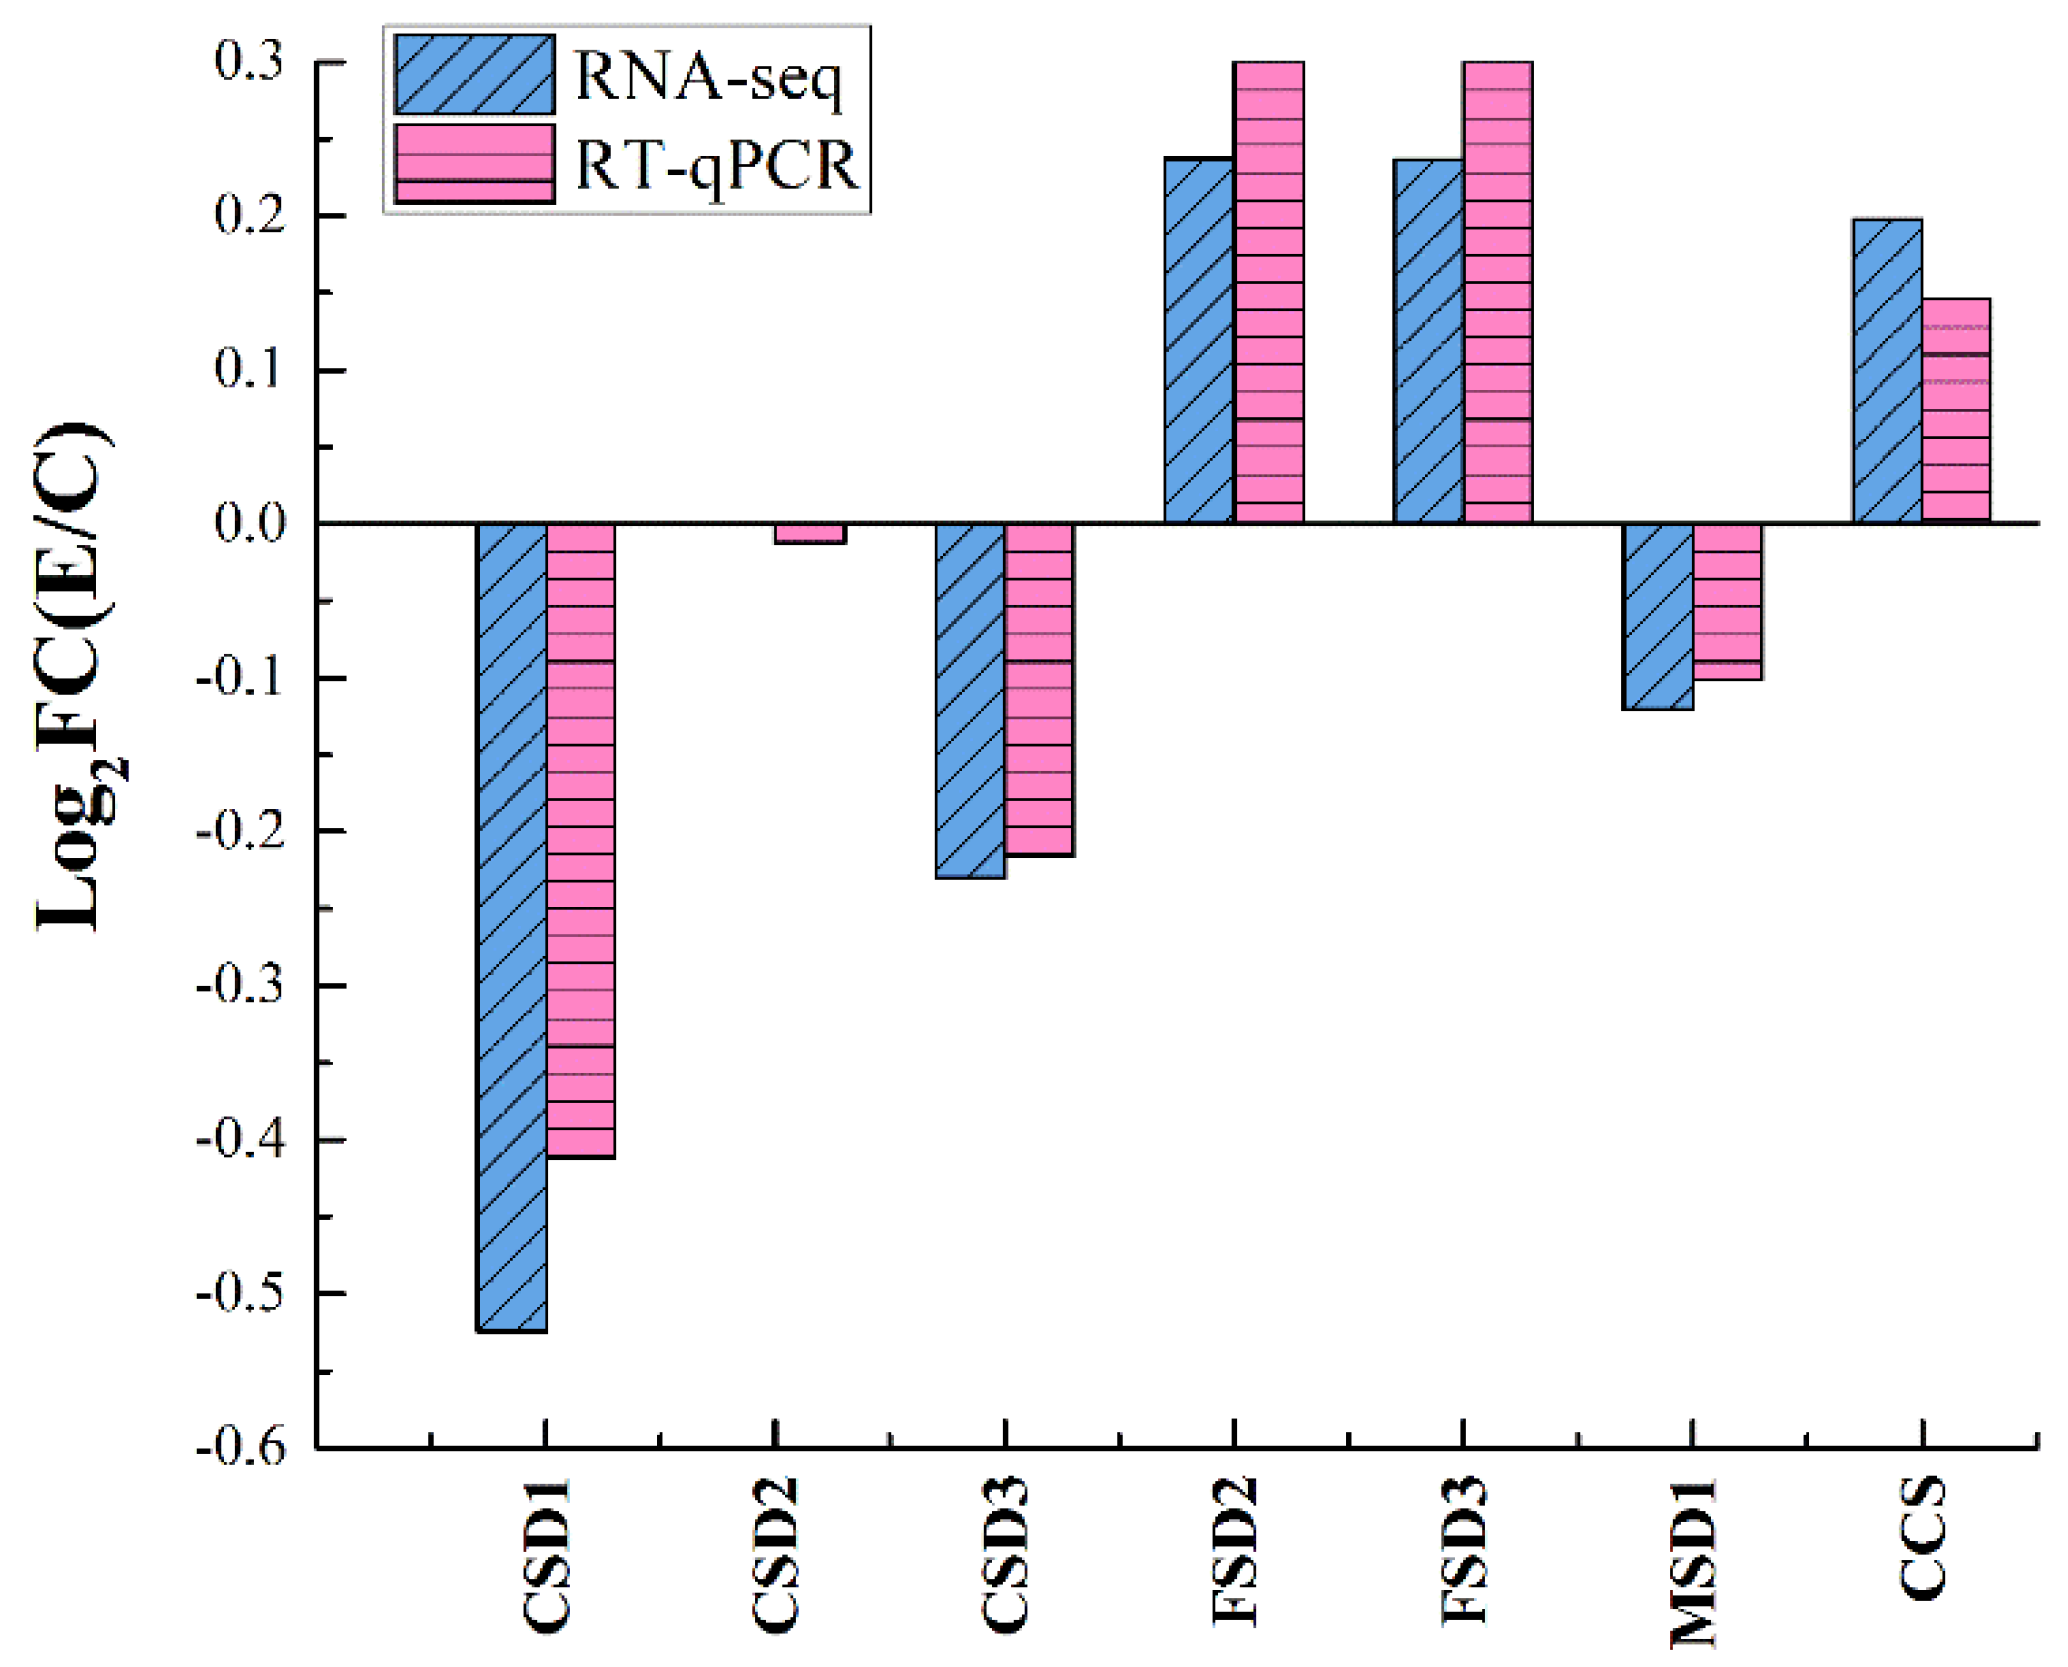
3.6. Accuracy of the RNA-Seq Data Verification by RT-qPCR

The changes of expression of seven SOD genes were checked by RT-qPCR (Figure 7). The full information of these seven SOD genes were shown in Tables S6 and S12.

4. Discussion

Trypsin significantly impede the loss of water, dehydration and improved fruit appearance quality. The level of malondialdehyde (MDA) is known to be an effective index for cell membrane lipid peroxidation [30]. Trypsin significantly decreased the MDA contents, leading to significantly reduced cell damage from lipid peroxidation.
During the course of maturity or decline of H. undatus, the accumulation of excess O2 and H2O2 can cause membrane damage [31,32]. As anticipated, either trypsin or chitosan inhibited the accumulation of ROS. The inhibition of trypsin, the novel superoxide scavenger, was entirely, especially on O2.
This study explored several intriguing questions about the effect of trypsin treatment on SOD mediated regulatory responses. How does trypsin perform ROS regulation? As a novel scavenger of O2, does trypsin impact the expression of SODs? Transcriptomic analysis was used to investigate the change in expression of SODs and identify the key SOD genes involved in ROS metabolism through trypsin treatment.
Showed by transcriptomic data, 16 superoxide related genes were screened, including four up-regulated genes and five down-regulated genes. The number of SOD unigenes are different in plants reported. For example, there are 7 SODS in Arabidopsis [33], 10 SODs in Cakile maritima [34], and 4 SODs in pepper [35]. A total of 29 and 18 SOD genes have been identified in Brassica juncea and Brassica rapa, respectively [36]. The evolutionary relationship study among plants need more works.
All of these 16 unigenes were mainly classified into three categories of GO, including BP, MF, and CC on level 2. The DAGs indicated that the superoxide metabolism and metal ion transport are key processes of SOD related regulatory mechanisms by trypsin during H. undatus storage. Important physiology metabolisms, such as antioxidant activities or metal ion transport, were induced, while defense responses were impeded by trypsin (Figures S9 and S10). The results of GO enrichment suggested that trypsin exhibited the protection of cell injury of H. undatus during storage.
In addition, the functional involvement of the pathways in the trypsin responsive patterns were shown by KEGG enrichment analyses. With trypsin treatment, different SODs in the peroxisome pathway were regulated by up or down patterns (Figure S11). Protein export pathway (map03060), homologous recombination (map03440), RNA transport (map03013) and Ribosome biogenesis in eukaryotes (map03008) were involved in the regulation of trypsin in H. undatus.
It is critical to explore the status of SODs in the entire ROS network. The cytoscape plugin “MCODE” was layered on the PPI of total ROS genes to illustrate the attribution of SODs in sub-networks. Seventeen clusters were obtained. The absence of CCS implies that it is a specific assistant protein of SOD and works independently.
To further investigate the mechanisms of SODs, the sub-network of the first neighbors of SODs were screened from the PPI network of ROS. Besides the 7 SODs, 58 proteins were involved as the first neighbors of SODs PPI sub-network (Figure 6 and Table S9). This PPI sub-network indicated that trypsin deeply interfered in the PPI network in H. undatus, as SODs interacted with lots of proteins to enlarge the biological effects as compared with the PPI of total ROS genes.
Finally, the DAG of 7 SODs indicated that CSDs acted as hubs, and either CSDs or MSD1 were down-regulated due to their synergistic effect with trypsin, which is also a Cu ion catalyzed superoxide scavenger. Overall, trypsin in combination with CSDs induced higher FSDs activities, cooperated by CCS and MSD1 (Figure 3A).
The fact that CSDs act as hub SODs or that the copper chaperone for SOD (CCS) closely interact with SODs, were strongly consisted with those in our previous reports where it was identified that Cu ion was involved in the mechanisms of trypsin by dynamical analysis using ProDy [8,37].
It is generally acknowledged that the scale-free network could be judged according to the node degree distribution of a PPI network [22,38]. The node degree distributions of the total ROS related genes network followed power law fit distributions. This indicated that the ROS PPI network is a true complex biological scale-free network.
Considering the sub-network of the first neighbors of SODs was constructed by all of the first neighbors of the SODs, the entire network exhibited high homogeneity. In addition, the 38 up-regulated (58.5%) and 23 down-regulated (35.4%) nodes in this sub-network indicated that nodes closer to the SODs were much more regulated by trypsin, compared with those elsewhere in the total ROS network (26.8% up- and 33.5% down-regulated). As anticipated, the correlation of the first neighbor of SODs sub-network was decreased to −0.006 (R2 = 0.000) with the decreasing of nodes (Figure S13C and Table 3). So, it was characterized as a non-scale-free network.
Although the seven SODs constructed a tiny sub-network, likely because of an eminent gradient difference across these seven nodes, either the clustering coefficient or the network density was much higher than that of the first neighbors of SODs sub-network or even the total ROS network. All of the above results indicated that the 3 CSDs were hubs of the SODs. Moreover, considering the networks constructed in the current study, it was suggested that the criterion of a scale-free network might not be dependent upon the number of nodes and that the biological networks are not always scale-free networks.
The accuracy of the RNA-Seq data was confirmed by RT-qPCR. Expression changes of seven SOD genes were consistent with the results of RNA-Seq.

5. Conclusions

The trypsin treatment significantly reduced the accumulation of endogenous ROS, including O2 and H2O2, impeded the cell injury, and improved the storage quality of H. undatus. Transcriptomic analysis identified seven SOD genes regulated by trypsin in H. undatus. Results revealed that important physiological metabolisms, such as antioxidant activities or metal ion transport, were induced, and defense responses were inhibited by trypsin. PPI network analysis suggested that the Cu/Zn SODs act as hub SODs synergized with trypsin, and induced higher FSDs activities, cooperated by CCS and MSD1 during storage of H. undatus. As a highly efficient, safe and economical antioxidant, trypsin might be used widely as a new bio-preservative.

Supplementary Materials

The following are available online at https://www.mdpi.com/2076-3921/9/2/162/s1, Figure S1: Sequences statistics of functional annotation of RNA-Seq data for each database. (A) Venn diagram; (B) Number of transcripts or unigenes annotated in databases; (C) Size of each list. Figure S2: Venn diagram representation of upregulated, downregulated, and all of the SOD genes identified in H. undatus. Figure S3: Bar chart of three categories of GO classification of unigenes. Figure S4: KEGG pathway of map04146. Figure S5: KEGG pathway of map03440. Figure S6: KEGG pathway of map03060. Figure S7: KEGG pathway of map03008. Figure S8: KEGG pathway of map03013. Figure S9: Relationships between GO terms of down-regulated SODs in a Directed Acyclic Graph (DAG). Figure S10: Relationships between GO terms of up-regulated SODs in a Directed Acyclic Graph (DAG). Figure S11: Histogram of KEGG terms associated with trypsin. Figure S12: Top 3 clusters of the first neighbors of SODs PPI sub-network calculated by MCODE. A-C represents cluster 1-3, respectively. SODs were colored in A. Figure S13: Power law distribution of node degree. (A and B) Degree distribution of the total ROS PPI network showed as scatter or line chart, respectively; (C) Degree distribution of the sub-network of the first neighbor of SODs; (D) Degree distribution of the sub-network of the 7 SODs. Table S1: Full list of SOD genes in each pattern after treatment with trypsin. Table S2: GO terms of SODs by trypsin. Table S3: KEGG terms associated with trypsin. Table S4: Num of unigenes in GO enrichment. Table S5: Information of 1027 unigenes related to ROS. Table S6: Information of 7 SOD unigenes. Table S7: PPI network parameters of ROS related genes by cytoscape. Table S8: Clusters of PPI network of ROS related genes by MCODE. Table S9: PPI network parameters of the first neighbors of SODs by cytoscape. Table S10: Clusters of PPI network of the first neighbors of SODs by MCODE. Table S11: Nodes in SOD sub-network ranked by 11 methods of MCC, degree, closeness, betweenness, etc. Table S12: Primer sequences used in RT-qPCR.

Author Contributions

X.L. (Xin Li), and X.P. conceived the projects; X.L. (Xinling Li) and X.L. (Xueru Liu) designed and executed the experiments; L.C. and B.L. contributed expertise in H. undatus system; X.L. (Xueru Liu) detected the activities of enzymes; X.P., and X.L. (Xueru Liu) detected the browning indexes and analyzed the data. All authors discussed the results. X.L. (Xin Li) and X.P. co-wrote the paper. All authors have read and agreed to the published version of the manuscript.

Funding

This work was supported by the National Key R&D Program of China (2017YFC1600802).

Acknowledgments

We are grateful for the free online platform of Majorbio I-Sanger Cloud Platform (www.i-sanger.com). We would also like to thank English Editing by Elsevier Language Editing Services (Registration No. 331566771).

Conflicts of Interest

The authors declare no conflict of interest.

Availability of Data and Materials

Raw sequence data from this study have been submitted to the NCBI sequence read archive under the BioProject accession [PRJNA509494] and available at the following link: https://trace.ncbi.nlm.nih.gov/Traces/sra_sub/sub.cgi?acc=SRP173572.

References

  1. Fan, Q.J.; Yan, F.X.; Qiao, G.; Zhang, B.X.; Wen, X.P. Identification of differentially-expressed genes potentially implicated in drought response in pitaya (Hylocereus undatus) by suppression subtractive hybridization and cDNA microarray analysis. Gene 2014, 533, 322–331. [Google Scholar] [CrossRef] [PubMed]
  2. Hua, Q.Z.; Chen, C.J.; Chen, Z.; Chen, P.K.; Ma, Y.W.; Wu, J.Y.; Zheng, J.; Hu, G.B.; Zhao, J.T.; Qin, Y.H. Transcriptomic analysis reveals key genes related to betalain biosynthesis in pulp coloration of Hylocereus polyrhizus. Front. Plant Sci. 2016, 6, 1179. [Google Scholar] [CrossRef] [Green Version]
  3. Freitas, S.T.D.; Mitcham, E.J. Quality of pitaya fruit (Hylocereus undatus) as influenced by storage temperature and packaging. Sci. Agric. 2013, 70, 257–262. [Google Scholar] [CrossRef] [Green Version]
  4. Yang, Z.Q.; Zhong, X.M.; Fan, Y.; Wang, H.C.; Li, J.G.; Huang, X.M. Burst of reactive oxygen species in pedicel-mediated fruit abscission after carbohydrate supply was cut off in longan (Dimocarpus longan). Front. Plant Sci. 2015, 6, 360. [Google Scholar] [CrossRef] [PubMed] [Green Version]
  5. Lu, Z.; Sethu, R.; Imlay, J.A. Endogenous superoxide is a key effector of the oxygen sensitivity of a model obligate anaerobe. Proc. Natl. Acad. Sci. USA 2018, 115, E3266–E3275. [Google Scholar] [CrossRef] [Green Version]
  6. Río, L.A.; Corpas, F.J.; López-Huertas, E.; Palma, J.M. Plant superoxide dismutases: Function under abiotic stress conditions. In Antioxidants and Antioxidant Enzymes in Higher Plants; Springer International Publishing: Cham, Switzerland, 2018; pp. 1–26. [Google Scholar] [CrossRef]
  7. Lin, Y.F.; Lin, Y.X.; Lin, H.T.; Zhang, S.; Chen, Y.H.; Shi, J. Inhibitory effects of propyl gallate on browning and its relationship to active oxygen metabolism in pericarp of harvested longan fruit. LWT Food Sci. Technol. 2015, 60, 1122–1128. [Google Scholar] [CrossRef]
  8. Li, Q.; Wei, Q.Y.; Yuan, E.D.; Yang, J.G.; Ning, Z.X. Interaction between four flavonoids and trypsin: Effect on the characteristics of trypsin and antioxidant activity of flavonoids. Int. J. Food Sci. Technol. 2014, 49, 1063–1069. [Google Scholar] [CrossRef]
  9. Li, X.; Tang, Z.C.; Zhao, C.Y.; Pang, X.Y.; Li, X.L.; Liu, Y.H. Trypsin slows the ageing of mice due to its novel superoxide scavenging activity. Appl. Biochem. Biotech. 2017, 181, 1–12. [Google Scholar] [CrossRef]
  10. Xia, C.J.; Li, S.F.; Hou, W.Y.; Fan, Z.F.; Xiao, H.; Lu, M.G.; Sano, T.; Zhang, Z.X. Global transcriptomic changes induced by infection of cucumber (Cucumis sativus L.) with mild and severe variants of hop stunt viroid. Front. Microbiol. 2017, 8, 2427. [Google Scholar] [CrossRef] [Green Version]
  11. Yu, X.J.; Chen, H.; Huang, C.Y.; Zhu, X.Y.; Wang, D.S.; Liu, X.Y.; Sun, J.; Zheng, J.Y.; Li, H.J.; Wang, Z.; et al. Transcriptomic mechanism of a phytohormone 6-benzylaminopurine (6-BAP) stimulating lipid and DHA synthesis in Aurantiochytrium sp. J. Agric. Food Chem. 2019, 67, 19. [Google Scholar] [CrossRef]
  12. Xu, M.; Liu, C.L.; Luo, J.; Qi, Z.; Yan, Z.; Fu, Y.; Wei, S.S.; Tang, H. Transcriptomic de novo analysis of pitaya (Hylocereus polyrhizus) canker disease caused by Neoscytalidium dimidiatum. BMC Genomics 2019, 20, 10. [Google Scholar] [CrossRef]
  13. Zheng, Y.; Wang, Y.; Ding, B.; Fei, Z.J. Comprehensive transcriptome analyses reveal that potato spindle tuber viroid triggers genome-wide changes in alternative splicing, inducible trans-acting activity of phasiRNAs and immune responses. J. Virol. 2017, 91, e00247-17. [Google Scholar] [CrossRef] [PubMed] [Green Version]
  14. Li, X.; Liu, X.R.; Yin, Y.; Yu, H.C.; Zhang, M.; Jing, H.N.; Ma, Y.C.; Xiong, X.L.; Pang, X.Y. Transcriptomic analysis reveals key genes related to antioxidant mechanisms of Hylocereus undatus quality improving by trypsin during storage. Food Funct. 2019, 10, 8116–8128. [Google Scholar] [CrossRef] [PubMed]
  15. Azodi, M.Z.; Peyvandi, H.; Rostami-Nejad, M.; Safaei, A.; Rostami, K.; Vafaee, R.; Heidari, M.; Hosseini, M.; Zali, M.R. Protein-protein interaction network of celiac disease. Gastroenterol. Hepatol. Bed Bench 2016, 9, 268–277. [Google Scholar]
  16. Chin, C.H.; Chen, S.H.; Wu, H.H.; Ho, C.W.; Ko, M.T.; Lin, C.Y. cytoHubba: Identifying hub objects and sub-networks from complex interactome. BMC Syst. Biol. 2014, 8, S11. [Google Scholar] [CrossRef] [Green Version]
  17. Zhang, H.Y.; He, P.; Kang, H.B.; Li, X.L. Antioxidant and antimicrobial effects of edible coating based on chitosan and bamboo vinegar in ready to cook pork chops. LWT Food Sci. Technol. 2018, 93, 470–476. [Google Scholar] [CrossRef]
  18. Hu, Y.S.; Pan, Z.H.; Hu, Y.; Zhang, L.; Wang, J. Network and Pathway-Based Analyses of Genes Associated with Parkinson’s Disease. Mol. Neurobiol. 2017, 54, 4452–4465. [Google Scholar] [CrossRef]
  19. Liu, Y.H.; Sun, Y.; Yu, H.C.; Yin, Y.; Li, X.; Duan, X. Hot air drying of purple-fleshed sweet potato with contact ultrasound assistance. Dry. Technol. 2017, 35, 564–576. [Google Scholar] [CrossRef]
  20. Candar-Cakir, B.; Arican, E.; Zhang, B.H. Small RNA and degradome deep sequencing reveals drought-and tissue-specific micrornas and their important roles in drought-sensitive and drought-tolerant tomato genotypes. Plant Biotechnol. J. 2016, 14, 1727–1746. [Google Scholar] [CrossRef] [Green Version]
  21. Yang, A.M.; Yu, L.; Chen, Z.; Zhang, S.X.; Shi, J.; Zhao, X.Z.; Yang, Y.Y.; Hu, D.Y.; Song, B.A. Label-free quantitative proteomic analysis of chitosan oligosaccharide-treated rice infected with southern rice black-streaked dwarf virus. Viruses 2017, 9, 115. [Google Scholar] [CrossRef]
  22. Wu, B.L.; Xie, J.J.; Du, Z.P.; Wu, J.Y.; Zhang, P.X.; Xu, L.Y.; Li, E.M. PPI network analysis of mRNA expression profile of Ezrin knockdown in esophageal squamous cell carcinoma. BioMed Res. Int. 2014, 2014, 10. [Google Scholar] [CrossRef] [PubMed]
  23. Wu, B.L.; Li, C.Q.; Zhang, P.X.; Yao, Q.L.; Wu, J.Y.; Han, J.W.; Liao, L.D.; Xu, Y.J.; Lin, R.J.; Xiao, D.W.; et al. Dissection of miRNA-miRNA interaction in esophageal squamous cell carcinoma. PLoS ONE 2013, 8, e73191. [Google Scholar] [CrossRef] [Green Version]
  24. Vig, S.; Talwar, P.; Kaur, K.; Srivastava, R.; Srivastava, A.K.; Datta, M. Transcriptome profiling identifies p53 as a key player during calreticulin deficiency: Implications in lipid accumulation. Cell Cycle 2015, 14, 2274–2284. [Google Scholar] [CrossRef] [PubMed] [Green Version]
  25. Li, Y.; Cai, Z.H.; Zhu, B.A.; Xu, C.S. Identification of Key Pathways and Genes in the Dynamic Progression of HCC Based on WGCNA. Genes 2018, 9, 92. [Google Scholar] [CrossRef] [Green Version]
  26. Huang, H.J.; Luo, B.B.; Wang, B.Q.; Wu, Q.W.; Liang, Y.M.; He, Y. Identification of potential gene interactions in heart failure caused by idiopathic dilated cardiomyopathy. Med. Sci. Monit. 2018, 24, 7697–7709. [Google Scholar] [CrossRef]
  27. Zhou, Q.; Ma, C.; Cheng, S.C.; Wei, B.D.; Liu, X.Y.; Ji, S.J. Changes in antioxidative metabolism accompanying pitting development in stored blueberry fruit. Postharvest Biol. Technol. 2014, 88, 88–95. [Google Scholar] [CrossRef]
  28. Schneider, K.; Schlegel, H.G. Production of superoxide radicals by soluble hydrogenase from Alcaligenes eutrophus H16. Biochem. J. 1981, 193, 99–107. [Google Scholar] [CrossRef] [Green Version]
  29. Li, X.; Imlay, J.A. Improved measurements of scant hydrogen peroxide enable experiments that define its threshold of toxicity for Escherichia coli. Free Radic. Biol. Med. 2018, 120, 217–222. [Google Scholar] [CrossRef]
  30. Ren, Y.L.; Wang, Y.F.; Bi, Y. Postharvest BTH treatment induced disease resistance and enhanced reactive oxygen species metabolism in muskmelon (Cucumis melo L.) fruit. Eur. Food Res. Technol. 2012, 234, 963–971. [Google Scholar] [CrossRef]
  31. Duan, X.W.; Liu, T.; Zhang, D.D.; Su, X.G.; Lin, H.T.; Jiang, Y.M. Effect of pure oxygen atmosphere on antioxidant enzyme and antioxidant activity of harvested litchi fruit during storage. Food Res. Int. 2011, 44, 1905–1911. [Google Scholar] [CrossRef]
  32. Xi, H.H.; Liu, Y.H.; Guo, L.G.; Hu, R.R. Effect of ultrasonic power on drying process and quality properties of far-infrared radiation drying on potato slices. Food Sci. Biotechnol. 2020, 29, 93–101. [Google Scholar] [CrossRef] [PubMed]
  33. Kliebenstein, D.J.; Monde, R.A.; Last, R.L. Superoxide dismutase in Arabidopsis: An eclectic enzyme family with disparate regulation and protein localization. Plant Physiol. 1998, 118, 637–650. [Google Scholar] [CrossRef] [PubMed] [Green Version]
  34. Houmani, H.; Rodríguez-Ruiz, M.; Palma, J.M.; Abdelly, C.; Corpas, F.J. Modulation of superoxide dismutase (SOD) isozymes by organ development and high long-term salinity in the halophyte Cakile maritima. Protoplasma 2016, 253, 885–894. [Google Scholar] [CrossRef] [PubMed]
  35. Mateos, R.M.; Jiménez, A.; Román, P.; Romojaro, F.; Bacarizo, S.; Leterrier, M.; Gómez, M.; Sevilla, F.; Del Río, L.A.; Corpas, F.J.; et al. Antioxidant Systems from Pepper (Capsicum annuum L.): Involvement in the response to temperature changes in ripe fruits. Int. J. Mol. Sci. 2013, 14, 9556–9580. [Google Scholar] [CrossRef] [Green Version]
  36. Verma, D.; Lakhanpal, N.; Singh, K. Genome-wide identification and characterization of abiotic-stress responsive SOD (superoxide dismutase) gene family in Brassica juncea and B. rapa. BMC Genomics 2019, 20, 227. [Google Scholar] [CrossRef] [PubMed]
  37. Li, X.; Zhong, Y.L.; Zhao, C.Y. Trypsin binding with copper ions scavenges superoxide: Molecular dynamics-based mechanism investigation. Int. J. Environ. Res. Public Health 2018, 15, 139. [Google Scholar] [CrossRef] [PubMed] [Green Version]
  38. Song, Y.Q.; Dong, J.F.; Qiao, H.L.; Wu, J.X. Molecular characterization, expression patterns and binding properties of two pheromone-binding proteins from the oriental fruit moth, Grapholita molesta (Busck). J. Integr. Agric. 2014, 13, 2709–2720. [Google Scholar] [CrossRef]
Figure 1. Effect of trypsin treatment on the storage quality or ROS levels of H. undatus. Values are the mean ± SE of triplicate samples. (AF) Fruits of H. undatus stored at 25 °C for 168 h with and without trypsin or chitosan treatment. (A,D) Control fruits, (B,E) trypsin-treated fruits, (C,F) chitosan-treated fruits, 0 or 168 h represent that fruits were stored for 0 or 168 h, respectively, (G) weight loss of H. undatus fruit stored with or without trypsin or chitosan for 72 or 168 h, (H) malondialdehyde MDA contents of H. undatus fruit stored with or without trypsin or chitosan for 72 or 168 h, (I,J) superoxide anion production rates, or H2O2 concentrations in H. undatus peel with or without trypsin or chitosan for 72 or 168 h. * represented significant difference (p < 0.05); ** represented highly significant difference (p < 0.01).
Antioxidants 09 00162 g001
Figure 2. Directed acyclic hierarchical graph (DAG) of gene ontology (GO) terms regulated by trypsin. The figure illustrates a subset of the molecular function DAG for superoxide metabolic process (GO:0006801) and metal ion transport (GO:0030001). The ancestors of GO:0006801 or GO:0030001 are highlighted back to the root of the biological process (GO:0008150) ontology via arrows.
Antioxidants 09 00162 g002
Figure 3. SODs protein–protein interaction PPI sub-networks induced by trypsin were constructed by cytoscape software. Rectangle nodes represented proteins encoded by downregulated genes, while round nodes represented proteins encoded by upregulated genes. The CSD2 without significantly differential expression was represented as triangle-shaped nodes. The nodes were ranked and colored by cytoHubba.
Antioxidants 09 00162 g003
Figure 4. ROS related PPI networks induced by trypsin were constructed by cytoscape software. Rectangle nodes represented proteins encoded by downregulated genes, while round nodes represented proteins encoded by upregulated genes. The other interacting proteins without significantly differential expression were represented as triangle-shaped nodes. Top 5 clusters calculated by MCODE were colored as shown in the legend.
Antioxidants 09 00162 g004
Figure 5. Top 5 clusters of ROS related PPI network calculated by MCODE. (AE) represents cluster 1–5, respectively. SODs were colored in (A,C).
Antioxidants 09 00162 g005
Figure 6. The first-neighbors of SODs PPI sub-networks induced by trypsin were constructed by cytoscape software. Nodes were arranged as attribute circle layout according to the neighborhood connectivity of selected nodes.
Antioxidants 09 00162 g006
Figure 7. RNA-seq and RT-qPCR determination of 7 SOD genes of H. undatus peel at 168 h of storage.
Antioxidants 09 00162 g007
Table 1. Top 10 GO enrichment terms related to HuSODs (p < 0.01) by trypsin.
PatternNumGO IDTerm TypeDescriptionp-Value *FDR a
Up-regulation1GO:0006801BPsuperoxide metabolic process0.0023831
1GO:0030001BPmetal ion transport0.0097661
1GO:0004784MFsuperoxide dismutase activity0.0010041
1GO:0016721MFoxidoreductase activity, acting on superoxide radicals as acceptor0.0010041
Down-regulation3GO:0004784MFsuperoxide dismutase activity3.3214 × 10−109.1654 × 10⁻⁷
3GO:0016721MFoxidoreductase activity, acting on superoxide radicals as acceptor3.3214 × 10−109.1654 × 10⁻⁷
3GO:0016209MFantioxidant activity1.2739 × 10−60.002344
4GO:0016491MFoxidoreductase activity2.9523 × 10−50.04073
1GO:0071493BPcellular response to UV-B0.00025100.1732
1GO:0071457BPcellular response to ozone0.00025100.1732
* p-values were calculated using Fischer‘s test. a FDR corrections were calculated using the Benjamini–Hochberg procedure.
Table 2. Pathways related to superoxide dismutases (SODs) enriched by trypsin.
PatternNumKO IDTermp-Value *FDR a
Up-regulation2map04146Peroxisome0.000680.0020
1map03060Protein export0.0230.035
1map03440Homologous recombination0.0390.039
Down-regulation3map04146Peroxisome4.84 × 10−61.45 × 10⁻⁵
1map03008Ribosome biogenesis in eukaryotes0.0580.087
1map03013RNA transport0.0970.097
* p-values were calculated using Fischer’s test. a FDR corrections were calculated using the Benjamini–Hochberg procedure.
Table 3. Topological parameters of the total ROS related genes, a first neighbor of SODs and 7 SODs PPI networks of H. undatus regulated by trypsin.
PPI Subnetworky = βxαR2CorrelationClustering CoefficientNetwork CentralizationNetwork DensityTotal Num. of NodesNum. of Up-Regulated NodesNum. of Down-Regulated NodesCharacteristic Path Length
Total ROSY = 109.39x−1.0360.8160.8730.3840.2540.0304471201503.285
First neighbors of SODsY = 1.727 x 0.0040.000−0.0060.5980.4140.3336538231.758
7 SODsY = 0.161 x 1.7080.9360.9240.9140.2000.8577331.143

