Synthesis and Characterization of Green Carbon Dots for Scavenging Radical Oxygen Species in Aqueous and Oil Samples


Abstract

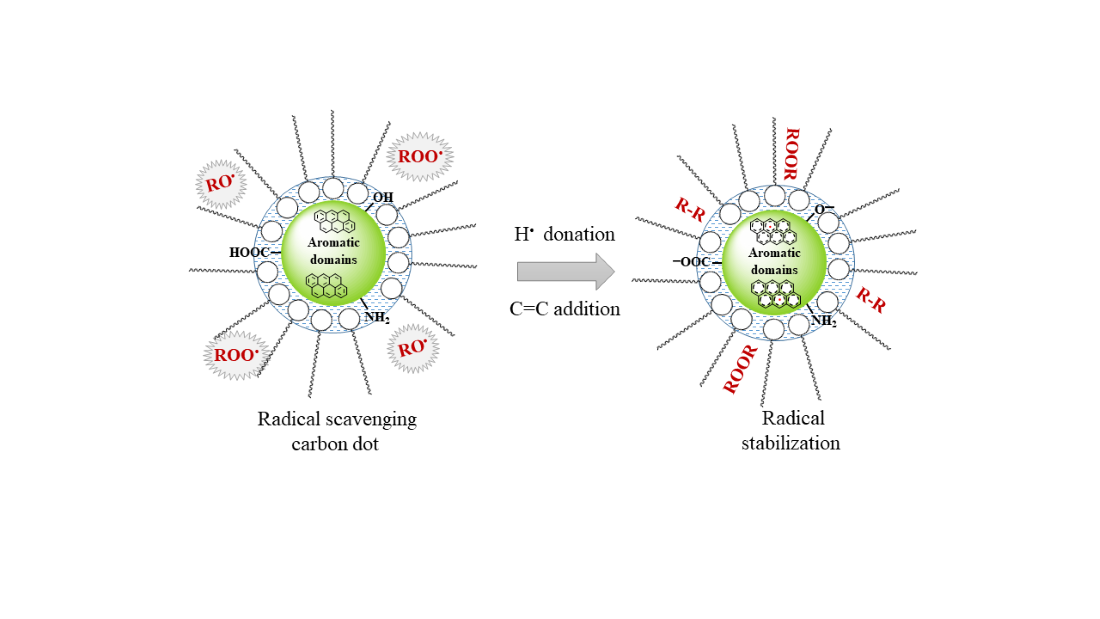
1. Introduction
2. Materials and Instrumentation
2.1. Chemicals
2.2. Instrumentation
2.3. Synthesis of Carbon Dots
2.3.1. Glutathione/Citric Acid CDs
2.3.2. Tea Waste-Based CDs
2.3.3. Grape Pomace-Based CDs
2.4. Measurement of Total Reducing Capacity: Folin-Ciocalteau Procedure
2.5. DPPH Free Radical Scavenging Assay
2.6. Determination of the Lubricant Oil Peroxide Value
3. Results and Discussion
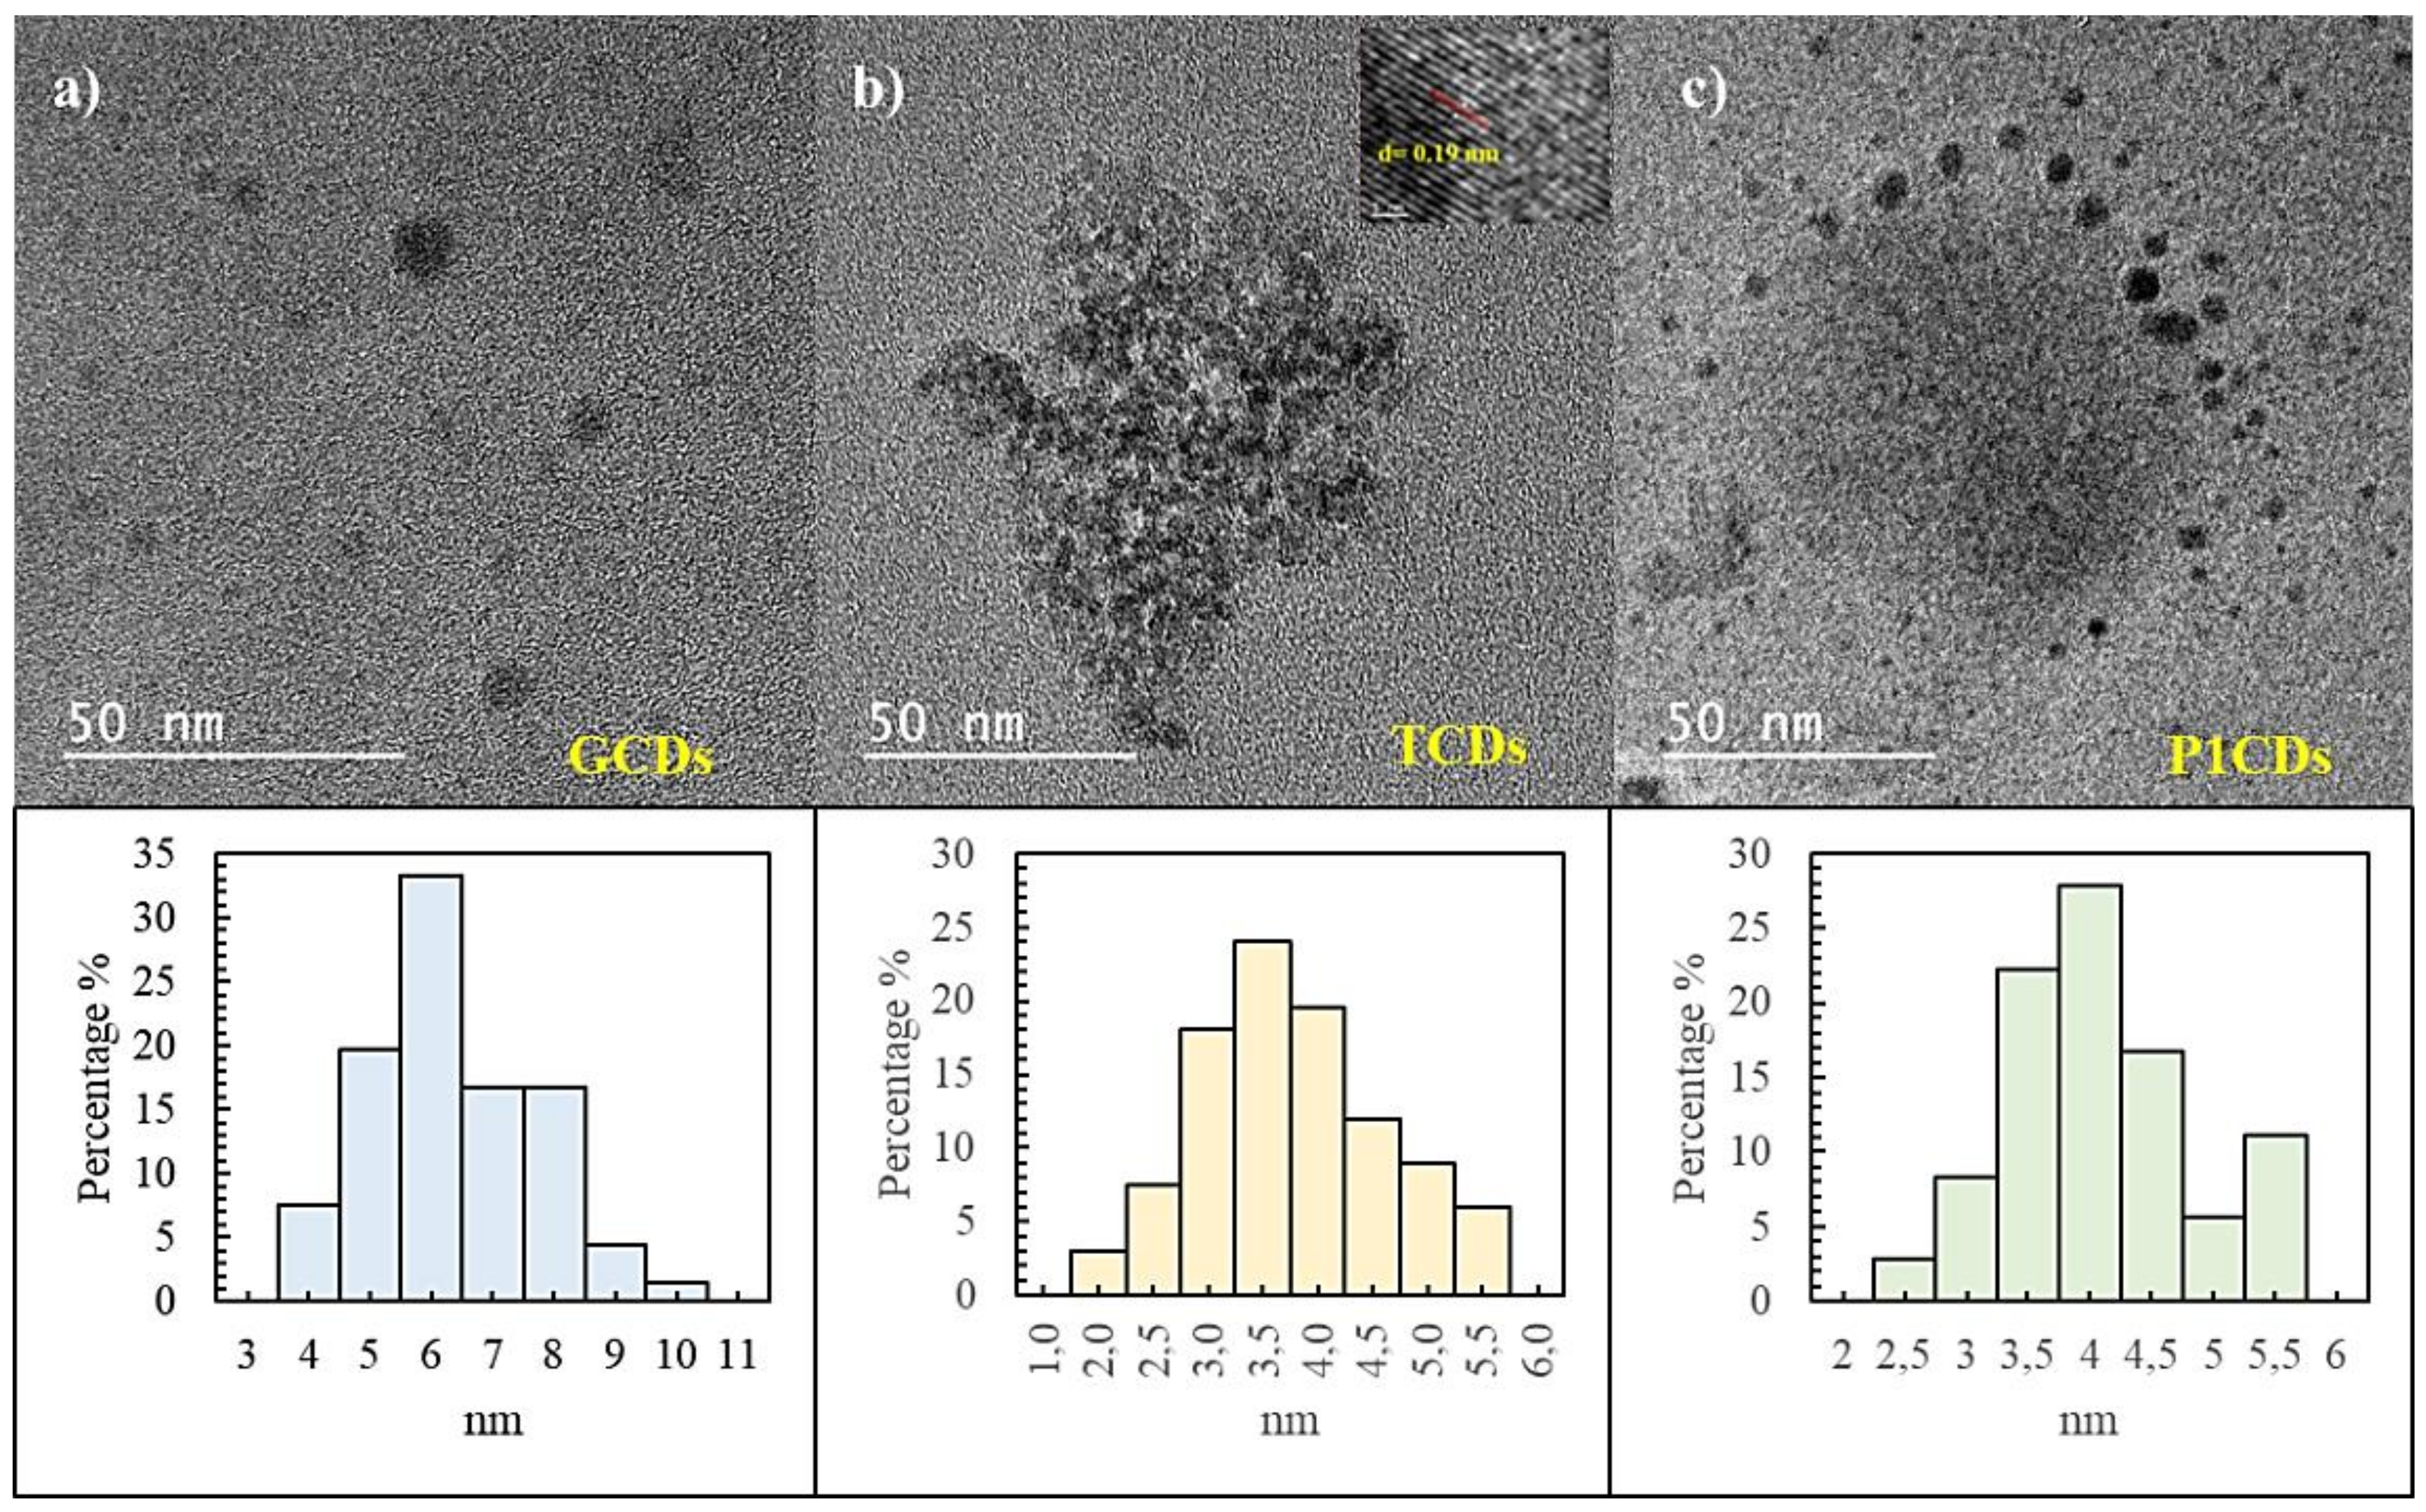
3.1. Morphological Characterization
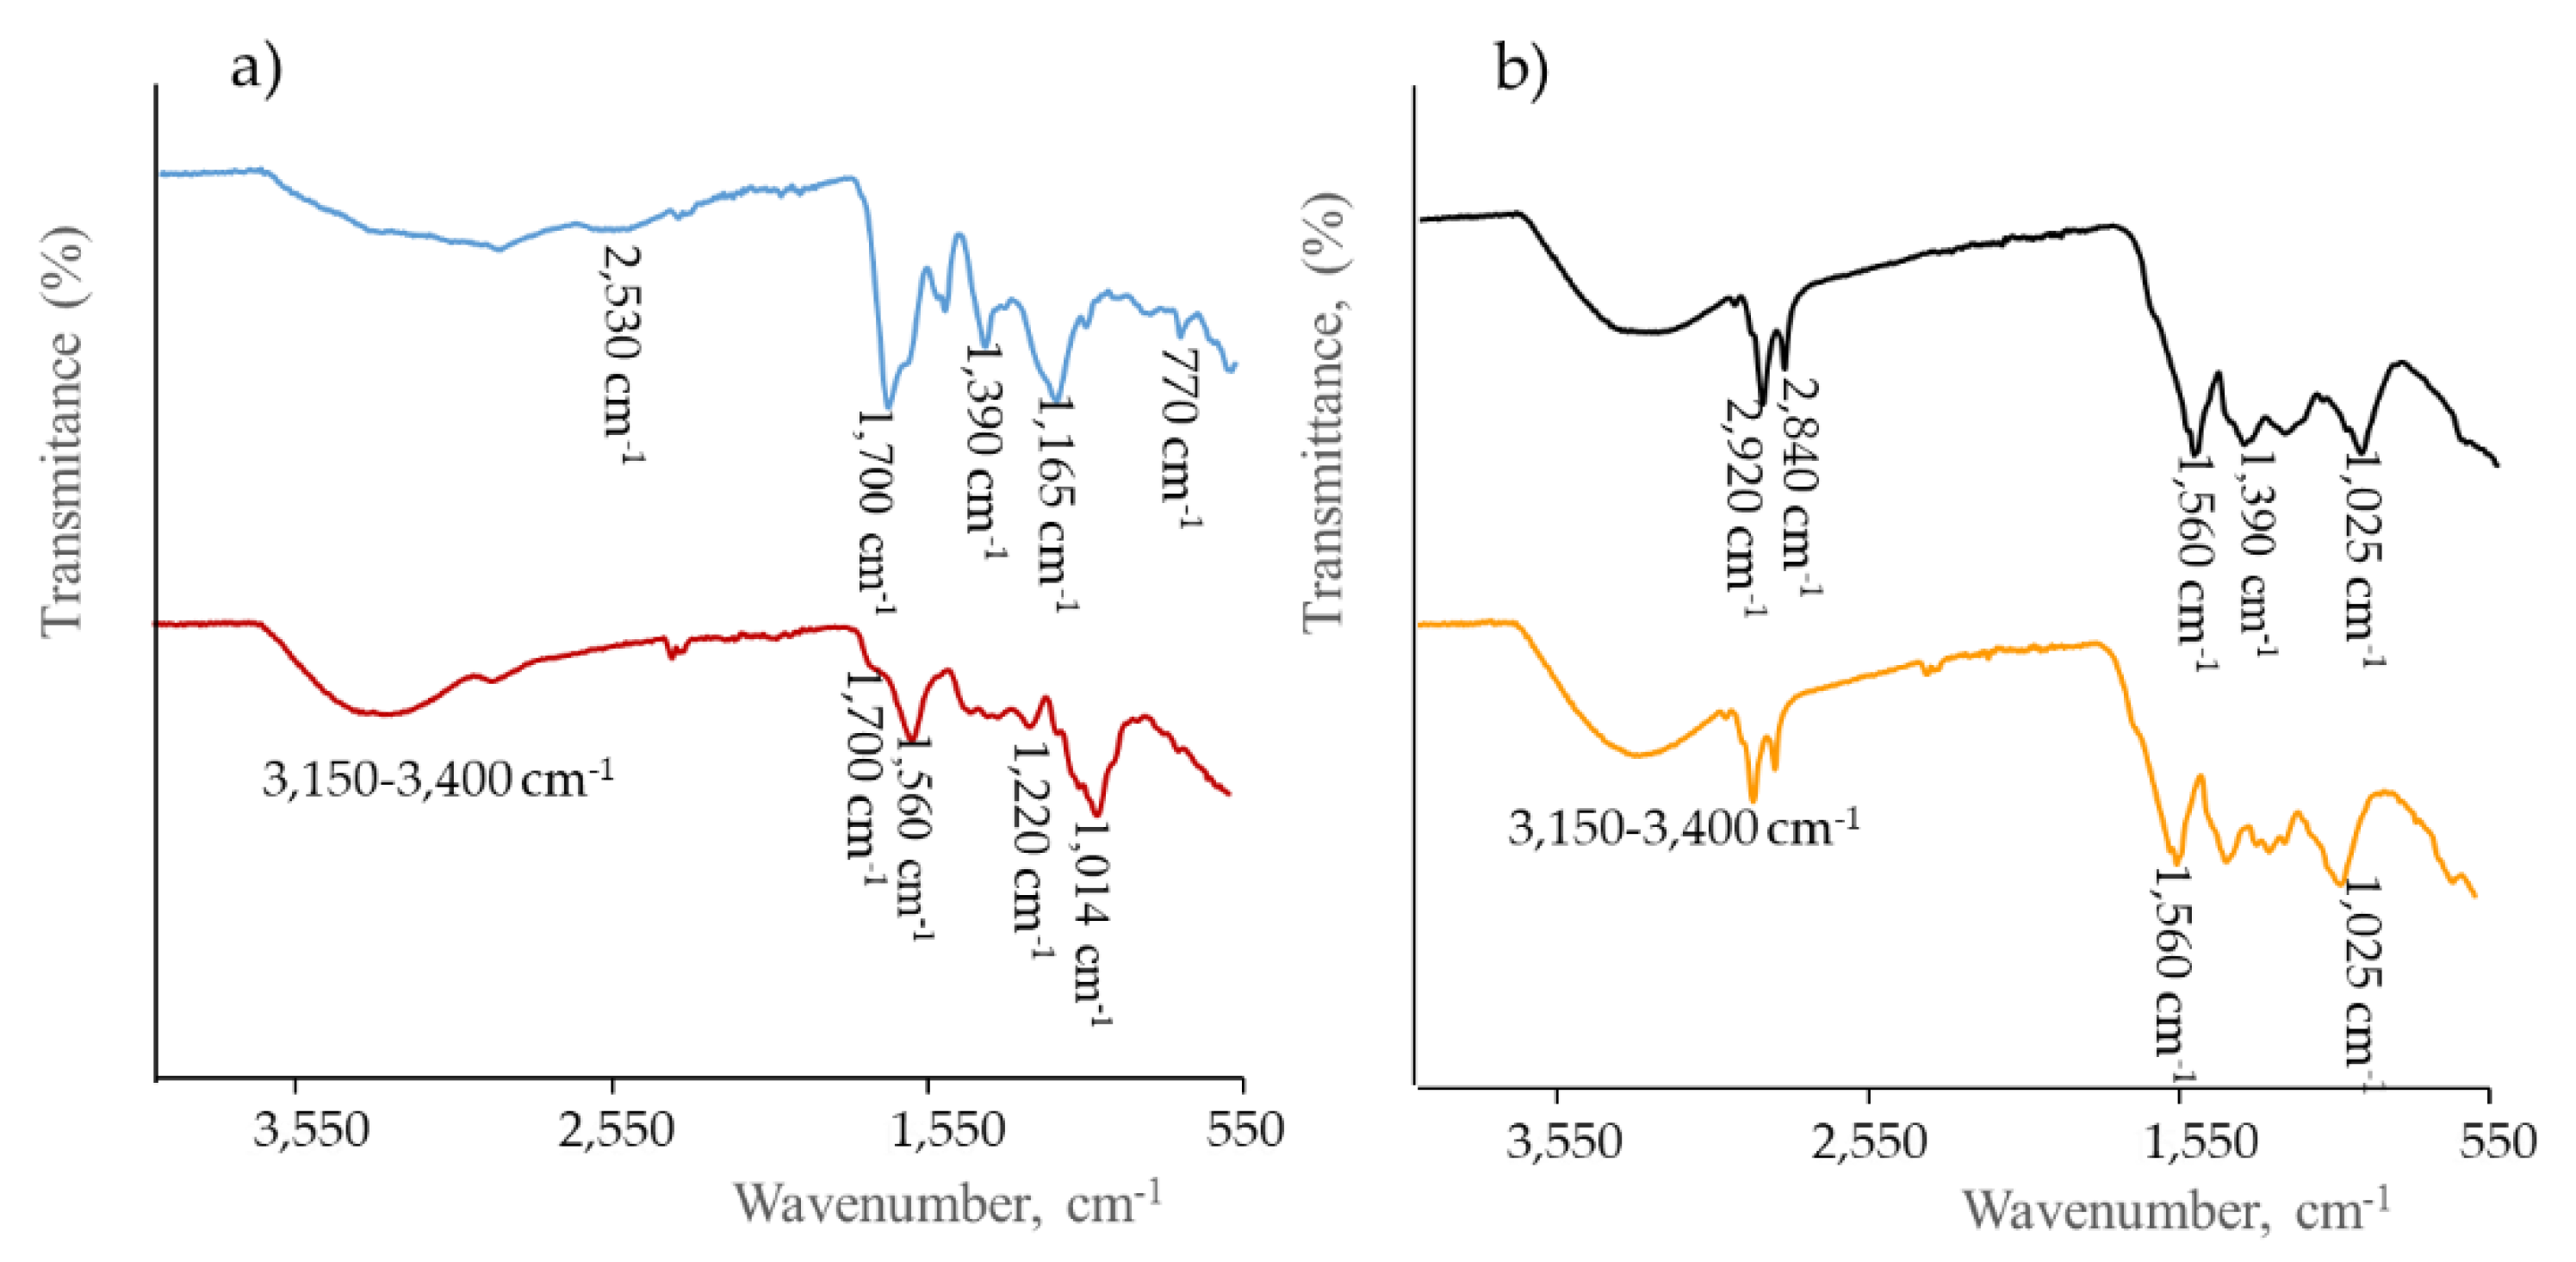
3.2. Characterization of Functional Groups
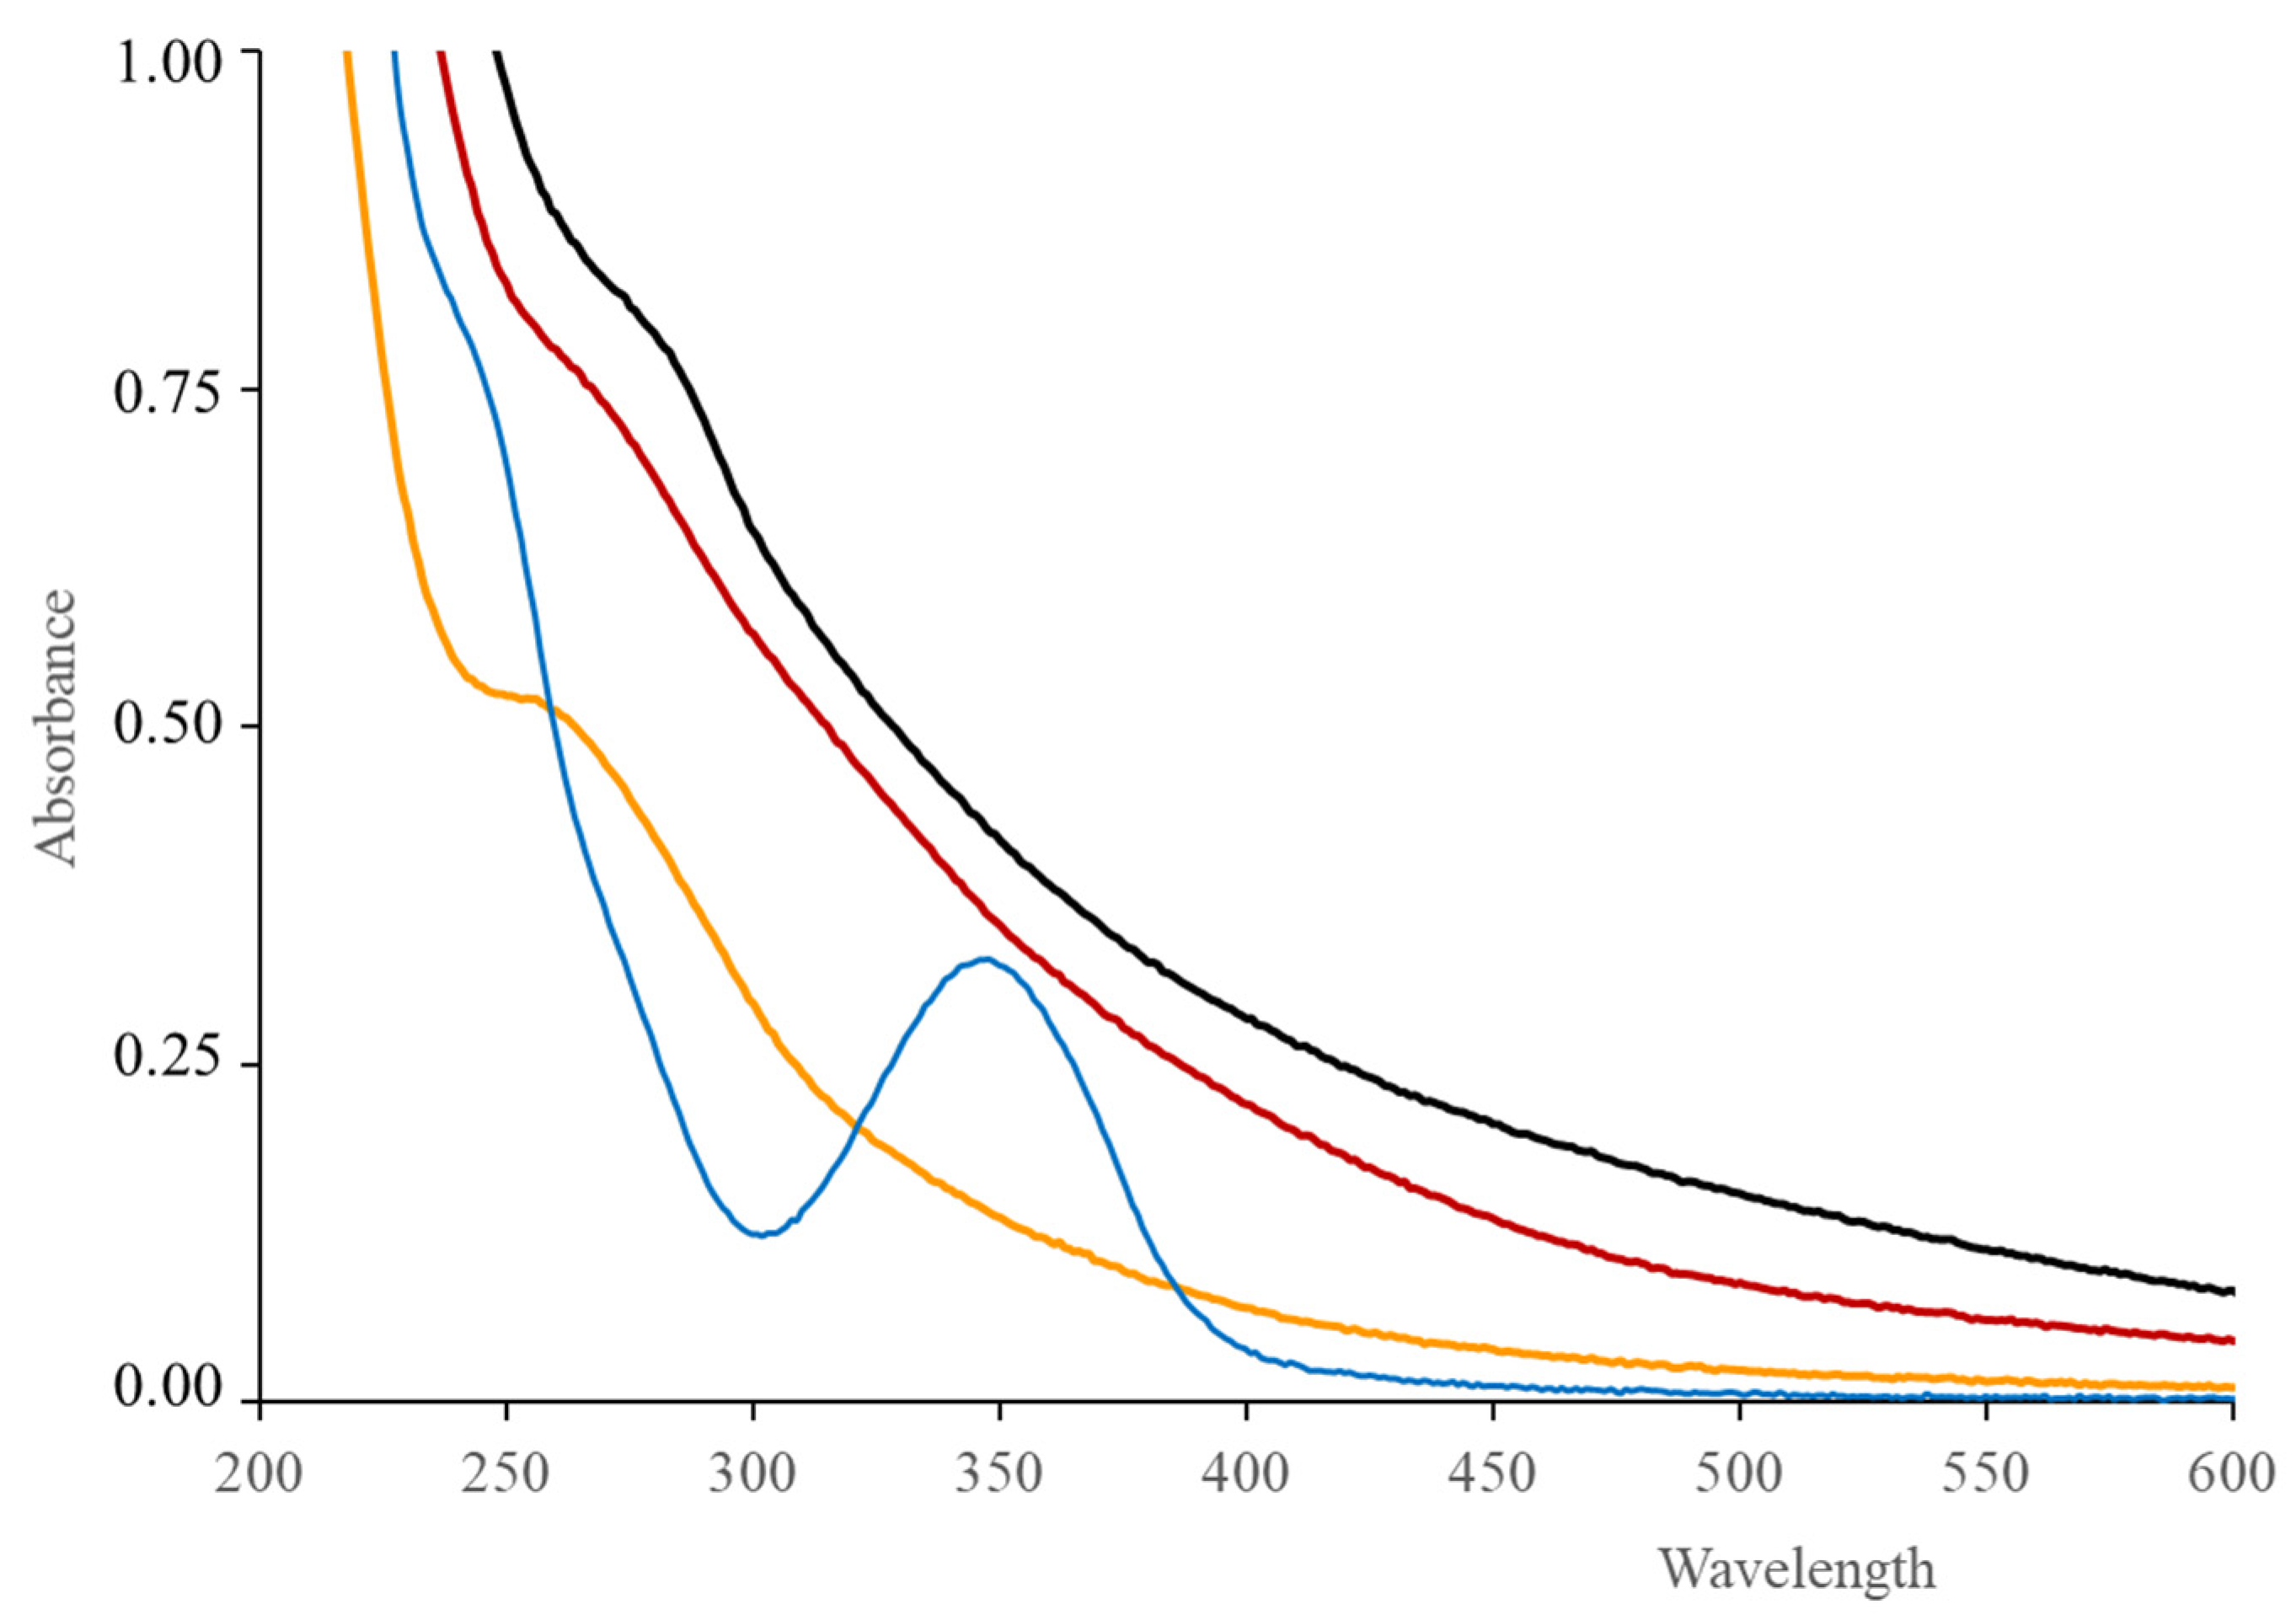
3.3. Spectrophotometric and Luminescent Optical Properties
3.4. Luminescence Properties
3.5. pH Surface States Influence on Luminescence Properties
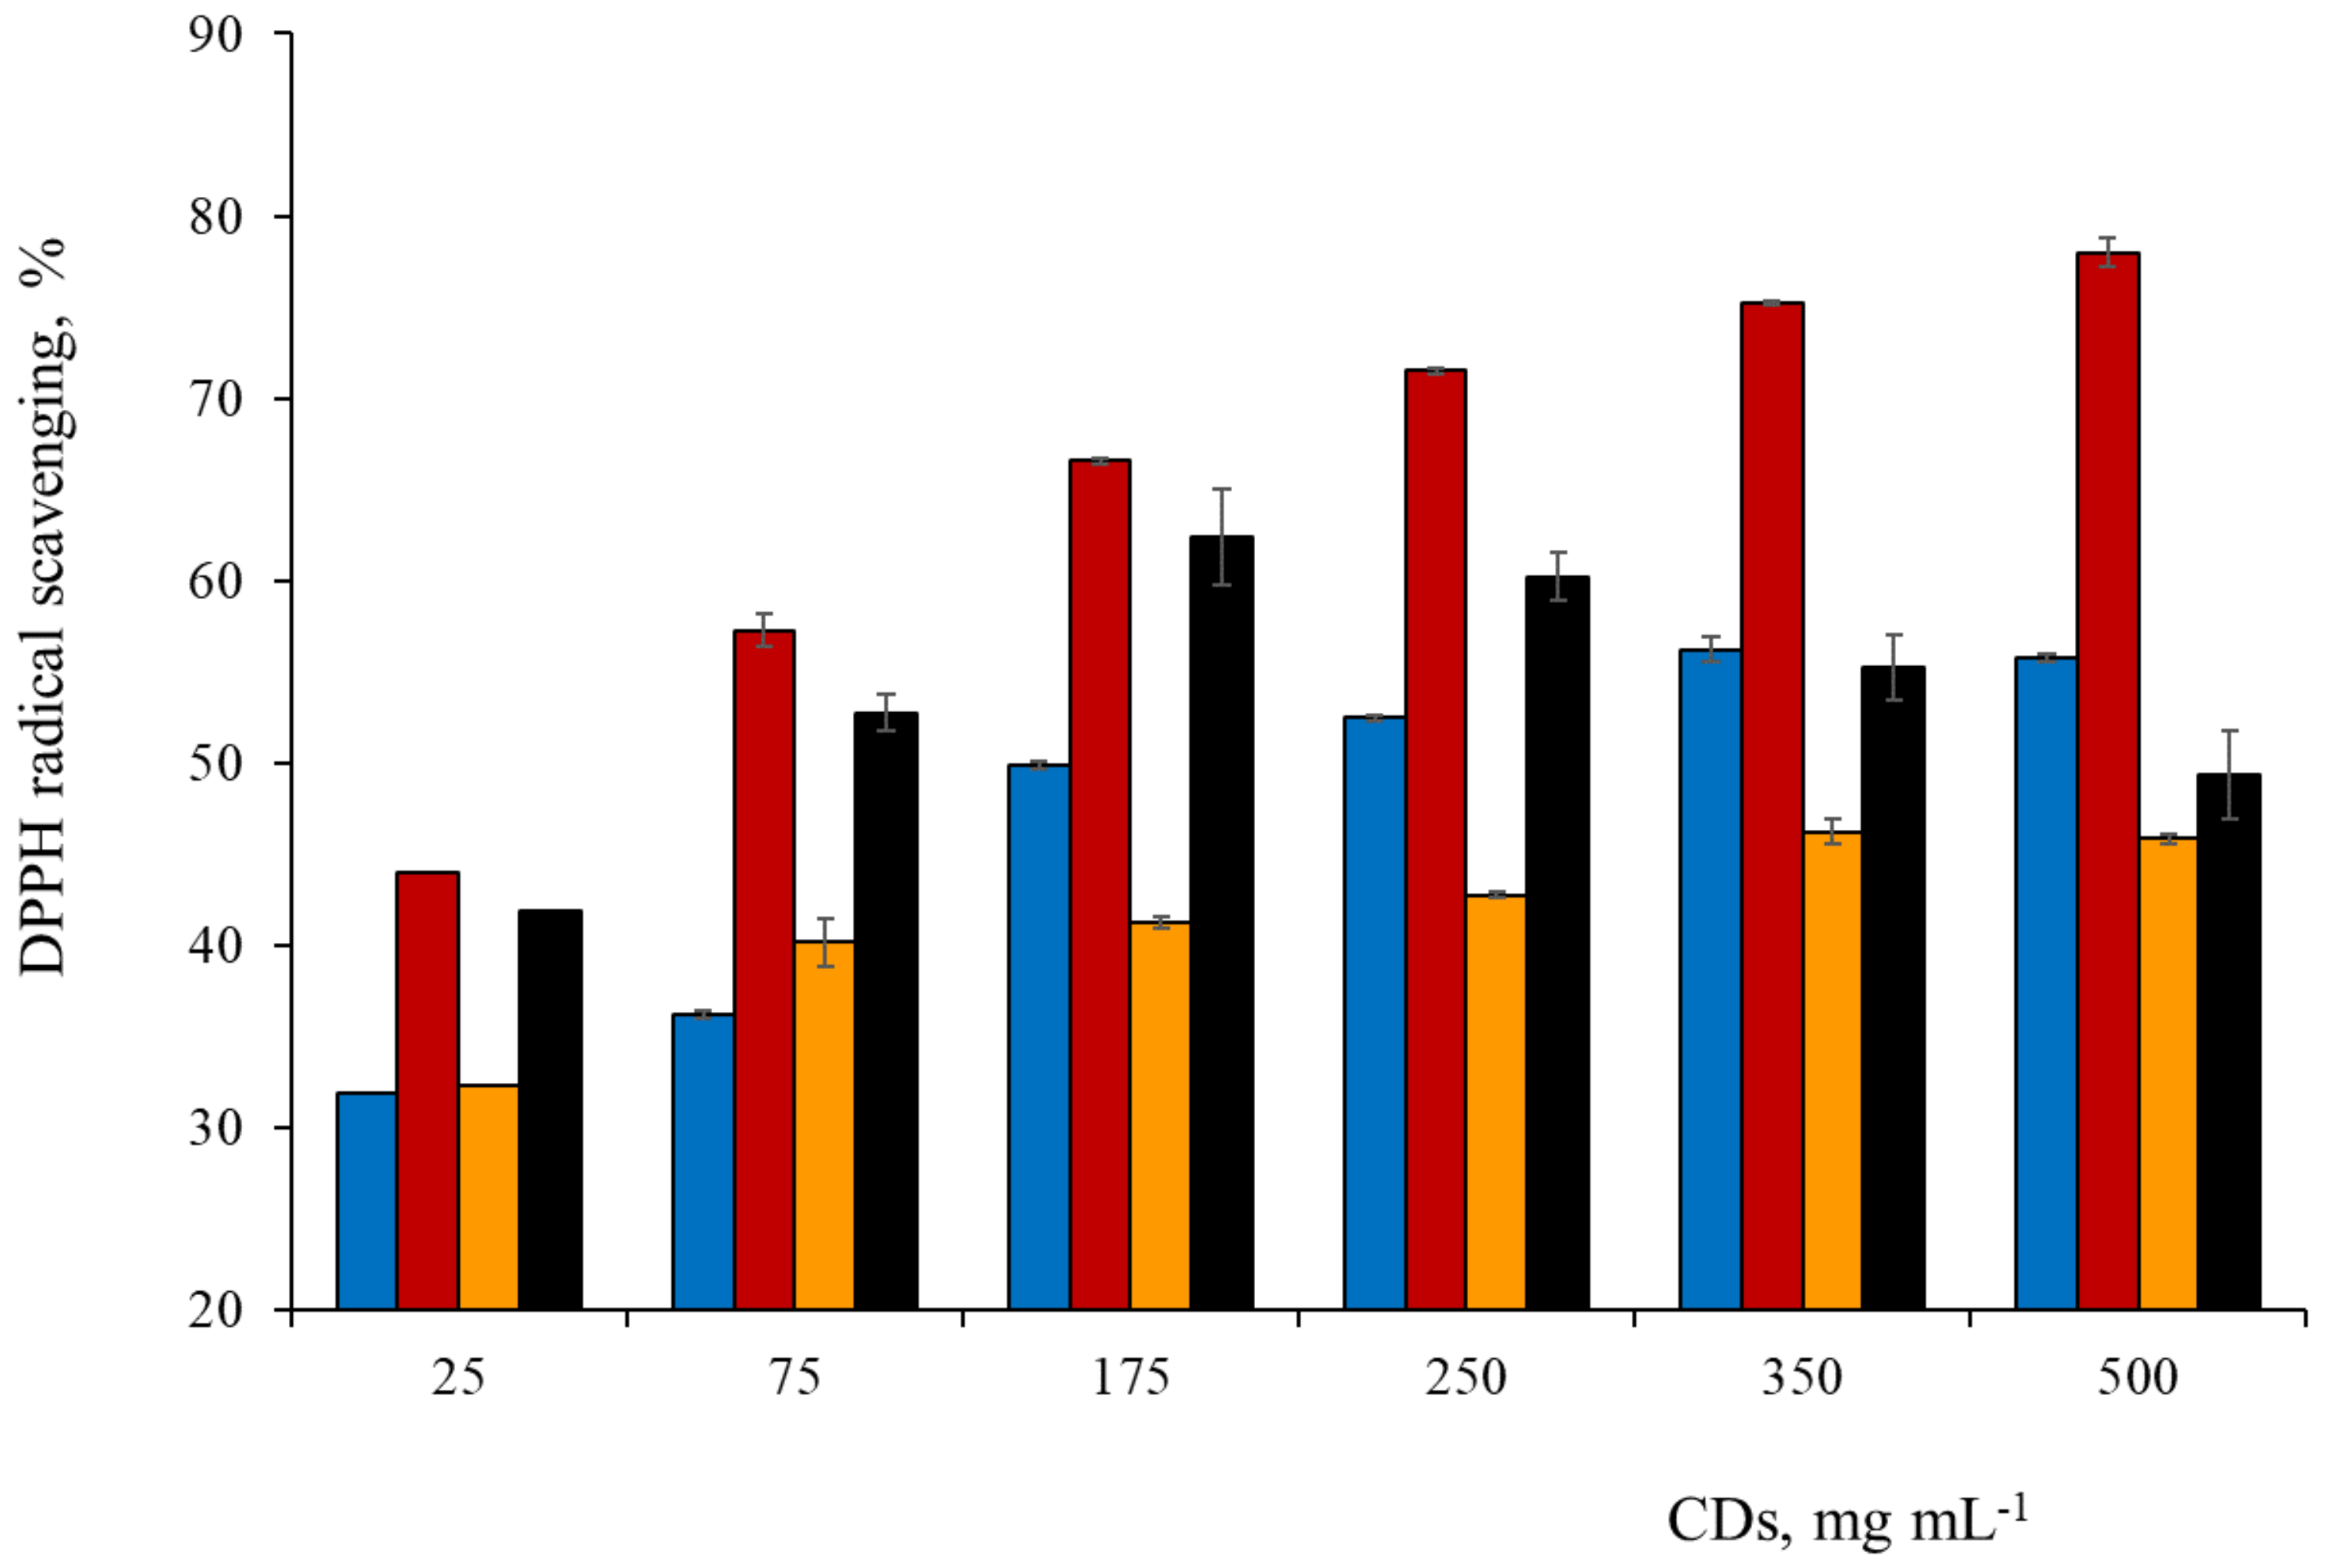
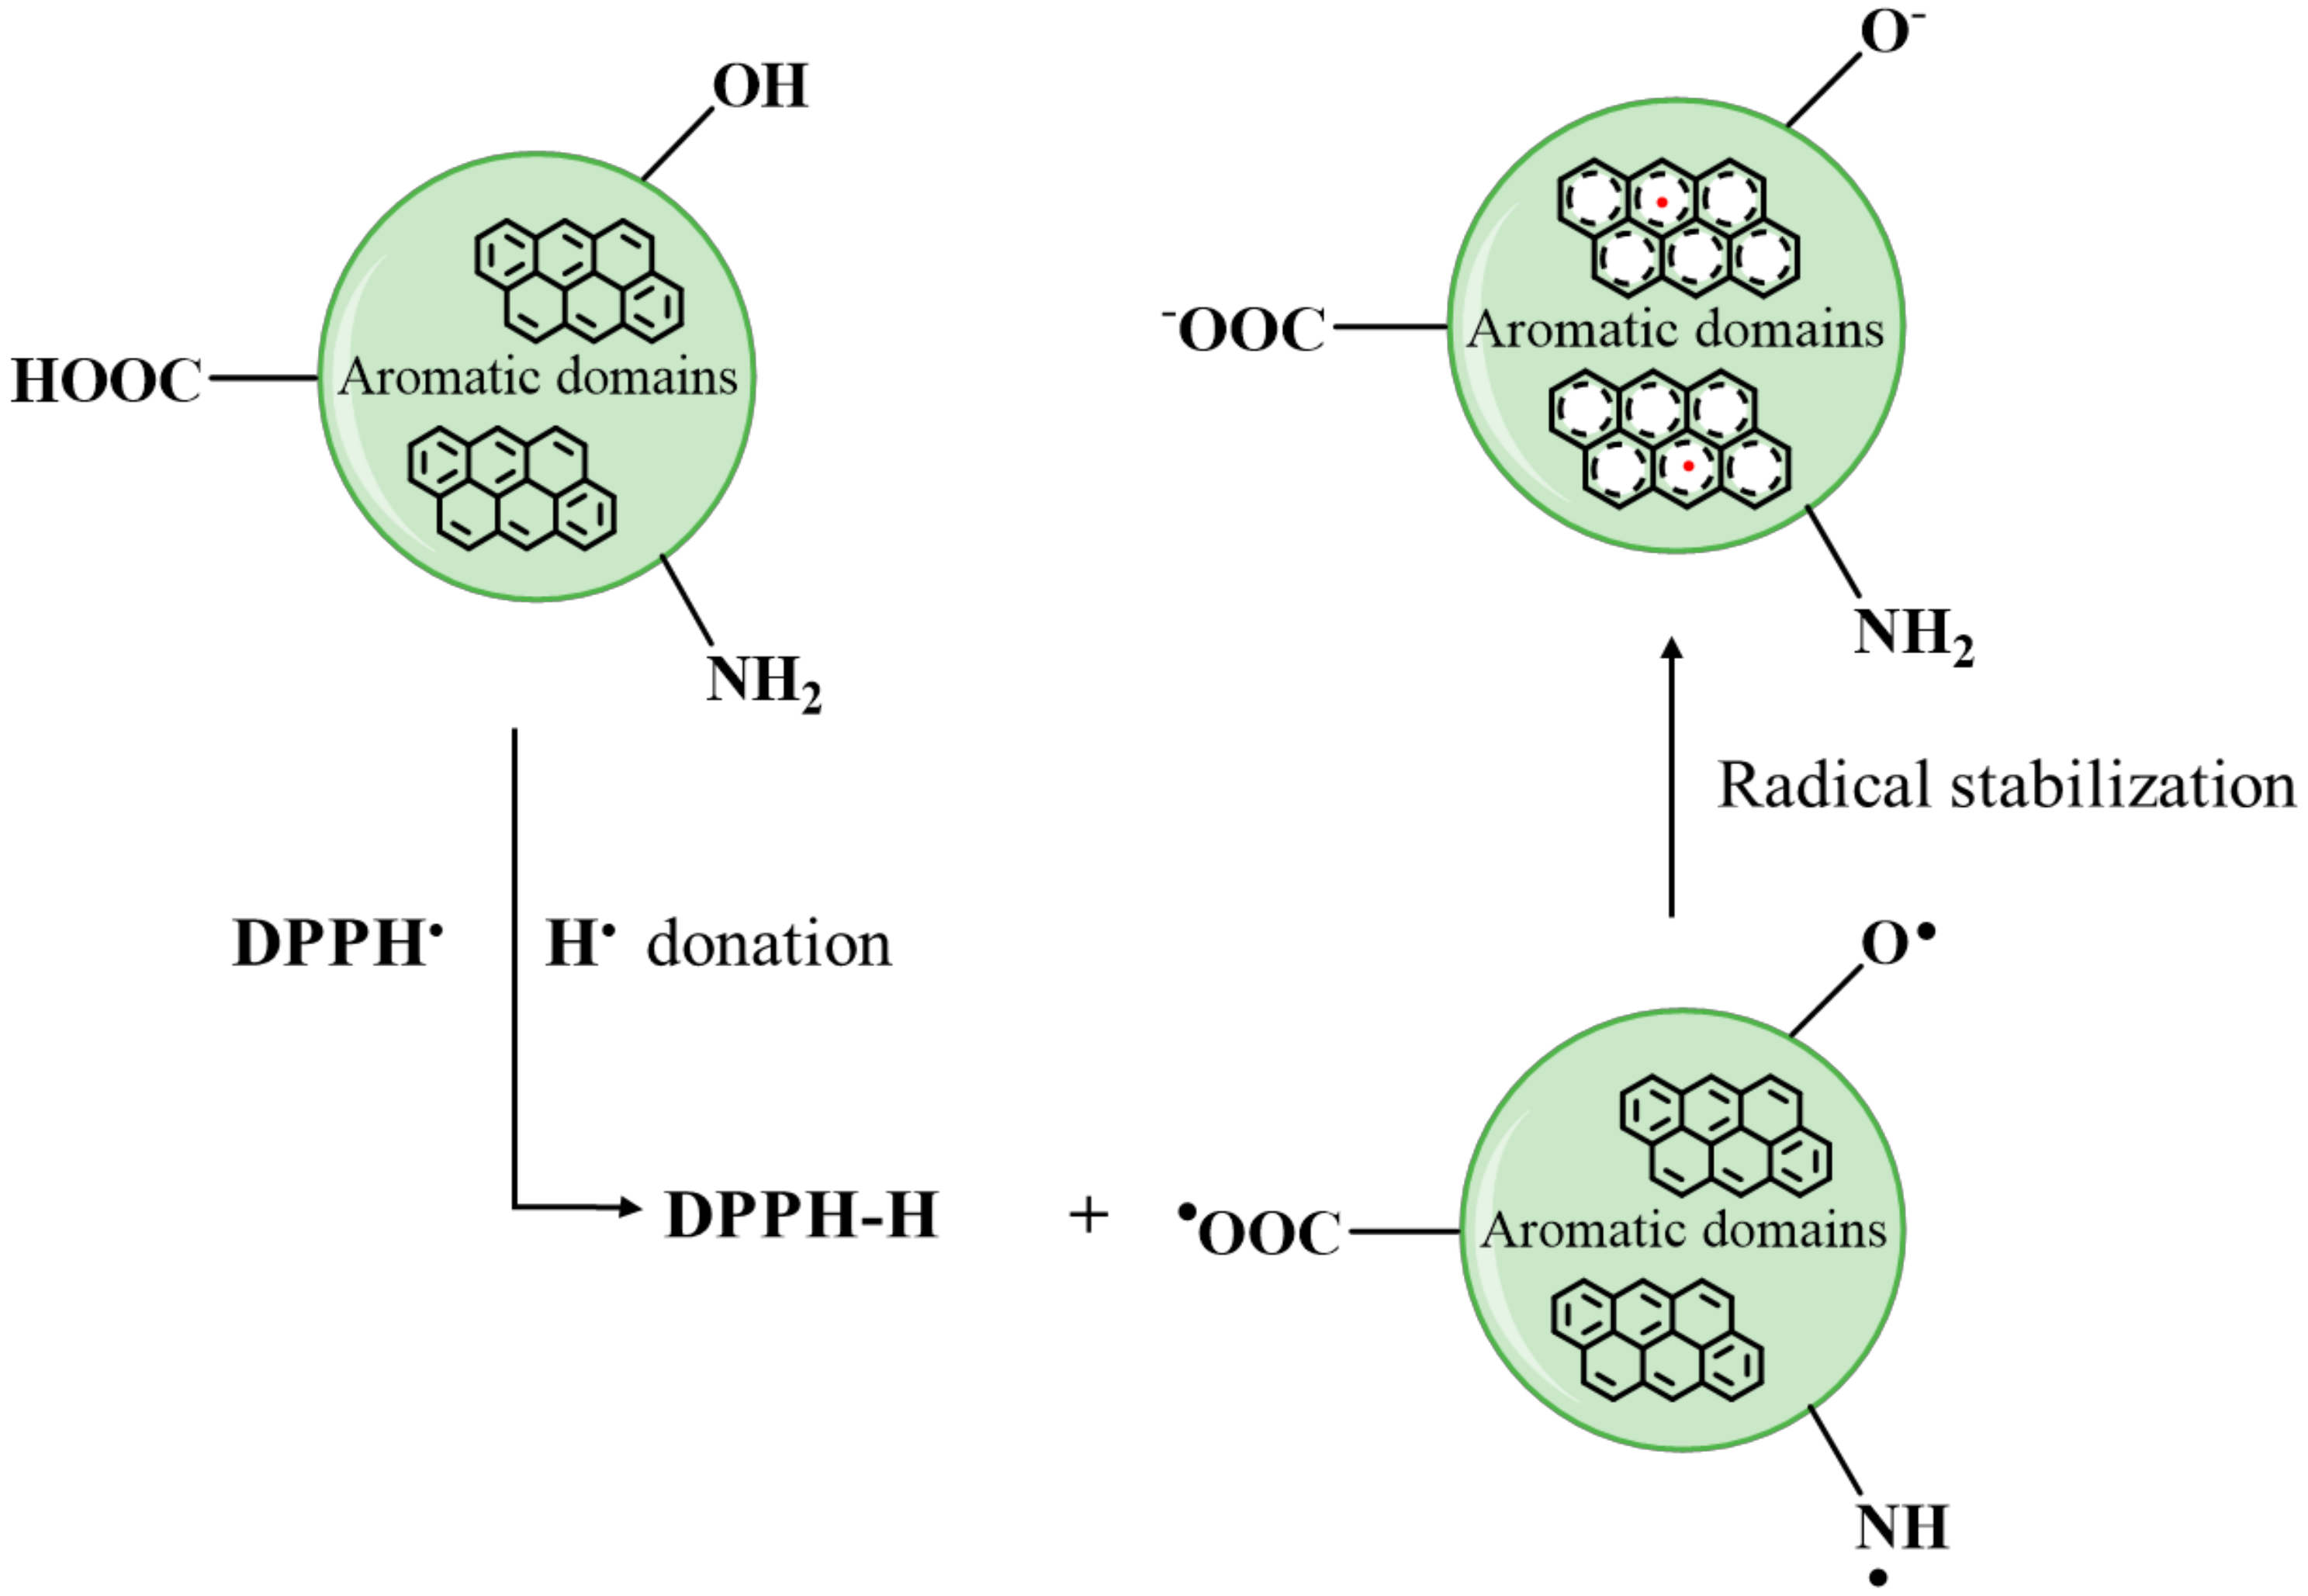
3.6. Spectrophotometric Study of Antioxidant Activity
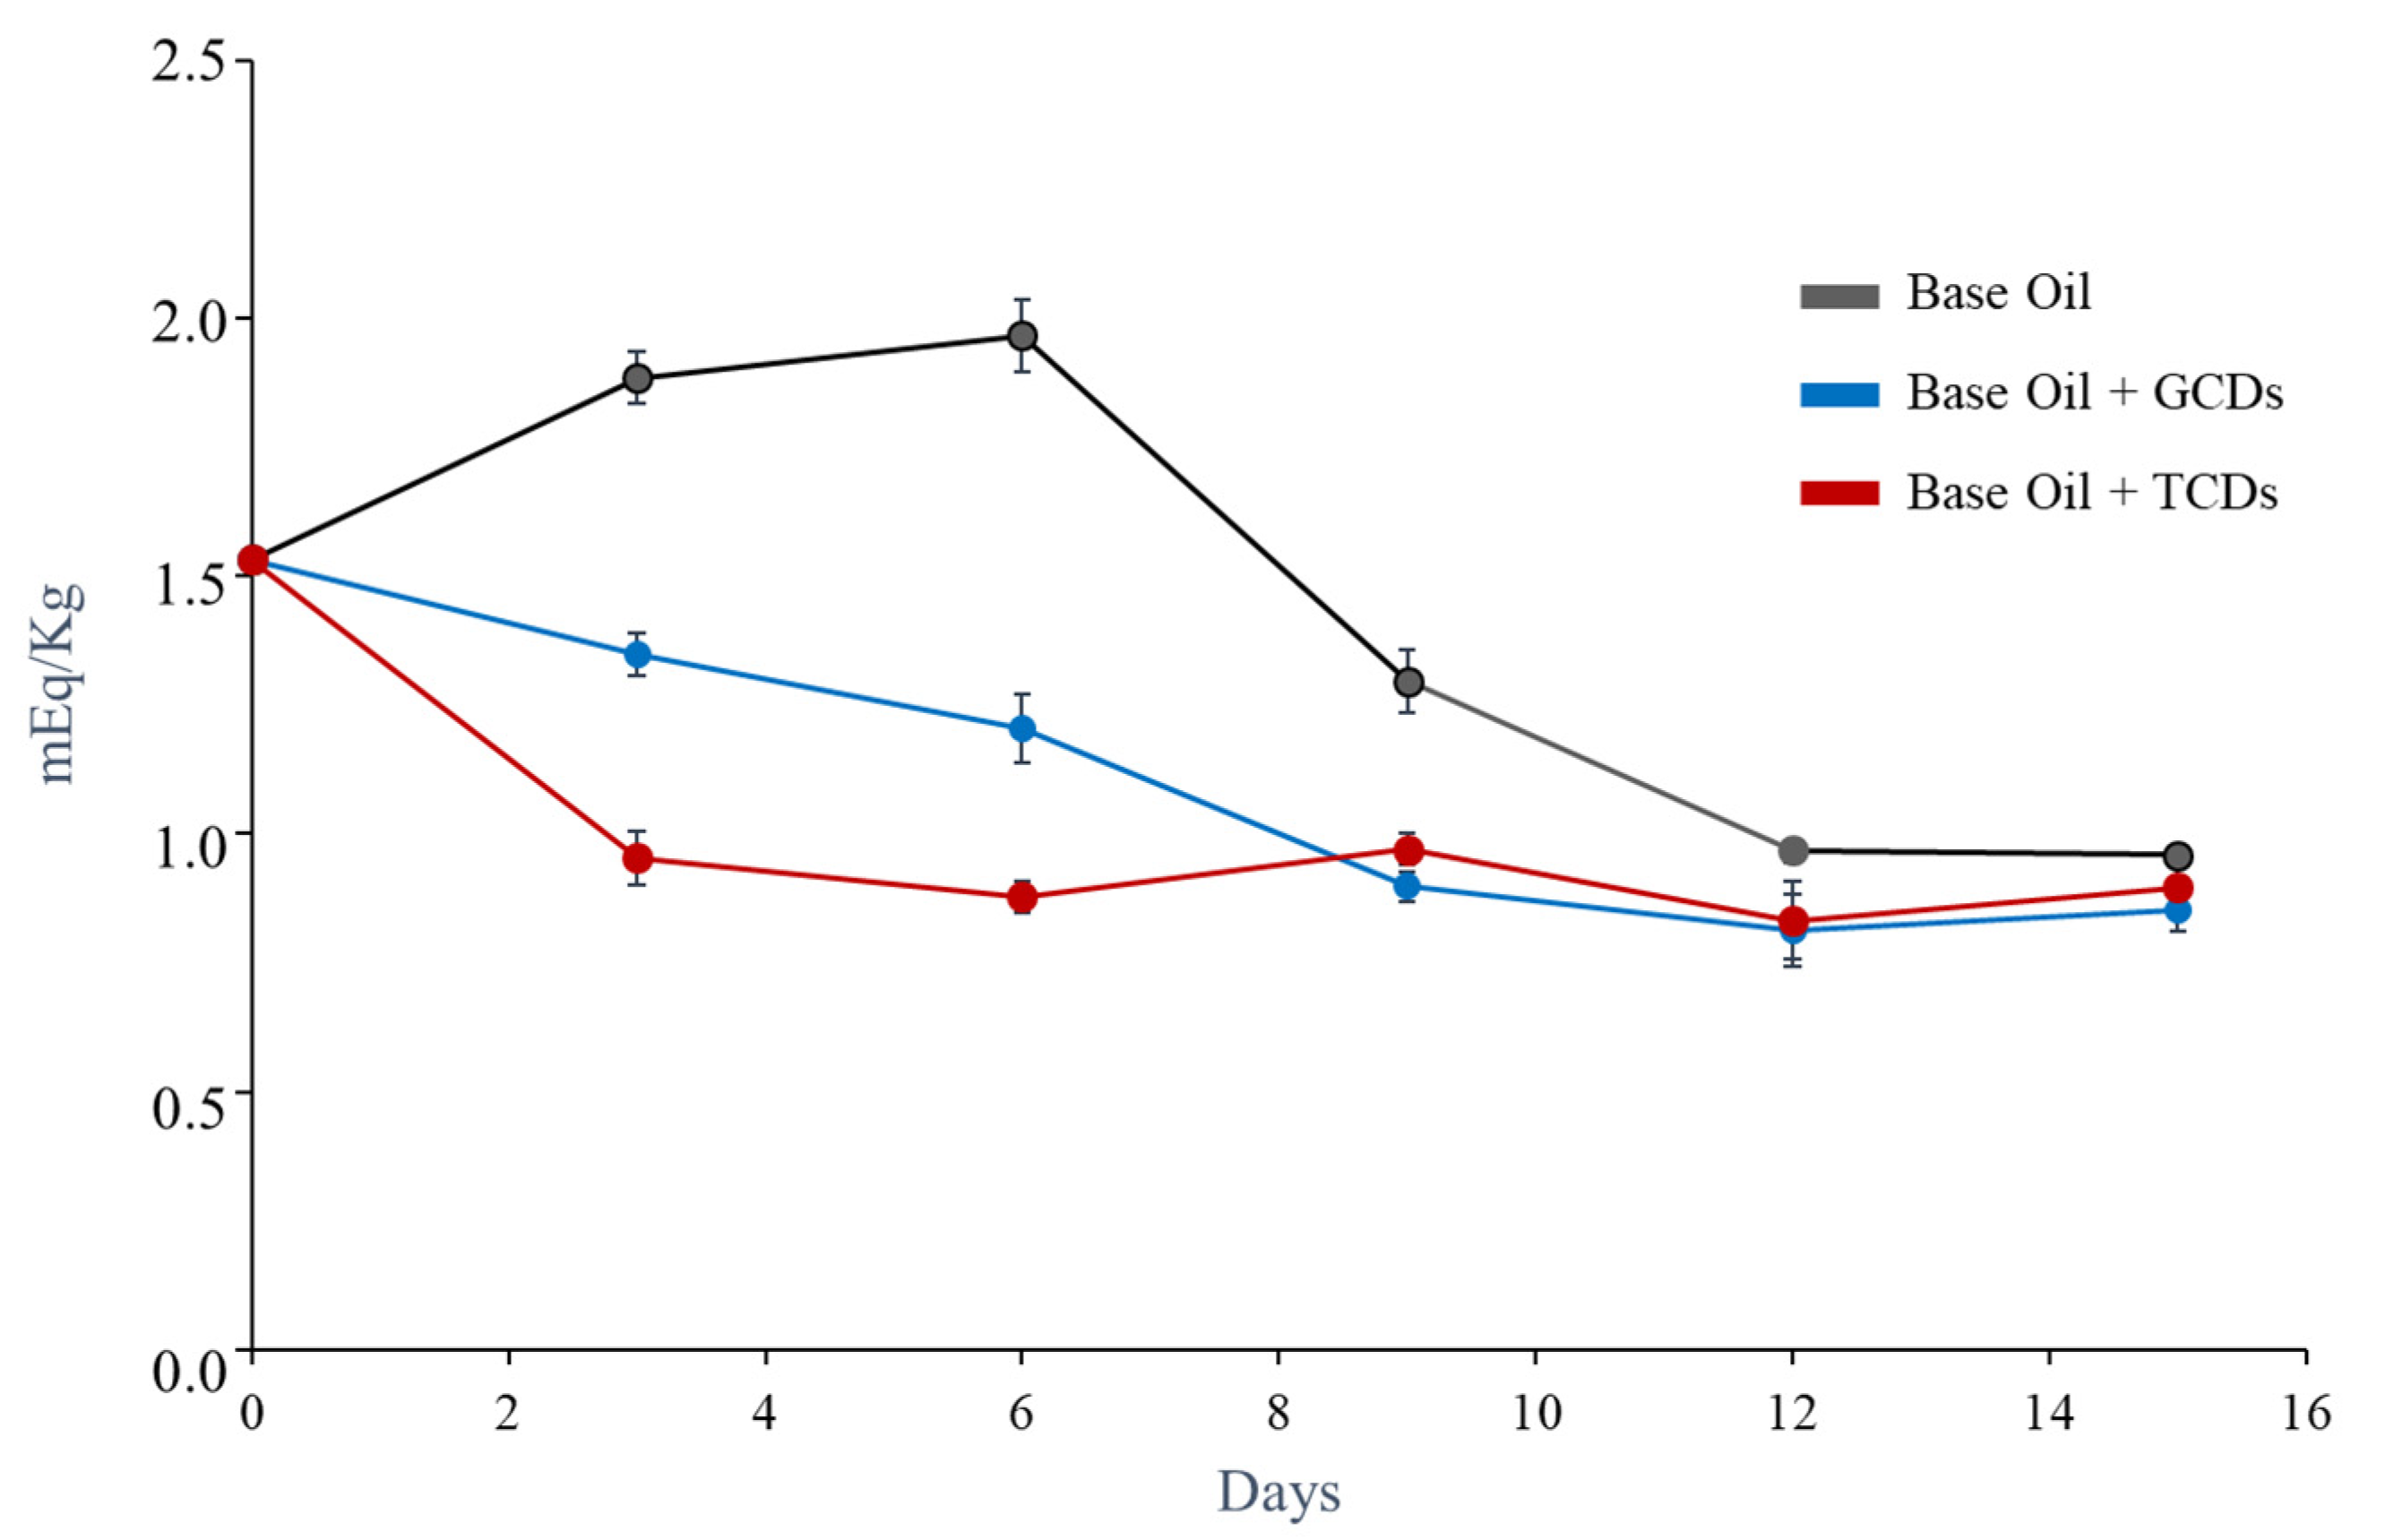
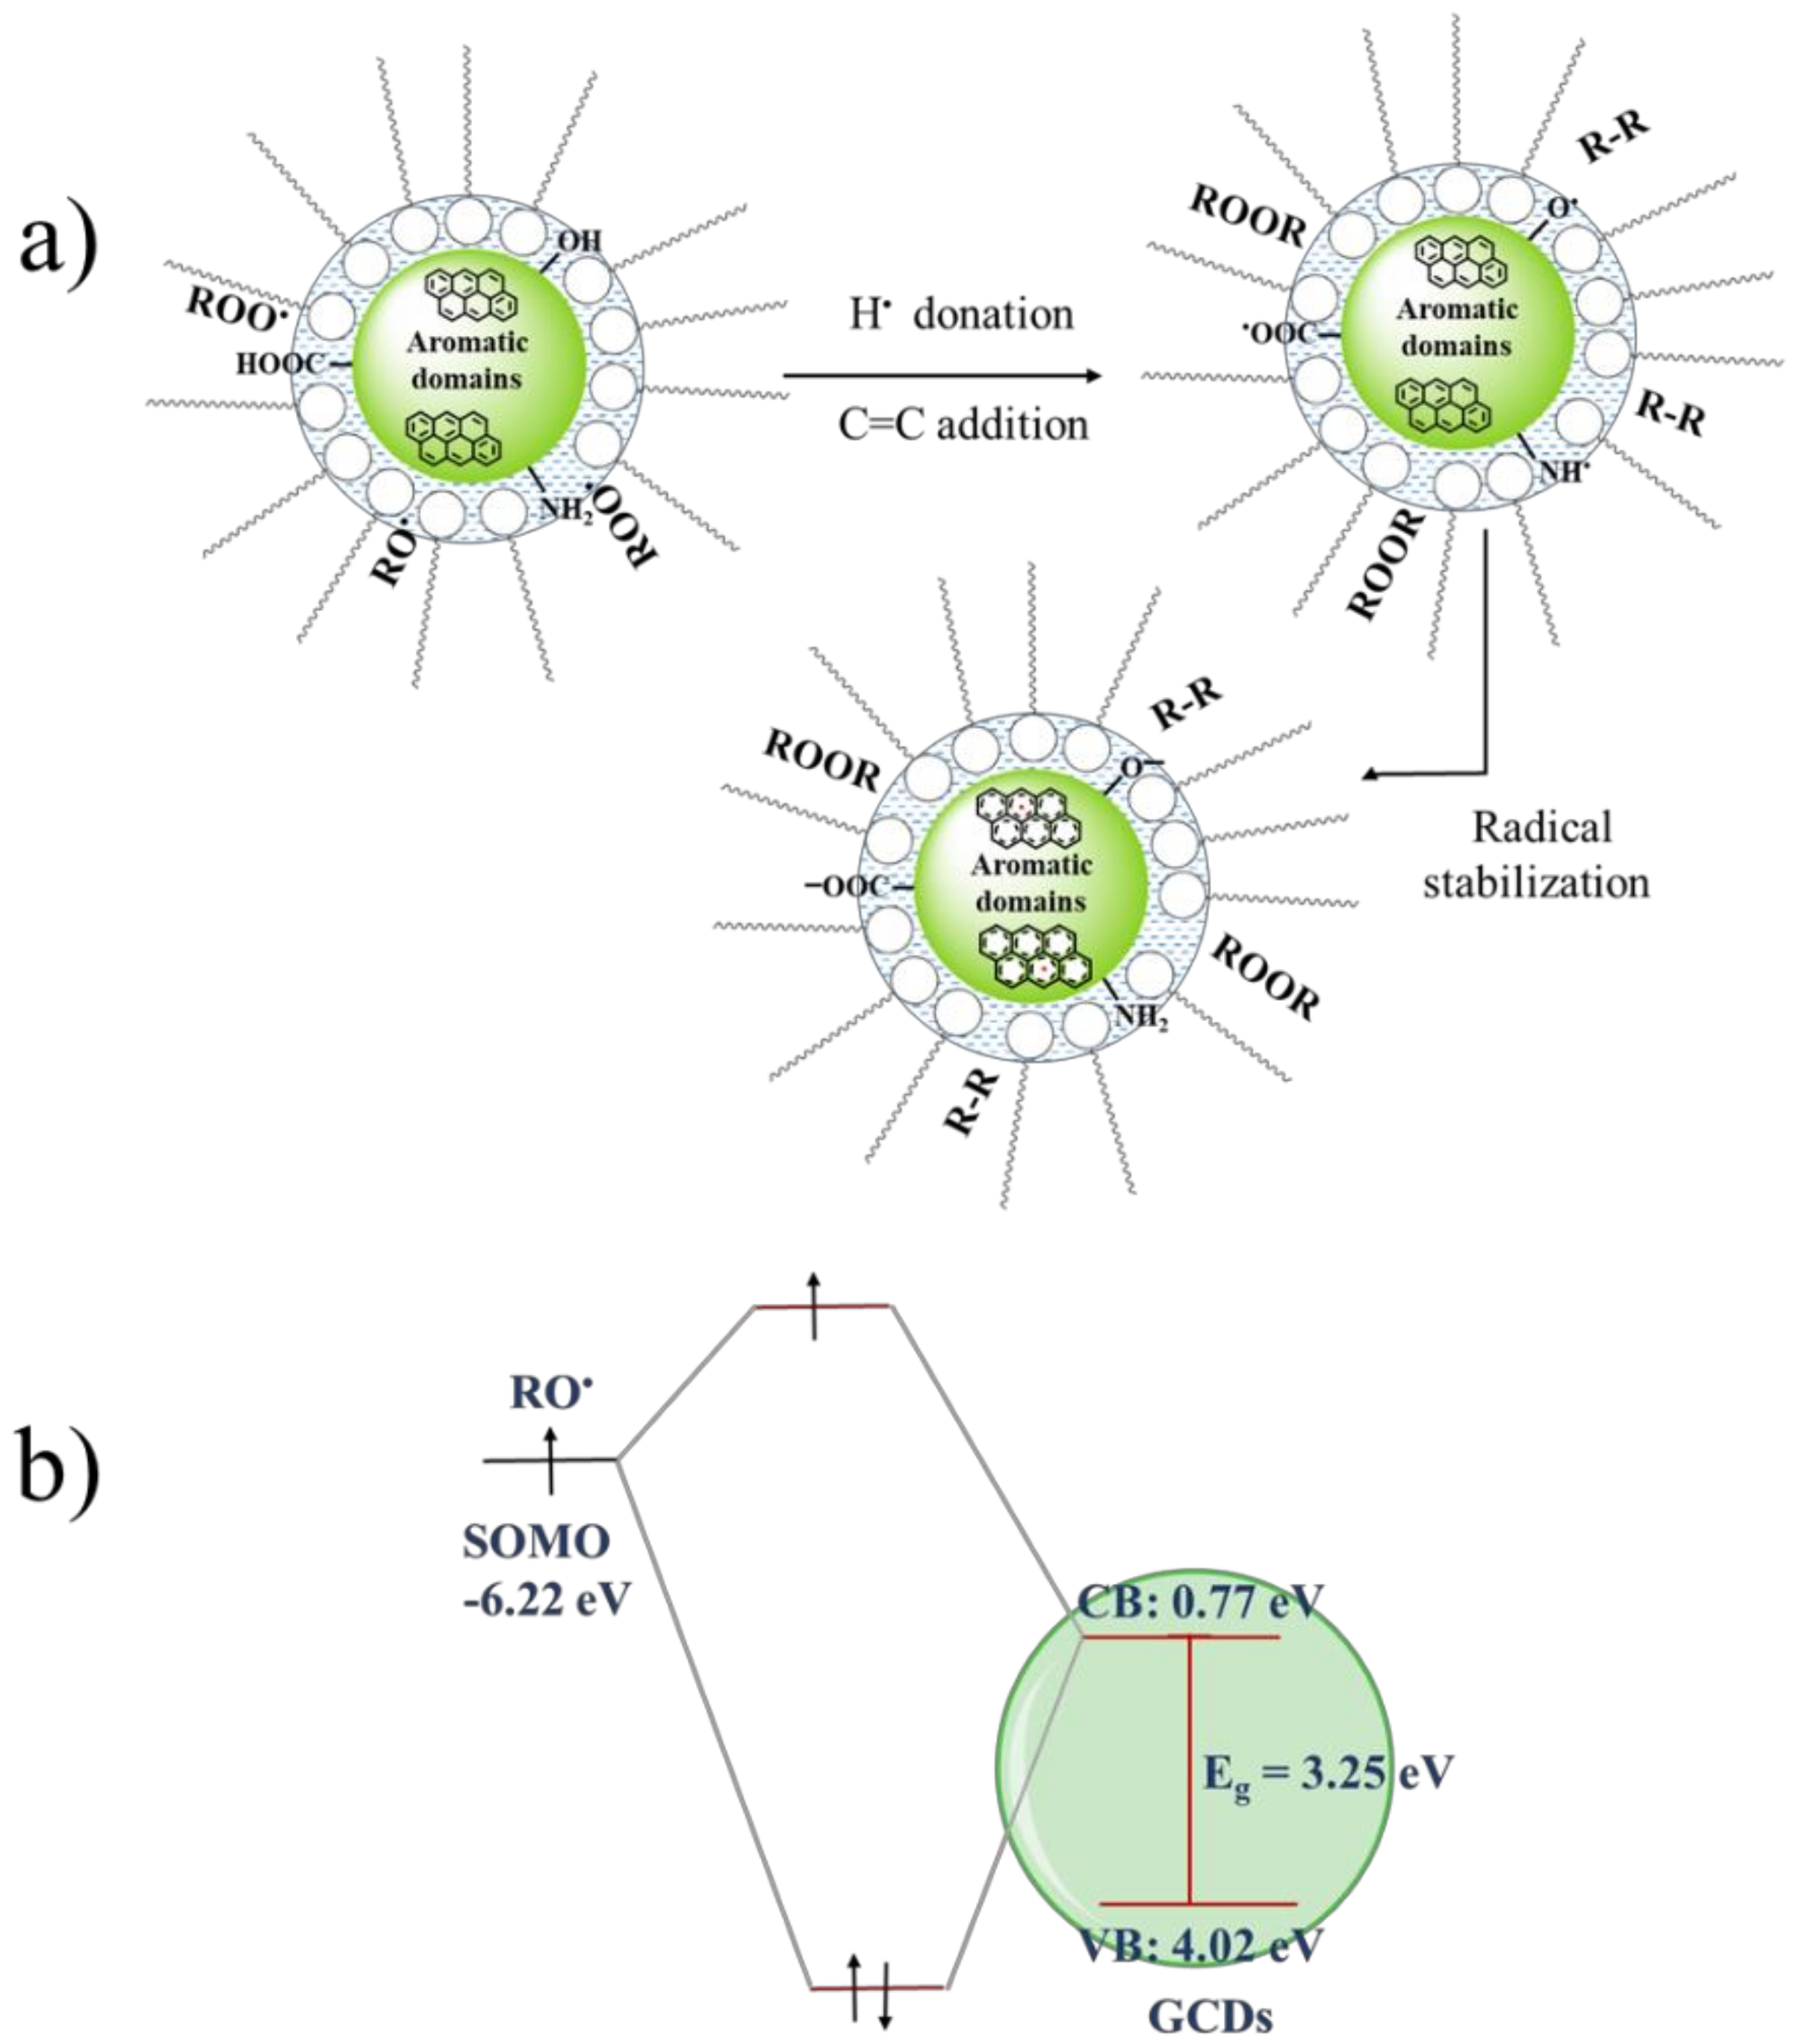
3.7. Application of Carbon Dots as Antioxidant Additives in Non-Aqueous Media
4. Conclusions
Supplementary Materials
Author Contributions
Funding
Acknowledgments
Conflicts of Interest
References
- Xu, D.; Lin, Q.; Chang, H.T. Recent Advances and Sensing Applications of Carbon Dots. Small Methods 2019, 1900387. [Google Scholar] [CrossRef]
- Kasouni, A.; Chatzimitakos, T.; Stalikas, C. Bioimaging Applications of Carbon Nanodots: A Review. C J. Carbon R. 2019, 5, 19. [Google Scholar] [CrossRef]
- Tu, Z.; Hu, E.; Wang, B.; David, K.D.; Seeger, P.; Moneke, M.; Stengler, R.; Hu, K.; Hu, X. Tribological behaviors of Ni-modified citric acid carbon quantum dot particles as green additive in polyethylene glycol. Friction 2019, 8, 182–197. [Google Scholar] [CrossRef]
- Chu, K.W.; Lee, S.L.; Chang, C.J.; Liu, L. Recent Progress of Carbon Dot Precursors and Photocatalysis Applications. Polymers 2019, 11, 689. [Google Scholar] [CrossRef]
- Huq, R.; Samuel, E.L.G.; Sikkema, W.K.A.; Nilewski, L.G.; Lee, T.; Tanner, M.R.; Khan, F.S.; Porter, P.C.; Tajhya, R.B.; Patel, R.S.; et al. Preferential uptake of antioxidant carbon nanoparticles by T lymphocytes for immunomodulation. Sci. Rep. 2016, 6, 33808. [Google Scholar] [CrossRef]
- Rizzo CArcudi, F.; Dordevic, L.; Dintcheva, N.T.; Noto, R.; D’Anna, F.; Prato, M. Nitrogen-Doped Carbon Nanodots-Ionogels: Preparation, Characterization, and Radical Scavenging Activity. ACS Nano 2018, 12, 1296–1305. [Google Scholar] [CrossRef]
- Huang, G.; Lin, Y.; Zhang, L.; Yan, Z.; Wang, Y.; Liu, Y. Synthesis of Sulfur-Selenium Doped Carbon Quantum Dots for Biological Imaging and Scavenging Reactive Oxygen Species. Sci. Rep. 2019, 9, 19651. [Google Scholar] [CrossRef]
- Wang, Y.; Sun, J.; He, B.; Feng, M. Synthesis and modification of biomass derived carbon dots in ionic liquids and their application: A mini review. Green Chem. Eng. 2020. [Google Scholar] [CrossRef]
- Meng, W.; Bai, X.; Wang, B.; Liu, Z.; Lu, S.; Yang, B. Biomass-Derived Carbon Dots and Their Applications. Energy Environ. Mater. 2019, 2, 172–192. [Google Scholar] [CrossRef]
- Thangaraj, B.; Solomon, P.R.; Ranganathan, S. Synthesis of Carbon Quantum Dots with Special Reference to Biomass as a Source—A review. Curr. Pharm. Design. 2019, 25, 1455–1476. [Google Scholar] [CrossRef]
- Verhagen, A.; Kelarakis, A. Carbon Dots for Forensic Applications: A Critical Review. Nanomaterials 2020, 10, 1535. [Google Scholar] [CrossRef] [PubMed]
- Zhao, S.; Lan, M.; Zhu, X.; Xue, H.; Ng, T.W.; Meng, X.; Lee, C.S.; Wang, P.; Zhang, W. Green Synthesis of Bifunctional Fluorescent Carbon Dots from Garlic for Cellular Imaging and Free Radical Scavenging. ACS Appl. Mater. Interfaces 2015, 7, 17054–17060. [Google Scholar] [CrossRef] [PubMed]
- Sachdev, A.; Gopinath, P. Green synthesis of multifunctional carbon dots from coriander leaves and their potential application as antioxidants, sensors and bioimaging agents. Analyst 2015, 140, 4260–4269. [Google Scholar] [CrossRef] [PubMed]
- Chunduri, L.A.; Kurdekar, A.; Patnaik, S.; Dev, B.V.; Rattan, T.M.; Kamisetti, V. Carbon Quantum Dots from Coconut Husk: Evaluation for Antioxidant and Cytotoxic Activity. Mater. Focus 2016, 5, 55–61. [Google Scholar] [CrossRef]
- Chunduri, L.A.; Kurdekar, A.; Patnaik, S.; Rajasekhar Aditha, S.; Prathibha, C.; Kamisetti, V. Single Step Synthesis of Carbon Quantum Dots from Coconut Shell: Evaluation for Antioxidant Efficacy and Hemotoxicity. J. Mater. Sci. Appl. 2017, 3, 83–93. [Google Scholar]
- Li, F.; Li, T.; Sun, C.; Xia, J.; Jiao, Y.; Xu, H. Selenium-Doped Carbon Quantum Dots for Free-Radical Scavenging. Angew. Chem. 2017, 129, 9910–9914. [Google Scholar] [CrossRef]
- Zou, S.; Zhu, X.; Zhang, L.; Guo, F.; Zhang, M.; Tan, Y.; Gong, A.; Fang, Z.; Ju, H.; Wu, C.; et al. Biomineralization-Inspired Synthesis of Cerium-Doped Carbonaceous Nanoparticles for Highly Hydroxyl Radical Scavenging Activity. Nanoscale Res. Lett. 2018, 13, 76. [Google Scholar] [CrossRef]
- Chen, K.; Qing, W.; Hu, W.; Lu, M.; Wang, Y.; Liu, X. On-off-on fluorescent carbon dots from waste tea: Their properties, antioxidant and selective detection of CrO4 2−, Fe3+, ascorbic acid and L-cysteine in real samples Spectrochim. Acta Part A Mol. Biomol. Spectr. 2019, 213, 228–234. [Google Scholar] [CrossRef]
- Lin, J.S.; Tsai, Y.W.; Dehvari, K.; Huang, C.C.; Chang, J.Y. A carbon dot based theranostic platform for dual modal imaging and free radical scavenging. Nanoscale 2019, 11, 20917. [Google Scholar] [CrossRef]
- Lu, F.; Yang, S.; Song, Y.; Zhai, C.; Wang, Q.; Ding, G.; Kang, Z. Hydroxyl functionalized carbon dots with strong radical scavenging ability promote cell proliferation. Mater. Res. Express 2019, 6, 065030. [Google Scholar] [CrossRef]
- Roshni, V.; Gujar, V.; Pathan HIslam, S.; Tawre, M.; Pardesi, K.; Santra, M.K.; Otoor, D. Bioimaging Applications of Carbon dots (C. dots) and its Cystamine Functionalization for the Sensitive Detection of Cr(VI) in Aqueous Samples. J. Fluor. 2019, 29, 1381–1392. [Google Scholar] [CrossRef]
- Bayat, A.; Masoum, S.; Hosseini, E.S. Natural plant precursor for the facile and eco-friendly synthesis of carbon nanodots with multifunctional aspects. J. Mol. Liq. 2019, 281, 134–140. [Google Scholar] [CrossRef]
- Yang, D.; Li, L.; Cao, L.; Chang, Z.; Mei, Q.; Yan, R.; Ge, M.; Jiang, C.; Dong, W.F. Green Synthesis of Lutein-Based Carbon Dots Applied for Free-Radical Scavenging within Cells. Materials 2020, 13, 4146. [Google Scholar] [CrossRef] [PubMed]
- Zou, S.; Guo, F.; Wu, L.; Ju, H.; Sun, M.; Cai, R.; Xu, L.; Gong, Y.; Gong, A.; Zhang, M.; et al. One-pot synthesis of cerium and praseodymium co-doped carbon quantum dots as enhanced antioxidant for hydroxyl radical scavenging. Nanotechnology 2020, 31, 165101. [Google Scholar] [CrossRef] [PubMed]
- Choe, E.; Min, D.B. Mechanisms and Factors for Edible Oil Oxidation. Compr. Rev. Food Sci. Food Saf. 2006, 5, 168–186. [Google Scholar] [CrossRef]
- Gayen, B.; Palchoudhury, S.; Chowdhury, J. Carbon Dots: A Mystic Star in the World of Nanoscience. J. Nanomat. 2019. [Google Scholar] [CrossRef]
- Díaz-Faes López, T.; Fernández González, A.; Díaz-García, M.E.; Badía-Laíño, R. Highly efficient Förster resonance energy transfer between carbon nanoparticles and europium–tetracycline complex. Carbon 2015, 94, 142–151. [Google Scholar] [CrossRef]
- Zhuo, Y.; Miao, H.; Zhong, D.; Zhu, S.; Yang, X. One-step synthesis of high quantum-yield and excitation-independent emission carbon dots for cell imaging. Mat. Lett. 2015, 139, 197–200. [Google Scholar] [CrossRef]
- Wang, H.; Zhang, M.L.; Ma, Y.; Wang, B.; Huang, H.; Liu, Y.; Shao, M.; Kang, Z. Carbon Dots Derived from Citric Acid and Glutathione as a Highly Efficient Intracellular Reactive Oxygen Species Scavenger for Alleviating the Lipopolysaccharide-Induced Inflammation in Macrophages. ACS Appl. Mater. Interfaces 2020, 12, 41088–41095. [Google Scholar] [CrossRef]
- Wilson, N.; Pandey, P.A.; Beanland, R.; Young, R.J.; Kinloch, I.A.; Gong, L.; Liu, Z.; Suenaga, K.; Rourke, J.P.; York, S.J.; et al. Graphene Oxide: Structural Analysis and Application as a Highly Transparent Support for Electron Microscopy. ACS Nano 2009, 3, 2547–2556. [Google Scholar] [CrossRef]
- Li, B.; Nan, Y.; Zhang, P.; Song, X. Structural characterization of individual graphene sheets formed by arc discharge and their growth mechanisms. RSC Adv. 2016, 6, 19797–19806. [Google Scholar] [CrossRef]
- Zarrinbakhsh, N.; Wang, T.; Rodriguez-Uribe, A.; Misra, M.; Mohanty, A.K. Characterization of wastes and coproducts from the coffee industry for composite material production. BioResources 2016, 11, 7637–7653. [Google Scholar] [CrossRef]
- Zarrinbakhsh, N.; Mohanty, A.K.; Misra, M. Fundamental studies on water-washing of the corn ethanol coproduct (DDGS) and its characterization for biocomposite applications. Biomass Bioenergy 2013, 55, 251–259. [Google Scholar] [CrossRef]
- Díez-Pascual, A.M.; Díez-Vicente, A.L. Poly(propylene fumarate)/polyethylene glycol-modified graphene oxide nanocomposites for tissue engineering. ACS Appl. Mater. Interfaces 2016, 8, 7902–17914. [Google Scholar] [CrossRef] [PubMed]
- Luceño-Sánchez, J.A.; Maties, G.; González-Arellano, C.; Díez-Pascual, A.M. Synthesis and Characterization of Graphene Oxide Derivatives via Functionalization Reaction with Hexamethylene Diisocyanate. Proceedings 2019, 3, 8. [Google Scholar] [CrossRef]
- Wood, D.; Tauc, J. Weak Absorption Tails in Amorphous Semiconductors. Phys. Rev. B 1972, 5, 3144–3151. [Google Scholar] [CrossRef]
- Pan, Y.; Inam, F.; Zhang, M.; Drabold, D.A. Atomistic Origin of Urbach Tails in Amorphous Silicon. Phys. Rev. Lett. 2008, 100, 206403. [Google Scholar] [CrossRef]
- Studenyak, I.P.; Kranjčec, M.; Kurik, M. Urbach Rule in Solid State Physics. Int. J. Optics Appl. 2014, 4, 76–83. [Google Scholar] [CrossRef]
- Mintz, K.J.; Zhou, Y.; Leblanc, R.M. Recent development of carbon quantum dots regarding their optical properties, photoluminescence mechanism, and core structure. Nanoscale 2019, 11, 4634–4652. [Google Scholar] [CrossRef]
- Xia, C.; Zhu, S.; Feng, T.; Yang, M.; Yang, B. Evolution and Synthesis of Carbon Dots: From Carbon Dots to Carbonized Polymer Dots. Adv. Sci. 2019, 6, 1901316. [Google Scholar] [CrossRef]
- Begheri, Z.; Ehtesabi, H.; Rahmandoust, M.; Ahadian, M.M.; Hallaji, Z.; Eskandari, F.; Jokar, E. New Insight into the Concept of Carbonization Degree in Synthesis of Carbon Dots to Achieve Facile Smartphone Based Sensing Platform. Sci. Rep. 2017, 7, 11013. [Google Scholar] [CrossRef] [PubMed]
- Liu, F.; Sun, Y.; Zheng, Y.; Tang, N.; Li, M.; Zhong, W.; Du, Y. Gram-scale synthesis of high-purity graphene quantum dots with multicolour photoluminescence. RSC Adv. 2015, 5, 103428–103432. [Google Scholar] [CrossRef]
- Tang, J.; Zhang, J.; Zhang, Y.; Xiao, Y.; Shi, Y.; Chen, Y.; Ding, L.; Xu, W. Influence of group modification at the edges of carbon quantum dots on fluorescent emission. Nanoscale Res. Lett. 2019, 14, 241. [Google Scholar] [CrossRef] [PubMed]
- Zhu, S.; Meng, Q.; Wang, L.; Zhang, J.; Song, Y.; Jin, H.; Zhang, K.; Sun, H.; Wang, H.; Yang, B. Highly Photoluminescent Carbon Dots for Multicolor Patterning, Sensors and Bioimaging. Angew. Chem. Int. Ed. 2013, 52, 3953–3957. [Google Scholar] [CrossRef] [PubMed]
- Carbonaro, C.M.; Corpino, R.; Salis, M.; Mocci, F.; Thakkar, S.V.; Olla, C.; Ricci, P.C. On the Emission Properties of Carbon Dots: Reviewing Data and Discussing Models. J. Carbon Res. 2019, 5, 60. [Google Scholar] [CrossRef]
- Hsu, P.C.; Chang, H.T. Synthesis of High-quality Carbon Nano Dots from Hydrophilic Compounds: Role of Functional Groups. Chem. Commun. 2012, 48, 3984–3986. [Google Scholar] [CrossRef]
- Sánchez-Rangel, J.C.; Benavides, J.; Heredia, J.B.; Cisneros-Zevallos, L.; Jacobo-Velázquez, D.A. The Folin-Ciocalteu assay revisited: Improvement of its specificity for total phenolic content determination. Anal. Methods 2013, 5, 5990–5999. [Google Scholar] [CrossRef]
- Afsar, T.; Razak, S.; Khan, M.R.; Mawash, S.; Almajwal, A.; Shabir, M.; Haq, I.U. Evaluation of antioxidant, anti-hemolytic and anticancer activity of various solvent extracts of Acacia hydaspica R. Parker aerial parts. BMC Complement. Altern. Med. 2016, 16, 258. [Google Scholar] [CrossRef]
- Shen, C.Z.; Jun, H.Y.; Choi, S.H.; Kim, Y.M.; Jung, E.J.; Oh, G.S.; Joo, S.J.; Kim, S.H.; Kim, I.K. Evaluation of Antioxidant Activities and Active Compounds Separated from Water Soluble Extracts of Korean Black Pine Barks. Bull. Korean Chem. Soc. 2010, 31, 3567–3572. [Google Scholar] [CrossRef]
- Rebelo, M.M.; Da Silva, J.K.R.; Andrade, E.H.A.; Maia, J.G.S. Antioxidant capacity and biological activity of essential oil and methanol extract of Hyptis crenata Pohl ex Benth. Rev. Bras. Farmacogn. 2019, 19, 230–235. [Google Scholar] [CrossRef]
- Amiri, H. Antioxidant Activity of the Essential Oil and Methanolic Extract of Teucrium orientale (L.) subsp. Taylori (Boiss.) Rech. f. Iran. J. Pharm. Res. 2010, 9, 417–423. [Google Scholar] [PubMed]
- Bellik, Y.; Benabdesselam, F.; Ayad, A.; Dahmani, Z.; Boukraâ, L.; Nemmar, A.; Iguer-Ouada, M. Antioxidant activity of the essential oil and oleoresin of Zingiber officinale roscoe as affected by chemical environment. Int. J. Food. Prop. 2013, 16, 1304–1313. [Google Scholar] [CrossRef]
- Eissa, E.A.; Basta, J.S.; Ibrahim, V. The Oxidation Stability of Lubricating Oil. Pet. Sci. Technol. 2010, 28, 1611–1619. [Google Scholar] [CrossRef]
- ISO 27107:2008. Corrected version 2009-05-15. Animal and Vegetable Fats and Oils. Determination of Peroxide Value. Potentiometric End-Point Determination. Available online: https://webstore.ansi.org/standards/din/dineniso271072010 (accessed on 17 November 2020).
- Crista, D.M.A.; Mragui, A.E.; Algarra, M.; Esteves da Silva, J.C.G.; Luque, R.; Pinto da Silva, L. Turning Spent Coffee Grounds into Sustainable Precursors for the Fabrication of Carbon Dots. Nanomaterials 2020, 10, 1209. [Google Scholar] [CrossRef]
- Christé, S.; Esteves da Silva, J.C.G.; Pinto da Silva, L. Evaluation of the Environmental Impact and Efficiency of N-Doping Strategies in the Synthesis of Carbon Dots. Materials 2020, 13, 504. [Google Scholar] [CrossRef]
- Sendão, R.; Martínez de Yuso, M.V.; Algarra, M.; Esteves da Silvaa, J.C.G.; Pinto da Silva, L. Comparative life cycle assessment of bottom-up synthesis routes for carbon dots derived from citric acid and urea. J. Clean. Prod. 2020, 254, 120080. [Google Scholar] [CrossRef]
- Chimeno-Trinchet, C.; Pacheco, M.E.; Fernández-González, A.; Díaz-García, M.E.; Badía-Laíño, R. New metal-free nanolubricants based on carbon-dots with outstanding antiwear performance. J. Ind. Eng. Chem. 2020, 87, 152–161. [Google Scholar] [CrossRef]
- Casado, J.E.; Fernández-González, A.; Díaz-García, M.E.; Badía-Laíño, R. Smart carbon dots as additive and chemosensor for control water contamination in lubricants. Sens. Actuators B. (under review).
- IMCA. Understanding Biodegradable Lubricants: An Introduction to “Green” Oil in Hydraulic Systems Offshore; International Marine Contractors Association (IMCA): London, UK, 2014. [Google Scholar]
- Chaiyvaist, W.; McClements, D.J.; Weiss, J.; Decker, E.A. Impact of Surface-Active Compounds on Physicochemical and Oxidative Properties of Edible Oil. J. Agric. Food Chem. 2008, 56, 550–556. [Google Scholar] [CrossRef]
- Butler, M.A.; Ginley, D.S. Prediction of flatband potentials at semiconductor-electrolyte interfaces from atomic electronegativities. J. Electrochem. Soc. 1978, 125, 228–232. [Google Scholar] [CrossRef]
- Morrison, S.R. Electrochemistry at Semiconductor and Oxidized Metal Electrodes; Plenum Press: New York, NY, USA, 1980. [Google Scholar]
- Pearson, R.G. Absolute Electronegativity and Hardness: Application to Inorganic Chemistry. Inorg. Chem. 1988, 27, 734–740. [Google Scholar] [CrossRef]
- Buettner, G.R.; Jurkiewicz, B.A. Catalytic metals, ascorbate and free radicals: Combinations to avoid. Radiat. Res. 1996, 145, 532–541. [Google Scholar] [CrossRef] [PubMed]


| Carbon Precursor | Dopants | Synthesis Method | Methods | Application | EC50 μg mL−1 | Ref. |
|---|---|---|---|---|---|---|
| Garlic | - | HT 200 °C, 3 h Autoclave | DPPH Fenton | - | 80 | [13] |
| Coriander leaves | - | HT 240 °C, 4 h | DPPH | - | 15 | [14] |
| Coconut husk | - | HT 200 °C, 3 h. Autoclave | DPPH | - | 60 | [15] |
| Coconut shell | - | HT 200 °C, 3 h Autoclave | DPPH | - | 25 | [16] |
| Selenocystine | - | HT 60 °C, 24 h | ESRS DEMPO | MDA-MB-231 cells viability | - | [17] |
| BSA | Ce(NO3)3·6H2O | Bio-mineralization pH 12, 55 °C, 8 h | Methyl Violet | VSMC and 7721 cells viability | - | [18] |
| Tea waste | Ethylene-diamine | HT 150 °C | Fenton Pyrogallol | - | 80 (hydroxyl radical), 24.2 (superoxide radical) | [19] |
| 1,4-phenylene- diamine | Phosphoric acid + Mn(OAc)2 | HT 220 °C, 10 min Microwave | DPPH Fenton NBT enzymatic | B15F1, HeLa and HEL cells viability | 6.55 (DPPH) 6.44 (•OH) 4.30 (O2•−) | [20] |
| Phloroglucinol + phenol | - | HT 260 °C, 5 h Autoclave | Fenton | rADSC cells viability | - | [21] |
| Citric acid | Mercapto-ethylamine + sodium selenite | HT 150 °C, 2.5 h | DPPH Fenton DTNB | - | - | [7] |
| Cumin seeds | - | HT 250 °C, 6 h Autoclave | DPPH | - | 1.2 | [22] |
| Thymus vulgaris L. essential oil | - | HT 200 °C, 15 h Autoclave | DPPH | - | 23.43 | [23] |
| Lutein | Ethylene-diamine | HT 140 °C, 12 h Autoclave | DPPH ROSUP DCFH-DA | NCI-H1299 cells viability | - | [24] |
| EDTA | Ce(NO3)3·6H2O Pr(NO3)3·6H2O | HT 200 °C, 8 h | Fenton ESRS | MEF and PATU 8988 cells viability | - | [25] |
| Carbon Dots | Bandgap, eV | Urbach Energy, meV | λexc, nm | λem, nm | Δλ, nm | QY, % |
|---|---|---|---|---|---|---|
| GCDs | 3.25 | 337 | 350 | 418 | - | 55.7 |
| TCDs | 3.50 | 626 | 350 | 430 | Δλem = 22 | 4.50 |
| P1CDs | 3.90 | 583 | 350 | 423 | Δλem = 5 | 2.76 |
| P2CDs | 3.10 | 486 | 318 | 440 | Δλex = 32 Δλem = 10 | 0.65 |
| Antioxidant Material | Synthesis Method | EC50 μg mL−1 | Ref. |
|---|---|---|---|
| Coconut husk-CDs | HT 200 °C, 3 h. Autoclave | 60 | [15] |
| Coconut Shell-CDs | HT 200 °C, 3 h Autoclave | 25 | [16] |
| Ascorbic acid | Pure compound | 15.0 | [49] |
| Vitamin E | Pure compound | 13.58 | [50] |
| HcEd * | Methanol extraction | 16.7 | [51] |
| Essential oil of Teucrium orientale subsp. taylori | Hydrodistillation extraction | 121.60 | [52] |
| Ginger essential oil | Hydrodistillation extraction | 11,680 | [53] |
| TCDs | HT 200 °C, 6 h Oven | 50 | This work |
| P2CDs | HT 180 °C, 4 h Oven | 75 | |
| GCDs | HT 180 °C, 5 h Oven | 175 |
Publisher’s Note: MDPI stays neutral with regard to jurisdictional claims in published maps and institutional affiliations. |
© 2020 by the authors. Licensee MDPI, Basel, Switzerland. This article is an open access article distributed under the terms and conditions of the Creative Commons Attribution (CC BY) license (http://creativecommons.org/licenses/by/4.0/).
Share and Cite
Murru, C.; Badía-Laíño, R.; Díaz-García, M.E. Synthesis and Characterization of Green Carbon Dots for Scavenging Radical Oxygen Species in Aqueous and Oil Samples. Antioxidants 2020, 9, 1147. https://doi.org/10.3390/antiox9111147
Murru C, Badía-Laíño R, Díaz-García ME. Synthesis and Characterization of Green Carbon Dots for Scavenging Radical Oxygen Species in Aqueous and Oil Samples. Antioxidants. 2020; 9(11):1147. https://doi.org/10.3390/antiox9111147
Chicago/Turabian StyleMurru, Clarissa, Rosana Badía-Laíño, and Marta Elena Díaz-García. 2020. "Synthesis and Characterization of Green Carbon Dots for Scavenging Radical Oxygen Species in Aqueous and Oil Samples" Antioxidants 9, no. 11: 1147. https://doi.org/10.3390/antiox9111147
APA StyleMurru, C., Badía-Laíño, R., & Díaz-García, M. E. (2020). Synthesis and Characterization of Green Carbon Dots for Scavenging Radical Oxygen Species in Aqueous and Oil Samples. Antioxidants, 9(11), 1147. https://doi.org/10.3390/antiox9111147