Recovery of Polyphenols from Brewer’s Spent Grains


Abstract
:1. Introduction
2. Materials and Methods
2.1. Materials and Chemicals
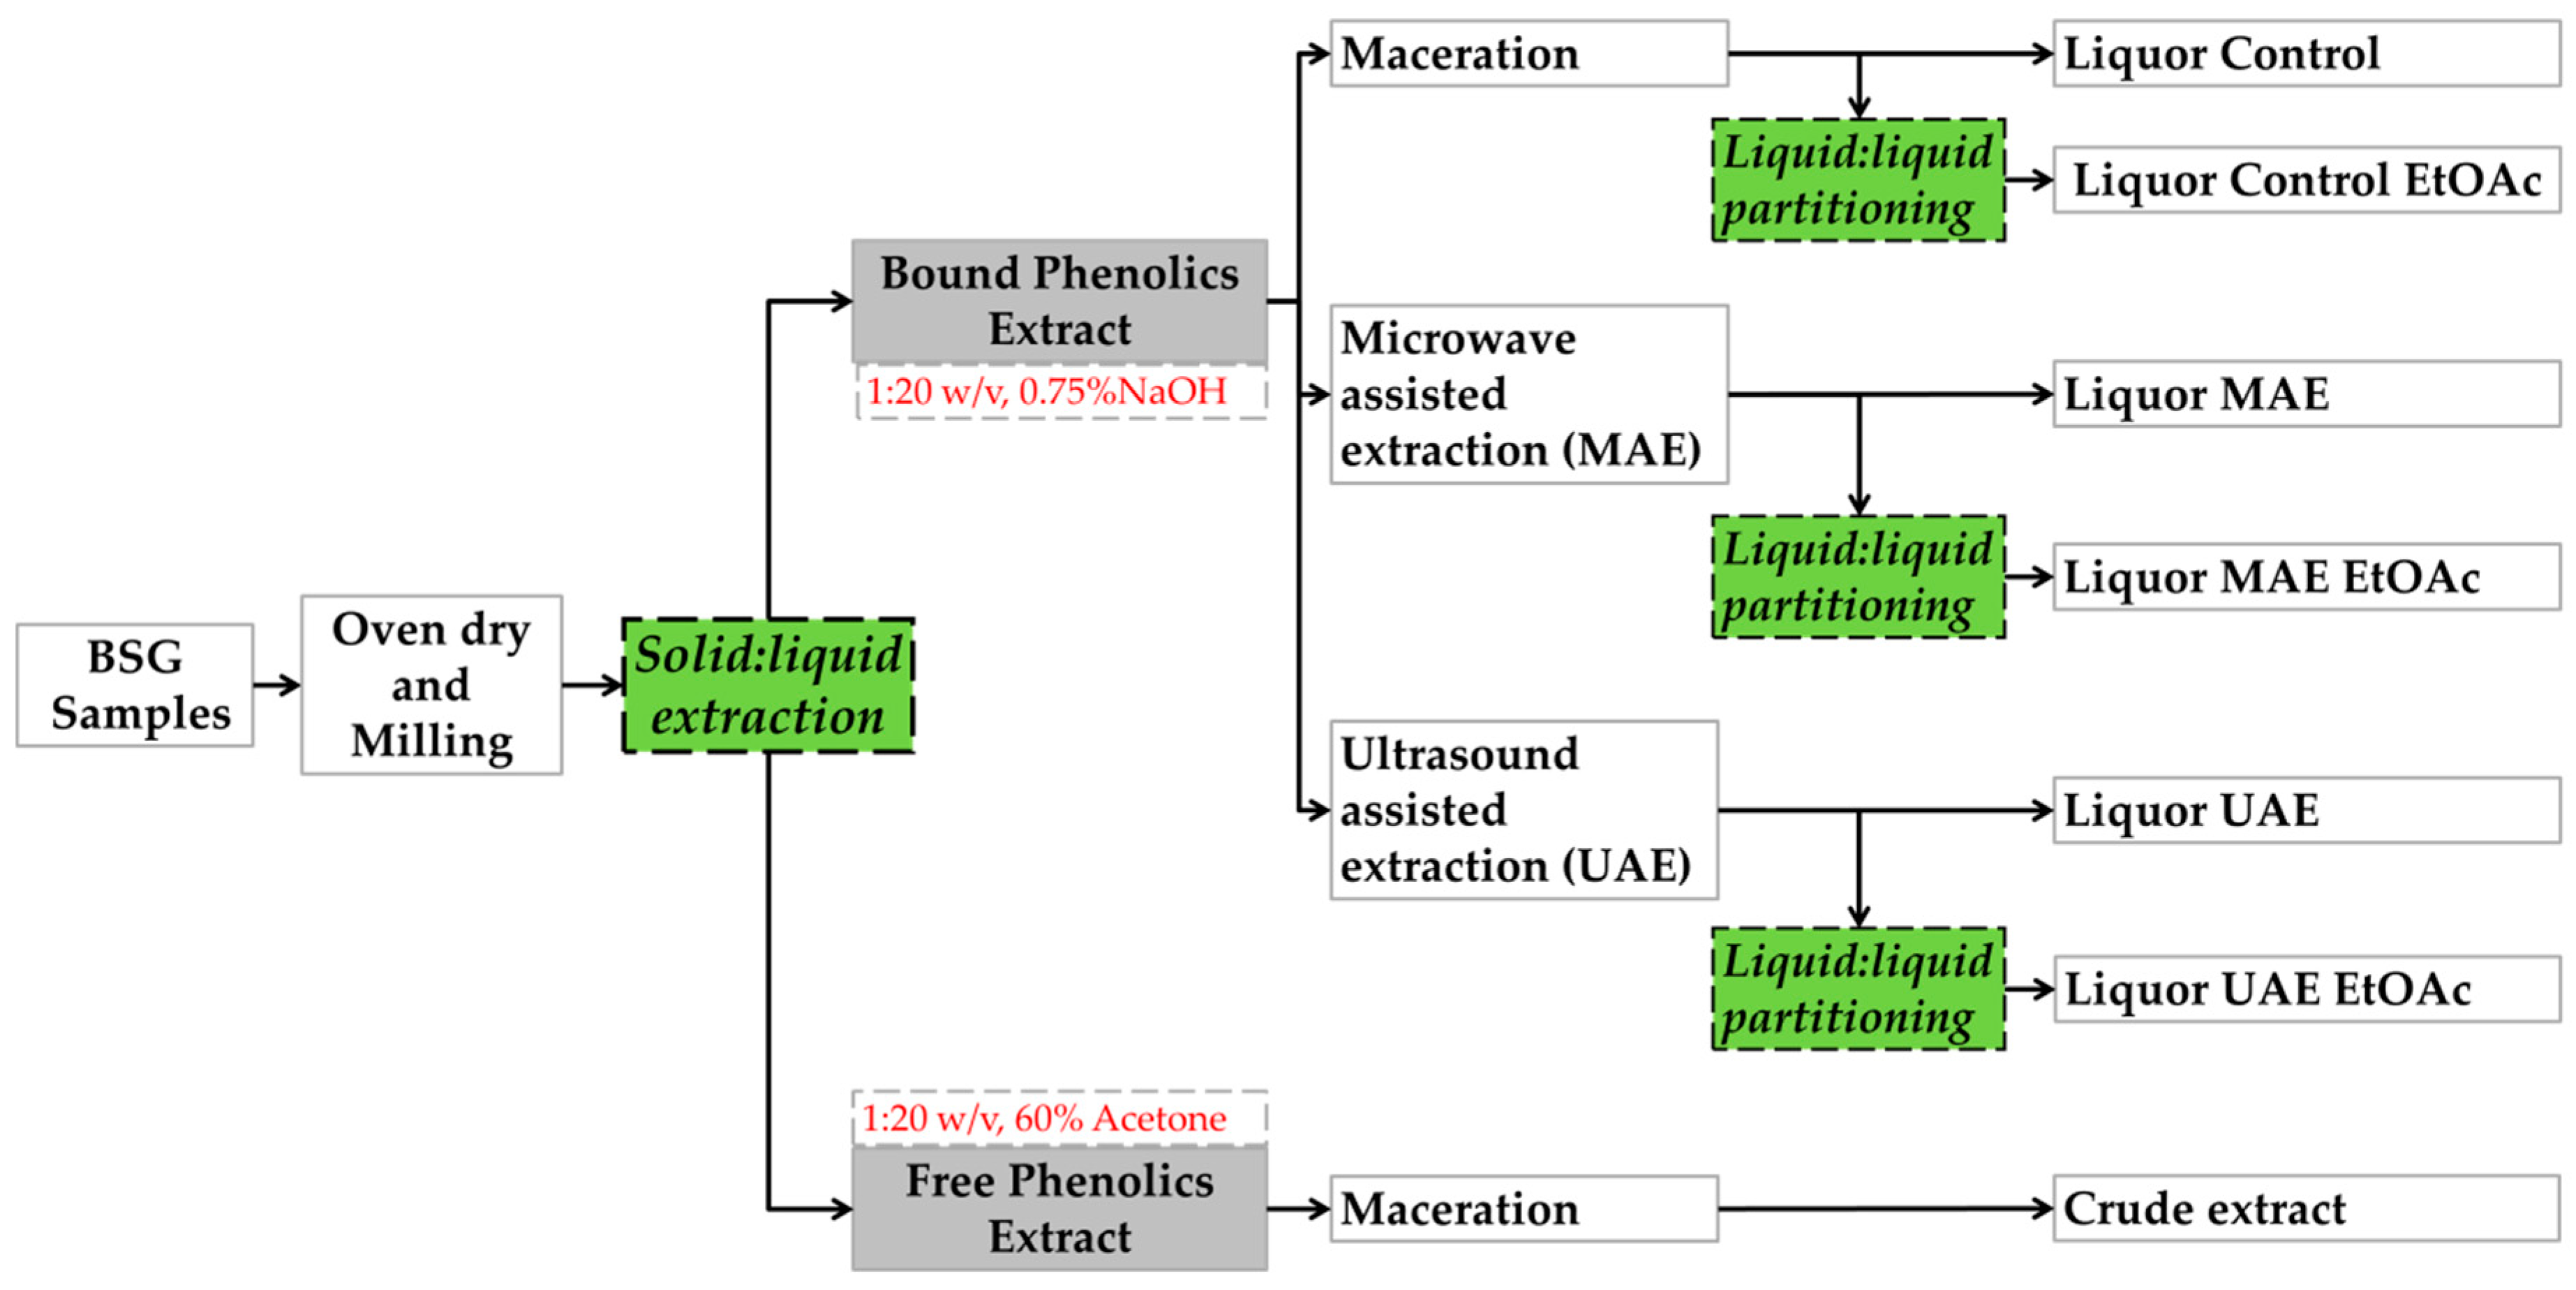
2.2. Solid-Liquid Extraction
2.3. Microwave Assisted Extraction
2.4. Ultrasound Assisted Extraction
2.5. Preparation of Samples Following Maceration, MAE and UAE Treatments
2.6. Total Phenolic Content Assay
2.7. LC-MS/MS Identification and Quantification of BSG Phenolic Compounds
2.8. Statistical Analysis
3. Results and Discussion
3.1. Total Phenolic Content
3.2. LC-MS/MS Identification of BSG Polyphenols
3.3. UPLC-MS/MS Quantification of BSG Polyphenols
4. Conclusions
Supplementary Materials
Author Contributions
Funding
Acknowledgments
Conflicts of Interest
References
- Statista. Beer Production Worldwide from 1998 to 2017 (in Billion Hectoliters). 2019. Available online: https://www.statista.com/statistics/270275/worldwide-beer-production/ (accessed on 20 February 2018).
- TBOE. Beer Statistics—2018 Edition. 2019. Available online: https://brewersofeurope.org/site/media-centre/key-facts-figures.php (accessed on 4 June 2019).
- Lynch, K.M.; Steffen, E.J.; Arendt, E.K. Brewers’ spent grain: A review with an emphasis on food and health. J. Inst. Brew. 2016, 122, 553–568. [Google Scholar] [CrossRef]
- Jay, A.J.; Parker, M.L.; Faulks, R.; Husband, F.; Wilde, P.; Smith, A.C.; Faulds, C.B.; Waldron, K.W. A systematic micro-dissection of brewers’ spent grain. J. Cereal Sci. 2008, 47, 357–364. [Google Scholar] [CrossRef]
- Shahidi, F.; Yeo, J. Bioactivities of phenolics by focusing on suppression of chronic diseases: A review. Int. J. Mol. Sci. 2018, 19, 1573. [Google Scholar] [CrossRef] [PubMed]
- Brglez Mojzer, E.; Knez Hrnčič, M.; Škerget, M.; Knez, Ž.; Bren, U. Polyphenols: Extraction methods, antioxidative action, bioavailability and anticarcinogenic effects. Molecules 2016, 21, 901. [Google Scholar] [CrossRef] [PubMed]
- Guido, L.F.; Moreira, M.M. Techniques for extraction of brewer’s spent grain polyphenols: A review. Food Bioprocess Technol. 2017, 10, 1192–1209. [Google Scholar] [CrossRef]
- Krygier, K.; Sosulski, F.; Hogge, L. Free, esterified, and insoluble-bound phenolic acids. 1. Extraction and purification procedure. J. Agric. Food Chem. 1982, 30, 330–334. [Google Scholar] [CrossRef]
- Sancho, A.I.; Bartolomé, B.; Gómez-Cordovés, C.; Williamson, G.; Faulds, C.B. Release of ferulic acid from cereal residues by barley enzymatic extracts. J. Cereal Sci. 2001, 34, 173–179. [Google Scholar] [CrossRef]
- Mussatto, S.I.; Dragone, G.; Roberto, I.C. Ferulic and p-coumaric acids extraction by alkaline hydrolysis of brewer’s spent grain. Ind. Crop Prod. 2007, 25, 231–237. [Google Scholar] [CrossRef]
- Bartolomé, B.; Faulds, C.B.; Williamson, G. Enzymic release of ferulic acid from barley spent grain. J. Cereal Sci. 1997, 25, 285–288. [Google Scholar] [CrossRef]
- Kumari, B.; Tiwari, B.K.; Hossain, M.B.; Brunton, N.P.; Rai, D.K. Recent advances on application of ultrasound and pulsed electric field technologies in the extraction of bioactives from agro-industrial by-products. Food Bioprocess Technol. 2018, 11, 223–241. [Google Scholar] [CrossRef]
- Naczk, M.; Shahidi, F. Phenolics in cereals, fruits and vegetables: Occurrence, extraction and analysis. J. Pharm. Biomed. Anal. 2006, 41, 1523–1542. [Google Scholar] [CrossRef] [PubMed]
- Moreira, M.M.; Morais, S.; Barros, A.A.; Delerue-Matos, C.; Guido, L.F. A novel application of microwave-assisted extraction of polyphenols from brewer’s spent grain with HPLC-DAD-MS analysis. Anal. Bioanal. Chem. 2012, 403, 1019–1029. [Google Scholar] [CrossRef] [PubMed]
- Carciochi, R.A.; Sologubik, C.A.; Fernández, M.B.; Manrique, G.D.; D’Alessandro, L.G. Extraction of antioxidant phenolic compounds from brewer’s spent grain: Optimization and kinetics modeling. Antioxidants 2018, 7, 45. [Google Scholar] [CrossRef] [PubMed]
- Meneses, N.G.T.; Martins, S.; Teixeira, J.A.; Mussatto, S.I. Influence of extraction solvents on the recovery of antioxidant phenolic compounds from brewer’s spent grains. Sep. Purif. Technol. 2013, 108, 152–158. [Google Scholar] [CrossRef]
- Irakli, M.; Kleisiaris, F.; Kadoglidou, K.; Katsantonis, D. Optimizing extraction conditions of free and bound phenolic compounds from rice by-products and their antioxidant effects. Foods 2018, 7, 93. [Google Scholar] [CrossRef]
- Wang, J.; Sun, B.; Cao, Y.; Tian, Y.; Li, X. Optimisation of ultrasound-assisted extraction of phenolic compounds from wheat bran. Food Chem. 2008, 106, 804–810. [Google Scholar] [CrossRef]
- Fărcaş, A.; Tofana, M.; Socaci, S.; Scrob, S.; Salanta, L.-C.; Andrei, B. Preliminary study on antioxidant activity and polyphenols content in discharged waste from beer production. J. Agroaliment. Process. Technol. 2013, 19, 319–324. [Google Scholar]
- Piggott, C.O.; Connolly, A.; FitzGerald, R.J. Application of ultrafiltration in the study of phenolic isolates and melanoidins from pale and black brewers’ spent grain. Int. J. Food Sci. Technol. 2014, 49, 2252–2259. [Google Scholar] [CrossRef]
- Spinelli, S.; Conte, A.; Del Nobile, M.A. Microencapsulation of extracted bioactive compounds from brewer’s spent grain to enrich fish-burgers. Food Bioprod. Process. 2016, 100, 450–456. [Google Scholar] [CrossRef]
- Zuorro, A.; Iannone, A.; Lavecchia, R. Water–organic solvent extraction of phenolic antioxidants from brewers’ spent grain. Processes 2019, 7, 126. [Google Scholar] [CrossRef]
- Fărcaş, A.C.; Socaci, S.A.; Dulf, F.V.; Tofană, M.; Mudura, E.; Diaconeasa, Z. Volatile profile, fatty acids composition and total phenolics content of brewers’ spent grain by-product with potential use in the development of new functional foods. J. Cereal Sci. 2015, 64, 34–42. [Google Scholar] [CrossRef]
- McCarthy, A.L.; O’Callaghan, Y.C.; Connolly, A.; Piggott, C.O.; FitzGerald, R.J.; O’Brien, N.M. Phenolic extracts of brewers’ spent grain (BSG) as functional ingredients—Assessment of their DNA protective effect against oxidant-induced DNA single strand breaks in U937 cells. Food Chem. 2012, 134, 641–646. [Google Scholar] [CrossRef] [PubMed]
- Moreira, M.M.; Morais, S.; Carvalho, D.O.; Barros, A.A.; Delerue-Matos, C.; Guido, L.F. Brewer’s spent grain from different types of malt: Evaluation of the antioxidant activity and identification of the major phenolic compounds. Food Res. Int. 2013, 54, 382–388. [Google Scholar] [CrossRef]
- Stefanello, F.S.; dos Santos, C.O.; Bochi, V.C.; Fruet, A.P.B.; Soquetta, M.B.; Dörr, A.C.; Nörnberg, J.L. Analysis of polyphenols in brewer’s spent grain and its comparison with corn silage and cereal brans commonly used for animal nutrition. Food Chem. 2018, 239, 385–401. [Google Scholar] [CrossRef] [PubMed]
- Escarpa, A.; González, M.C. Approach to the content of total extractable phenolic compounds from different food samples by comparison of chromatographic and spectrophotometric methods. Anal. Chim. Acta 2001, 427, 119–127. [Google Scholar] [CrossRef]
- Sánchez-Rangel, J.C.; Benavides, J.; Heredia, J.B.; Cisneros-Zevallos, L.; Jacobo-Velázquez, D.A. The folin–ciocalteu assay revisited: Improvement of its specificity for total phenolic content determination. Anal. Methods 2013, 5, 5990–5999. [Google Scholar] [CrossRef]
- Granato, D.; Shahidi, F.; Wrolstad, R.; Kilmartin, P.; Melton, L.D.; Hidalgo, F.J.; Miyashita, K.; Camp, J.V.; Alasalvar, C.; Ismail, A.B.; et al. Antioxidant activity, total phenolics and flavonoids contents: Should we ban in vitro screening methods? Food Chem. 2018, 264, 471–475. [Google Scholar] [CrossRef] [PubMed]
- Harnly, J. Antioxidant methods. J. Food Compos. Anal. 2017, 64, 145–146. [Google Scholar] [CrossRef]
- Singleton, V.L.; Orthofer, R.; Lamuela-Raventós, R.M. Analysis of total phenols and other oxidation substrates and antioxidants by means of Folin-Ciocalteu reagent. In Methods in Enzymology; Academic Press: San Diego, CA, USA, 1999; Volume 299, pp. 152–178. [Google Scholar]
- Hossain, M.B.; Rai, D.K.; Brunton, N.P.; Martin-Diana, A.B.; Barry-Ryan, C. Characterization of phenolic composition in Lamiaceae spices by LC-ESI-MS/MS. J. Agric. Food Chem. 2010, 58, 10576–10581. [Google Scholar] [CrossRef]
- Gangopadhyay, N.; Rai, D.K.; Brunton, N.P.; Gallagher, E.; Hossain, M.B. Antioxidant-guided isolation and mass spectrometric identification of the major polyphenols in barley (Hordeum vulgare) grain. Food Chem. 2016, 210, 212–220. [Google Scholar] [CrossRef]
- Kumari, B.; Tiwari, B.K.; Walsh, D.; Griffin, T.P.; Islam, N.; Lyng, J.G.; Brunton, N.P.; Rai, D.K. Impact of pulsed electric field pre-treatment on nutritional and polyphenolic contents and bioactivities of light and dark brewer’s spent grains. Innov. Food Sci. Emerg. Technol. 2019, 54, 200–210. [Google Scholar] [CrossRef]
- Aura, A.-M.; Niemi, P.; Mattila, I.; Niemelä, K.; Smeds, A.; Tamminen, T.; Faulds, C.; Buchert, J.; Poutanen, K. Release of small phenolic compounds from brewer’s spent grain and its lignin fractions by human intestinal microbiota in vitro. J. Agric. Food Chem. 2013, 61, 9744–9753. [Google Scholar] [CrossRef] [PubMed]
- Friedman, M. Food browning and its prevention: An overview. J. Agric. Food Chem. 1996, 44, 631–653. [Google Scholar] [CrossRef]
- Li, Y.; Li, S.; Lin, S.-J.; Zhang, J.-J.; Zhao, C.-N.; Li, H.-B. Microwave-assisted extraction of natural antioxidants from the exotic Gordonia axillaris fruit: Optimization and identification of phenolic compounds. Molecules 2017, 22, 1481. [Google Scholar] [CrossRef] [PubMed]
- Bimakr, M.; Ganjloo, A.; Zarringhalami, S.; Ansarian, E. Ultrasound-assisted extraction of bioactive compounds from Malva sylvestris leaves and its comparison with agitated bed extraction technique. Food Sci. Biotechnol. 2017, 26, 1481–1490. [Google Scholar] [CrossRef] [PubMed]
- Hernanz, D.; Nuñez, V.; Sancho, A.I.; Faulds, C.B.; Williamson, G.; Bartolomé, B.; Gómez-Cordovés, C. Hydroxycinnamic acids and ferulic acid dehydrodimers in barley and processed barley. J. Agric. Food Chem. 2001, 49, 4884–4888. [Google Scholar] [CrossRef] [PubMed]
- Dobberstein, D.; Bunzel, M. Separation and detection of cell wall-bound ferulic acid dehydrodimers and dehydrotrimers in cereals and other plant materials by reversed phase high-performance liquid chromatography with ultraviolet detection. J. Agric. Food Chem. 2010, 58, 8927–8935. [Google Scholar] [CrossRef] [PubMed]
- Faulds, C.; Sancho, A.; Bartolomé, B. Mono- and dimeric ferulic acid release from brewer’s spent grain by fungal feruloyl esterases. Appl. Microbiol. Biotechnol. 2002, 60, 489–494. [Google Scholar]
- Szwajgier, D.; Waśko, A.; Targoński, Z.; Niedźwiadek, M.; Bancarzewska, M. The use of a novel ferulic acid esterase from Lactobacillus acidophilus K1 for the release of phenolic acids from brewer’s spent grain. J. Inst. Brew. 2010, 116, 293–303. [Google Scholar] [CrossRef]
- Athanasios, M.; Georgios, L.; Michael, K. A rapid microwave-assisted derivatization process for the determination of phenolic acids in brewer’s spent grains. Food Chem. 2007, 102, 606–611. [Google Scholar] [CrossRef]


| Samples | TPC mgGAE/g BSG dw | ||
|---|---|---|---|
| BSG L | BSG D | BSG Mix | |
| Crude | 2.84 ± 0.11 c | 2.81 ± 0.26 c | 3.85 ± 0.04 c |
| Liquor Ctrl | 16.67 ± 0.87 b | 17.27 ± 0.41 ab | 19.20 ± 0.40 a |
| Liquor Ctrl EtOAc | 4.67 ± 0.27 c | 3.08 ± 0.15 c | 4.71 ± 0.28 c |
| Liquor MAE | 15.42 ± 1.16 b | 15.55 ± 0.56 b | 16.94 ± 1.84 b |
| Liquor MAE EtOAc | 3.85 ± 0.19 c | 3.01 ± 0.19 c | 4.24 ± 0.22 c |
| Liquor UAE | 15.76 ± 0.72 b | 16.72 ± 0.96 b | 16.99 ± 0.32 b |
| Liquor UAE EtOAc | 4.17 ± 0.21 c | 3.43 ± 0.46 c | 4.62 ± 0.27 c |
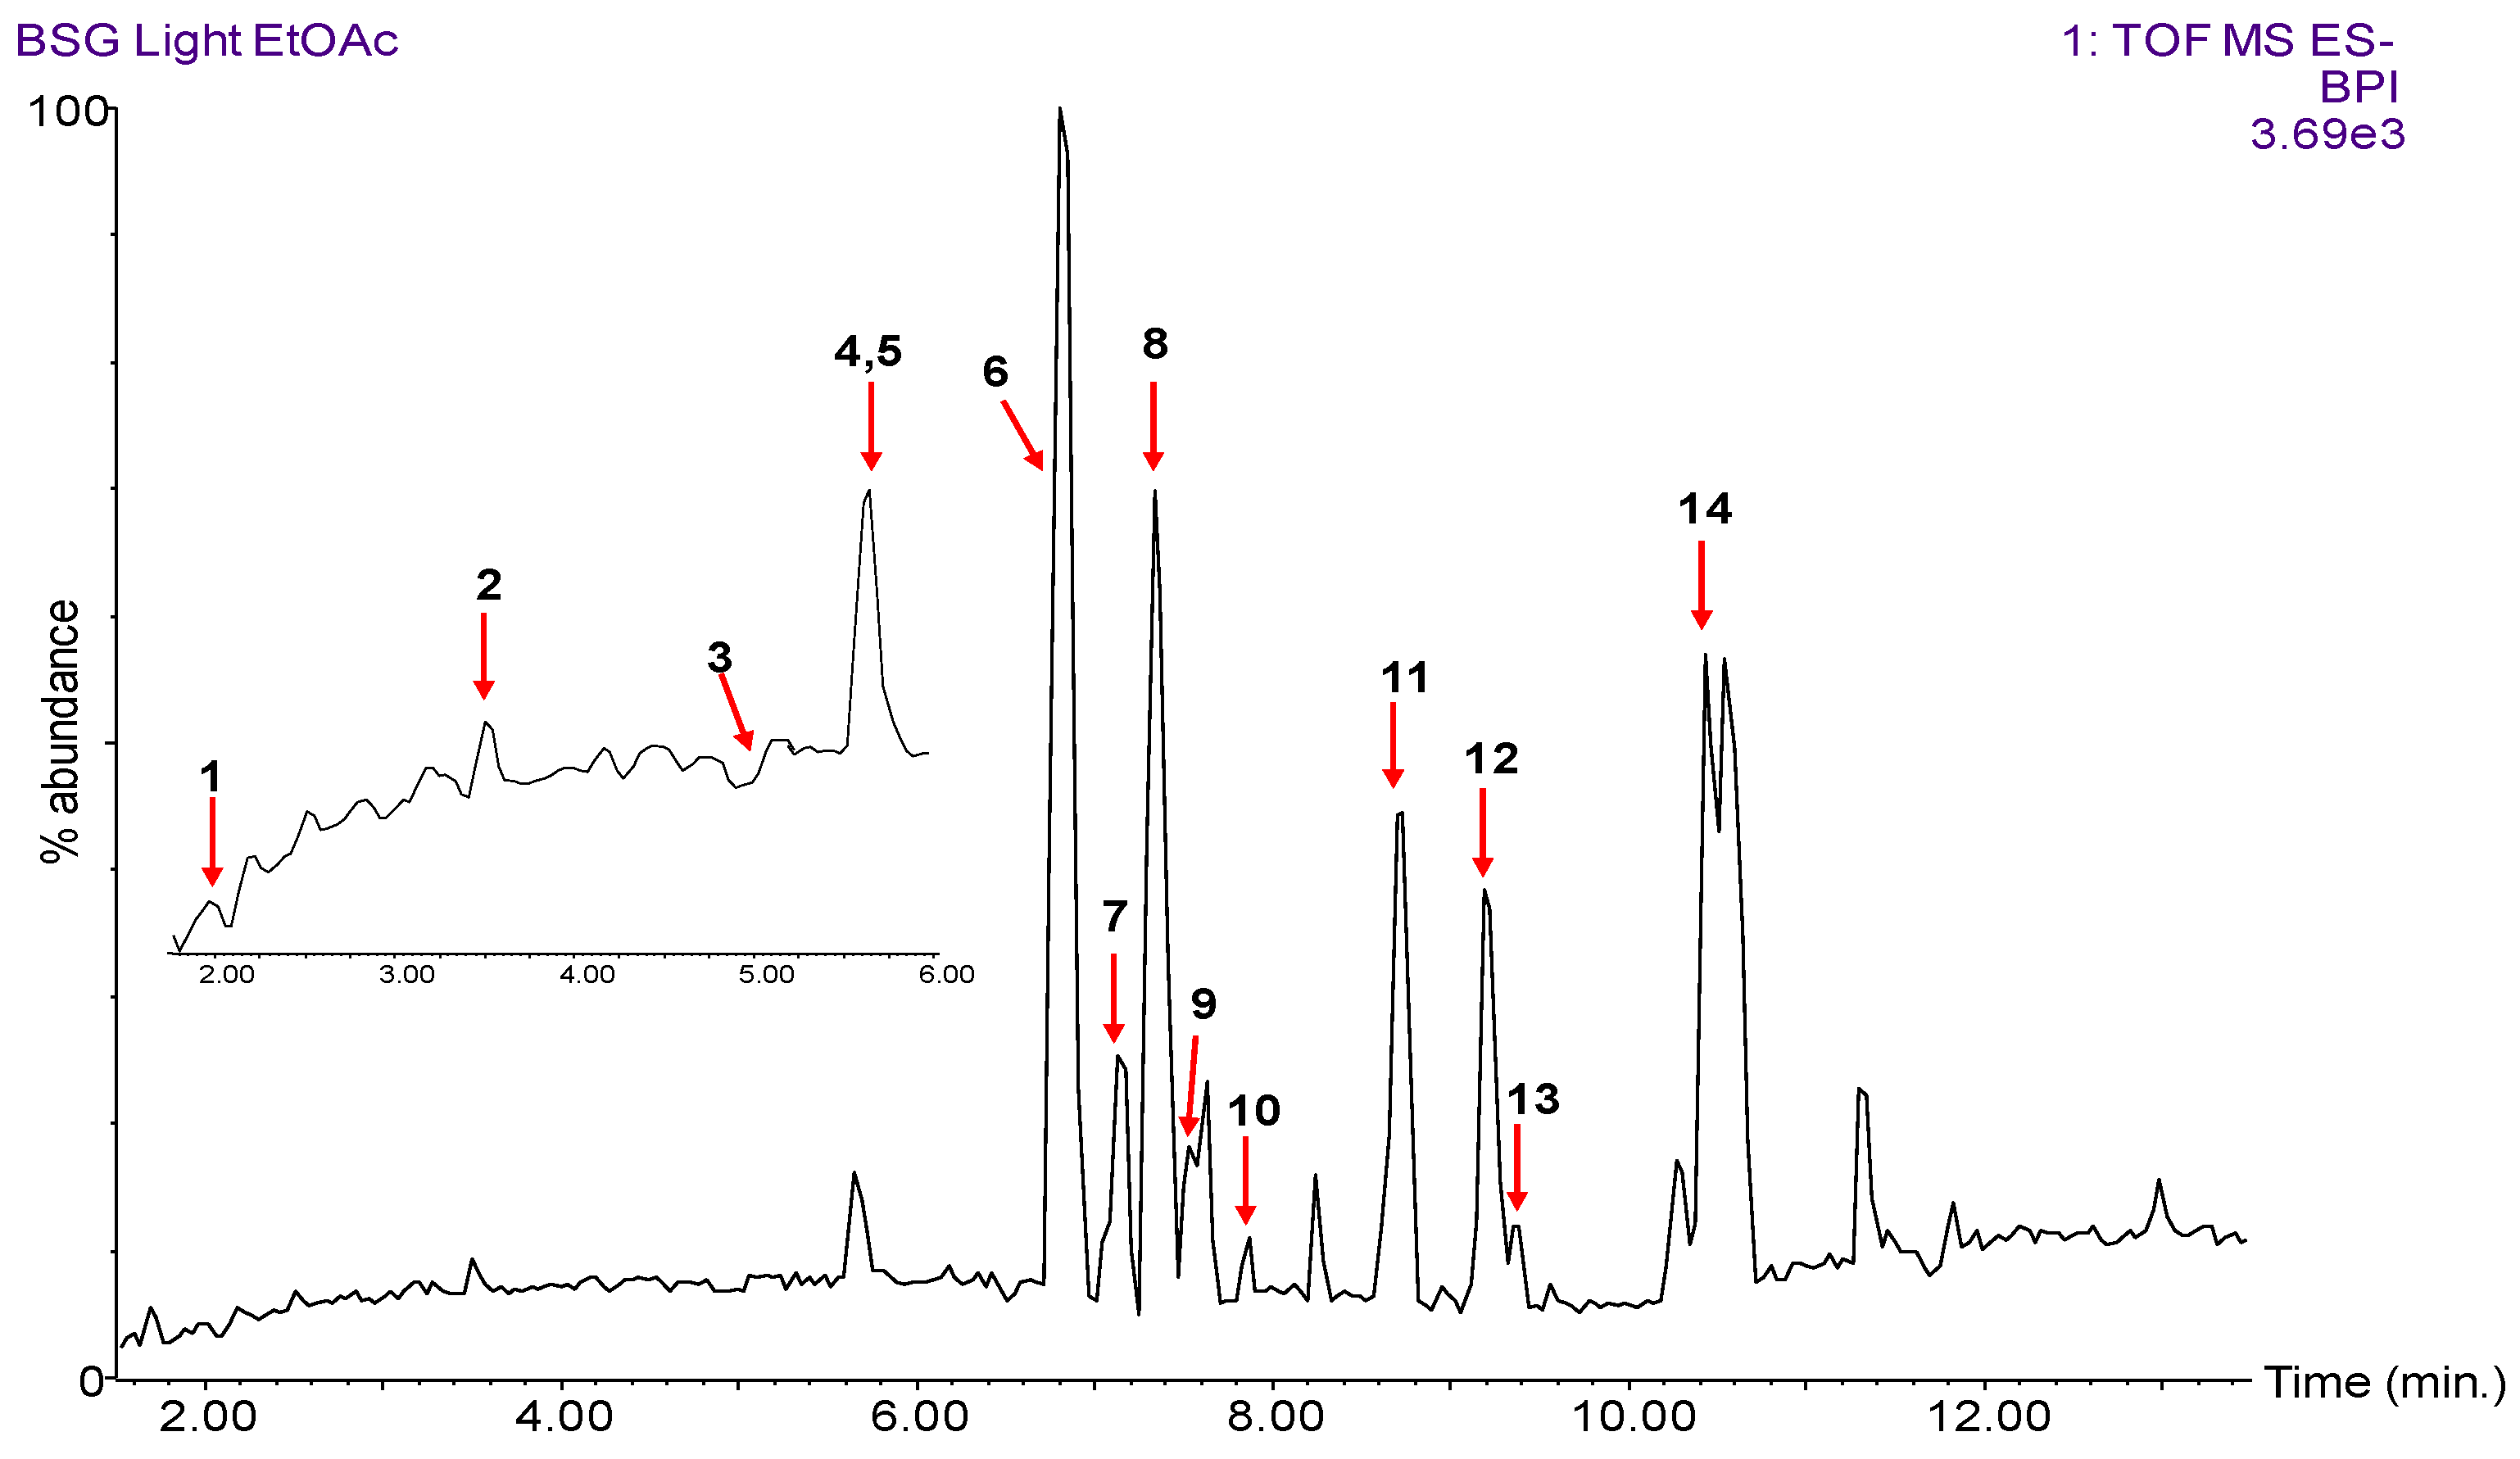
| Peak No. | RT (min.) | Observed [M − H]− (m/z) | Calculated [M − H]− (m/z) | Chemical Formula | MS/MS Fragment Ions (m/z) | Tentative Identification |
|---|---|---|---|---|---|---|
| 1 | 2.05 | 153.0169 | 153.0188 | C7H6O4 | 109.03 | protocatechuic acid |
| 2 | 3.50 | 137.0227 | 137.0239 | C7H6O3 | 93.04 | hydroxybenzoic acid |
| 3 | 4.93 | 179.0331 | 179.0344 | C9H8O4 | 135.04 | caffeic acid |
| 4 | 5.43 | 197.0452 | 197.0450 | C9H10O5 | 153.03 | syringic acid |
| 5 | 5.65 | 121.0282 | 121.0290 | C7H5O2 | 92.03 | benzoic acid |
| 6 | 6.80 | 163.0380 | 163.0395 | C9H8O3 | 119.05 | coumaric acid |
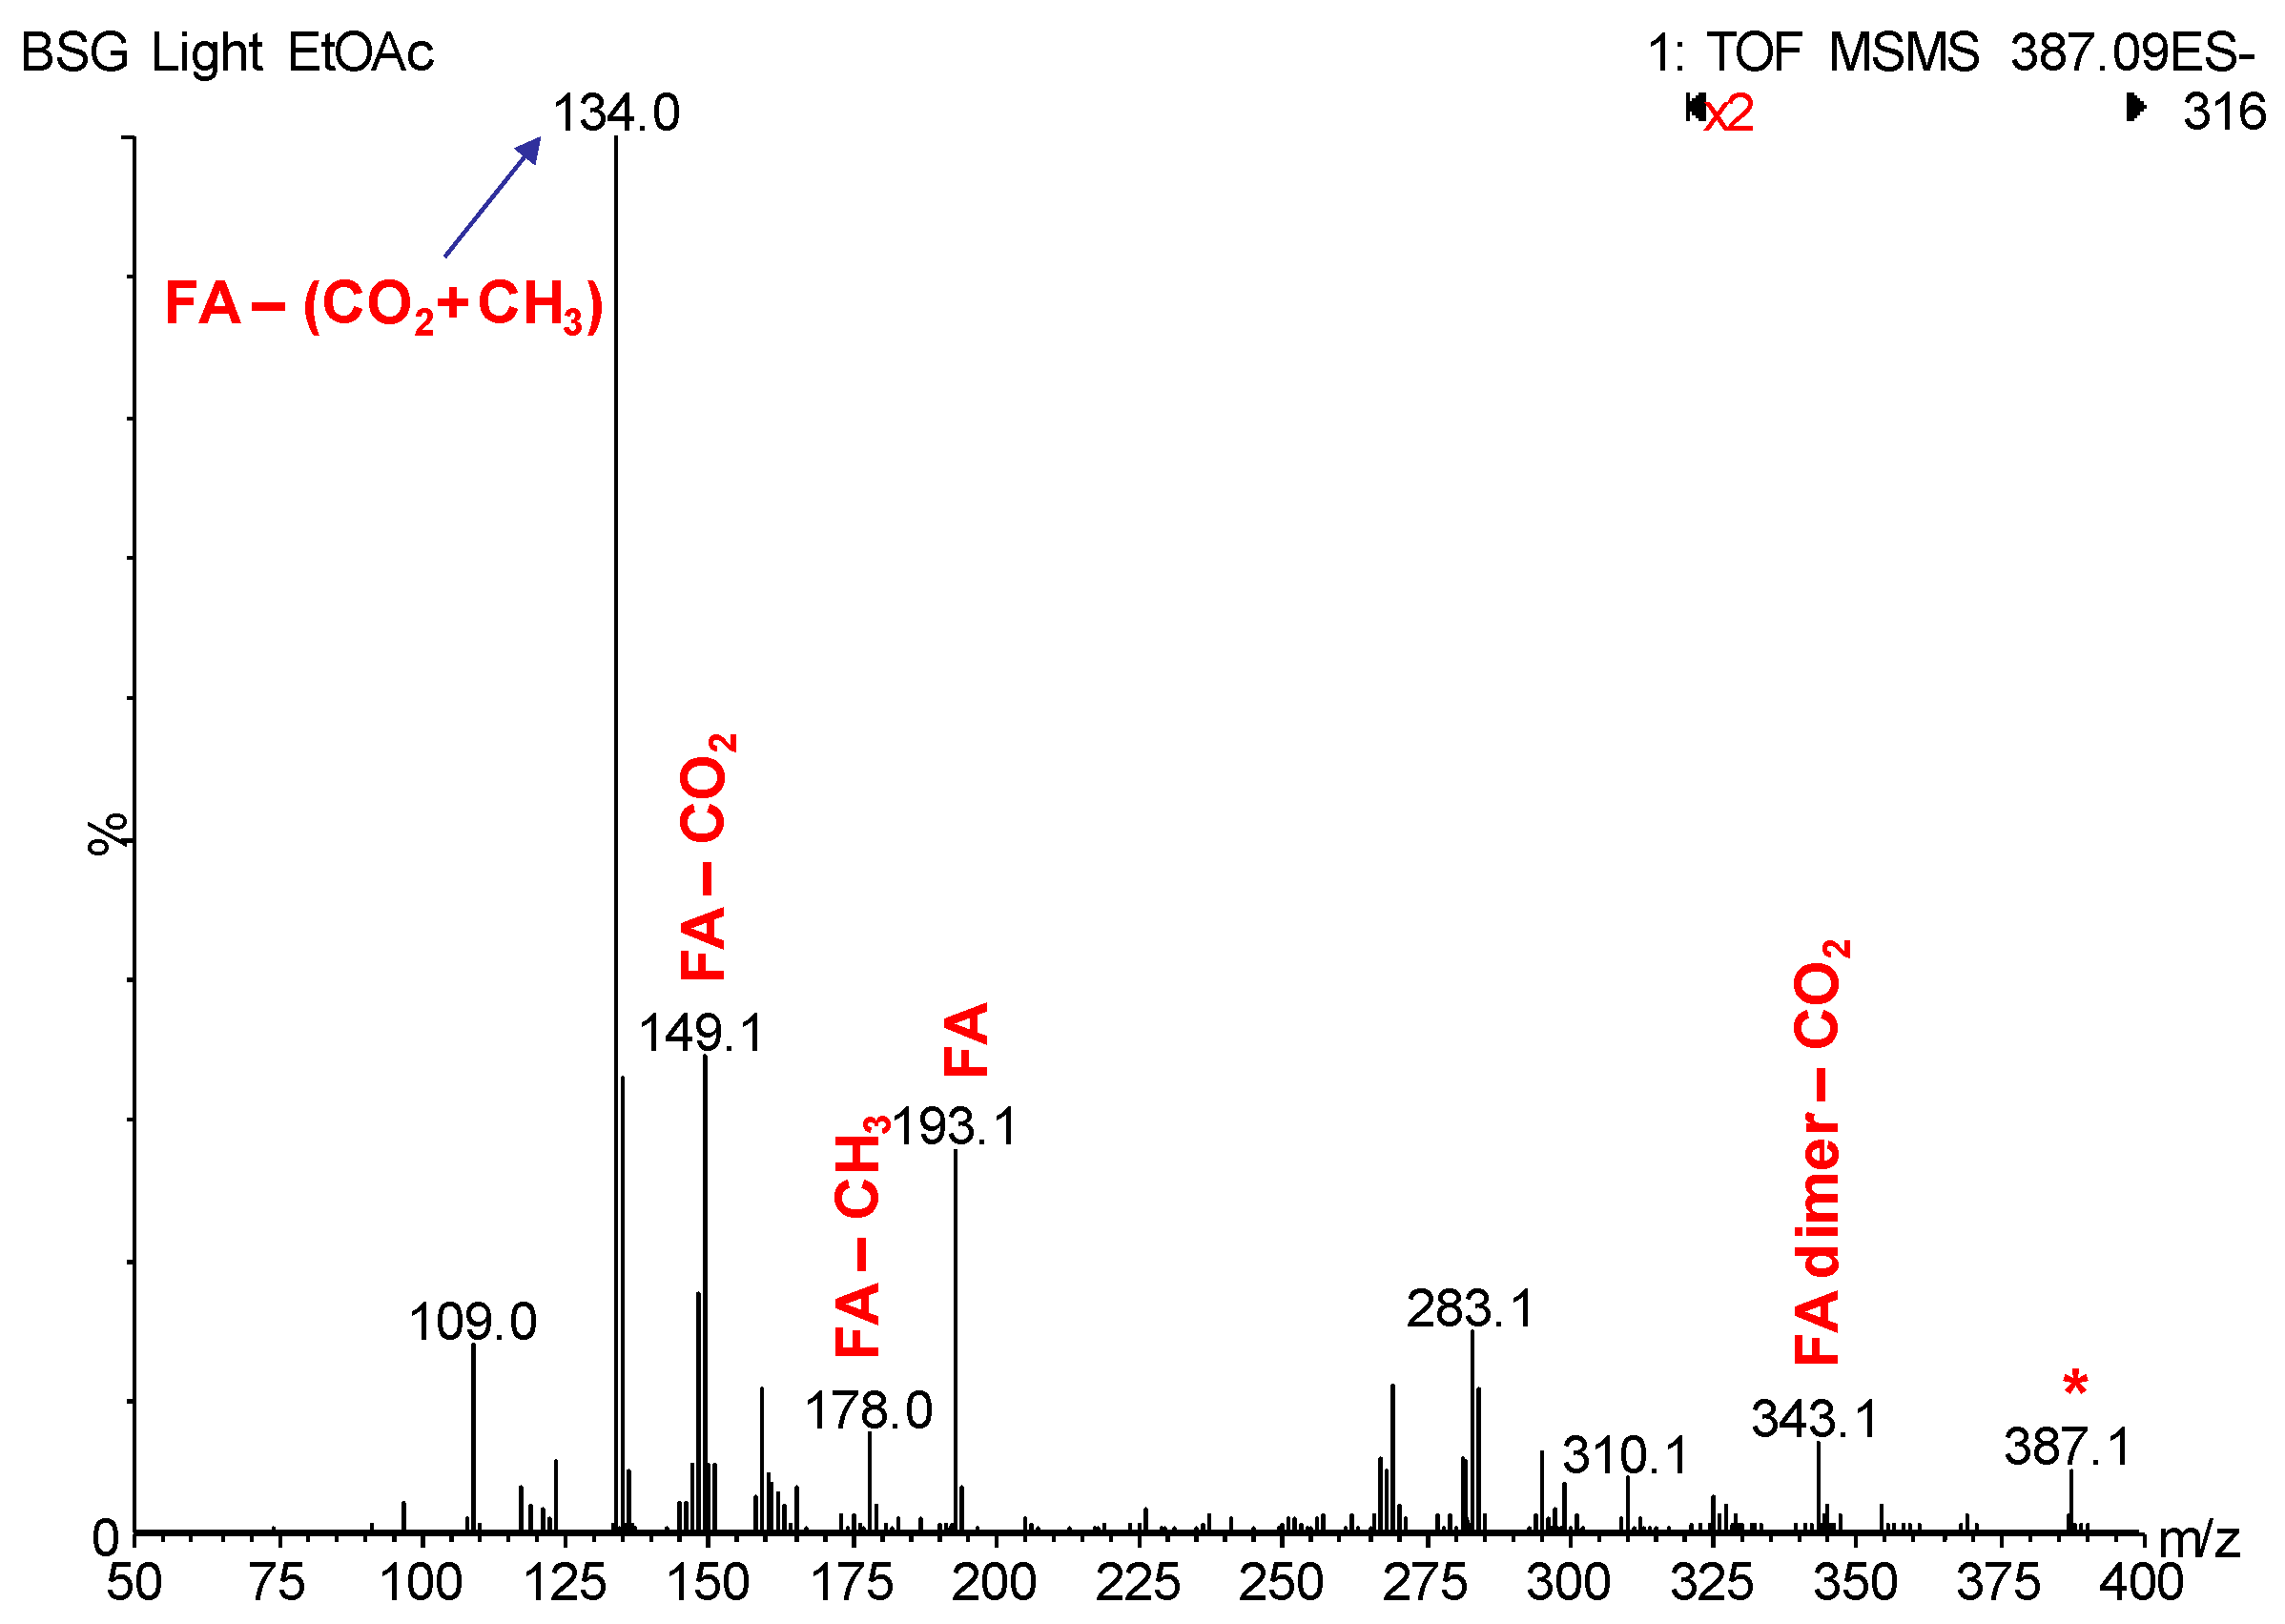
| 7 | 7.13 | 387.1073 | 387.1080 | C20H20O8 | 343.13, 193.05, 178.03, 149.07, 134.05 | ferulic-ferulic acid dimer |
| 8 | 7.34 | 223.0614 | 223.0606 | C27H30O16 | 179.02 | sinapic acid |
| 9 | 7.54 | 341.1019 | 341.1025 | C19H18O6 | 267.08, 193.05, 134.04 | decarboxylated diferulic acid |
| 10 | 7.87 | 385.0915 | 385.0923 | C20H18O8 | 282.09, 267.07 (100%), 239.08, 148.06 | diferulic acid |
| 11 | 8.73 | 385.0909 | 385.0923 | C20H18O8 | 325.09/326.09, 282.11/281.11 (100%), 267.08 (75%). | diferulic acid isomer |
| 12 | 9.19 | 193.0516 | 193.0501 | C10H10O4 | 178.03, 134.04 | ferulic acid |
| 13 | 9.39 | 577.1342 | 577.1346 | C30H26O12 | 533.17, 355.09, | triferulic acid |
| 14 | 10.44 | 341.1035 | 341.1025 | C19H18O6 | 326.09, 311.07, 282.09, 267.08 (100%), 239.08 | decarboxylated diferulic acid isomer |
| Samples | Ferulic Acid | p-Coumaric Acid | Catechin | 4-Hydroxybenzoic Acid | Sinapic Acid | Syringic Acid | Protocatechuic Acid | Caffeic Acid | Total |
|---|---|---|---|---|---|---|---|---|---|
| BSG L Ctrl EtOAc | 1809.5 ± 272.8 a | 686.6 ± 59.0 a | 2.11 ± 0.23 b | 16.66 ± 4.45 a | 14.63 ± 2.48 a | 33.9 ± 10.44 b | 3.46 ± 1.04 ab | 0.147 ± 0.065 d | 2741.1 ± 5.2 a |
| BSG L MAE EtOAc | 1545.6 ± 157.3 a | 499.1 ± 31.2 bc | 1.43 ± 0.48 b | 9.41 ± 1.15 bcd | 11.02 ± 3.99 ab | 18.9 ± 7.26 bc | 1.38 ± 0.72 cd | 0.370 ± 0.031 b | 2087.2 ± 196.8 a |
| BSG L UAE EtOAc | 1669.7 ± 21.8 a | 579.2 ± 22.7 b | 1.05 ± 0.07 b | 10.76 ± 0.99 bcd | 10.36 ± 1.52 ab | 17.8 ± 3.68 bc | 2.29 ± 0.83 bc | 0.176 ± 0.013 d | 2291.2 ± 42.7 ab |
| BSG D Ctrl EtOAc | 404.7 ± 51.0 cd | 185.3 ± 8.3 f | 1.66 ± 1.01 b | 13.12 ± 0.38 ab | 7.63 ± 1.92 bc | 76.4 ± 28.84 a | 3.83 ± 0.63 a | 0.407 ± 0.065 b | 693.0 ± 85.7 de |
| BSG D MAE EtOAc | 351.0 ± 33.9 d | 155.3 ± 7.5 f | 1.23 ± 0.33 b | 11.36 ± 2.28 bc | 4.68 ± 0.67 c | 21.7 ± 4.84 bc | 4.09 ± 0.55 a | 0.547 ± 0.079 a | 549.9 ± 41.5 e |
| BSG D UAE EtOAc | 413.6 ± 135.8 cd | 173.4 ± 56.6 f | 2.18 ± 0.74 b | 10.69 ± 1.39 bcd | 8.28 ± 0.46 bc | 17.3 ± 5.91 bc | 4.85 ± 0.47 a | 0.389 ± 0.052 b | 629.9 ± 190.9 de |
| BSG Mix Ctrl EtOAc | 894.6 ± 82.8 b | 476.4 ± 35.1 bcd | nd | 6.02 ± 0.93 de | 9.59 ± 0.23 abc | nd | 0.062 ± 0.012 d | 0.226 ± 0.049 cd | 1387.0 ± 119.0 c |
| BSG Mix MAE EtOAc | 796.8 ± 68.1 b | 355.4 ± 33.0 e | 0.47 ± 0.82 b | 6.88 ± 0.30 cde | 10.23 ± 0.68 ab | nd | 0.015 ± 0.026 d | nd | 1169.8 ± 66.4 c |
| BSG Mix UAE EtOAc | 848.5 ± 15.2 b | 386.9 ± 6.7 de | nd | 6.59 ± 0.55 de | 11.33 ± 1.54 ab | nd | 0.174 ± 0.085 d | 0.328 ± 0.005 bc | 1253.8 ± 11.3 c |
| BSG Mix Crude | 2.8 ± 2.41 e | nd | 14.05 ± 1.19 a | 0.11 ± 0.12 f | 8.28 ± 0.14 bc | nd | 0.49 ± 0.17 d | nd | 25.7 ± 1.97 f |
| BSG Mix Liquor Ctrl | 714.1 ± 76.7 bc | 423.3 ± 17.6 cde | 1.09 ± 0.98 b | 4.24 ± 0.50 ef | 12.29 ± 1.09 ab | nd | nd | nd | 1155.0 ± 93.2 c |
| BSG Mix Liquor MAE | 647.4 ± 40.7 bcd | 330.6 ± 49.5 e | 1.86 ± 0.36 b | 4.26 ± 0.33 ef | 9.52 ± 0.29 bc | nd | nd | nd | 993.6 ± 74.8 cd |
| BSG Mix Liquor UAE | 739.1 ± 22.3 b | 371.9 ± 30.9 de | nd | 4.12 ± 0.37 ef | 11.11 ± 0.39 ab | nd | nd | nd | 1126.3 ± 53.2 c |
© 2019 by the authors. Licensee MDPI, Basel, Switzerland. This article is an open access article distributed under the terms and conditions of the Creative Commons Attribution (CC BY) license (http://creativecommons.org/licenses/by/4.0/).
Share and Cite
Birsan, R.I.; Wilde, P.; Waldron, K.W.; Rai, D.K. Recovery of Polyphenols from Brewer’s Spent Grains. Antioxidants 2019, 8, 380. https://doi.org/10.3390/antiox8090380
Birsan RI, Wilde P, Waldron KW, Rai DK. Recovery of Polyphenols from Brewer’s Spent Grains. Antioxidants. 2019; 8(9):380. https://doi.org/10.3390/antiox8090380
Chicago/Turabian StyleBirsan, Rares I., Peter Wilde, Keith W. Waldron, and Dilip K. Rai. 2019. "Recovery of Polyphenols from Brewer’s Spent Grains" Antioxidants 8, no. 9: 380. https://doi.org/10.3390/antiox8090380
APA StyleBirsan, R. I., Wilde, P., Waldron, K. W., & Rai, D. K. (2019). Recovery of Polyphenols from Brewer’s Spent Grains. Antioxidants, 8(9), 380. https://doi.org/10.3390/antiox8090380