
Critical Evaluation and Validation of a High-Throughput Microplate-Based Cupric Reducing Antioxidant Capacity Method for the Analysis of Fish Feed Ingredients


Abstract

1. Introduction
2. Materials and Methods
2.1. Fish Feed Ingredient Samples
2.2. Chemicals and Reagents
2.3. Preparation of CUPRAC Solutions
2.4. Selection of the Solvents
2.5. Method Validation
2.6. Extraction Procedures
2.7. CUPRAC Procedure
2.8. UV Spectrophotometry Instrument
2.9. Statistics
3. Results and Discussion
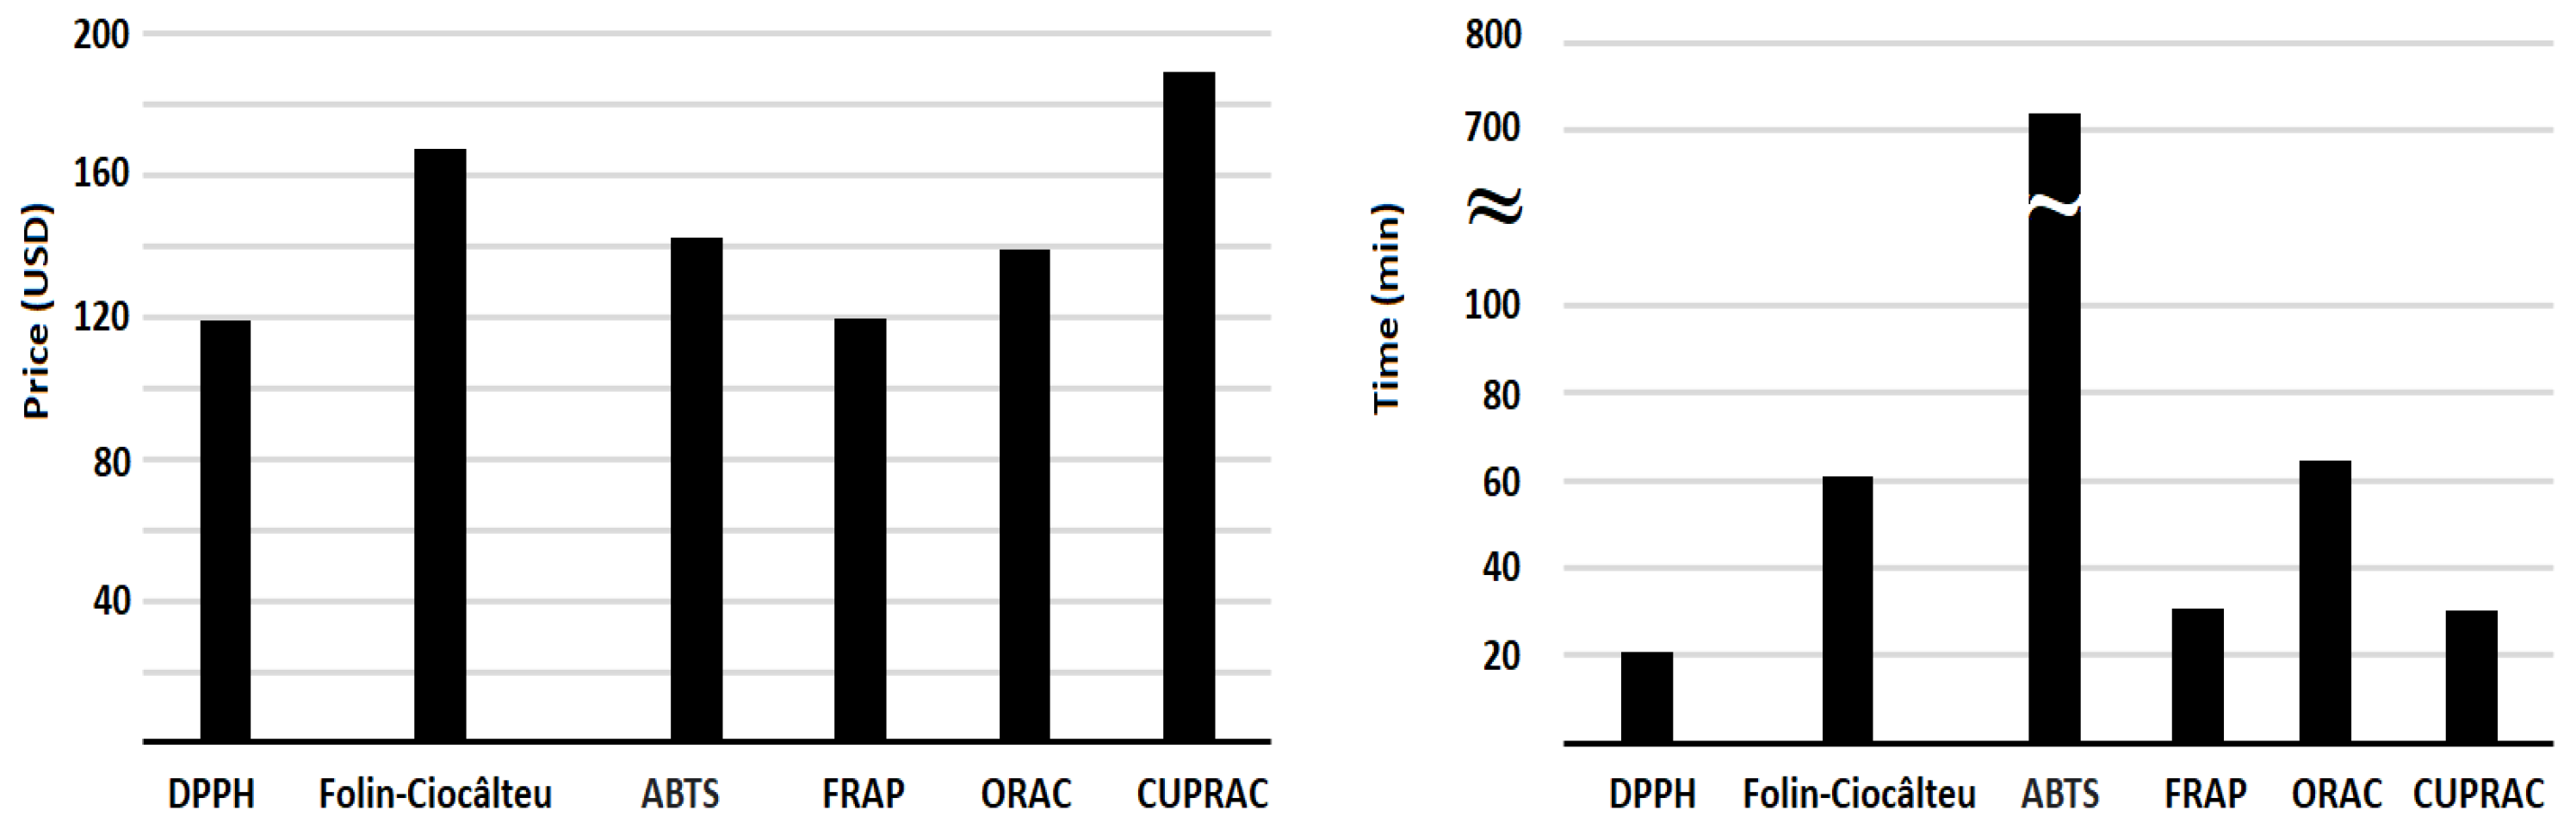
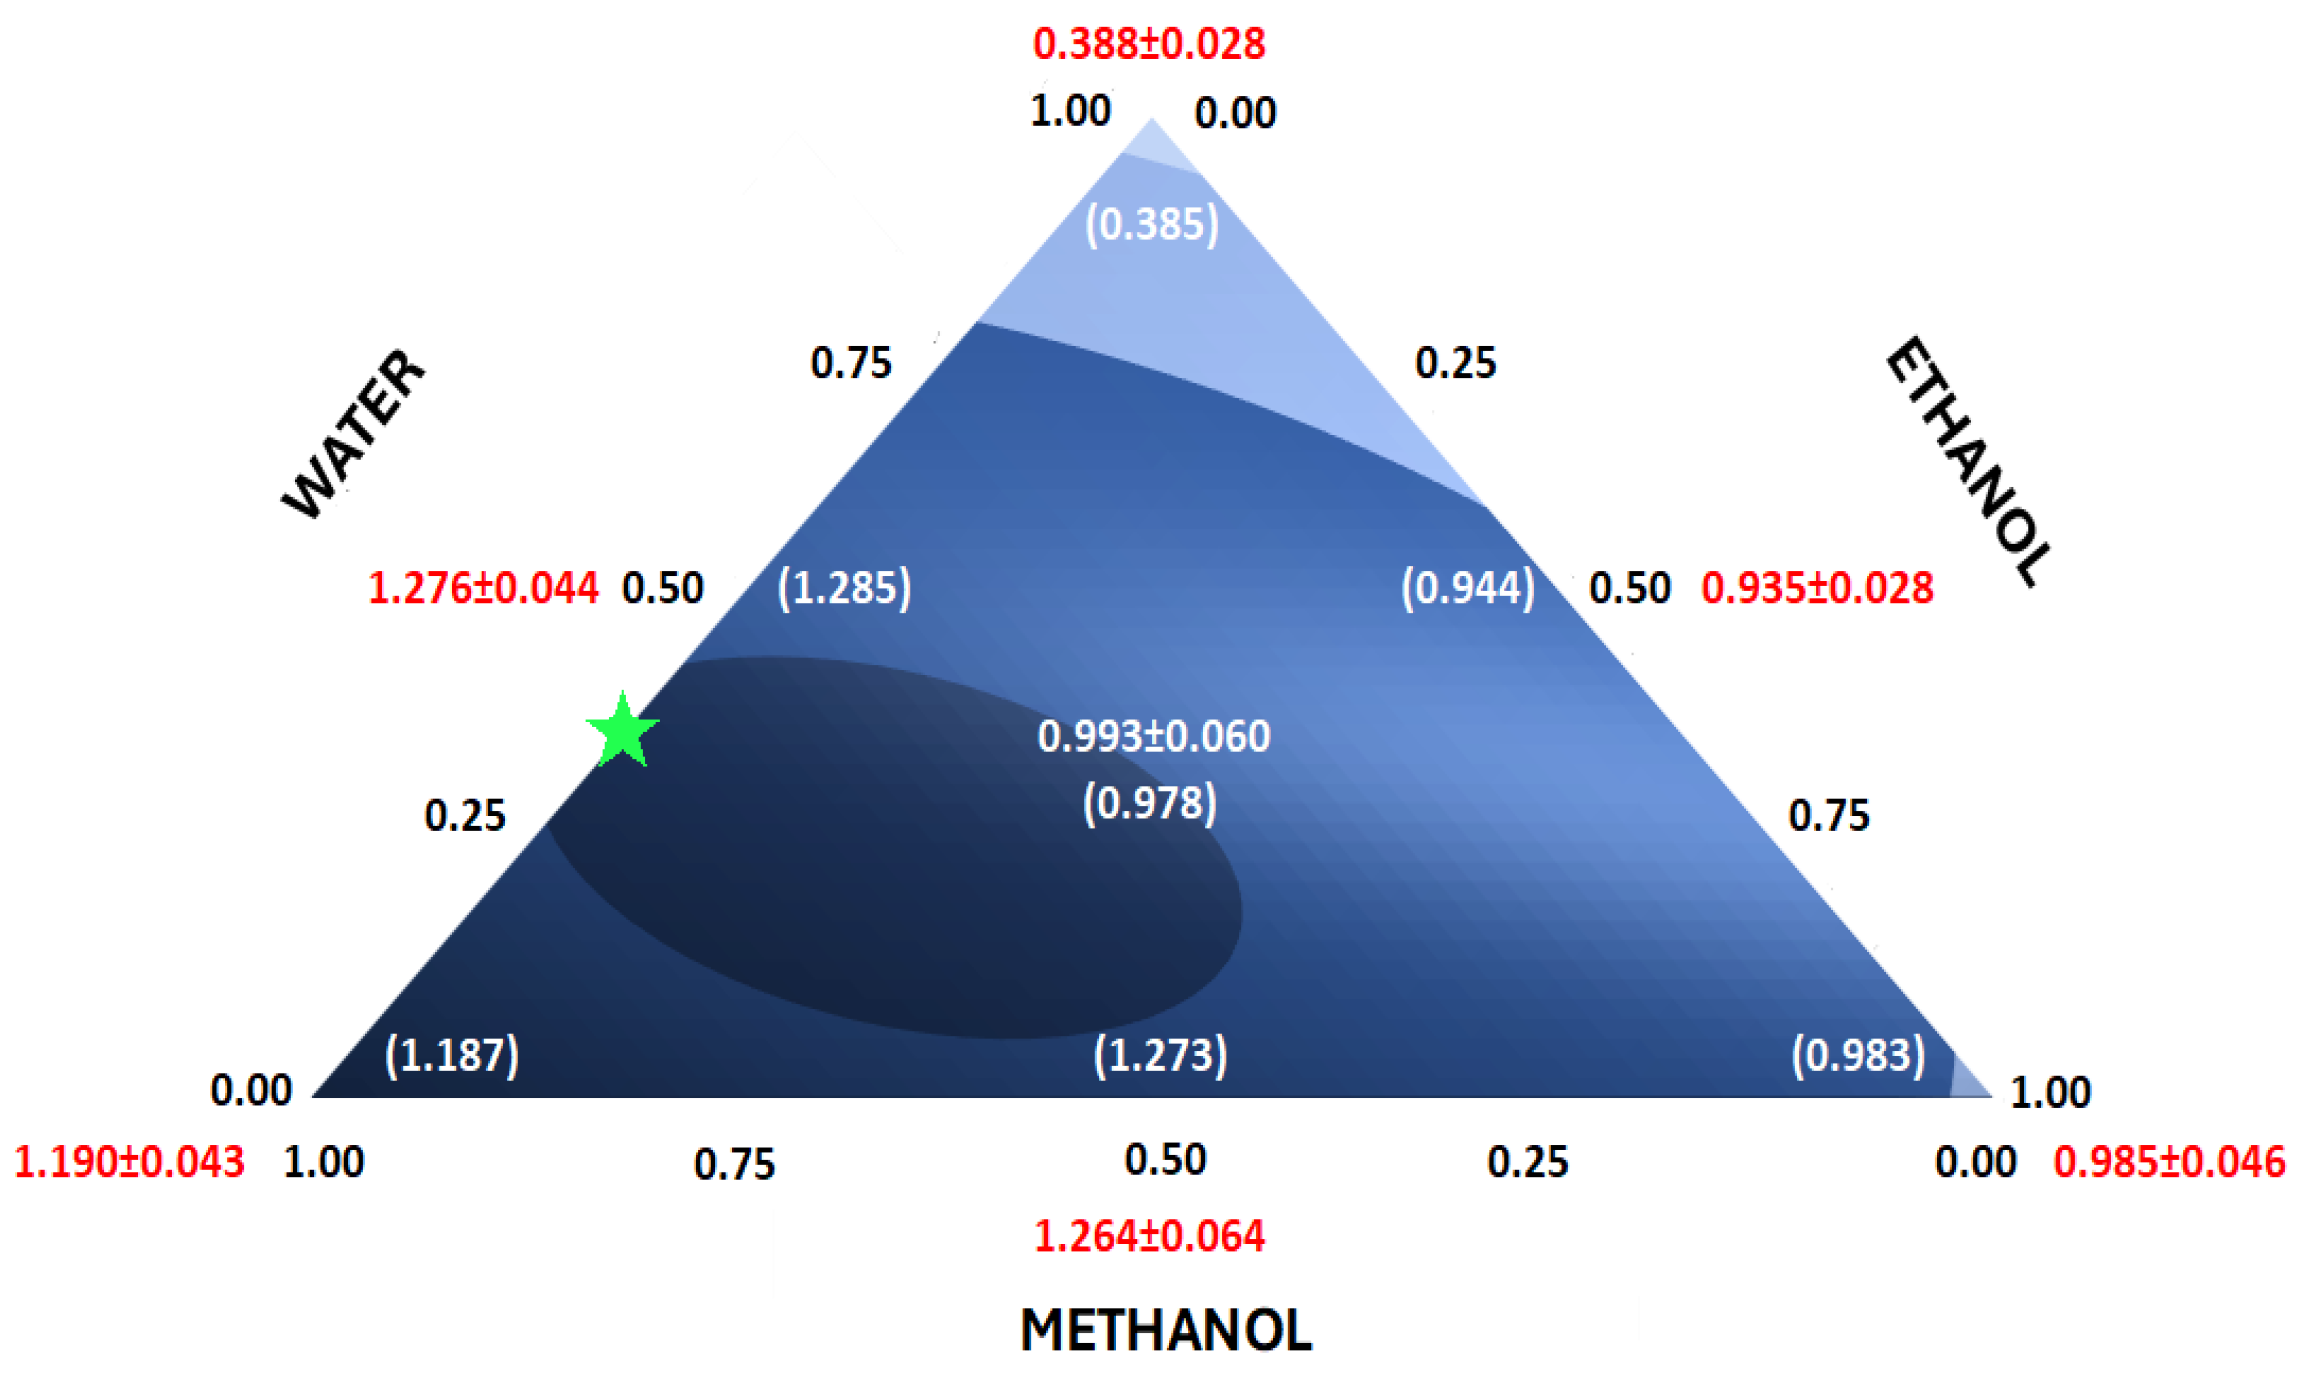
3.1. Solvent Effect
3.2. Validation
3.3. Quantitative Analysis of Fish Ingredients
4. Conclusions
Author Contributions
Funding
Institutional Review Board Statement
Informed Consent Statement
Data Availability Statement
Acknowledgments
Conflicts of Interest
References
- Lourenço, S.C.; Moldão-Martins, M.; Alves, V.D. Antioxidants of Natural Plant Origins: From Sources to Food Industry Applications. Molecules 2019, 24, 4132. [Google Scholar] [CrossRef] [PubMed]
- Serra, V.; Salvatori, G.; Pastorelli, G. Dietary Polyphenol Supplementation in Food Producing Animals: Effects on the Quality of Derived Products. Animals 2021, 11, 401. [Google Scholar] [CrossRef] [PubMed]
- Shingai, Y.; Fujimoto, A.; Nakamura, M.; Masuda, T. Structure and Function of the Oxidation Products of Polyphenols and Identification of Potent Lipoxygenase Inhibitors from Fe-Catalyzed Oxidation of Resveratrol. J. Agric. Food Chem. 2011, 59, 8180–8186. [Google Scholar] [CrossRef]
- Rudrapal, M.; Khairnar, S.J.; Khan, J.; Dukhyil, A.B.; Ansari, M.A.; Alomary, M.N.; Alshabrmi, F.M.; Palai, S.; Deb, P.K.; Devi, R. Dietary Polyphenols and Their Role in Oxidative Stress-Induced Human Diseases: Insights Into Protective Effects, Antioxidant Potentials and Mechanism(s) of Action. Front. Pharmacol. 2022, 13, 806470. [Google Scholar] [CrossRef]
- MacDonald-Wicks, L.K.; Wood, L.G.; Garg, M.L. Methodology for the Determination of Biological Antioxidant Capacity in Vitro: A Review. J. Sci. Food Agric. 2006, 86, 2046–2056. [Google Scholar] [CrossRef]
- Foti, M.C.; Daquino, C.; Geraci, C. Electron-Transfer Reaction of Cinnamic Acids and Their Methyl Esters with the DPPH• Radical in Alcoholic Solutions. J. Org. Chem. 2004, 69, 2309–2314. [Google Scholar] [CrossRef]
- Prior, R.L.; Wu, X.; Schaich, K. Standardized Methods for the Determination of Antioxidant Capacity and Phenolics in Foods and Dietary Supplements. J. Agric. Food Chem. 2005, 53, 4290–4302. [Google Scholar] [CrossRef]
- Dudonné, S.; Vitrac, X.; Coutière, P.; Woillez, M.; Mérillon, J.-M. Comparative Study of Antioxidant Properties and Total Phenolic Content of 30 Plant Extracts of Industrial Interest Using DPPH, ABTS, FRAP, SOD, and ORAC Assays. J. Agric. Food Chem. 2009, 57, 1768–1774. [Google Scholar] [CrossRef] [PubMed]
- Apak, R.; Güçlü, K.; Özyürek, M.; Karademir, S.E. Novel Total Antioxidant Capacity Index for Dietary Polyphenols and Vitamins C and E, Using Their Cupric Ion Reducing Capability in the Presence of Neocuproine: CUPRAC Method. J. Agric. Food Chem. 2004, 52, 7970–7981. [Google Scholar] [CrossRef]
- Wołosiak, R.; Drużyńska, B.; Derewiaka, D.; Piecyk, M.; Majewska, E.; Ciecierska, M.; Worobiej, E.; Pakosz, P. Verification of the Conditions for Determination of Antioxidant Activity by ABTS and DPPH Assays—A Practical Approach. Molecules 2022, 27, 50. [Google Scholar] [CrossRef]
- Hobson, C.M.; O’Brien, E.T.; Falvo, M.R.; Superfine, R. Combined Selective Plane Illumination Microscopy and FRAP Maps Intranuclear Diffusion of NLS-GFP. Biophys. J. 2020, 119, 514–524. [Google Scholar] [CrossRef] [PubMed]
- Storebakken, T.; Foss, P.; Schiedt, K.; Austreng, E.; Liaaen-Jensen, S.; Manz, U. Carotenoids in Diets for Salmonids: IV. Pigmentation of Atlantic Salmon with Astaxanthin, Astaxanthin Dipalmitate and Canthaxanthin. Aquaculture 1987, 65, 279–292. [Google Scholar] [CrossRef]
- Meyers, S.P. Developments in World Aquaculture, Feed Formulations and Role of Carotenoids. Pure Appl. Chem. 1994, 66, 1069–1076. [Google Scholar] [CrossRef]
- Nomura, T.; Kikuchi, M.; Kubodera, A.; Kawakami, Y. Proton-Donative Antioxidant Activity of Fucoxanthin with 1,1-Diphenyl-2-Picrylhydrazyl (DPPH). IUBMB Life 1997, 42, 361–370. [Google Scholar] [CrossRef]
- Ribeiro, J.P.N.; Magalhães, L.M.; Reis, S.; Lima, J.L.F.C.; Segundo, M.A. High-Throughput Total Cupric Ion Reducing Antioxidant Capacity of Biological Samples Determined Using Flow Injection Analysis and Microplate-Based Methods. Anal. Sci. 2011, 27, 483–488. [Google Scholar] [CrossRef]
- Magalhães, L.M.; Barreiros, L.; Maia, M.A.; Reis, S.; Segundo, M.A. Rapid Assessment of Endpoint Antioxidant Capacity of Red Wines through Microchemical Methods Using a Kinetic Matching Approach. Talanta 2012, 97, 473–483. [Google Scholar] [CrossRef]
- Ruiz, A.; Bustamante, L.; Vergara, C.; von Baer, D.; Hermosín-Gutiérrez, I.; Obando, L.; Mardones, C. Hydroxycinnamic Acids and Flavonols in Native Edible Berries of South Patagonia. Food Chem. 2015, 167, 84–90. [Google Scholar] [CrossRef] [PubMed]
- Parada, J.; Valenzuela, T.; Gómez, F.; Tereucán, G.; García, S.; Cornejo, P.; Winterhalter, P.; Ruiz, A. Effect of Fertilization and Arbuscular Mycorrhizal Fungal Inoculation on Antioxidant Profiles and Activities in Fragaria Ananassa Fruit. J. Sci. Food Agric. 2019, 99, 1397–1404. [Google Scholar] [CrossRef] [PubMed]
- Navarrete, L.; Bozinovic, F.; Peña-Villalobos, I.; Contreras-Ramos, C.; Sanchez-Hernandez, J.C.; Newsome, S.D.; Nespolo, R.F.; Sabat, P. Integrative Physiological Responses to Acute Dehydration in the Rufous-Collared Sparrow: Metabolic, Enzymatic, and Oxidative Traits. Front. Ecol. Evol. 2021, 9, 767280. [Google Scholar] [CrossRef]
- Poblete, Y.; Contreras, C.; Fernández, C.; Flores, C.R.; Vega, P.; Ávila, M.; Sabat, P. Geographic Variation in the Altitudinal Migration Patterns, Body Size, Oxidative Status and Exploratory Behavior in a Neotropical Bird. Ecol. Evol. 2023, 13, e9941. [Google Scholar] [CrossRef]
- Sarmiento, V.; Hamre, K.; Arnø, A.; Dagogo, J.; Ødegård, E.; Elvebø, O.; Araujo, P. Stability Study and Validation of a Liquid Chromatography Tandem Mass Spectrometry Method for the Quantitative Analysis of Polyphenols in Fish Feed Ingredients. J. Chromatogr. B 2024, 1238, 124108. [Google Scholar] [CrossRef] [PubMed]
- Garzón, D.V.S. Evaluation of Analytical Strategies for Quantifying Selected Polyphenols in Feed Production: From Ingredient to Fish. Master’s Thesis, University of Bergen, Bergen, Norway, 2023. [Google Scholar]
- Bioanalytical Method Validation—Scientific Guideline|European Medicines Agency. Available online: https://www.ema.europa.eu/en/bioanalytical-method-validation-scientific-guideline (accessed on 22 May 2024).
- Araujo, P. Key Aspects of Analytical Method Validation and Linearity Evaluation. J. Chromatogr. B 2009, 877, 2224–2234. [Google Scholar] [CrossRef] [PubMed]
- Apak, M.R.; Guclu, K.; Ozyurek, M.; Bener, M.; Martinez, E.; Callewaert, D. Optical Sensor-Based Cupric Reducing Antioxidant Capacity (CUPRAC) Assay. U.S. Patent 8,912,004, 16 December 2014. [Google Scholar]
- Schaich, K.M.; Tian, X.; Xie, J. Hurdles and Pitfalls in Measuring Antioxidant Efficacy: A Critical Evaluation of ABTS, DPPH, and ORAC Assays. J. Funct. Foods 2015, 14, 111–125. [Google Scholar] [CrossRef]


| Assay | Mechanism | Principle | Analytical Method | Wavelength (nm) |
|---|---|---|---|---|
| ORAC | HAT | Inhibition of fluorescein (fluorescence declining) | Fluorescence | 485excitation/520emission |
| Folin–Ciocalteu | SET | Reduction of Folin–Ciocalteu reagent (yellow → blue) | Colorimetry | 765 |
| FRAP | SET | Reduction Fe+3 → Fe+2 (orange → blue) | Colorimetry | 593 |
| CUPRAC | SET | Reduction of Cu+2 → Cu+1 (blue → orange) | Colorimetry | 450 |
| DPPH | SET + HAT | Reduction of DPPH radical to its non-radical form DPPH-H (purple → yellow) | Colorimetry | 515 |
| ABTS | SET + HAT | Quenching of ABTS radical (blue/green → colorless) | Colorimetry | 734 |
| Combination Number | Solvent Fraction | Experimental | Standard Deviation | |||
|---|---|---|---|---|---|---|
| Methanol | Ethanol | Water | Signal ψ (AU) | σψ (AU) | (AU) | |
| 1 | 1 | 0 | 0 | 1.147 | 0.043 | 0.039 |
| 1 | 0 | 0 | 1.233 | |||
| 1 | 0 | 0 | 1.189 | |||
| 2 | 0 | 1 | 0 | 0.941 | 0.046 | |
| 0 | 1 | 0 | 1.033 | |||
| 0 | 1 | 0 | 0.981 | |||
| 3 | 0 | 0 | 1 | 0.365 | 0.028 | |
| 0 | 0 | 1 | 0.418 | |||
| 0 | 0 | 1 | 0.381 | |||
| 4 | 0.5 | 0.5 | 0 | 1.201 | 0.064 | 0.046 |
| 0.5 | 0.5 | 0 | 1.330 | |||
| 0.5 | 0.5 | 0 | 1.262 | |||
| 5 | 0.5 | 0 | 0.5 | 1.237 | 0.044 | |
| 0.5 | 0 | 0.5 | 1.324 | |||
| 0.5 | 0 | 0.5 | 1.266 | |||
| 6 | 0 | 0.5 | 0.5 | 0.911 | 0.028 | |
| 0 | 0.5 | 0.5 | 0.966 | |||
| 0 | 0.5 | 0.5 | 0.927 | |||
| 7 | 0.33 | 0.33 | 0.33 | 0.933 | 0.060 | 0.060 |
| 0.33 | 0.33 | 0.33 | 1.054 | |||
| 0.33 | 0.33 | 0.33 | 0.994 | |||
| Trolox (μM) | Absorbance (AU) | Validation Parameters | Square Errors (AU2) | Accuracy (%) | |
|---|---|---|---|---|---|
| Pure | Lack-of-Fit | ||||
| 0 | 0.033 | Regression model: y = 0.013x + 0.039 | 1.53 × 10⁻⁵ | 7.44 × 10⁻⁶ | 0.9 |
| 0 | 0.039 | r: 0.998 | 8.36 × 10⁻⁶ | 7.44 × 10⁻⁶ | 0.6 |
| 0 | 0.038 | LOD: 0.91 μM | 1.04 × 10⁻⁶ | 7.44 × 10⁻⁶ | 0.6 |
| 10 | 0.173 | LOQ: 2.75 μM | 1.13 × 10⁻⁵ | 4.90 × 10⁻⁵ | 2.8 |
| 10 | 0.179 | Estimated εTrolox: (2.62 ± 0.09) × 104 L mol−1 cm−1 | 6.04 × 10⁻⁶ | 4.90 × 10⁻⁵ | 7.3 |
| 10 | 0.177 | Calibration curve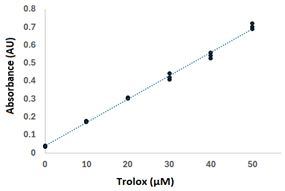 | 8.29 × 10⁻⁷ | 4.90 × 10⁻⁵ | 6.1 |
| 20 | 0.303 | 4.49 × 10⁻⁶ | 2.72 × 10⁻⁵ | 1.2 | |
| 20 | 0.308 | 8.93 × 10⁻⁶ | 2.72 × 10⁻⁵ | 3.2 | |
| 20 | 0.304 | 7.56 × 10⁻⁷ | 2.72 × 10⁻⁵ | 1.7 | |
| 30 | 0.444 | 4.09 × 10⁻⁴ | 3.92 × 10⁻⁵ | 3.6 | |
| 30 | 0.407 | 2.61 × 10⁻⁴ | 3.92 × 10⁻⁵ | −5.7 | |
| 30 | 0.419 | 1.64 × 10⁻⁵ | 3.92 × 10⁻⁵ | −2.6 | |
| 40 | 0.558 | 2.42 × 10⁻⁴ | 3.06 × 10⁻⁴ | −0.4 | |
| 40 | 0.527 | 2.36 × 10⁻⁴ | 3.06 × 10⁻⁴ | −6.3 | |
| 40 | 0.542 | 3.65 × 10⁻⁸ | 3.06 × 10⁻⁴ | −3.4 | |
| 50 | 0.723 | 3.39 × 10⁻⁴ | 2.03 × 10⁻⁴ | 5.0 | |
| 50 | 0.701 | 1.17 × 10⁻⁵ | 2.03 × 10⁻⁴ | 1.7 | |
| 50 | 0.689 | 2.24 × 10⁻⁴ | 2.03 × 10⁻⁴ | −0.1 | |
| Variances→ | 1.53 × 10⁻⁵ | 7.44 × 10⁻⁶ | |||
| Degrees of freedom→ | 12 | 4 | |||
| Fexperimental→ | 3.1651 | ||||
| Ftheoretical→ | 3.2592 | ||||
Disclaimer/Publisher’s Note: The statements, opinions and data contained in all publications are solely those of the individual author(s) and contributor(s) and not of MDPI and/or the editor(s). MDPI and/or the editor(s) disclaim responsibility for any injury to people or property resulting from any ideas, methods, instructions or products referred to in the content. |
© 2025 by the authors. Licensee MDPI, Basel, Switzerland. This article is an open access article distributed under the terms and conditions of the Creative Commons Attribution (CC BY) license (https://creativecommons.org/licenses/by/4.0/).
Share and Cite
Arnø, A.; Sarmiento, V.; Elvebø, O.; Araujo, P. Critical Evaluation and Validation of a High-Throughput Microplate-Based Cupric Reducing Antioxidant Capacity Method for the Analysis of Fish Feed Ingredients. Antioxidants 2025, 14, 728. https://doi.org/10.3390/antiox14060728
Arnø A, Sarmiento V, Elvebø O, Araujo P. Critical Evaluation and Validation of a High-Throughput Microplate-Based Cupric Reducing Antioxidant Capacity Method for the Analysis of Fish Feed Ingredients. Antioxidants. 2025; 14(6):728. https://doi.org/10.3390/antiox14060728
Chicago/Turabian StyleArnø, Aleksander, Viviana Sarmiento, Odd Elvebø, and Pedro Araujo. 2025. "Critical Evaluation and Validation of a High-Throughput Microplate-Based Cupric Reducing Antioxidant Capacity Method for the Analysis of Fish Feed Ingredients" Antioxidants 14, no. 6: 728. https://doi.org/10.3390/antiox14060728
APA StyleArnø, A., Sarmiento, V., Elvebø, O., & Araujo, P. (2025). Critical Evaluation and Validation of a High-Throughput Microplate-Based Cupric Reducing Antioxidant Capacity Method for the Analysis of Fish Feed Ingredients. Antioxidants, 14(6), 728. https://doi.org/10.3390/antiox14060728