
Phytochemical Profile and Antioxidant Properties of Invasive Plants Ailanthus altissima (Mill.) Swingle and Helianthus tuberosus L. in Istria Region, Croatia


 , ,
, ,  ,
,  and
and 
Abstract
1. Introduction
- (i)
- To determine total phenolic, flavonoid, and non-flavonoid contents, as well as antioxidant activity, using DPPH, ABTS, and FRAP assays;
- (ii)
- To identify and quantify individual phenolic compounds using LC-DAD-MS;
- (iii)
- To assess the influence of solvent type and plant organ on phytochemical profiles and antioxidant activity through statistical analysis.
2. Materials and Methods
2.1. Plant Material
2.2. Extraction Procedure
2.3. Total Phenolics, Flavonoids, and Non-Flavonoids Content and Antioxidant Capacity
2.4. HPLC-DAD-MS Analysis of Phenolic Compounds in Leaf and Flower Extracts
2.5. Statistical Analysis
3. Results and Discussion
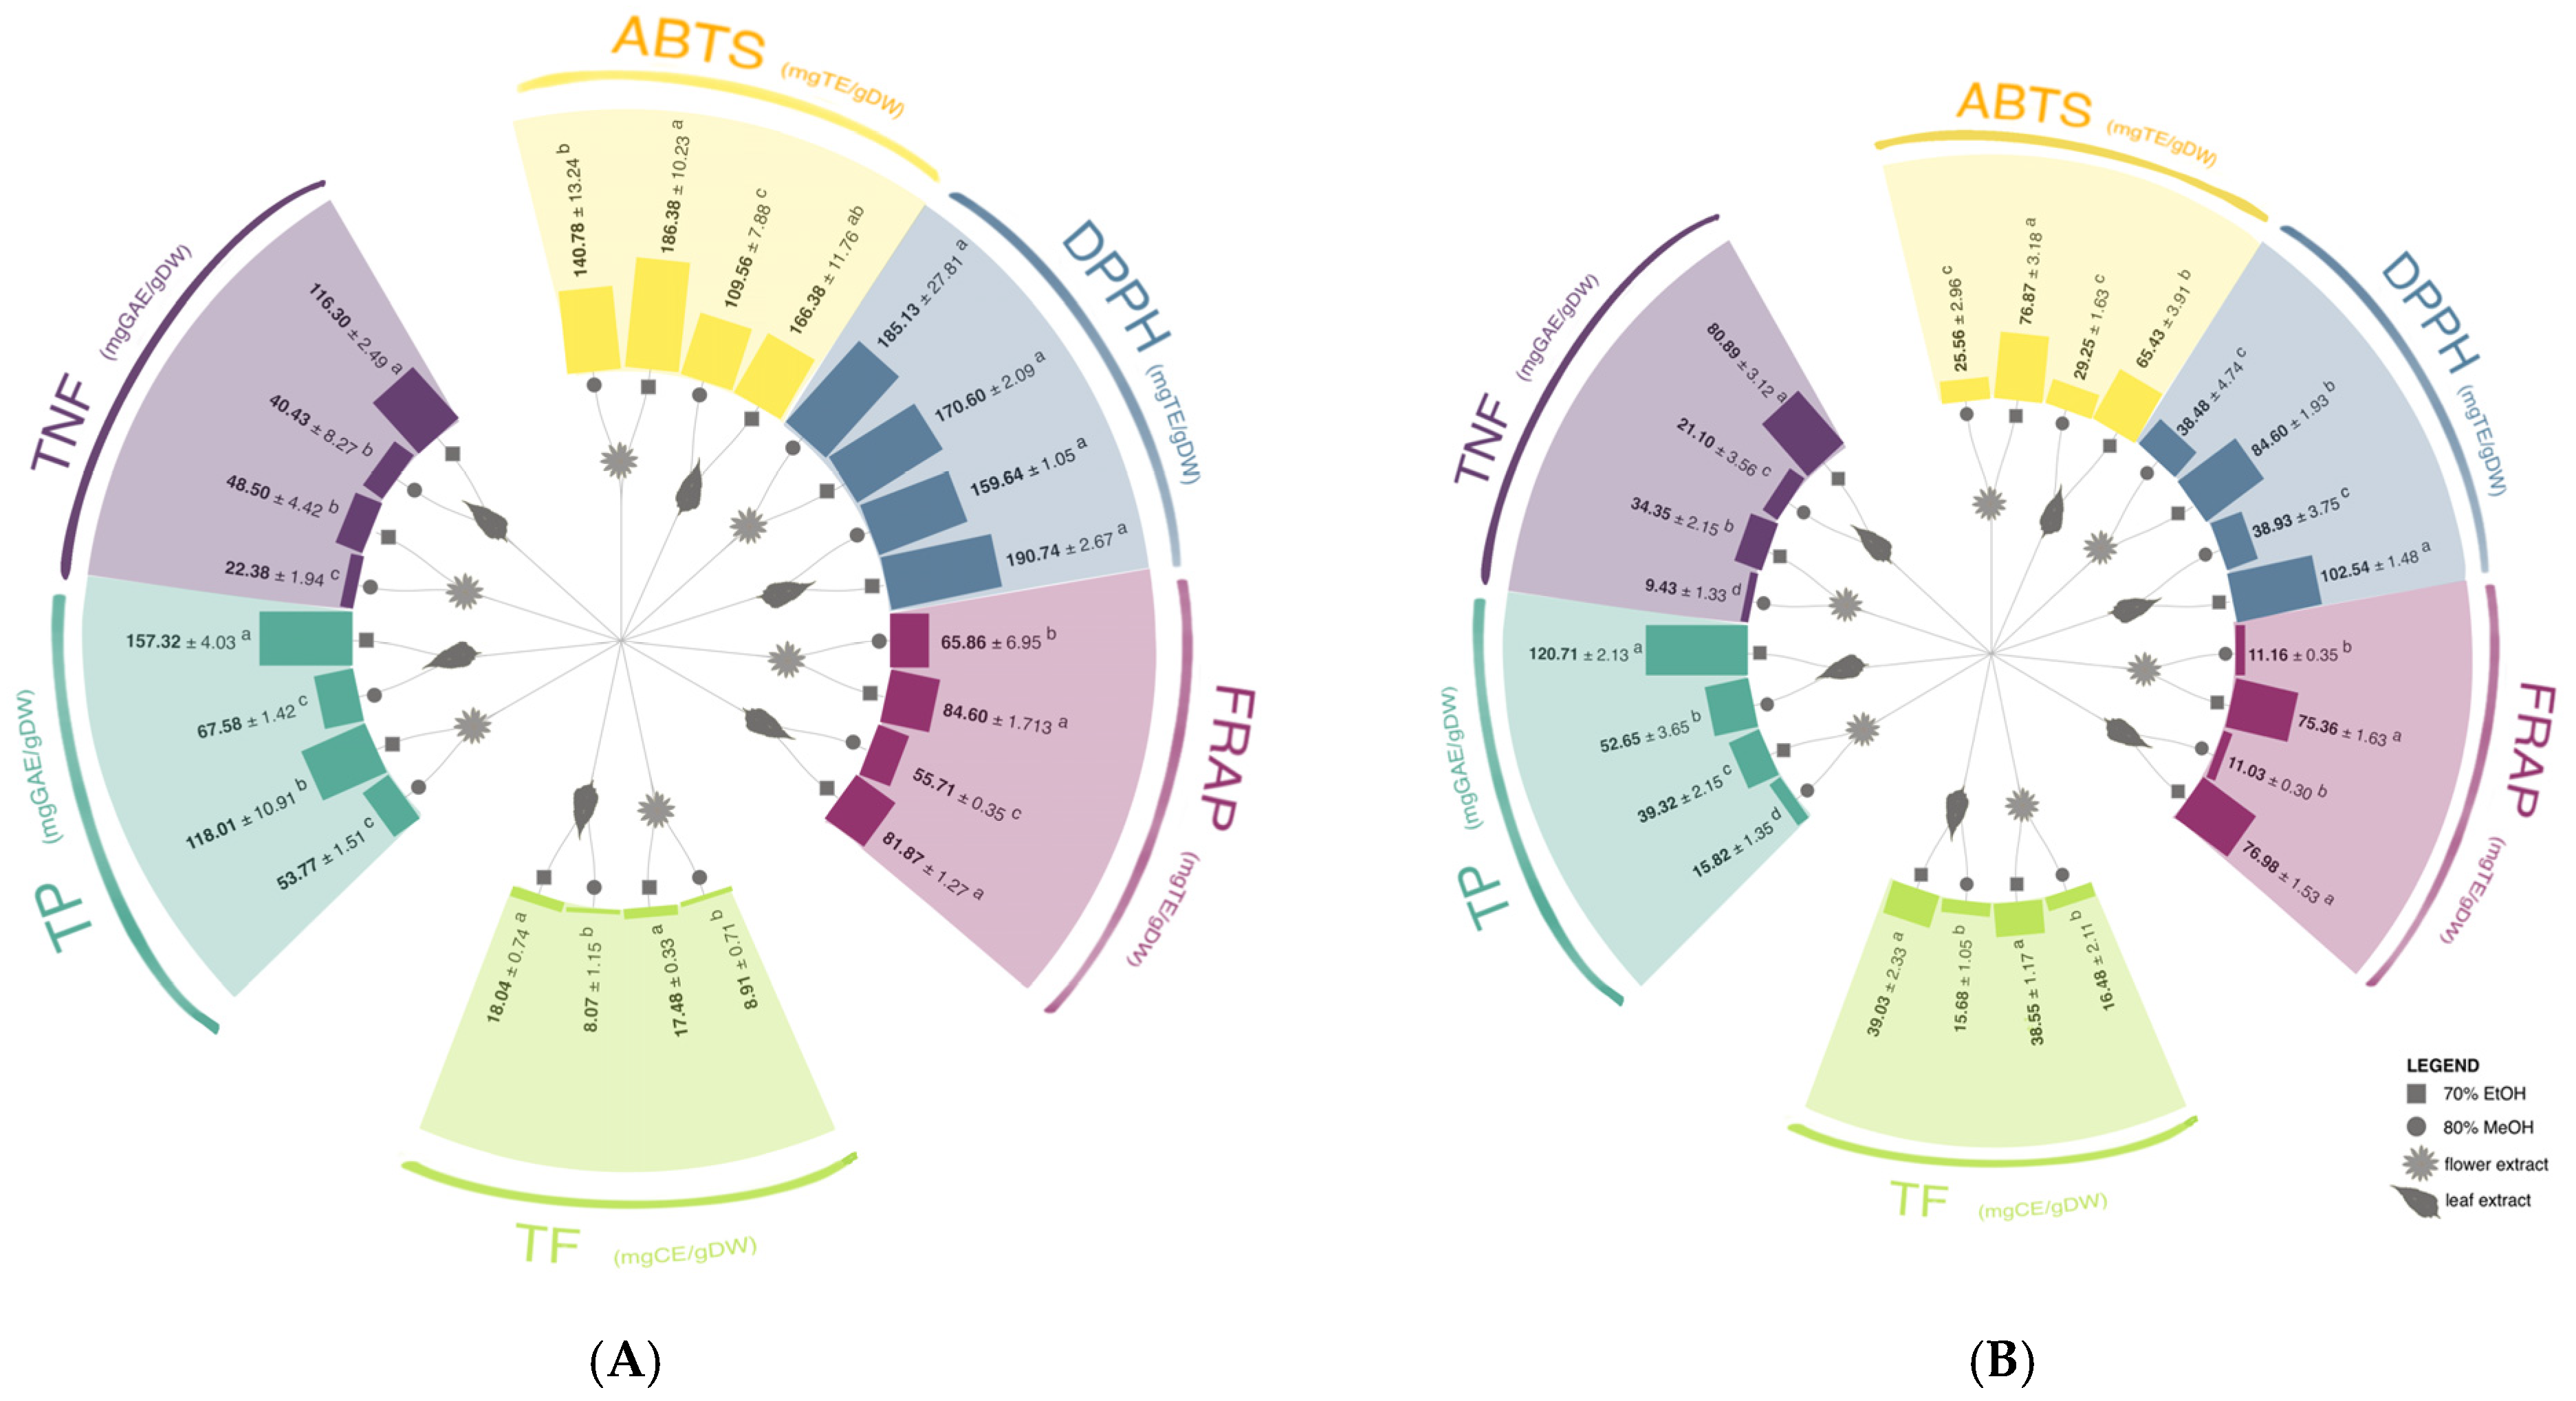
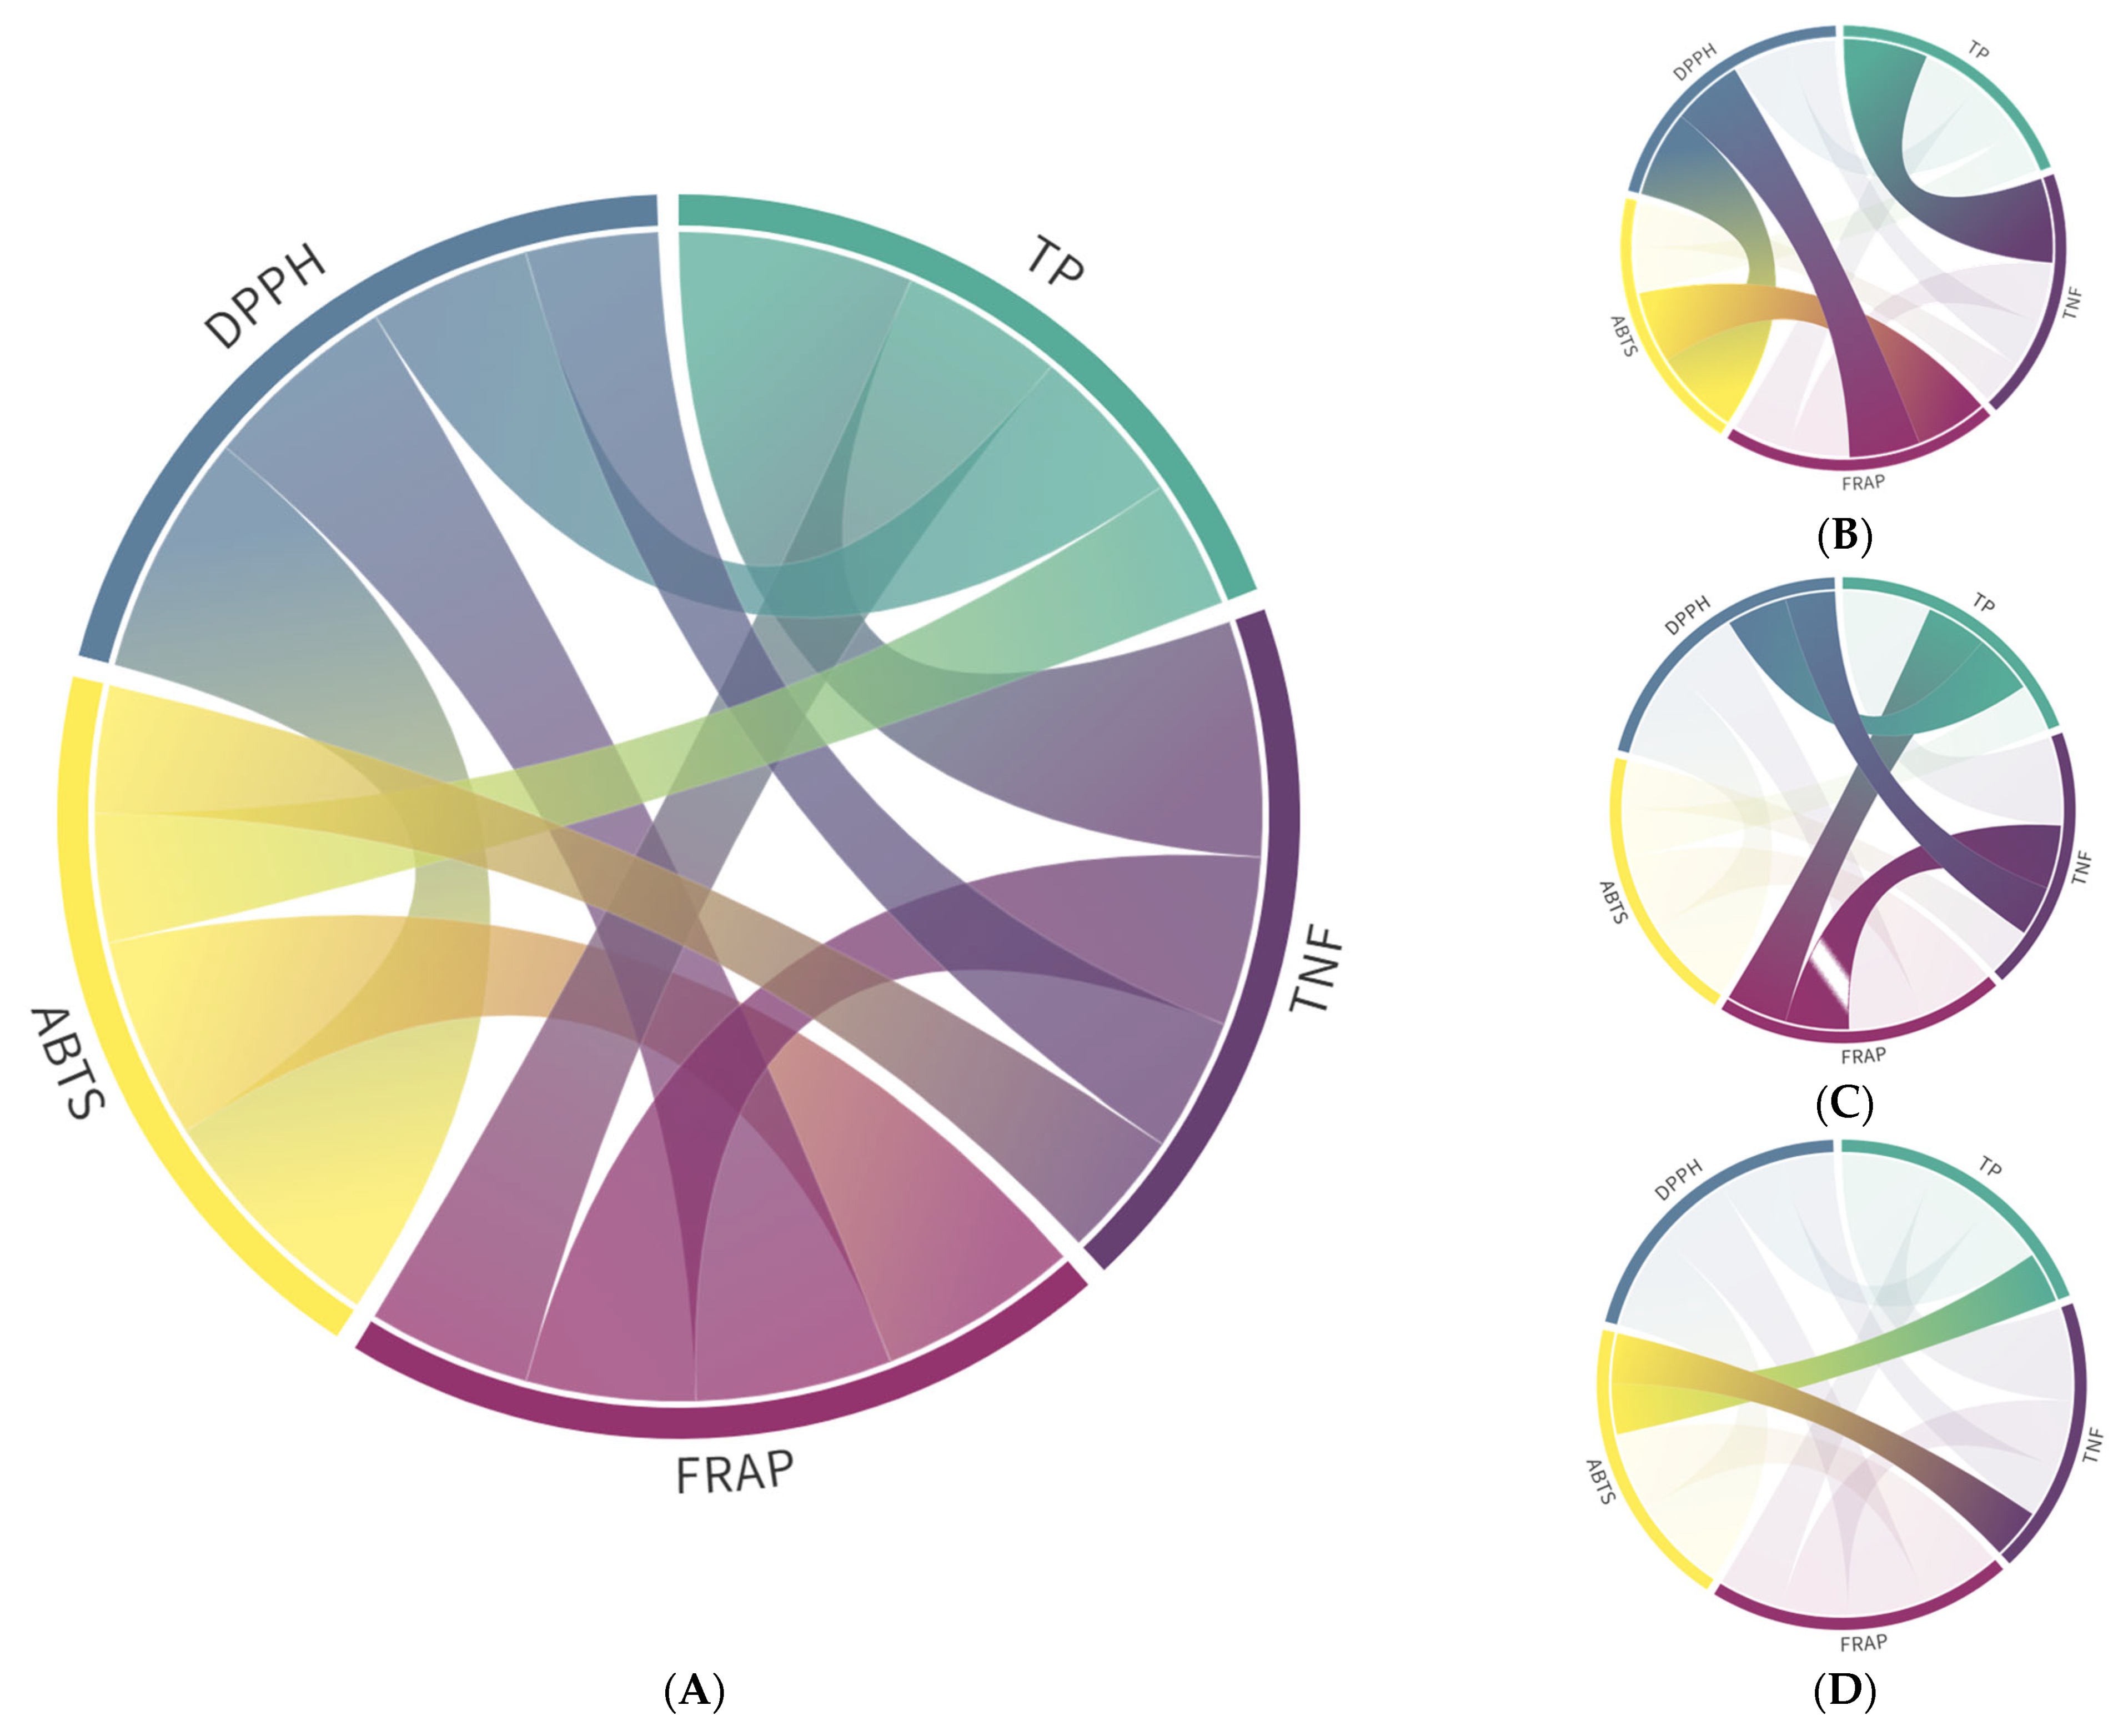
3.1. Phenolic Content and Antioxidant Capacity
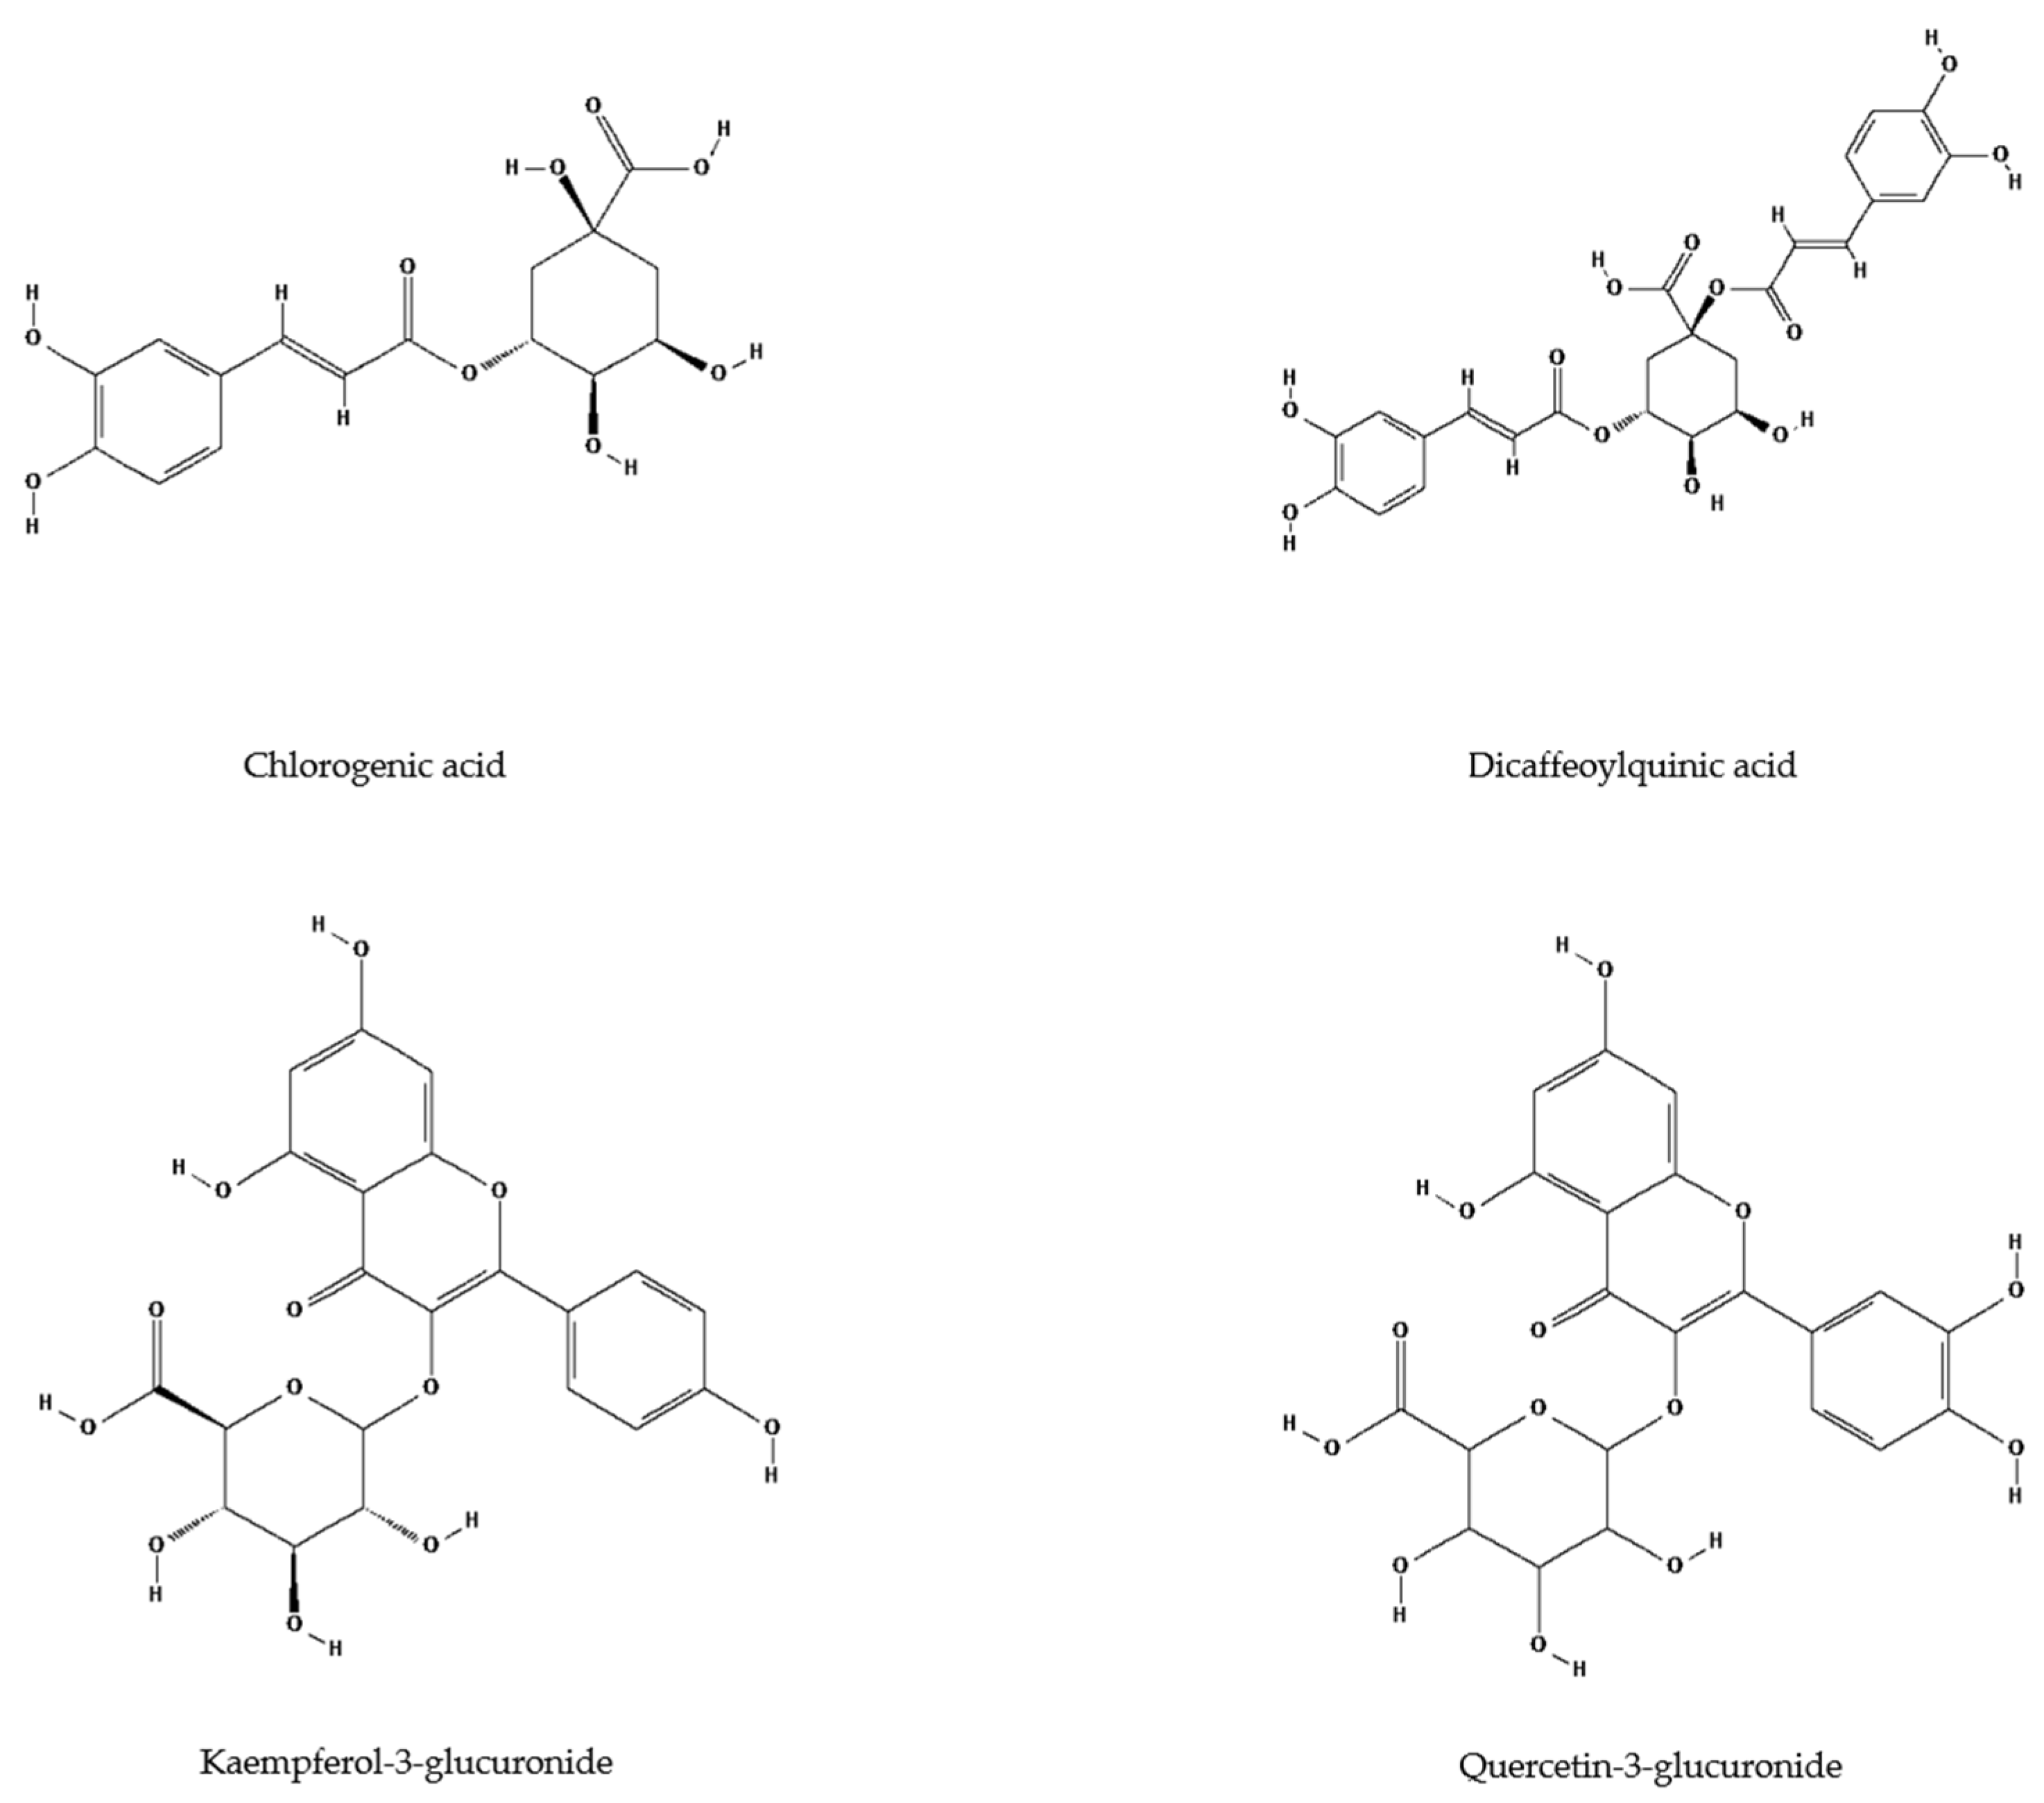
3.2. Identification and Quantification of Phenolic Compounds

| Phenolic Compounds | A. altissima | H. tuberosus | ||
|---|---|---|---|---|
| Leaf | Flower | Leaf | Flower | |
| 3-caffeoylquinic acid 1 | 0.975 ± 0.275 a | 0.924 ± 0.190 a | 0.026 ± 0.004 A | 0.405 ± 0.009 B |
| 3-caffeoylquinic acid 2 | 2.917 ± 0.122 | n.d. | n.d. | n.d. |
| 4-caffeoylquinic acid 1 | 0.543 ± 0.119 a | 0.100 ± 0.017 b | 1.336 ± 0.183 A | 0.190 ± 0.064 B |
| 4-caffeoylquinic acid 2 | 3.112 ± 0.530 a | 0.449 ± 0.015 b | n.d. | n.d. |
| 5-caffeoylquinic acid 1 | 5.298 ± 0.474 a | 1.721 ± 0.421 b | 25.341 ± 1.831 A | 2.052 ± 0.261 B |
| 5-caffeoylquinic acid 2 | 9.080 ± 1.203 | n.d. | 0.673 ± 0.061 A | 0.097 ± 0.011 B |
| Caffeic acid | 1.413 ± 0.314 a | 0.426 ± 0.029 b | 0.086 ± 0.014 A | 0.100 ± 0.012 A |
| Caffeic acid hexoside 1 | 0.374 ± 0.057 a | 0.089 ± 0.015 b | 0.439 ± 0.052 A | 0.565 ± 0.109 A |
| Caffeic acid hexoside 2 | 0.273 ± 0.086 b | 1.563 ± 0.100 a | 0.164 ± 0.024 A | 0.148 ± 0.024 A |
| Dicaffeoylquinic acid 1 | n.d. | n.d. | 0.551 ± 0.111 A | 0.205 ± 0.008 B |
| Dicaffeoylquinic acid 2 | n.d. | n.d. | 5.880 ± 0.584 A | 1.079 ± 0.043 B |
| Dicaffeoylquinic acid 3 | n.d. | n.d. | 0.599 ± 0.091 A | 0.475 ± 0.019 B |
| Dicaffeoylquinic acid 4 | n.d. | n.d. | 0.703 ± 0.047 A | 0.438 ± 0.077 B |
| p-coumaric acid hexoside 1 | 0.461 ± 0.098 a | 0.192 ± 0.033 b | n.d. | n.d. |
| 3 p-coumaroylquinic acid | 0.346 ± 0.090 a | 0.005 ± 0.001 b | 3.623 ± 0.485 A | 0.240 ± 0.013 B |
| 4-p-coumaroylquinic acid 1 | 0.788 ± 0.053 a | 0.443 ± 0.038 b | 0.153 ± 0.025 A | 0.078 ± 0.006 B |
| 4-p-coumaroylquinic acid 2 | n.d. | n.d. | 0.095 ± 0.014 | n.d. |
| 5-p-coumaroylquinic acid 1 | 0.530 ± 0.080 a | 0.424 ± 0.016 b | 0.485 ± 0.050 | n.d. |
| 5-p-coumaroylquinic acid 2 | n.d. | n.d. | 0.315 ± 0.043 A | 0.111 ± 0.025 B |
| 3-feruloylquinic acid | 0.262 ± 0.067 a | 0.399 ± 0.013 a | 0.055 ± 0.008 A | 0.115 ± 0.035 B |
| 4-feruloylquinic acid | 0.028 ± 0.002 b | 0.523 ± 0.026 a | n.d. | n.d. |
| 5-feruloylquinic acid 1 | 0.021 ± 0.003 b | 0.830 ± 0.032 a | 0.431 ± 0.036 A | 0.242 ± 0.025 B |
| 5-feruloylquinic acid 2 | n.d. | n.d. | 0.189 ± 0.024 A | 0.134 ± 0.038 B |
| Hydroxycinnamic acid derivatives | 26.771 ± 1.684 a | 8.086 ± 0.444 b | 41.126 ± 2.651 A | 6.615 ± 0.674 B |
| Gallic acid | 0.531 ± 0.081 b | 0.947 ± 0.059 a | 0.080 ± 0.193 | n.d. |
| Protocatechuic acid | 0.026 ± 0.003 b | 0.861 ± 0.106 a | 1.503 ± 0.308 A | 0.404 ± 0.060 B |
| Ellagic acid | 22.486 ± 2.276 A | 2.125 ± 0.397 b | n.d. | n.d. |
| Ellagic acid pentoside 1 | 4.948 ± 0.494 A | 3.074 ± 0.641 b | n.d. | n.d. |
| Ellagic acid pentoside 2 | 0.042 ± 0.008 b | 0.689 ± 0.063 a | n.d. | n.d. |
| Hydroxybenzoic acid derivatives | 28.037 ± 2.767 a | 7.693 ± 0.881 b | 1.583 ± 0.292 A | 0.404 ± 0.060 B |
| Procyanidin dimer 1 | 0.029 ± 0.007 b | 0.204 ± 0.050 a | n.d. | n.d. |
| Procyanidin dimer 2 | 4.373 ± 0.529 | n.d. | n.d. | n.d. |
| Epicatechin | 0.020 ± 0.003 b | 5.661 ± 0.280 a | n.d. | n.d. |
| Gallocatechin | 2.331 ± 0.203 a | 0.790 ± 0.131 b | n.d. | n.d. |
| Flavanols | 6.799 ± 0.526 a | 6.838 ± 0.272 a | n.d. | n.d. |
| Quercetin pentoside 1 | 0.336 ± 0.035 a | 0.286 ± 0.040 b | n.d. | 0.132 ± 0.027 |
| Quercetin pentoside 2 | 0.011 ± 0.002 b | 0.032 ± 0.007 a | n.d. | 0.138 ± 0.011 |
| Quercetin-3-rutinoside | 0.001 ± 0.000 | n.d. | 1.279 ± 0.196 A | 0.262 ± 0.075 B |
| Quercetin-3-galactoside | 1.926 ± 0.195 b | 2.634 ± 0.366 a | 0.489 ± 0.085 A | 0.124 ± 0.019 B |
| Quercetin-3-glucoside | 8.031 ± 0.813 a | 2.940 ± 0.550 b | 0.760 ± 0.073 A | 0.422 ± 0.050 B |
| Quercetin-3-glucuronide | n.d. | n.d. | 5.011 ± 0.227 A | 1.634 ± 0.140 B |
| Quercetin-3-rhamnoside | 0.140 ± 0.026 b | 1.004 ± 0.075 a | n.d. | n.d. |
| Quercetin galloylhexoside 1 | 0.283 ± 0.032 b | 0.617 ± 0.053 a | n.d. | n.d. |
| Quercetin galloylhexoside 2 | 0.929 ± 0.179 a | 0.953 ± 0.087 a | n.d. | n.d. |
| Quercetin acetylhexoside 1 | 3.469 ± 0.346 a | 1.010 ± 0.109 b | n.d. | n.d. |
| Quercetin acetylhexoside 2 | 0.175 ± 0.023 b | 0.363 ± 0.030 a | n.d. | n.d. |
| Quercetin-rhamnosylhexoside | n.d. | n.d. | 0.235 ± 0.006 | n.d. |
| Quercetin malosyl hexoside | n.d. | n.d. | n.d. | 0.558 ± 0.004 |
| Isorhamnetin hexoside | n.d. | n.d. | 0.240 ± 0.016 A | 0.200 ± 0.032 A |
| Isoramnetin hexosylpentoside | n.d. | n.d. | 0.470 ± 0.035 A | 0.351 ± 0.063 B |
| Isorhamnetin glucuronide | n.d. | n.d. | 0.374 ± 0.025 A | 0.184 ± 0.043 B |
| Isorhamnetin acetylhexoside | 0.214 ± 0.059 b | 0.555 ± 0.113 a | n.d. | n.d. |
| Kaempferol hexoside 1 | 1.190 ± 0.120 b | 2.075 ± 0.288 a | 0.141 ± 0.007 A | 0.117 ± 0.026 A |
| Kaempferol hexoside 2 | 0.751 ± 0.119 a | 0.362 ± 0.074 b | 5.417 ± 0.232 A | 0.055 ± 0.002 B |
| Kaempferol rhamnosylhexoside 1 | 0.087 ± 0.017 b | 0.282 ± 0.034 a | 0.048 ± 0.005 A | 0.036 ± 0.0047 B |
| Kaempferol rhamnosylhexoside 2 | 0.123 ± 0.021 b | 0.304 ± 0.069 a | n.d. | n.d. |
| Kaempferol-3-rutinoside | n.d. | n.d. | 0.918 ± 0.155 A | 0.211 ± 0.072 B |
| Kaempferol-3-glucuronide | n.d. | n.d. | 7.125 ± 0.639 A | 0.420 ± 0.054 B |
| Kaempferol acetylhexoside 1 | n.d. | n.d. | 0.474 ± 0.078 A | 0.132 ± 0.026 B |
| Kaempferol acetylhexoside 2 | 0.736 ± 0.072 a | 0.594 ± 0.073 a | n.d. | n.d. |
| Kaempferol galloylhexoside | 0.202 ± 0.035 a | 0.134 ± 0.029 b | n.d. | n.d. |
| Flavonols | 18.521 ± 1.489 a | 14.119 ± 1.376 b | 23.132 ± 1.197 A | 4.973 ± 0.244 B |
| Naringenin hexoside 1 | 0.366 ± 0.048 b | 0.656 ± 0.077 a | n.d. | n.d. |
| Naringenin hexoside 2 | 0.033 ± 0.007 a | 0.019 ± 0.002 b | n.d. | n.d. |
| Naringenin hexoside 3 | 0.046 ± 0.008 a | 0.023 ± 0.002 b | n.d. | n.d. |
| Naringenin hexoside 4 | 0.332 ± 0.053 b | 0.572 ± 0.033 a | n.d. | n.d. |
| Flavanones | 0.776 ± 0.086 b | 1.269 ± 0.086 a | n.d. | n.d. |
| Vescalagin isomer 1 | 80.705 ± 4.531 a | 54.298 ± 6.480 b | n.d. | n.d. |
| Vescalagin isomer 2 | 13.442 ± 0.706 b | 27.364 ± 1.128 a | n.d. | n.d. |
| HHDP galloylhexose | 11.989 ± 1.830 a | 8.659 ± 0.500 b | n.d. | n.d. |
| HHDP digalloylhexose isomer | 1.749 ± 0.3436 a | 0.715 ± 0.029 b | n.d. | n.d. |
| Ellagitannins | 107.431 ± 4.019 a | 91.035 ± 6.712 b | n.d. | n.d. |
| Apigenin hexoside | 0.669 ± 0.107 a | 0.142 ± 0.010 b | n.d. | n.d. |
| Flavones | 0.669 ± 0.107 a | 0.142 ± 0.010 b | n.d. | n.d. |
| TOTAL | 189.541 ± 9.473 a | 129.182 ± 7.002 b | 65.841 ± 0.560 A | 12.048 ± 0.741 B |
 A. altissima leaf extract;
  A. altissima flower extract;
  H. tuberosus leaf extract;
  H. tuberosus flower extract.
A. altissima leaf extract; A. altissima flower extract; H. tuberosus leaf extract; H. tuberosus flower extract.
H. tuberosus flower extract.
A. altissima leaf extract; A. altissima flower extract; H. tuberosus leaf extract; H. tuberosus flower extract.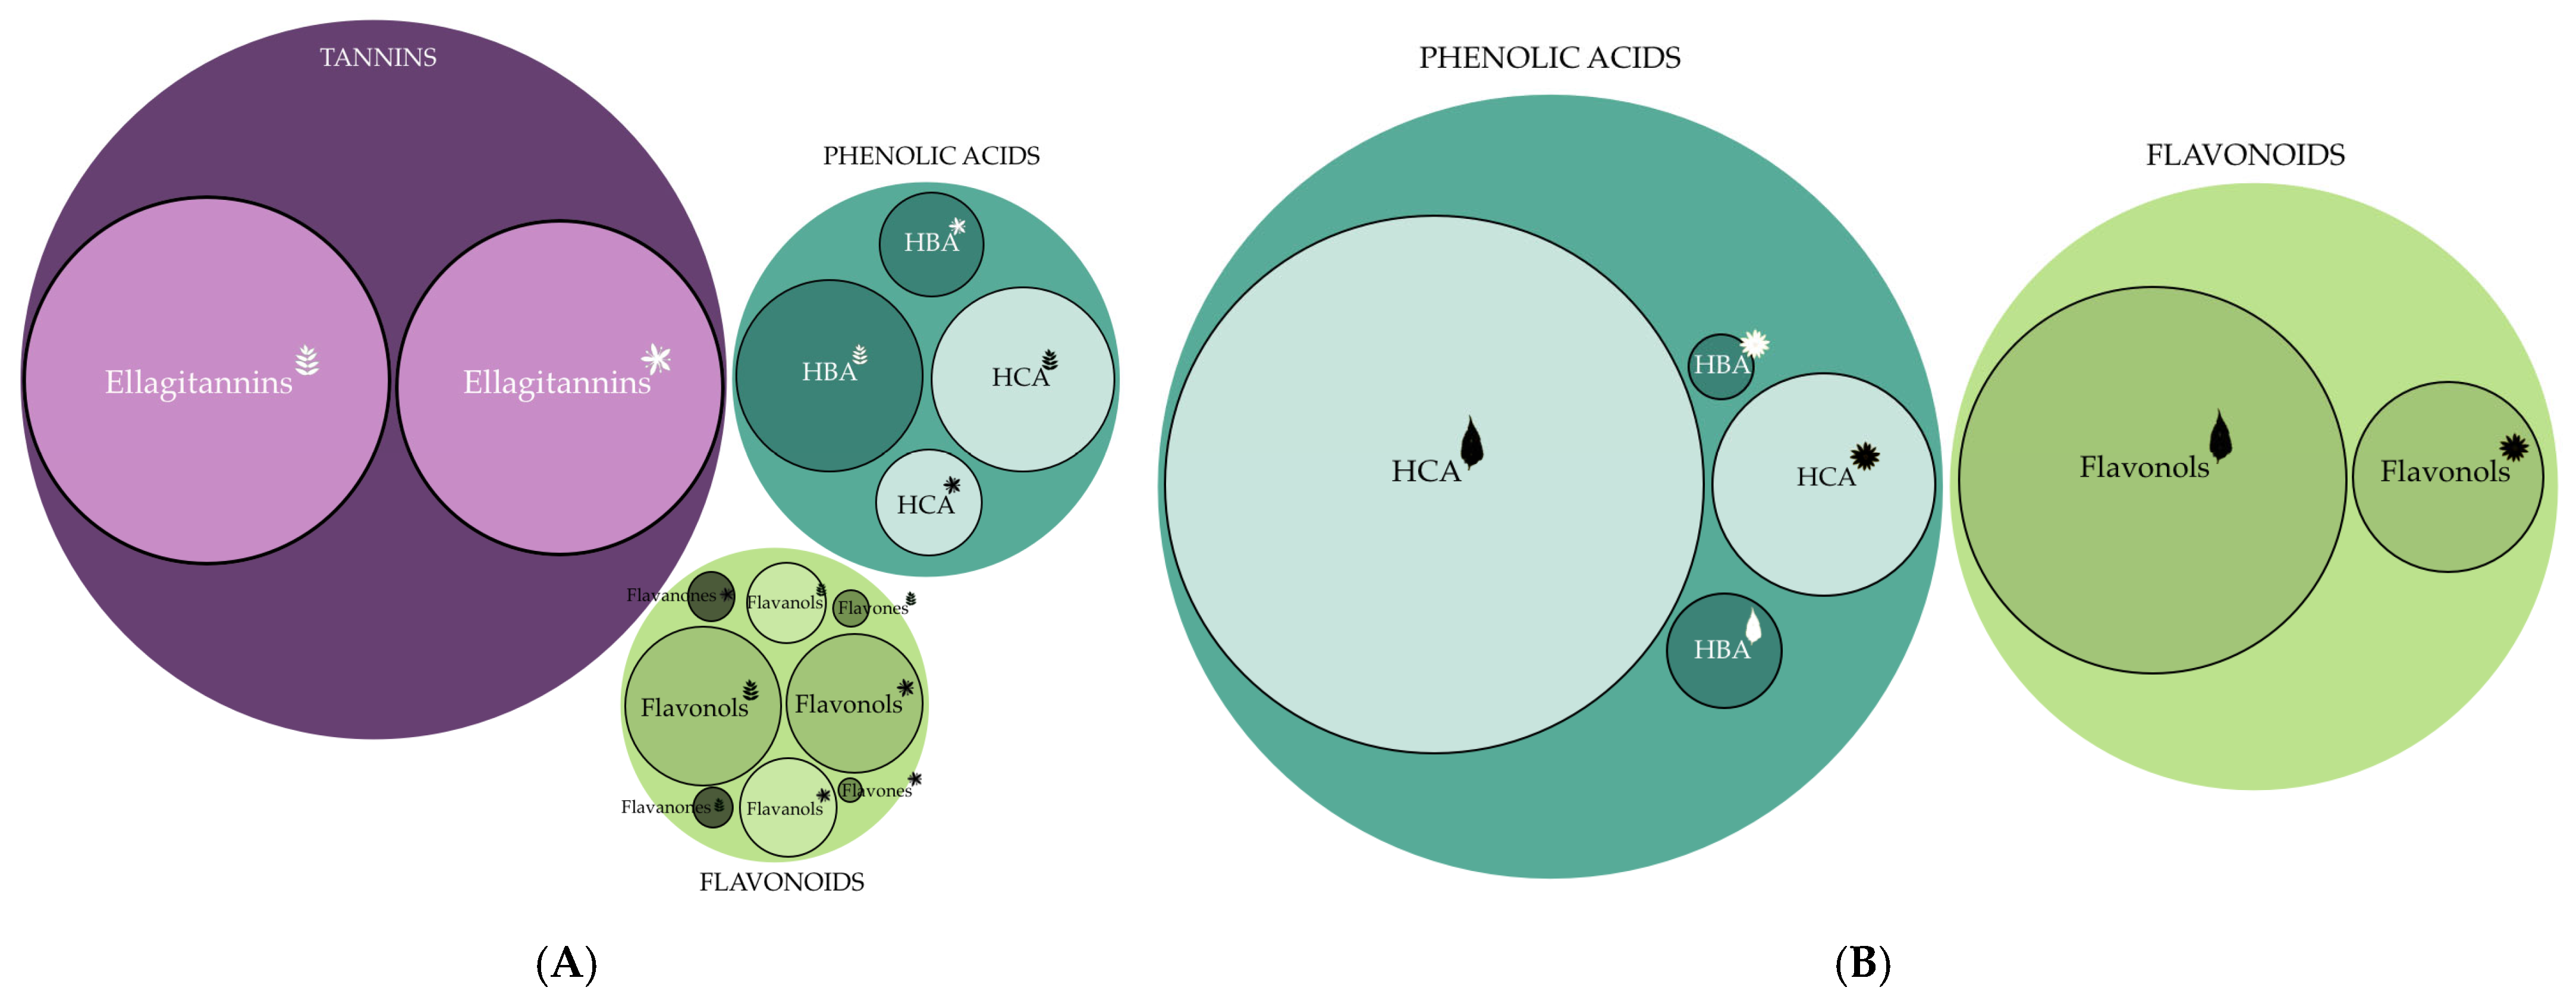
4. Conclusions
Supplementary Materials
Author Contributions
Funding
Institutional Review Board Statement
Informed Consent Statement
Data Availability Statement
Acknowledgments
Conflicts of Interest
References
- Uzelac, M.; Sladonja, B.; Šola, I.; Dudaš, S.; Bilić, J.; Famuyide, I.M.; McGaw, L.J.; Eloff, J.N.; Mikulic-Petkovsek, M.; Poljuha, D. Invasive Alien Species as a Potential Source of Phytopharmaceuticals: Phenolic Composition and Antimicrobial and Cytotoxic Activity of Robinia pseudoacacia L. Leaf and Flower Extracts. Plants 2023, 12, 2715. [Google Scholar] [CrossRef] [PubMed]
- Purmalis, O.; Klavins, L.; Niedrite, E.; Mezulis, M.; Klavins, M. Invasive Plants as a Source of Polyphenols with High Radical Scavenging Activity. Plants 2025, 14, 467. [Google Scholar] [CrossRef] [PubMed]
- Kim, Y.O.; Lee, E.J. Comparison Of Phenolic Compounds And The Effects of Invasive and Native Species in East Asia: Support for The Novel Weapons Hypothesis. Ecol. Res. 2011, 26, 87–94. [Google Scholar] [CrossRef]
- Kato-Noguchi, H.; Kato, M. Allelopathy and Allelochemicals of Solidago canadensis L. and S. altissima L. for Their Naturalization. Plants 2022, 11, 3235. [Google Scholar] [CrossRef] [PubMed]
- Batish, D.R.; Singh, H.P.; Priyanka, S.K.; Kohli, R.K. Novel Weapon Hypothesis for the Successful Establishment of Invasive Plants in Alien Environments. In Invasive Plant Ecology; Jose, S., Singh, H.P., Batish, D.R., Kohli, R.K., Eds.; Taylor and Francis Group: Abingdon, UK, 2013; pp. 19–28. [Google Scholar]
- Kumar Rai, P.; Singh, J.S. Invasive Alien Plant Species: Their Impact on Environment, Ecosystem Services and Human Health. Ecol. Indic. 2020, 111, 106020. [Google Scholar] [CrossRef]
- Demeter, A.; Saláta, D.; Tormáné Kovács, E.; Szirmai, O.; Trenyik, P.; Meinhardt, S.; Rusvai, K.; Verbényiné Neumann, K.; Schermann, B.; Szegleti, Z.; et al. Effects of the Invasive Tree Species Ailanthus altissima on the Floral Diversity and Soil Properties in the Pannonian Region. Land 2021, 10, 1155. [Google Scholar] [CrossRef]
- Sladonja, B.; Sušek, M.; Guillermic, J. Review on Invasive Tree of Heaven (Ailanthus altissima (Mill.) Swingle) Conflicting Values: Assessment of Its Ecosystem Services and Potential Biological Threat. Environ. Manag. 2015, 56, 1009–1034. [Google Scholar] [CrossRef]
- Feret, P.P. Ailanthus: Variation, Cultivation, and Frustration. J. Arboric. 1985, 11, 361–368. [Google Scholar] [CrossRef]
- Kowarik, I.; Säumel, I. Biological Flora of Central Europe: Ailanthus Altissima (Mill.) Swingle. Perspect. Plant Ecol. Evol. Syst. 2007, 8, 207–237. [Google Scholar] [CrossRef]
- Regulation (EU) 2019/1262. Commission Implementing Regulation (EU) 2019/1262 of 25 July 2019 Amending Implementing Regulation (EU) 2016/1141 to Update the List of Invasive Alien Species of Union Concern. Available online: https://eur-lex.europa.eu/legal-content/EN/TXT/?qid=1565100914543&uri=CELEX:32019R1262 (accessed on 17 October 2024).
- Strane Invazivne Vrste. Available online: https://invazivnevrste.haop.hr/karta (accessed on 17 October 2024).
- Heisey, R.M. Identification of an Allelopathic Compound from Ailanthus altissima (Simaroubaceae) and Characterization of Its Herbicidal Activity. Am. J Bot. 1996, 83, 192–200. [Google Scholar] [CrossRef]
- Meng, P.; Pei, H.; Hu, W.; Liu, Z.; Li, X.; Xu, H. Allelopathic Effects of Ailanthus altissima Extracts on Microcystis aeruginosa Growth, Physiological Changes and Microcystins Release. Chemosphere 2015, 141, 219–226. [Google Scholar] [CrossRef] [PubMed]
- Ullah, Z. Allelopathic Effect of Ailanthus altissima on Wheat (Triticum aestivum L.). Pure Appl. Biol. 2020, 9, 328–336. [Google Scholar] [CrossRef]
- Poljuha, D.; Sladonja, B.; Šola, I.; Dudaš, S.; Bilić, J.; Rusak, G.; Motlhatlego, K.E.; Eloff, J.N. Phenolic Composition of Leaf Extracts of Ailanthus altissima (Simaroubaceae) with Antibacterial and Antifungal Activity Equivalent to Standard Antibiotics. Nat. Prod. Commun. 2017, 12, 1934578X1701201021. [Google Scholar] [CrossRef]
- Marinaș, I.C.; Dinu, M.; Ancuceanu, R.; Hovaneț, M.V.; Oprea, E.; Geană, E.-I.; Lazăr, V. The Phenols Content and Phytotoxic Capacity of Various Invasive Plants. Rom. Biotechnol. Lett. 2018, 23, 13887–13899. [Google Scholar] [CrossRef]
- Andonova, T.G.; Dimitrova-Dyulgerova, I.Z.; Slavov, Z.; Dincheva, I.N.; Stoyanova, A.S. Volatile Compounds in Flowers, Samaras, Leaves and Stem Bark of Ailanthus altissima (Mill.) Swingle, Growing in Bulgaria. IOP Conf. Ser. Mater. Sci. Eng. 2021, 1031, 012087. [Google Scholar] [CrossRef]
- Mohamed, H.; El-Wakil, E.; Abdel-Hameed, E.-S.; El-Hashash, M.; Shemis, M. Evaluation of Total Phenolics, Flavonoids, and Antioxidant and Cytotoxic Potential of Ailanthus altissima (Mill.) Swingle Leaves. J. Rep. Pharm. Sci. 2021, 10, 130. [Google Scholar] [CrossRef]
- Poljuha, D.; Sladonja, B.; Šola, I.; Šenica, M.; Uzelac, M.; Veberič, R.; Hudina, M.; Famuyide, I.M.; Eloff, J.N.; Mikulic-Petkovsek, M. LC–DAD–MS Phenolic Characterisation of Six Invasive Plant Species in Croatia and Determination of Their Antimicrobial and Cytotoxic Activity. Plants 2022, 11, 596. [Google Scholar] [CrossRef] [PubMed]
- Andonova, T.; Muhovski, Y.; Slavov, I.; Vrancheva, R.; Georgiev, V.; Apostolova, E.; Naimov, S.; Mladenov, R.; Pavlov, A.; Dimitrova-Dyulgerova, I. Phenolic Profile, Antioxidant and DNA-Protective Capacity, and Microscopic Characters of Ailanthus altissima Aerial Substances. Plants 2023, 12, 920. [Google Scholar] [CrossRef]
- Popay, I. Helianthus tuberosus (Jerusalem artichoke); CABI Compendium: Wallingford, UK, 2022. [Google Scholar] [CrossRef]
- Liava, V.; Karkanis, A.; Danalatos, N.; Tsiropoulos, N. Cultivation Practices, Adaptability and Phytochemical Composition of Jerusalem Artichoke (Helianthus tuberosus L.): A Weed with Economic Value. Agronomy 2021, 11, 914. [Google Scholar] [CrossRef]
- Yang, L.; He, Q.S.; Corscadden, K.; Udenigwe, C.C. The Prospects of Jerusalem Artichoke in Functional Food Ingredients and Bioenergy Production. Biotechnol. Rep. 2015, 5, 77–88. [Google Scholar] [CrossRef]
- Showkat, M.M.; Falck-Ytter, A.B.; Strætkvern, K.O. Phenolic Acids in Jerusalem Artichoke (Helianthus tuberosus L.): Plant Organ Dependent Antioxidant Activity and Optimized Extraction from Leaves. Molecules 2019, 24, 3296. [Google Scholar] [CrossRef] [PubMed]
- Zhou, B.; Jin, Z.; Schwarz, P.; Li, Y. Impact of Genotype, Environment, and Malting Conditions on the Antioxidant Activity and Phenolic Content in US Malting Barley. Fermentation 2020, 6, 48. [Google Scholar] [CrossRef]
- Pérez-Ochoa, M.L.; Vera-Guzmán, A.M.; Mondragón-Chaparro, D.M.; Sandoval-Torres, S.; Carrillo-Rodríguez, J.C.; Chávez-Servia, J.L. Effects of Growth Conditions on Phenolic Composition and Antioxidant Activity in the Medicinal Plant Ageratina petiolaris (Asteraceae). Diversity 2022, 14, 595. [Google Scholar] [CrossRef]
- Griskeviciene, U.; Dambrauskiene, J.; Marksa, M.; Mazeliene, Z.; Vainoriene, R.; Ivanauskas, L. Effect of the Phenological Stage on the Phenolic Composition, and Antioxidant and Antimicrobial Properties of Cirsium vulgare (Savi) Ten. Extracts. Life 2024, 14, 1191. [Google Scholar] [CrossRef]
- Cocîrlea, M.D.; Soare, A.; Petrovici, A.R.; Silion, M.; Călin, T.; Oancea, S. Phenolic Composition and Bioactivities of Invasive Ailanthus altissima (Mill.) Swingle Leaf Extracts Obtained by Two-Step Sequential Extraction. Antioxidants 2024, 13, 824. [Google Scholar] [CrossRef] [PubMed]
- Bilić, J.; Svorcina, M.; Poljuha, D. Antioxidant Capacity of Fruit Species Characteristic for Gardens in Istria (Croatia). In Proceedings of the 9th International Congress of Food Technologists, Biotechnologists and Nutritionists, Zagreb, Croatia, 3–5 October 2018. [Google Scholar]
- Mikulic-Petkovsek, M.; Schmitzer, V.; Stampar, F.; Veberic, R.; Koron, D. Changes in Phenolic Content Induced by Infection with Didymella Applanata and Leptosphaeria Coniothyrium, the Causal Agents of Raspberry Spur and Cane Blight. Plant Pathol. 2014, 63, 185–192. [Google Scholar] [CrossRef]
- Singleton, V.L.; Rossi, J.A. Colorimetry of Total Phenolics with Phosphomolybdic-Phosphotungstic Acid Reagents. Am. J. Enol. Vitic. 1965, 16, 144–158. [Google Scholar] [CrossRef]
- Amerine, M.A.; Ough, C.S. Methods for Analysis of Musts and Wines. J. Inst. Brew. 1981, 87, 223–224. [Google Scholar] [CrossRef]
- Martins, D.; Barros, L.; Carvalho, A.M.; Ferreira, I.C.F.R. Nutritional and In Vitro Antioxidant Properties of Edible Wild Greens in Iberian Peninsula Traditional Diet. Food Chem. 2011, 125, 488–494. [Google Scholar] [CrossRef]
- Poljuha, D.; Šola, I.; Bilić, J.; Dudaš, S.; Bilušić, T.; Markić, J.; Rusak, G. Phenolic Composition, Antioxidant Capacity, Energy Content and Gastrointestinal Stability of Croatian Wild Edible Plants. Eur. Food Res. Technol. 2015, 241, 573–585. [Google Scholar] [CrossRef]
- Mikulic-Petkovsek, M.; Koron, D.; Rusjan, D. The Impact of Food Processing on the Phenolic Content in Products Made from Juneberry (Amelanchier lamarckii) Fruits. J. Food Sci. 2020, 85, 386–393. [Google Scholar] [CrossRef] [PubMed]
- Mikulic-Petkovsek, M.; Stampar, F.; Veberic, R.; Sircelj, H. Wild Prunus Fruit Species as a Rich Source of Bioactive Compounds. J. Food Sci. 2016, 81, C941–C950. [Google Scholar] [CrossRef] [PubMed]
- Clifford, M.N.; Knight, S.; Kuhnert, N. Discriminating between the Six Isomers of Dicaffeoylquinic Acid by LC-MSn. J. Agric. Food Chem. 2005, 53, 3821–3832. [Google Scholar] [CrossRef]
- Luís, Â.; Gil, N.; Amaral, M.E.; Domingues, F.; Duarte, A.P. Ailanthus altissima (Miller) Swingle: A Source of Bioactive Compounds with Antioxidant Activity. BioResources 2012, 7, 2105–2120. [Google Scholar] [CrossRef]
- Sreekanth, D.; Devi, P. Qualitative and Quantitative Phytochemical Studies of Helianthus tuberosus L. J. Pharmacogn. Phytochem. 2019, 8, 247–250. [Google Scholar] [CrossRef]
- Alyas, N.D.; Zulkifli, N.; Noor Hasnan, N.Z. Evaluation of Total Phenolic Content and Antioxidant Activities from Different Extraction Techniques of Helianthus tuberosus. Asian Aust. Food Res. J. 2020, 9, a0000165. [Google Scholar] [CrossRef]
- Chen, F.; Long, X.; Liu, Z.; Shao, H.; Liu, L. Analysis of Phenolic Acids of Jerusalem Artichoke (Helianthus tuberosus L.) Responding to Salt-Stress by Liquid Chromatography/Tandem Mass Spectrometry. Sci. World J. 2014, 2014, 568043. [Google Scholar] [CrossRef]
- Do, Q.-D.; Angkawijaya, A.E.; Tran-Nguyen, P.L.; Huynh, L.H.; Soetaredjo, F.E.; Ismadji, S.; Ju, Y.-H. Effect of Extraction Solvent on Total Phenol Content, Total Flavonoid Content, and Antioxidant Activity of Limnophila aromatica. J. Food Drug Anal. 2014, 22, 296–302. [Google Scholar] [CrossRef]
- Yuan, X.; Gao, M.; Xiao, H.; Tan, C.; Du, Y. Free Radical Scavenging Activities and Bioactive Substances of Jerusalem Artichoke (Helianthus tuberosus L.) Leaves. Food Chem. 2012, 133, 10–14. [Google Scholar] [CrossRef]
- US Food and Drug Administration (FDA). Title 21 Code of Federal Regulations (CFR) §184.1293—Ethyl Alcohol. Available online: https://www.ecfr.gov/current/title-21/chapter-I/subchapter-B/part-184/subpart-B/section-184.1293 (accessed on 23 May 2025).
- Poljuha, D.; Uzelac Božac, M.; Čondić, A.; Pavičić, I.; Sladonja, B.; Barišić, K. Exploring the Medicinal Potential of Invasive Plants: Impact on Cellular and Extracellular Glutathione-S-Transferase Activity. J. Polytech. Rijeka 2025, 13, 405–417. [Google Scholar]
- Kaszás, L.; Alshaal, T.; El-Ramady, H.; Kovács, Z.; Koroknai, J.; Elhawat, N.; Nagy, É.; Cziáky, Z.; Fári, M.; Domokos-Szabolcsy, É. Identification of Bioactive Phytochemicals in Leaf Protein Concentrate of Jerusalem Artichoke (Helianthus tuberosus L.). Plants 2020, 9, 889. [Google Scholar] [CrossRef] [PubMed]
- Peng, S.; Scalbert, A.; Monties, B. Insoluble Ellagitannins in Castanea sativa and Quercus petraea Woods. Phytochemistry 1991, 30, 775–778. [Google Scholar] [CrossRef]
- Auzanneau, C.; Montaudon, D.; Jacquet, R.; Puyo, S.; Pouységu, L.; Deffieux, D.; Elkaoukabi-Chaibi, A.; De Giorgi, F.; Ichas, F.; Quideau, S.; et al. The Polyphenolic Ellagitannin Vescalagin Acts as a Preferential Catalytic Inhibitor of the α Isoform of Human DNA Topoisomerase II. Mol. Pharmacol. 2012, 82, 134–141. [Google Scholar] [CrossRef]
- Shen, S.C.; Chang, W.C. Hypotriglyceridemic and Hypoglycemic Effects of Vescalagin from Pink Wax Apple [Syzygium samarangense (Blume) Merrill and Perry Cv. Pink] in High-Fructose Diet-Induced Diabetic Rats. Food Chem. 2013, 136, 858–863. [Google Scholar] [CrossRef]
- Araújo, A.R.; Araújo, A.C.; Reis, R.L.; Pires, R.A. Vescalagin and Castalagin Present Bactericidal Activity Toward Methicillin-Resistant Bacteria. ACS Biomater. Sci. Eng. 2021, 7, 1022–1030. [Google Scholar] [CrossRef] [PubMed]
- Chen, H.; Zuo, Y.; Deng, Y. Separation and Determination of Flavonoids and Other Phenolic Compounds in Cranberry Juice by High-Performance Liquid Chromatography. J. Chromatogr. A 2001, 913, 387–395. [Google Scholar] [CrossRef]
- Lee, S.; Lee, J.; Lee, H.; Sung, J. Relative Protective Activities of Quercetin, Quercetin-3-Glucoside, and Rutin in Alcohol-Induced Liver Injury. J. Food Biochem. 2019, 43, e13002. [Google Scholar] [CrossRef]
- Prakash, M.; Basava, R.B.V.; Murthy, K.N.; Mohithe, P.M. Biological Functions of Epicatechin: Plant Cell to Human Cell Health. J. Funct. Foods 2018, 52, 14–24. [Google Scholar] [CrossRef]
- Qu, Z.; Liu, A.; Li, P.; Liu, C.; Xiao, W.; Huang, J.; Liu, Z.; Zhang, S. Advances in Physiological Functions and Mechanisms of (−)-Epicatechin. Crit. Rev. Food Sci. Nutr. 2021, 61, 211–233. [Google Scholar] [CrossRef]
- Tchoné, M.; Bärwald, G.; Annemüller, G.; Fleischer, L. Séparation et Identification Des Composés Phénoliques Du Topinambour (Helianthus tuberosus L.). Sci. Aliments 2006, 26, 394–408. [Google Scholar] [CrossRef]
- Kapusta, I.; Krok, E.S.; Jamro, D.B.; Cebulak, T.; Kaszuba, J.; Salach, R.T. Identification and Quantification of Phenolic Compounds from Jerusalem Artichoke (Helianthus tuberosus L.) Tubers. J. Food Agric. Environ. 2013, 11, 601–606. [Google Scholar]
- Bach, V.; Clausen, M.; Edelenbos, M. Production of Jerusalem Artichoke (Helianthus tuberosus L.) and Impact on Inulin and Phenolic Compounds. In Postharvest Physiology and Biochemistry of Fruits and Vegetables; Yahia, E.M., Ed.; Woodhead Publishing: Cambridge, UK, 2019; pp. 277–292. [Google Scholar] [CrossRef]
- Meinhart, A.D.; Damin, F.M.; Caldeirão, L.; de Jesus Filho, M.; da Silva, L.C.; da Silva Constant, L.; Teixeira Filho, J.; Wagner, R.; Teixeira Godoy, H. Study of New Sources of Six Chlorogenic Acids and Caffeic Acid. J. Food Compos. Anal. 2019, 82, 103244. [Google Scholar] [CrossRef]
- Huang, J.; Xie, M.; He, L.; Song, X.; Cao, T. Chlorogenic Acid: A Review on Its Mechanisms of Anti-Inflammation, Disease Treatment, and Related Delivery Systems. Front. Pharmacol. 2023, 14, 1218015. [Google Scholar] [CrossRef]
- Song, D.; Zhang, L.; Liu, Q.; Chen, J.; Wang, T.; Li, X.; Wu, J. Research Progress on the Structural and Functional Comparison, Structural Modification of Chlorogenic Acid and Its Isomers and Application in Animals. Chin. J. Anim. Sci. 2023, 59, 10–19. [Google Scholar]
- Zhang, Q.; Kim, H.-Y. Antioxidant, Anti-Inflammatory and Cytotoxicity on Human Lung Epithelial A549 Cells of Jerusalem Artichoke (Helianthus tuberosus L.) Tuber. Korean J. Plant Res. 2015, 28, 305–311. [Google Scholar] [CrossRef]
- Jantaharn, P.; Mongkolthanaruk, W.; Senawong, T.; Jogloy, S.; McCloskey, S. Bioactive Compounds from Organic Extracts of Helianthus tuberosus L. Flowers. Ind. Crops Prod. 2018, 119, 57–63. [Google Scholar] [CrossRef]
- Zhu, W.; Cadet, P.; Neuwirth, L.S. Bioactive Chemicals in Helianthus tuberosus L May Reduce Beta-Amyloid Cytotoxicity as a Potential Novel Treatment for Alzheimer’s Disease. In Studies in Natural Products Chemistry; Elsevier: Amsterdam, The Netherlands, 2023; Volume 77, pp. 111–134. ISBN 978-0-323-91294-5. [Google Scholar]
- Docampo, M.; Olubu, A.; Wang, X.; Pasinetti, G.; Dixon, R.A. Glucuronidated Flavonoids in Neurological Protection: Structural Analysis and Approaches for Chemical and Biological Synthesis. J. Agric. Food Chem. 2017, 65, 7607–7623. [Google Scholar] [CrossRef] [PubMed]
- Ho, L.; Ferruzzi, M.G.; Janle, E.M.; Wang, J.; Gong, B.; Chen, T.Y.; Lobo, J.; Cooper, B.; Wu, Q.L.; Talcott, S.T.; et al. Identification of Brain Targeted Bioactive Dietary Quercetin-3-O-Glucuronide as a Novel Intervention for Alzheimer’s Disease. FASEB J. 2013, 27, 769–781. [Google Scholar] [CrossRef]
- Aruoma, O.I. Methodological Considerations for Characterizing Potential Antioxidant Actions of Bioactive Components in Plant Foods. Mutat. Res. 2003, 523, 9–20. [Google Scholar] [CrossRef]
- Luís, Â.; Domingues, F.; Domingues, P. Flavonoids as Antioxidants: Mechanisms and Structure-Activity Relationships. Food Chem. 2012, 130, 691–700. [Google Scholar] [CrossRef]
- Tapera, R.F.; Siwe-Noundou, X.; Shai, L.J.; Mokhele, S. Exploring the Therapeutic Potential, Ethnomedicinal Values, and Phytochemistry of Helianthus tuberosus L.: A Review. Pharmaceuticals 2024, 17, 1672. [Google Scholar] [CrossRef] [PubMed]
- Tanasković, S.; Gvozdenac, S.; Kolarov, R.; Bursić, V.; Konstantinović, B.; Prvulović, D. Antifeeding and Insecticidal Activity of Ailanthus altissima and Morus alba Extracts against Gypsy Moth (Lymantria dispar [L.], Lepidoptera, Lymantridae) Larvae under Laboratory Conditions. J. Entomol. Res. Soc. 2021, 23, 197–212. [Google Scholar] [CrossRef]


Disclaimer/Publisher’s Note: The statements, opinions and data contained in all publications are solely those of the individual author(s) and contributor(s) and not of MDPI and/or the editor(s). MDPI and/or the editor(s) disclaim responsibility for any injury to people or property resulting from any ideas, methods, instructions or products referred to in the content. |
© 2025 by the authors. Licensee MDPI, Basel, Switzerland. This article is an open access article distributed under the terms and conditions of the Creative Commons Attribution (CC BY) license (https://creativecommons.org/licenses/by/4.0/).
Share and Cite
Božac, M.U.; Poljuha, D.; Dudaš, S.; Bilić, J.; Šola, I.; Mikulič-Petkovšek, M.; Sladonja, B. Phytochemical Profile and Antioxidant Properties of Invasive Plants Ailanthus altissima (Mill.) Swingle and Helianthus tuberosus L. in Istria Region, Croatia. Antioxidants 2025, 14, 677. https://doi.org/10.3390/antiox14060677
Božac MU, Poljuha D, Dudaš S, Bilić J, Šola I, Mikulič-Petkovšek M, Sladonja B. Phytochemical Profile and Antioxidant Properties of Invasive Plants Ailanthus altissima (Mill.) Swingle and Helianthus tuberosus L. in Istria Region, Croatia. Antioxidants. 2025; 14(6):677. https://doi.org/10.3390/antiox14060677
Chicago/Turabian StyleBožac, Mirela Uzelac, Danijela Poljuha, Slavica Dudaš, Josipa Bilić, Ivana Šola, Maja Mikulič-Petkovšek, and Barbara Sladonja. 2025. "Phytochemical Profile and Antioxidant Properties of Invasive Plants Ailanthus altissima (Mill.) Swingle and Helianthus tuberosus L. in Istria Region, Croatia" Antioxidants 14, no. 6: 677. https://doi.org/10.3390/antiox14060677
APA StyleBožac, M. U., Poljuha, D., Dudaš, S., Bilić, J., Šola, I., Mikulič-Petkovšek, M., & Sladonja, B. (2025). Phytochemical Profile and Antioxidant Properties of Invasive Plants Ailanthus altissima (Mill.) Swingle and Helianthus tuberosus L. in Istria Region, Croatia. Antioxidants, 14(6), 677. https://doi.org/10.3390/antiox14060677