
Cyanidin-3-O-Glucoside Mitigates Amyloid-Beta (1–42)-Induced Apoptosis in SH-SY5Y Cells by Regulating Ca2+ Homeostasis and Inhibiting Mitochondrial Dysfunction
 ,
,
Abstract
1. Introduction
2. Materials and Methods
2.1. Chemicals and Reagents
2.2. SH-SY5Y Cell Culture and Cell Grouping
- 1.
- A. Normal control group;
- 2.
- B. Solvent control group: 0.3% Dimethylsulfoxide (DMSO) was used to dissolve Aβ1–42 and Cyanidin-3-O-glucoside;
- 3.
- C. Cell model group: cells were incubated with 1 µM Aβ1–42 for 24 h;
- 4.
- D. Low-dose drug protection group: cells were pre-treated with 20 µg/mL Cyanidin-3-O-glucoside for 24 h, followed by incubation with 1 µM Aβ1–42 for 24 h, and Cyanidin-3-O-glucoside is left during Aβ1–42 incubation;
- 5.
- E. Medium drug protection group: cells were pre-treated with 40 µg/mL Cyanidin-3-O-glucoside for 24 h, followed by incubation with 1 µM Aβ1–42 for 24 h, and Cyanidin-3-O-glucoside is left during Aβ1–42 incubation;
- 6.
- F. High-dose drug protection group: cells were pre-treated with 60 µg/mL Cyanidin-3-O-glucoside for 24 h, followed by incubation with 1 µM Aβ1–42 for 24 h, and Cyanidin-3-O-glucoside is left during Aβ1–42 incubation;
- 7.
- G. Drug treatment group: cells were incubated with 40 µg/mL Cyanidin-3-O-glucoside and 1 µM Aβ1–42 for 24 h, and Cyanidin-3-O-glucoside is left during Aβ1–42 incubation.
2.3. Cell Viability Was Detected by MTT Assay
2.4. Detection of Intracellular Reactive Oxygen Species (ROS) by Reactive Oxygen Species Detection Kit
2.5. Detection of Mitochondrial ROS by MitoSOX Red Mitochondrial Superoxide Indicator
2.6. Detection of Mitochondrial Membrane Potential Using Mitochondrial Membrane Potential Detection Kit
2.7. Detection of Cellular ATP Levels by ATP Detection Kit
2.8. Detection of Apoptosis Using Flow Cytometry
2.9. Cellular Calcium Levels
2.10. Western Blot
2.11. Total RNA Extraction
2.12. Reverse Transcription
2.13. Real-Time Fluorescence Quantitative Analysis
2.14. Statistical Analyses
3. Results
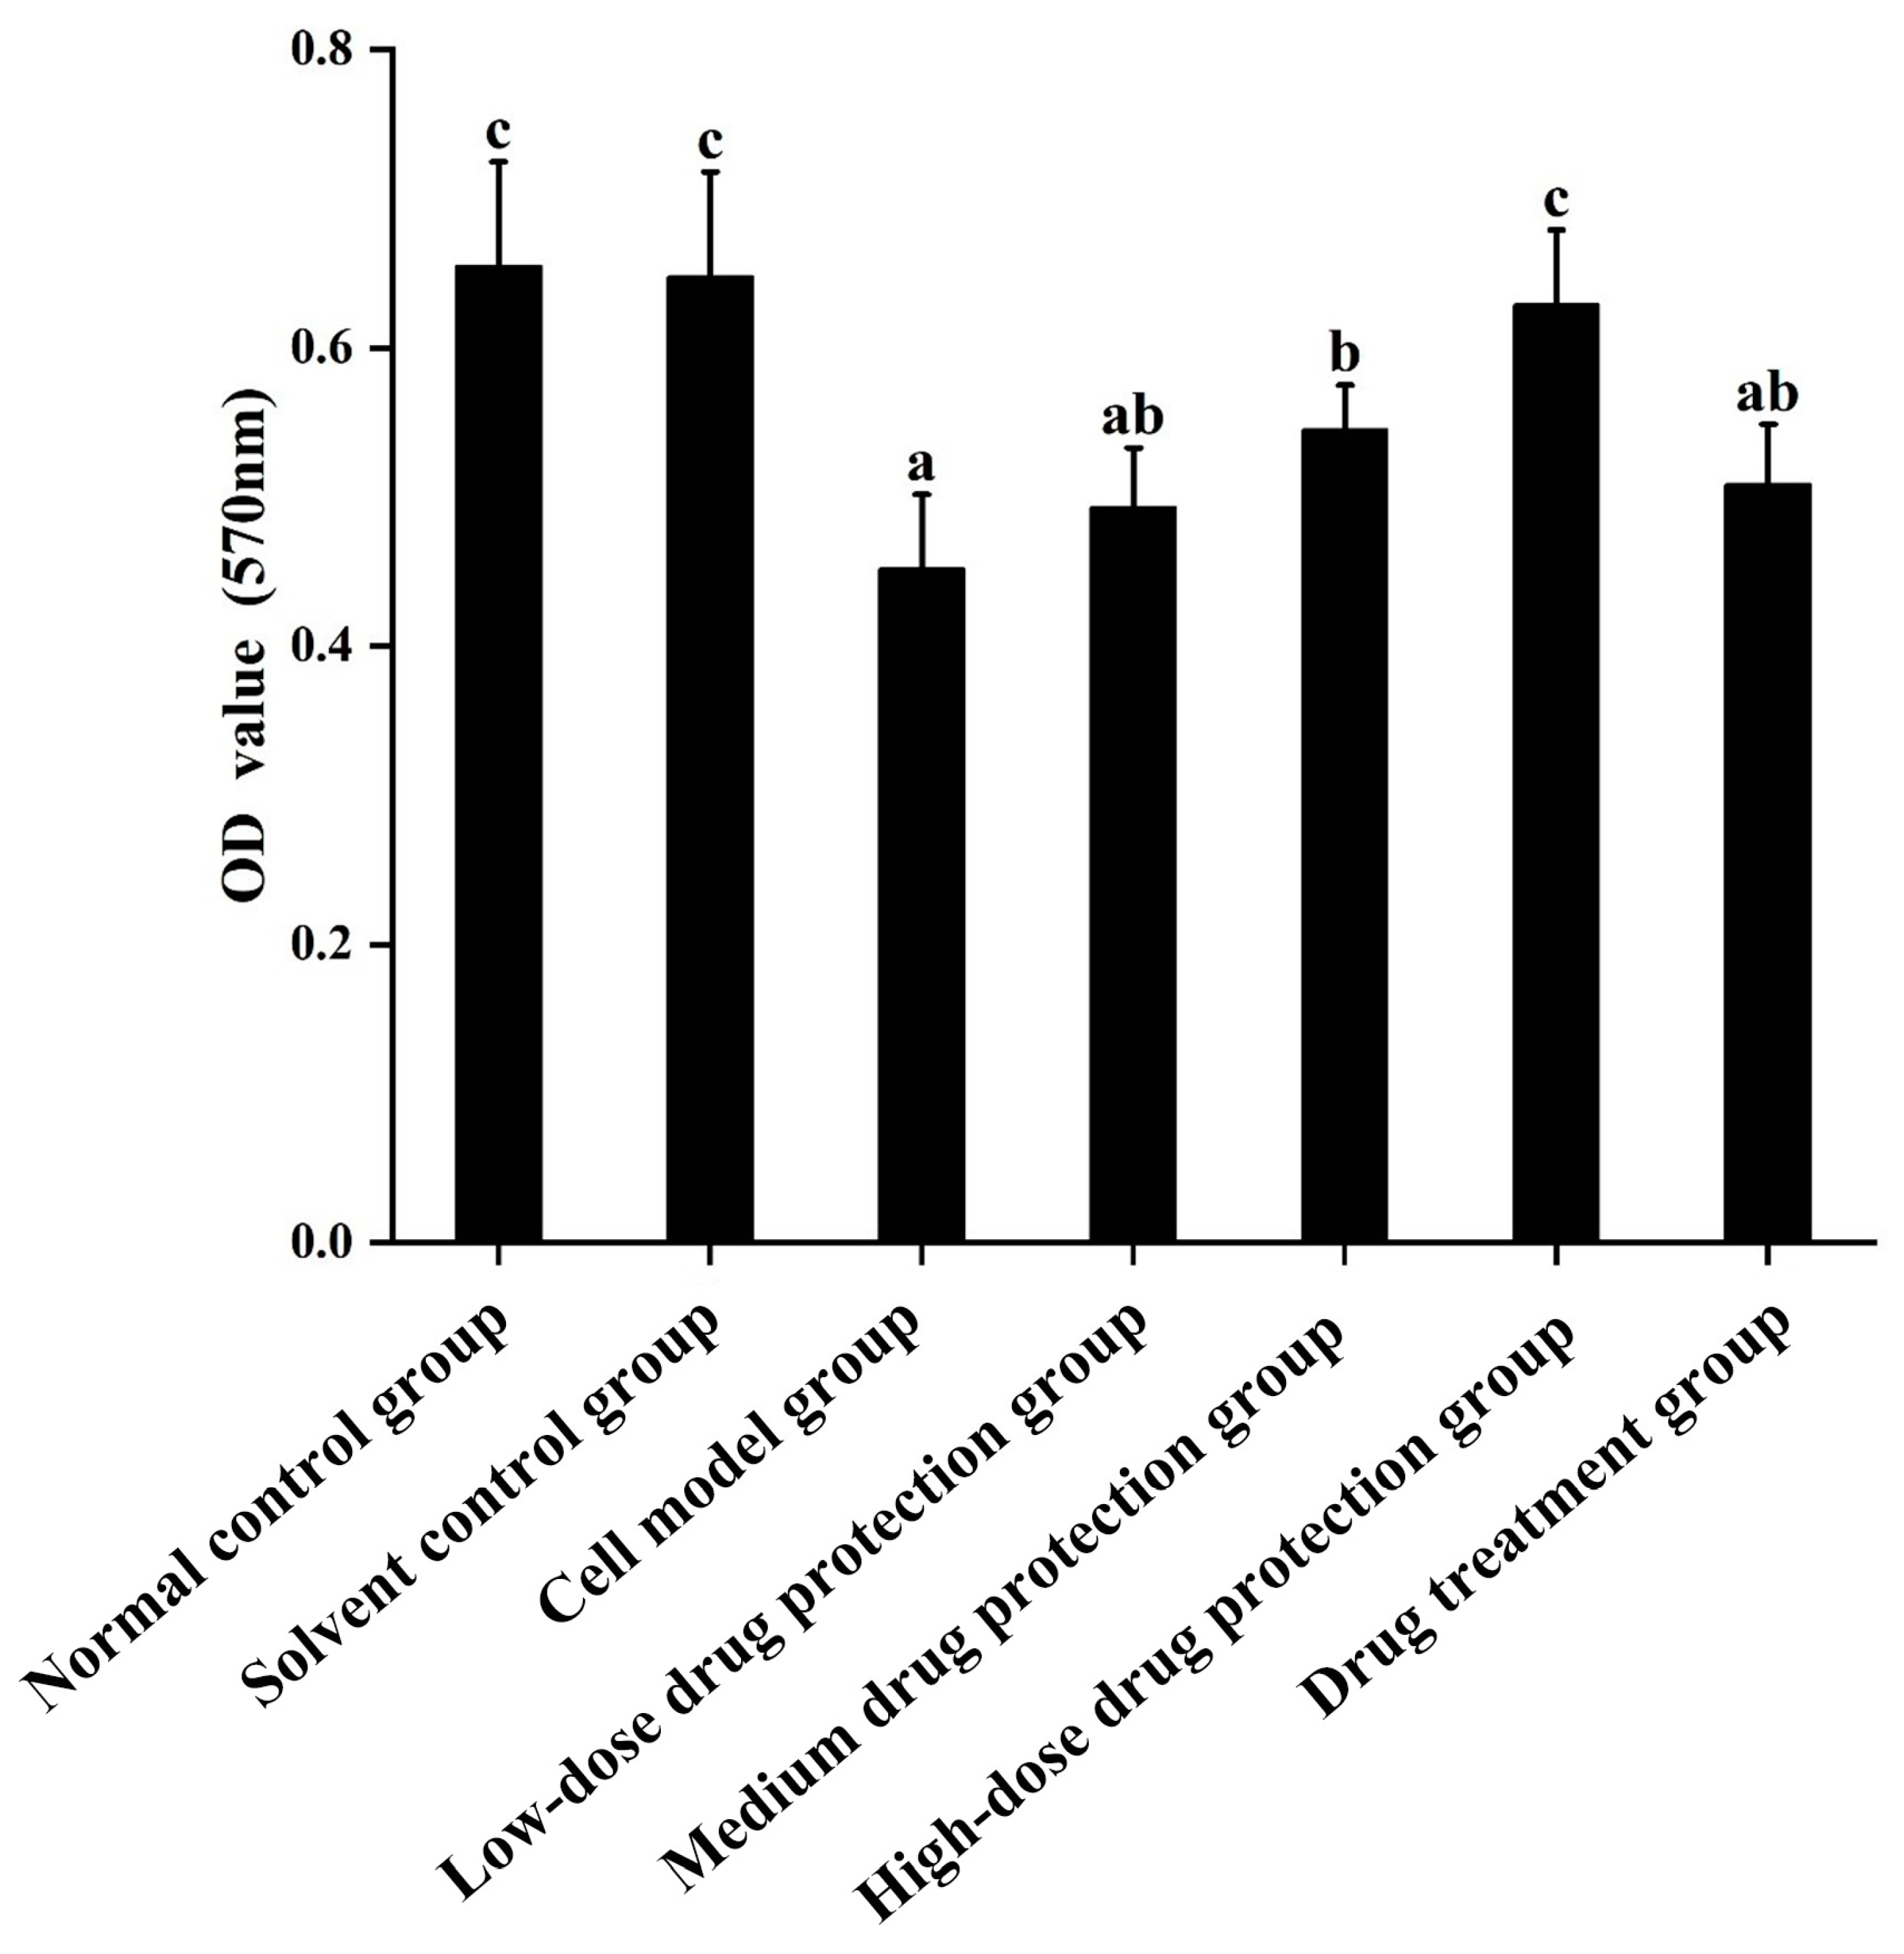
3.1. Cell Viability
3.2. Determination of ROS
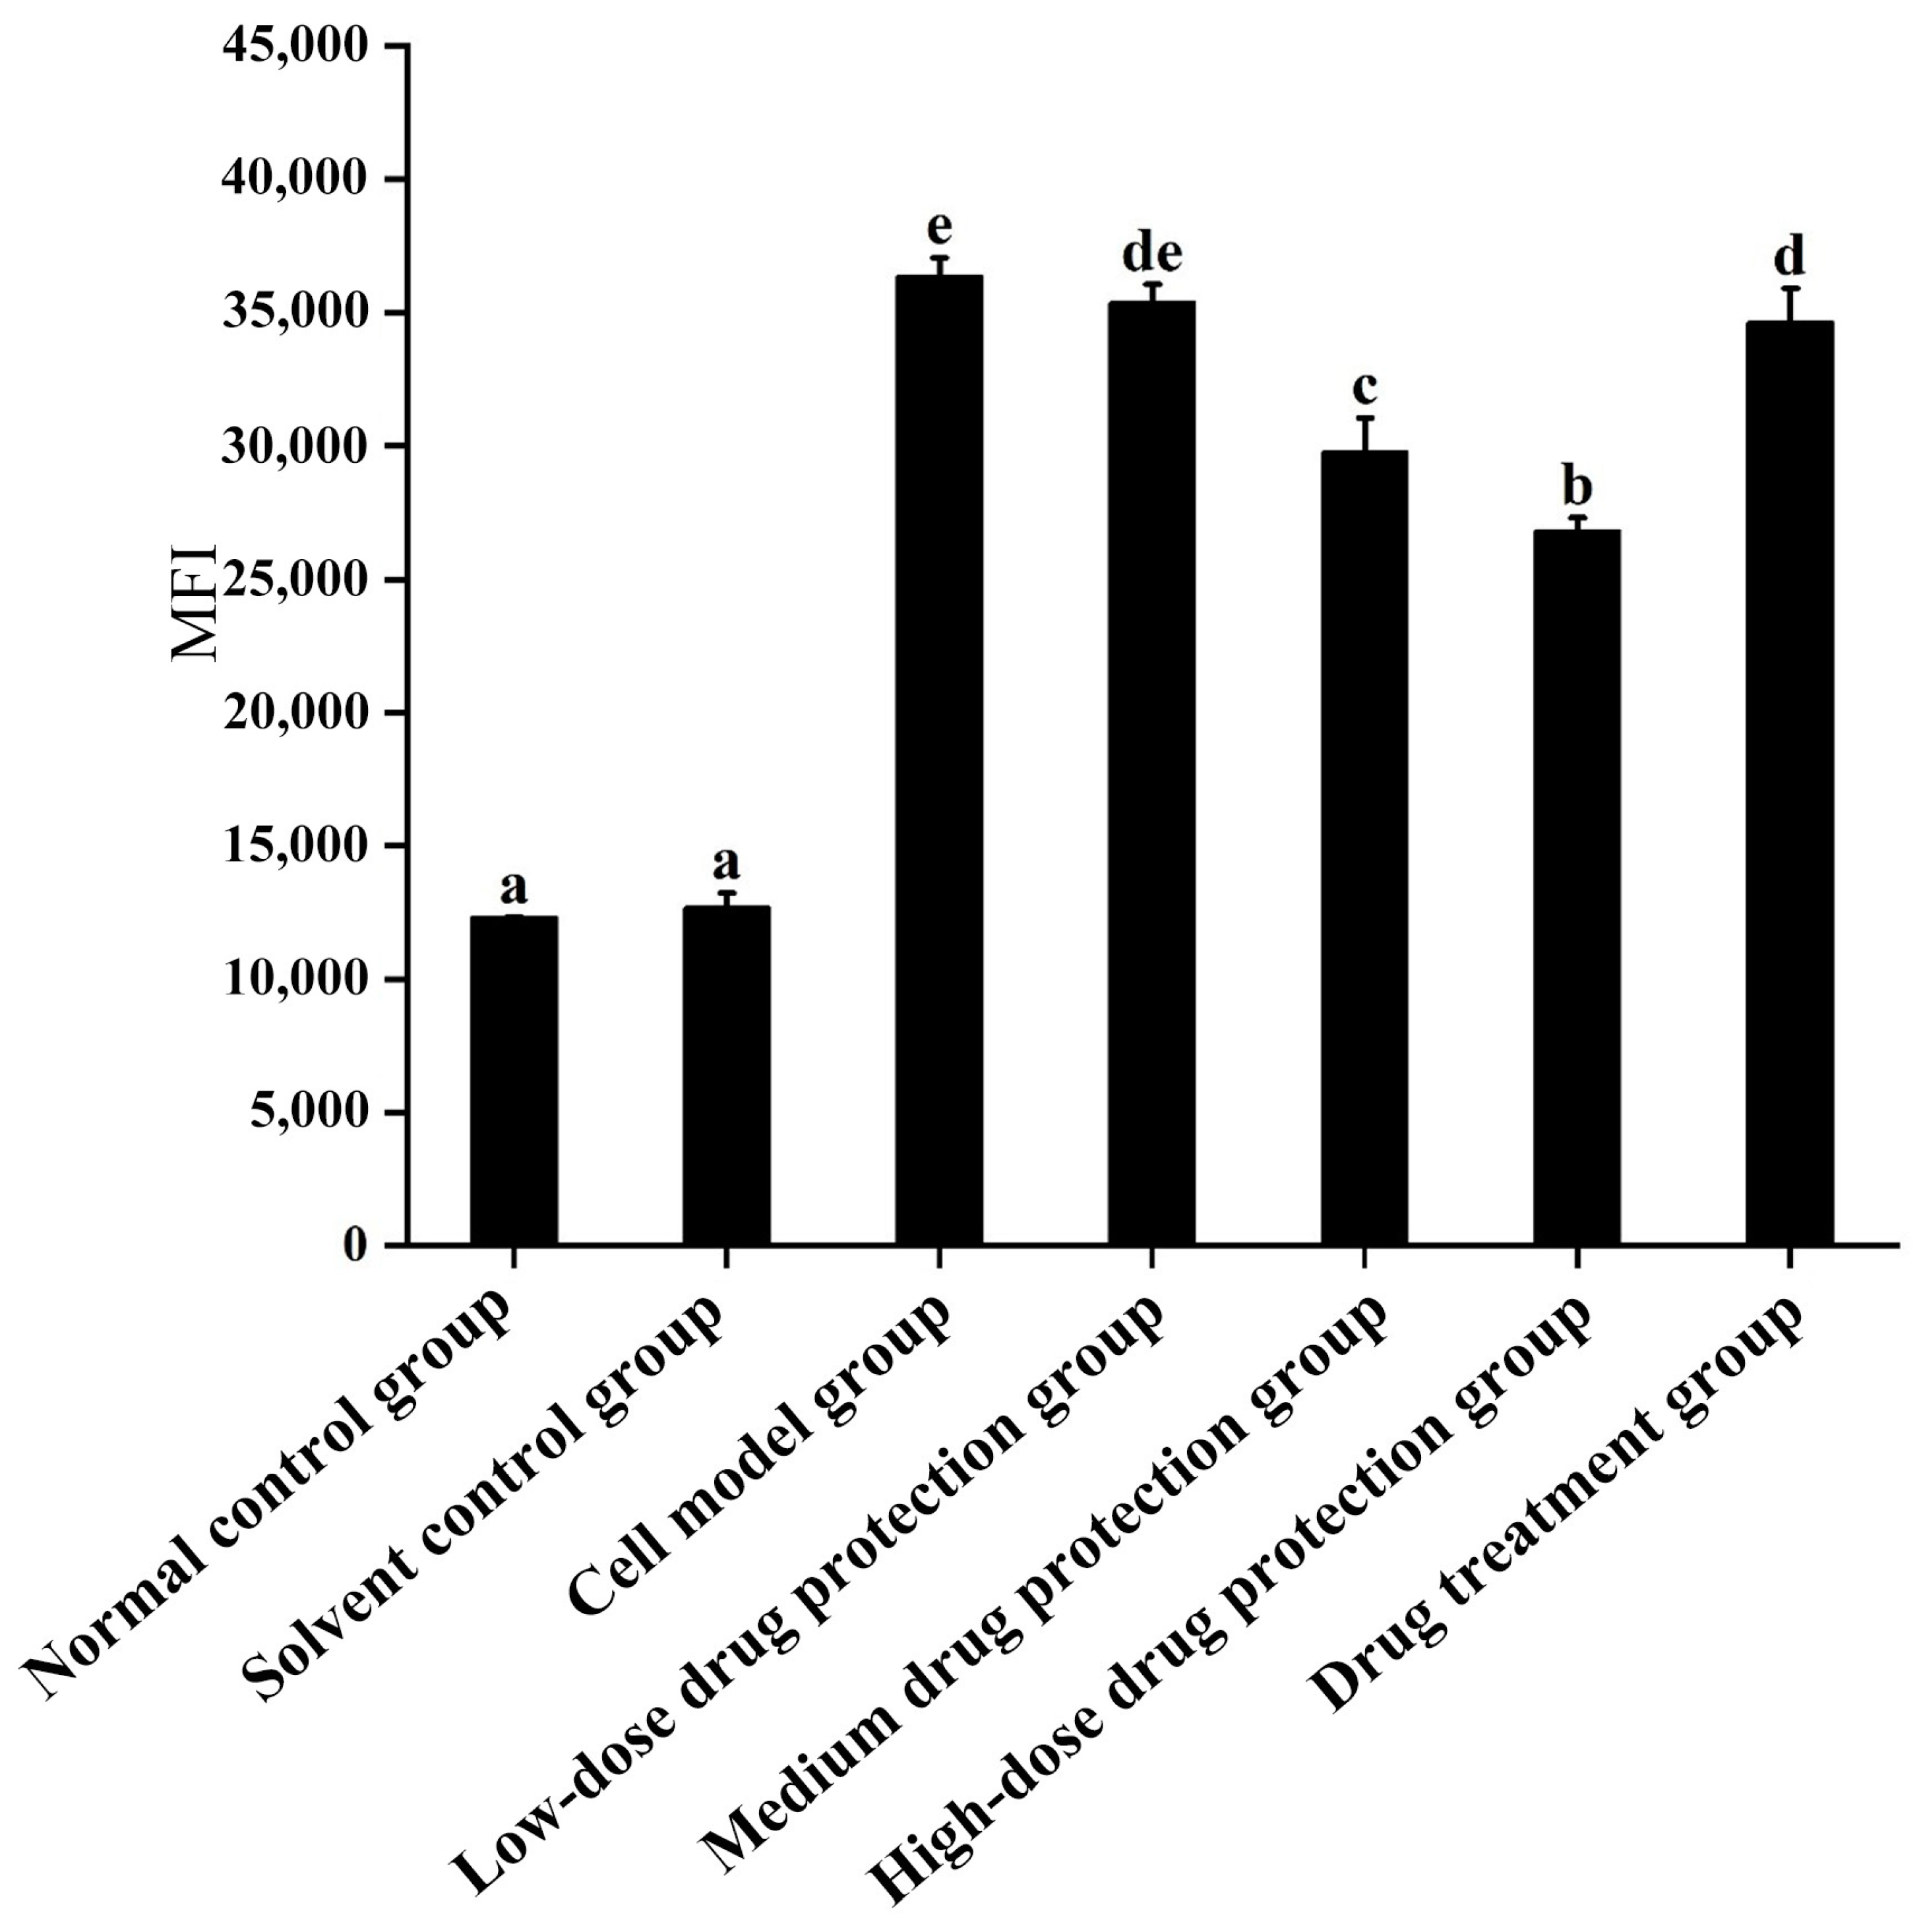
3.2.1. Intracellular ROS
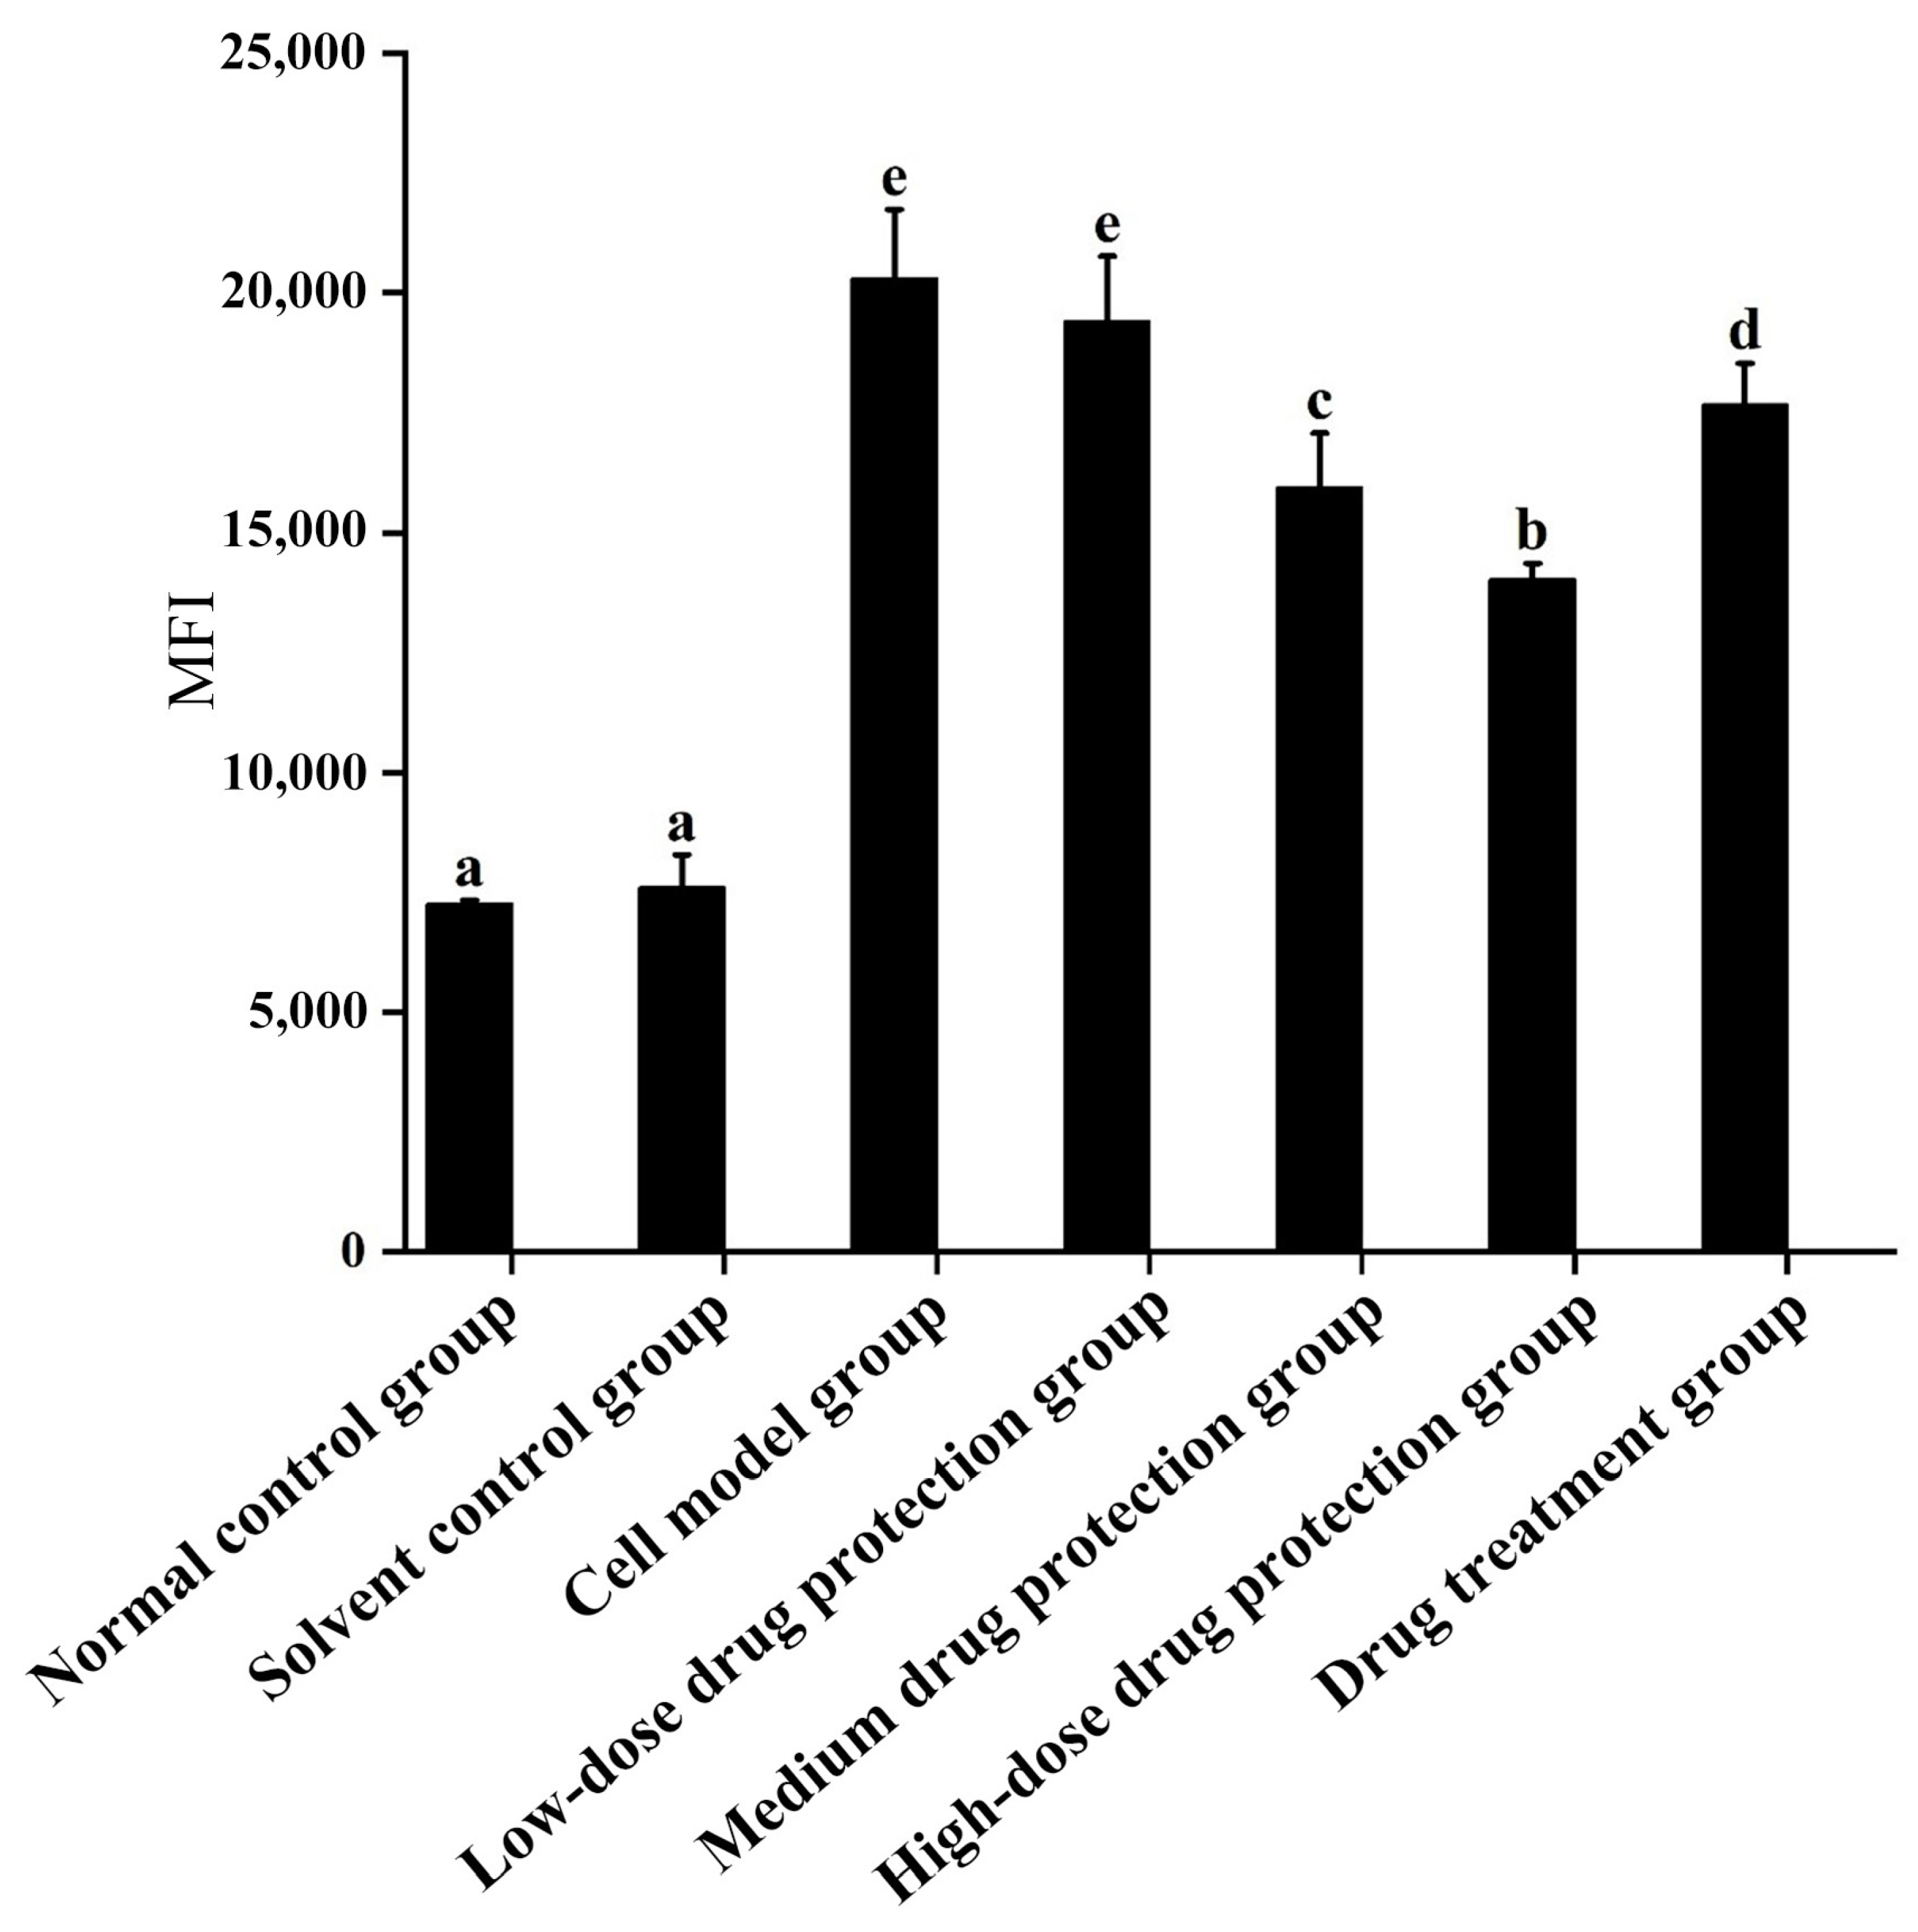
3.2.2. Mitochondrial ROS
3.3. Mitochondrial Membrane Potential
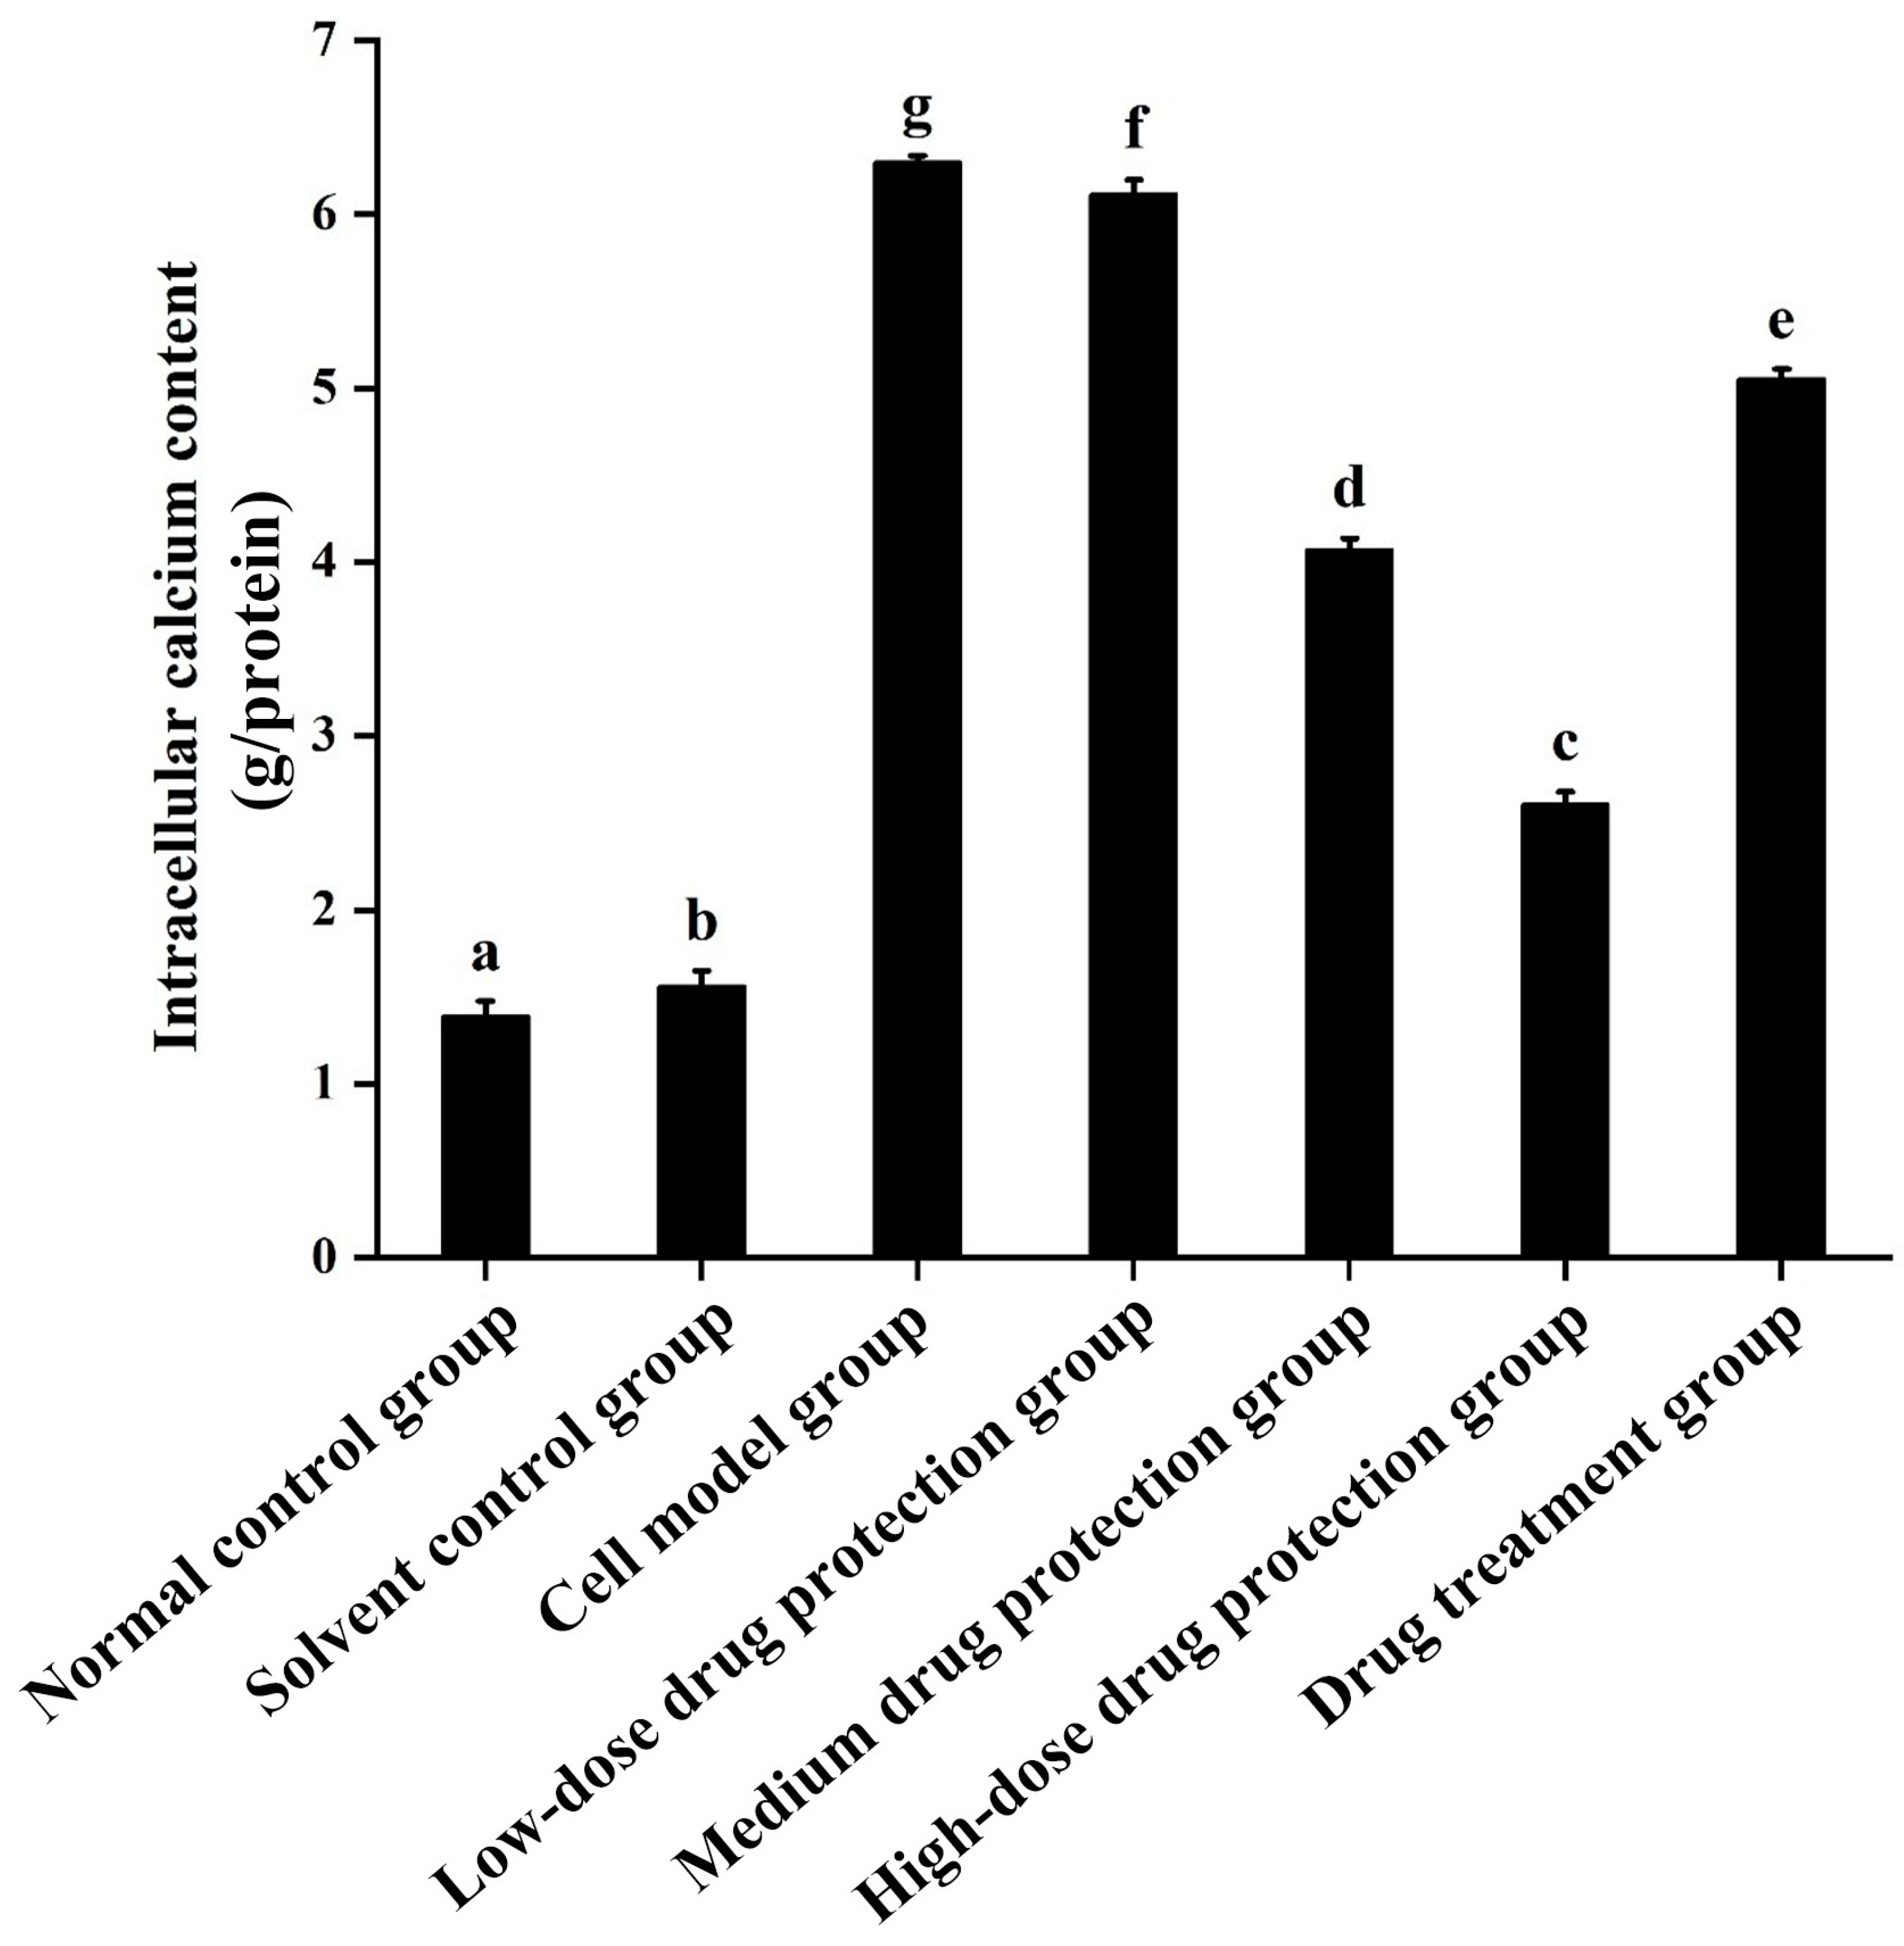
3.4. Intracellular Calcium Levels
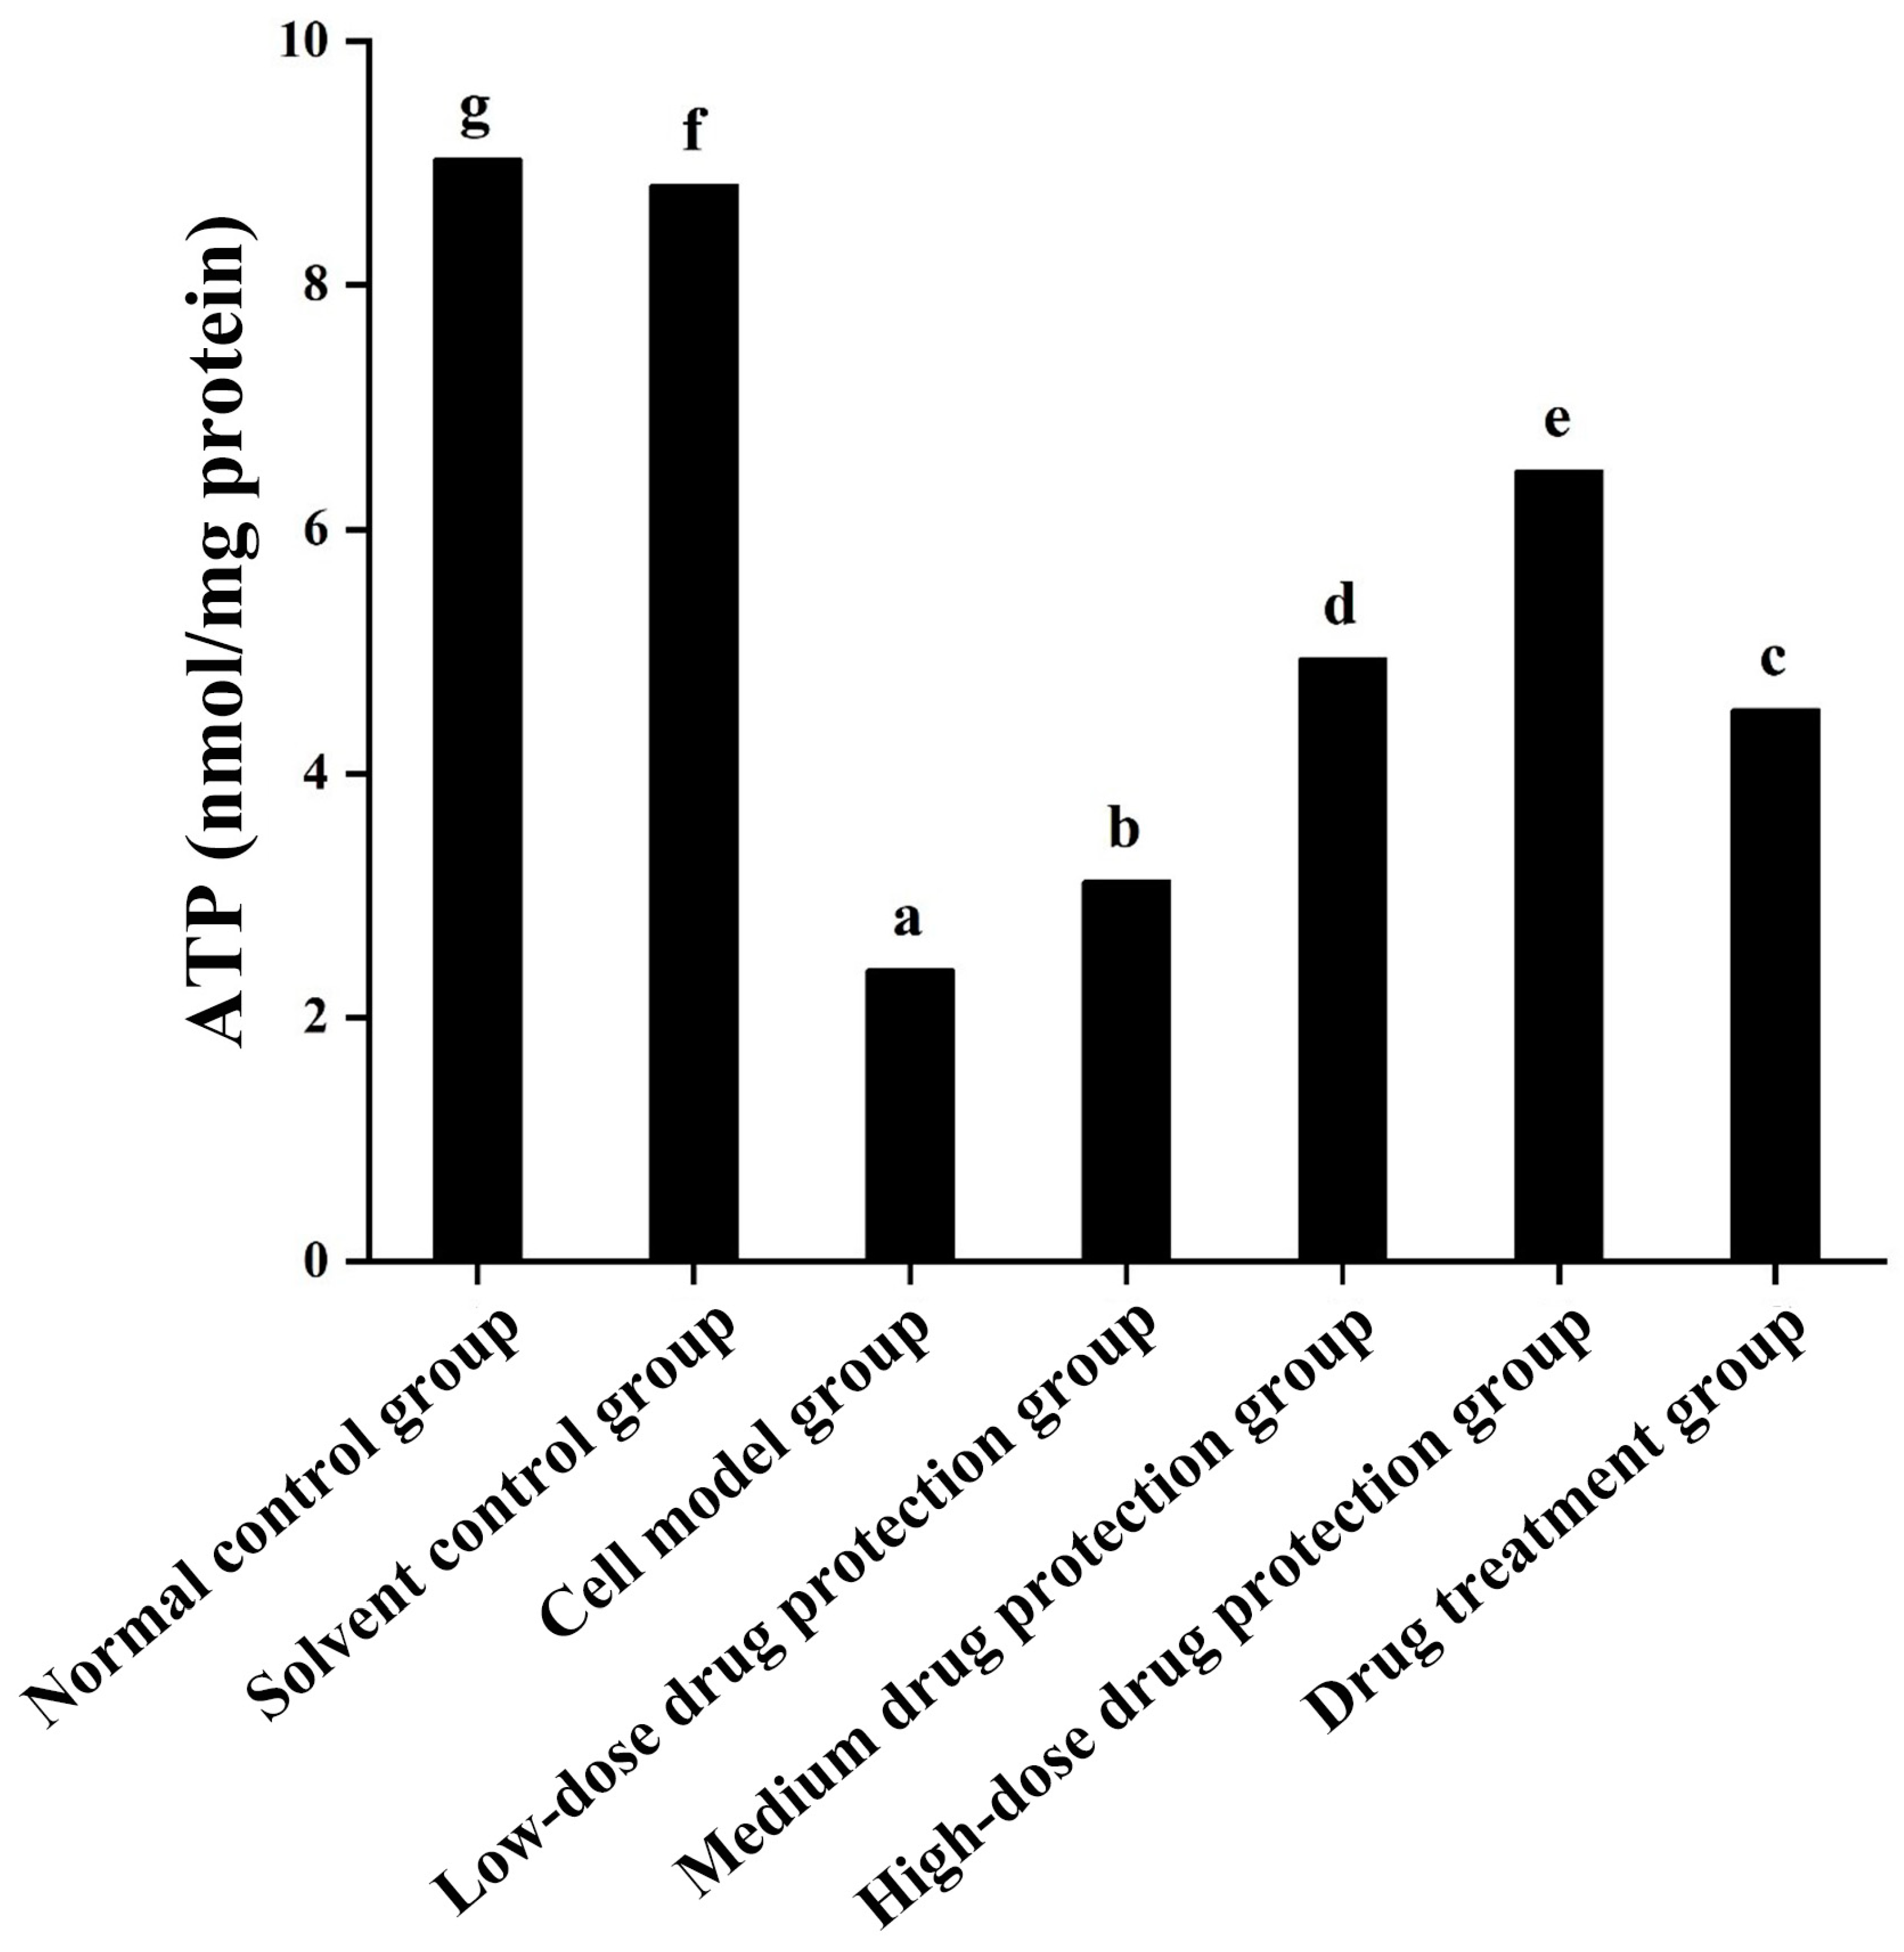
3.5. ATP
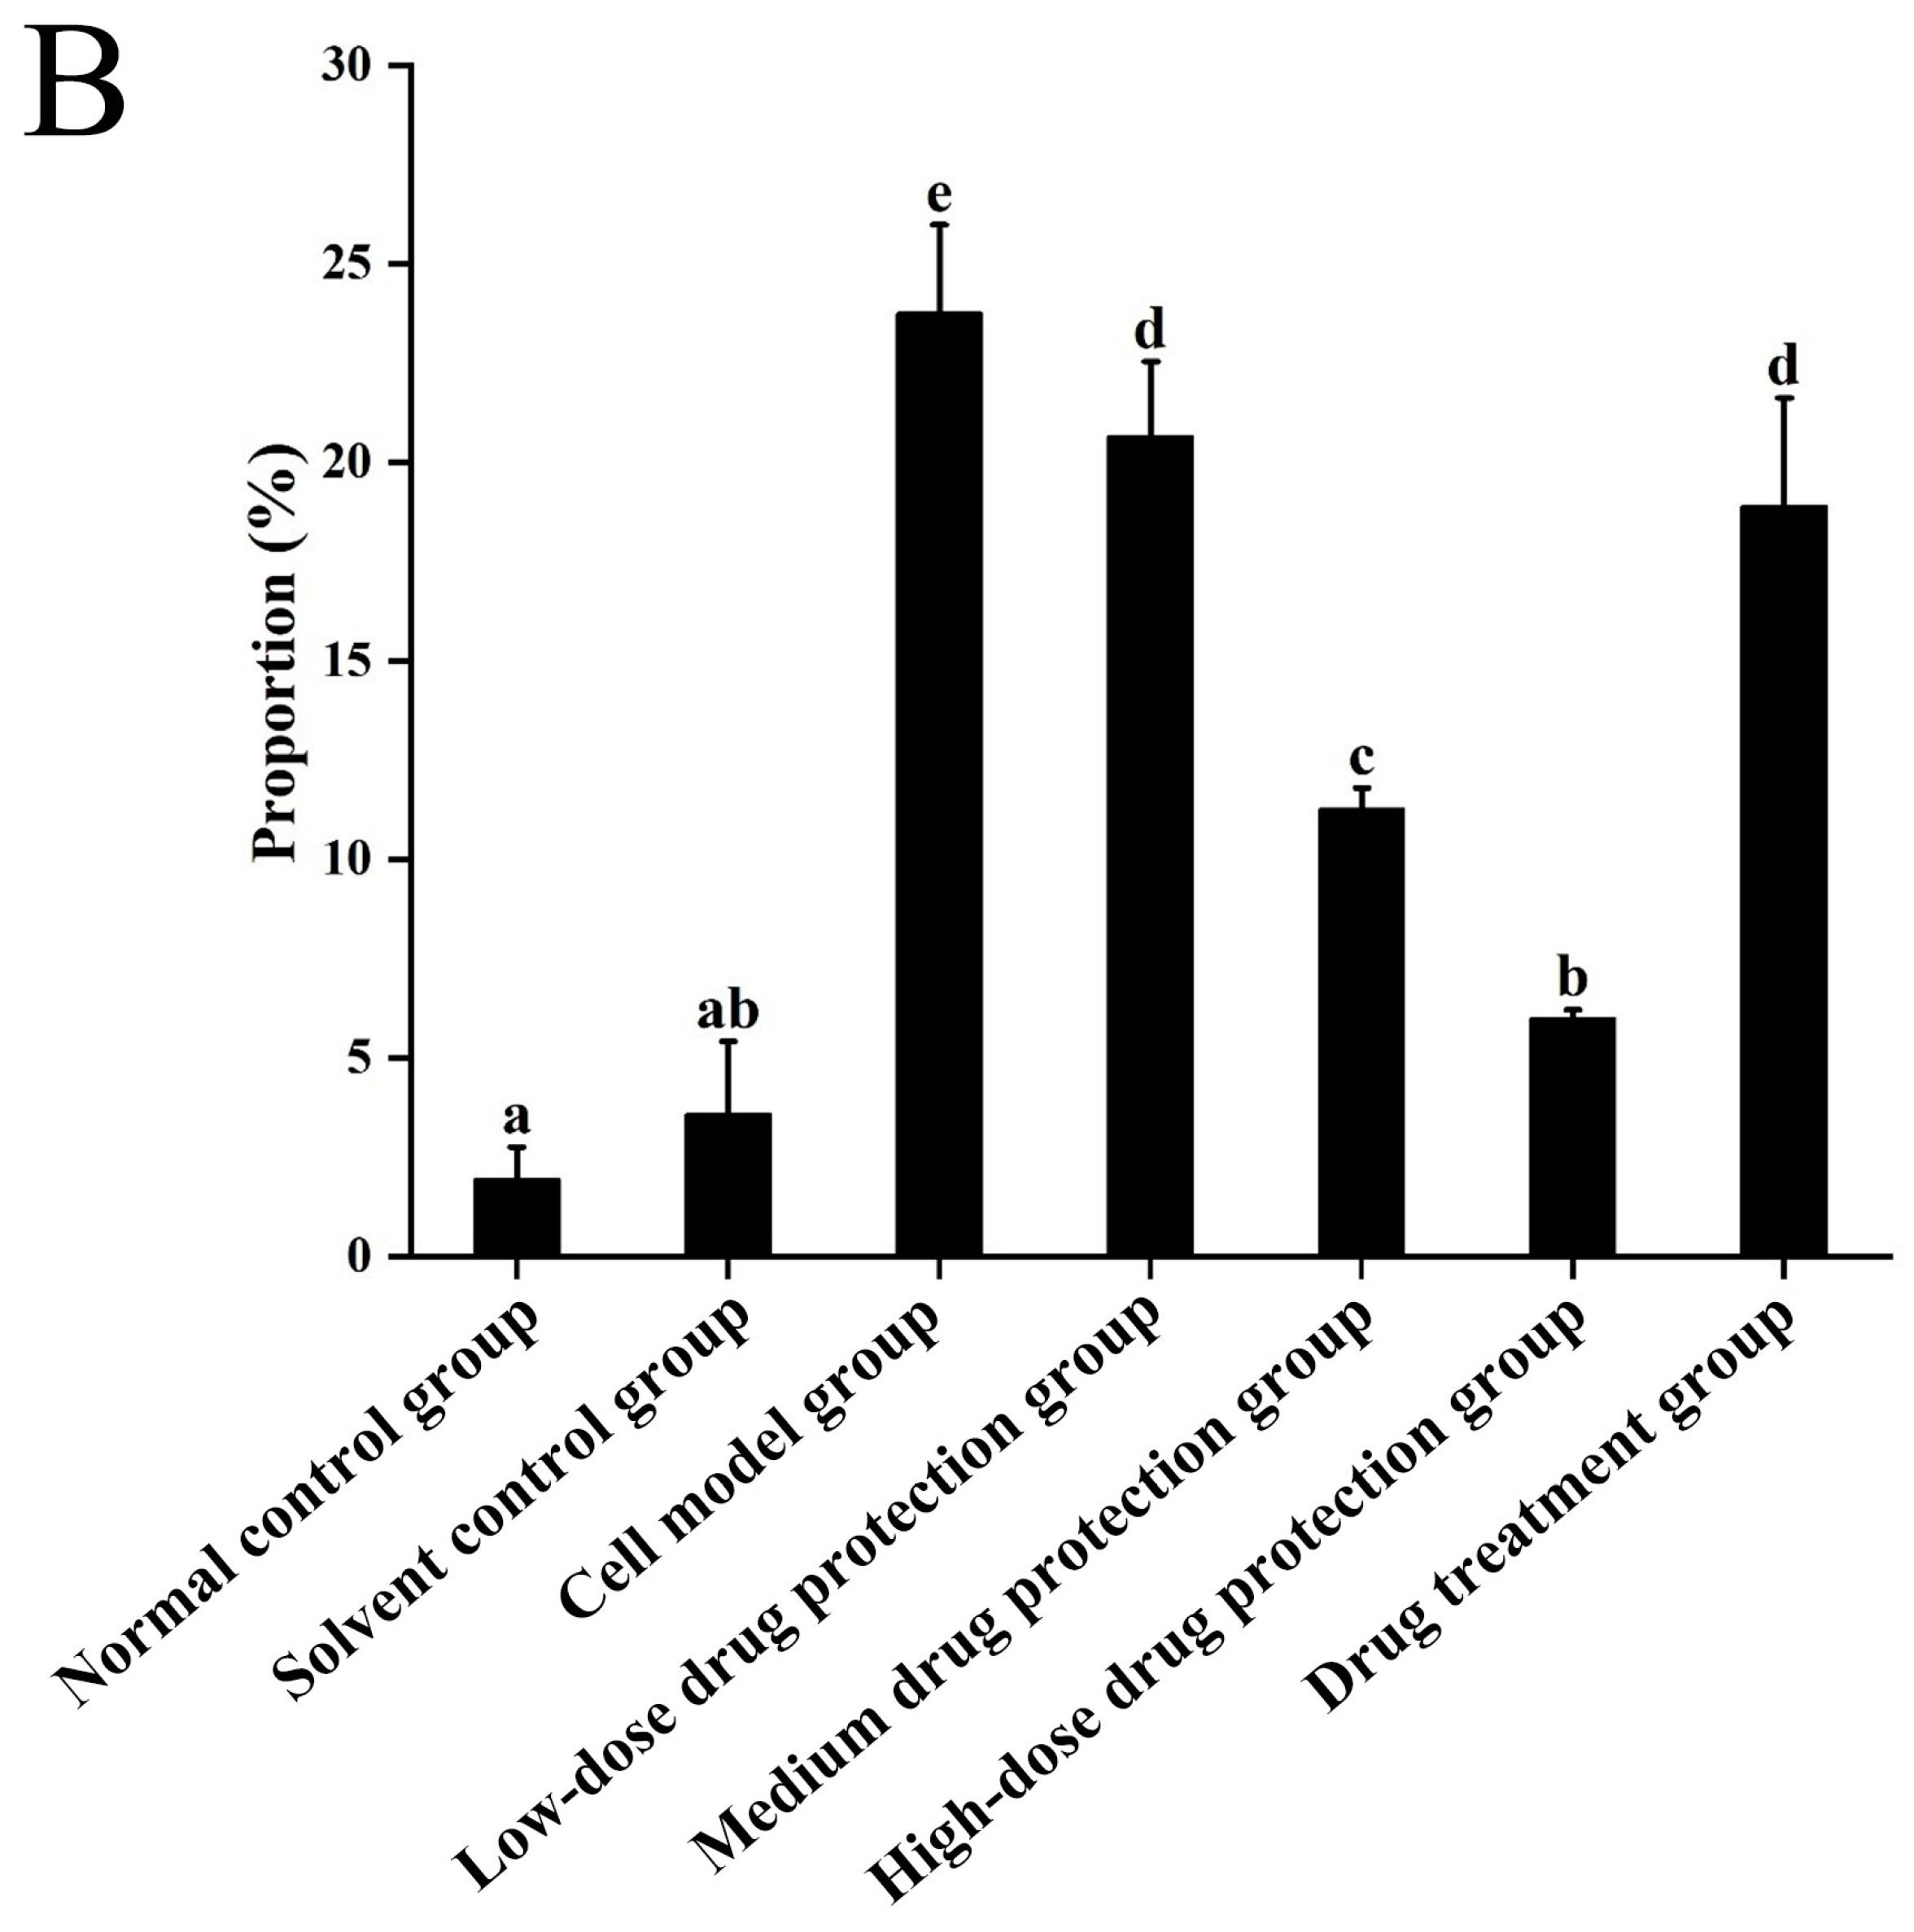
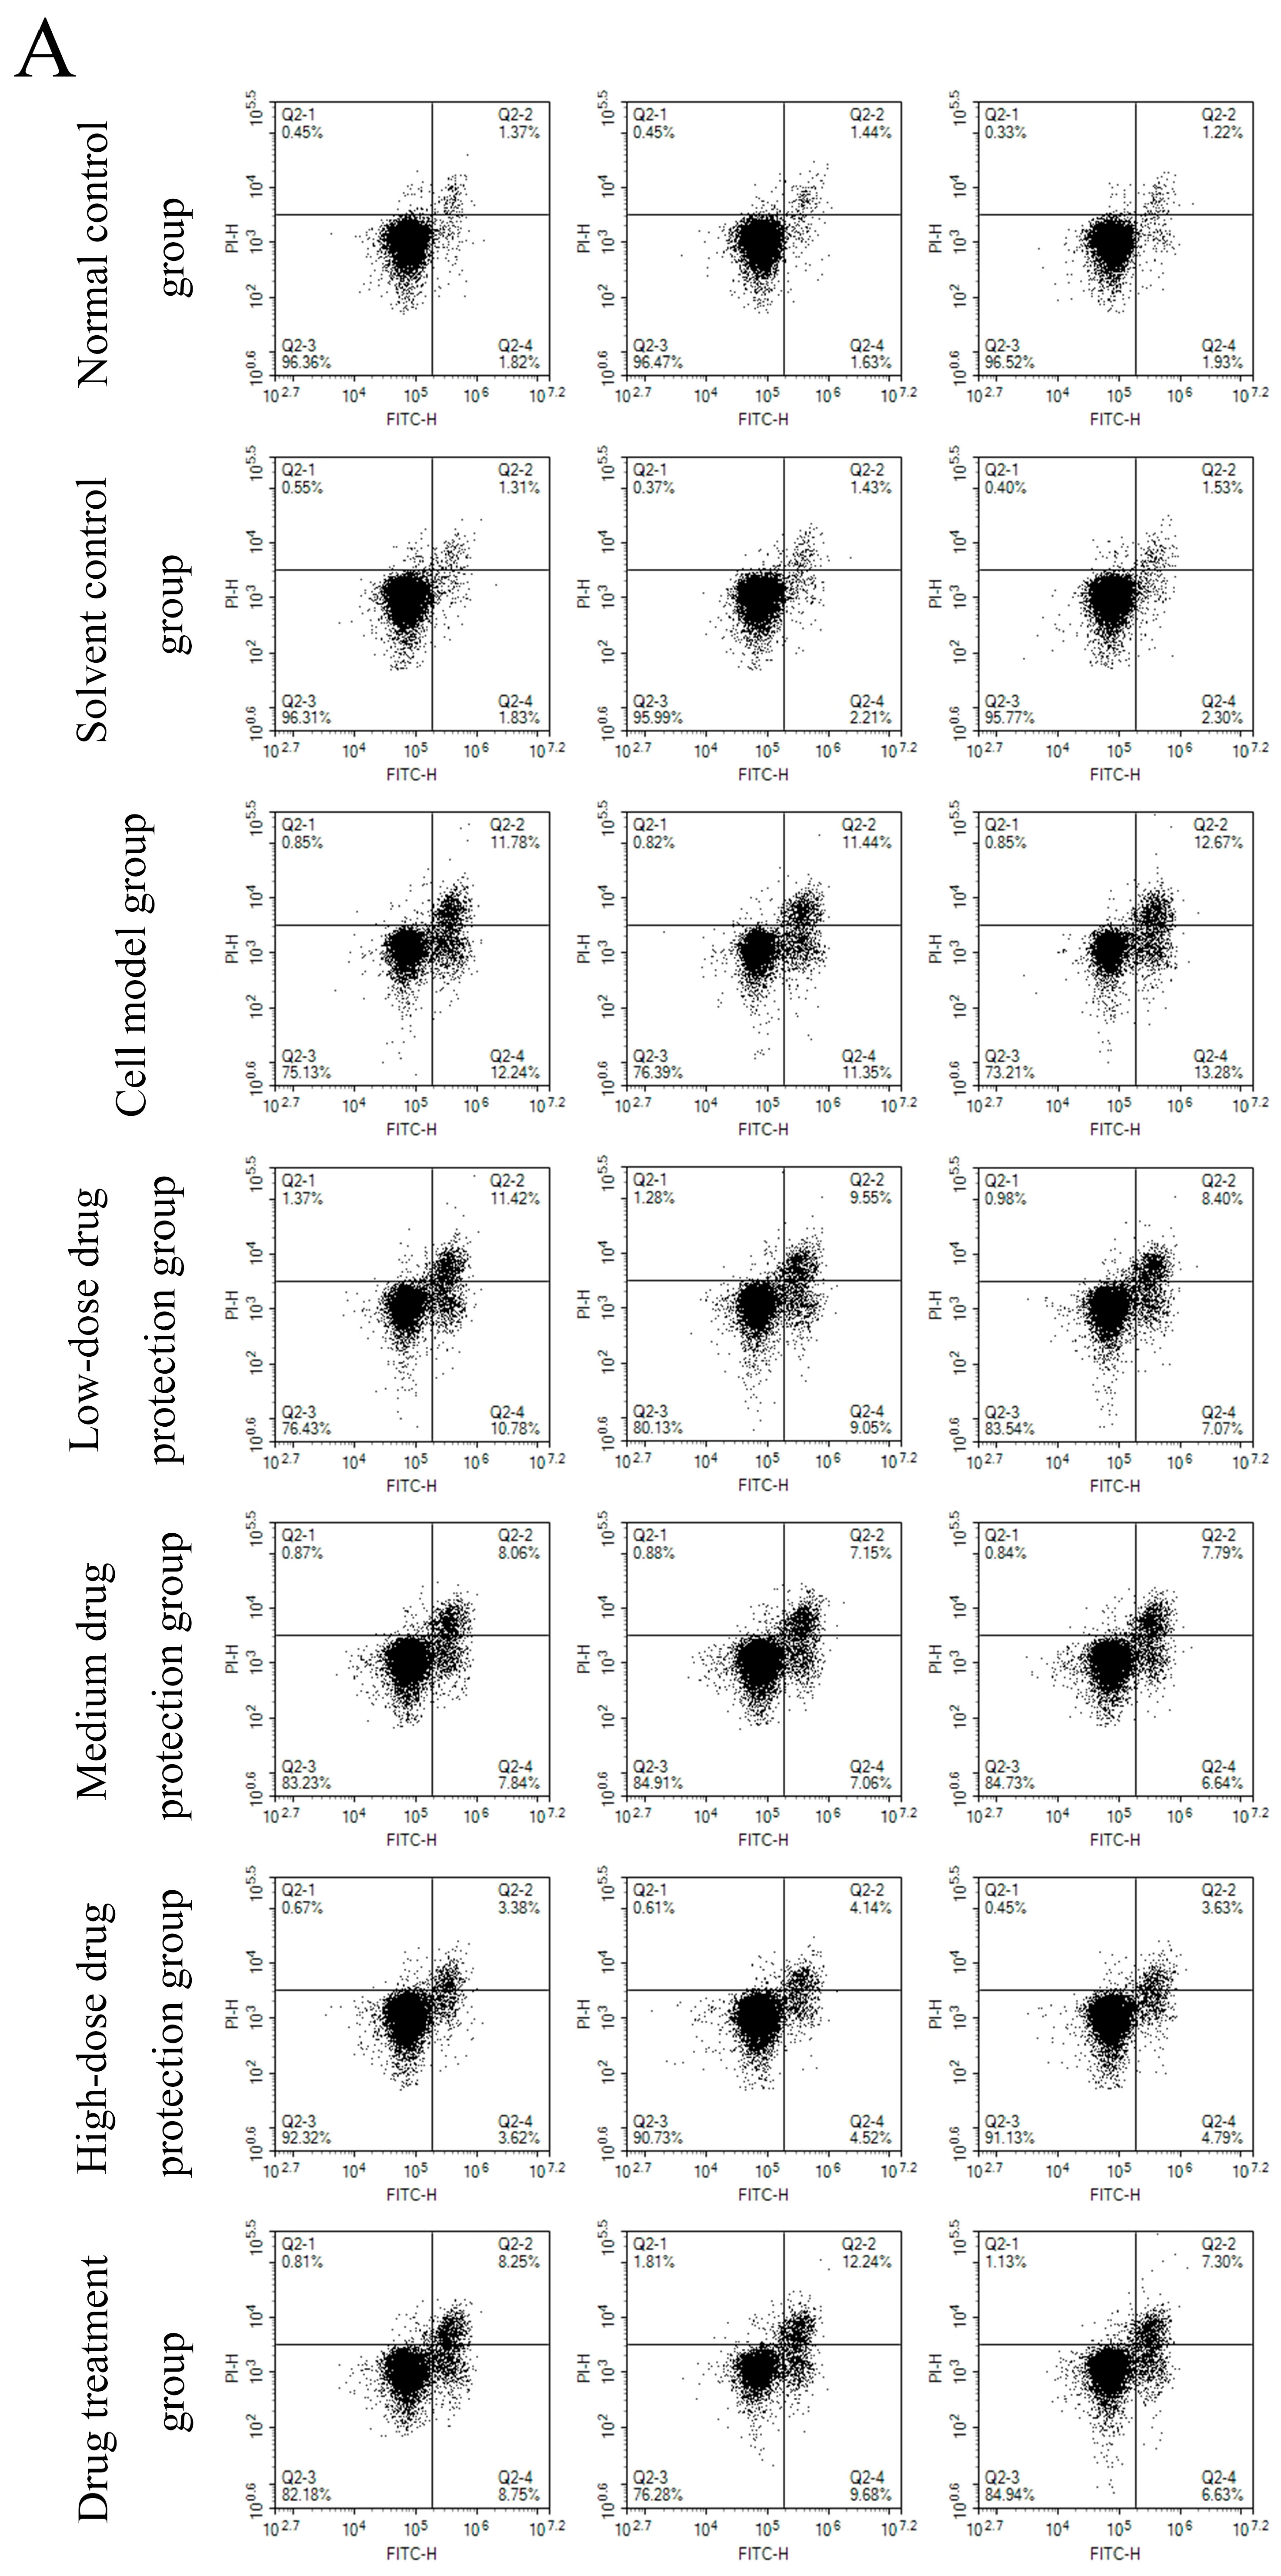
3.6. Cell Apoptosis
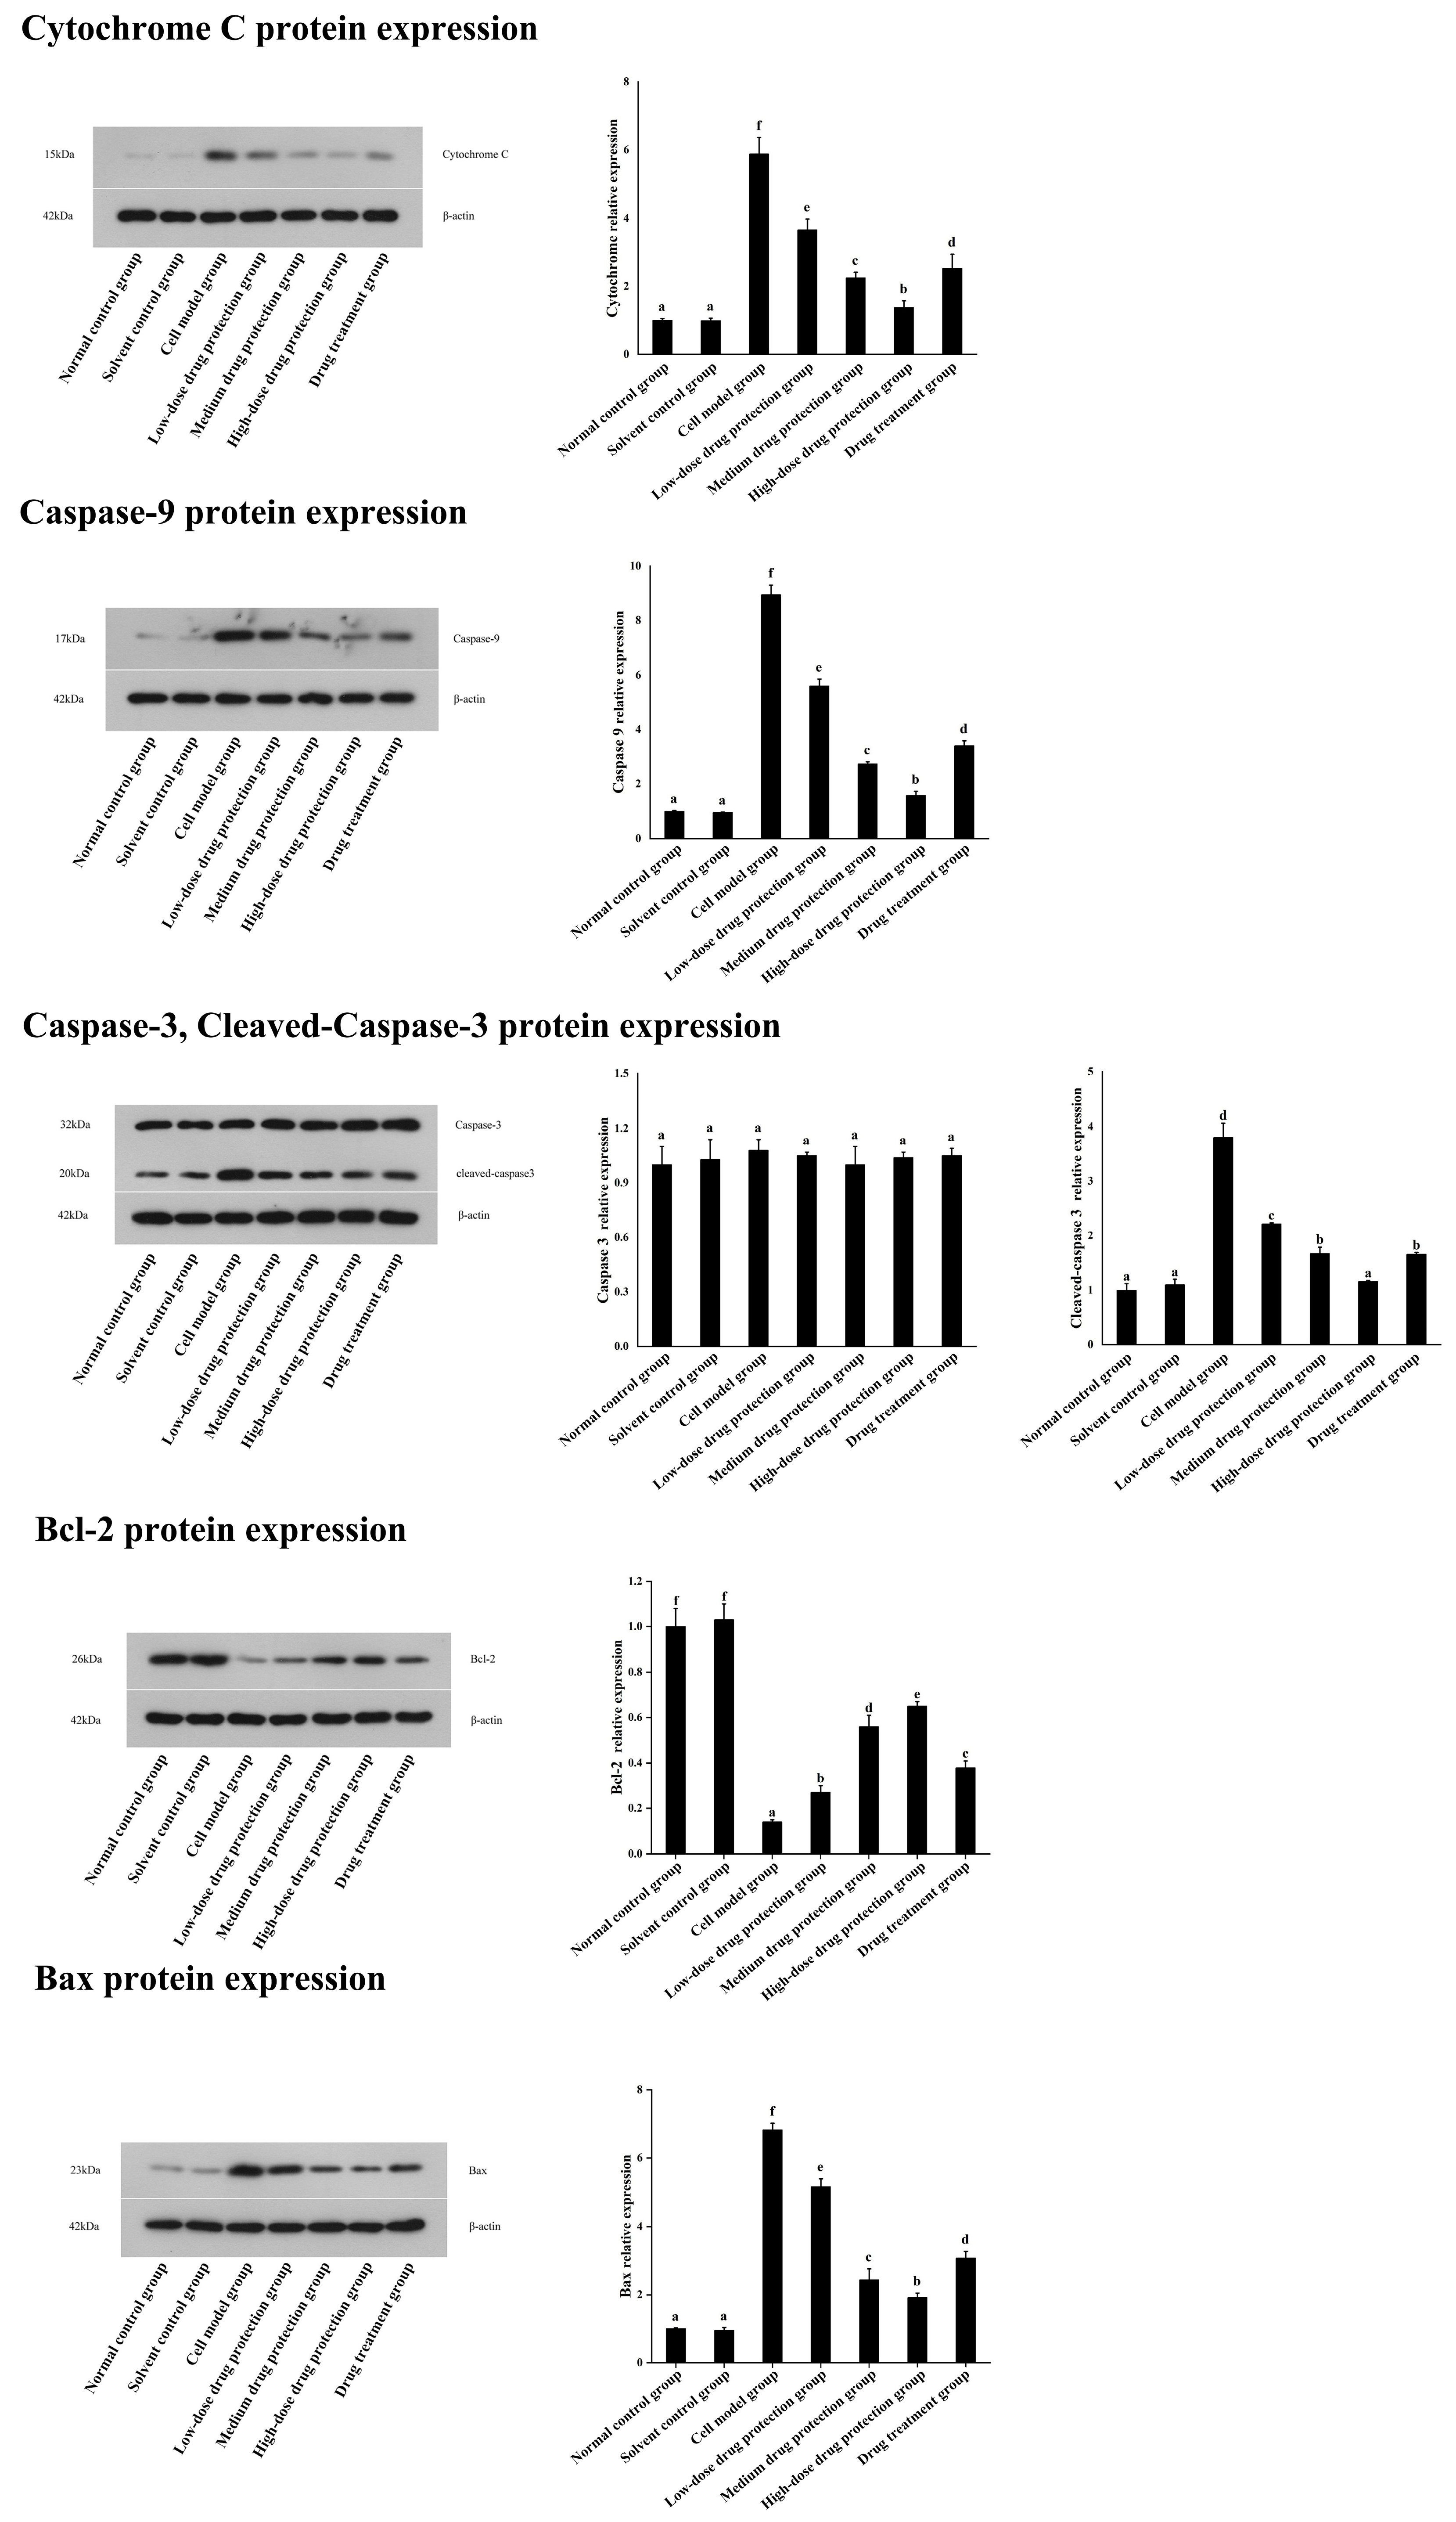
3.7. Western Blot
3.8. RT-PCR
4. Discussion
5. Conclusions
Author Contributions
Funding
Institutional Review Board Statement
Informed Consent Statement
Data Availability Statement
Conflicts of Interest
References
- Prince, M.; Bryce, R.; Albanese, E.; Wimo, A.; Ribeiro, W.; Ferri, C.P. The global prevalence of dementia: A systematic review and metaanalysis. Alzheimer’s Dement. 2013, 9, 63. [Google Scholar] [CrossRef] [PubMed]
- Alzheimer’s Association. 2014 Alzheimer’s disease facts and figures. Alzheimer’s Dement. 2014, 10, e47–e92. [Google Scholar]
- Alzheimer’s Association. 2018 Alzheimer’s disease facts and figures. Alzheimer’s Dement. 2018, 14, 367–429. [Google Scholar] [CrossRef]
- Angekumbura, C.D.; Dilshani, T.H.T.; Perera, K.T.D.; Jayarathna, S.N.; Kahandawarachchi, K.A.D.C.; Udara, S.W.I. A review of methods to detect divided attention impairments in Alzheimer’s disease. Procedia Comput. Sci. 2022, 198, 193–202. [Google Scholar] [CrossRef]
- Jan, A.; Shah, M.; Shah, S.A.; Habib, S.H.; Ehtesham, E.; Ahmed, N. Melatonin rescues pregnant female mice and their juvenile offspring from high fat diet-induced alzheimer disease neuropathy. Heliyon 2024, 10, e36921. [Google Scholar] [CrossRef]
- Bôto, J.M.; Rocha, A.; Miguéis, V.; Meireles, M.; Neto, B. Sustainability Dimensions of the Mediterranean Diet: A Systematic Review of the Indicators Used and Its Results. Adv. Nutr. 2022, 13, 2015–2038. [Google Scholar] [CrossRef]
- Zhang, Y.; Zhang, Z.; Guo, S.; Qu, P.; Liu, J.; Cheng, C. Characterization of blueberry glutathione S-transferase (GST) genes and functional analysis of VcGSTF8 reveal the role of ‘MYB/bHLH-GSTF’ module in anthocyanin accumulation. Ind. Crop. Prod. 2024, 218, 119006. [Google Scholar] [CrossRef]
- Mi, W.; Hu, Z.; Zhao, S.; Wang, W.; Lian, W.; Lu, P.; Shi, T. Purple sweet potato anthocyanins normalize the blood glucose concentration and restore the gut microbiota in mice with type 2 diabetes mellitus. Heliyon 2024, 10, e31784. [Google Scholar] [CrossRef]
- Li, W.; Peng, C.; Zhaojie, L.; Wei, W. Chemopreventive and therapeutic properties of anthocyanins in breast cancer: A comprehensive review. Nutr. Res. 2022, 107, 48–64. [Google Scholar] [CrossRef]
- Nakamura, S.; Tanaka, J.; Imada, T.; Shimoda, H.; Tsubota, K. Delphinidin 3,5-O-diglucoside, a constituent of the maqui berry (Aristotelia chilensis) anthocyanin, restores tear secretion in a rat dry eye model. J. Funct. Foods 2014, 10, 346–354. [Google Scholar] [CrossRef]
- Wu, Y.; Han, T.; Yang, H.; Lyu, L.; Li, W.; Wu, W. Known and potential health benefits and mechanisms of blueberry anthocyanins: A review. Food Biosci. 2023, 55, 103050. [Google Scholar] [CrossRef]
- Simeone, A.; Nota, P.; Ceccarelli, D.; Del Toro, A.; Piazza, G.; De Salvador, F.; Caboni, E.; Krupa, T. Anthocyanins in Blueberry Cultivars: Effect of the Growing Area. Int. Symp. 2010, 926, 713–716. [Google Scholar] [CrossRef]
- Guo, X.; Yuan, L.; Shakeel, M.; Wan, Y.; Song, Z.; Wang, D. Screening of the plant growth-promoting mycorrhizal fungi in Guizhou blueberry. Rhizosphere 2021, 19, 100389. [Google Scholar] [CrossRef]
- Steyn, J.; Lötze, E.; Hoffman, E.W. The seasonal progression of the reproductive phenology of two southern highbush blueberry (V. corymbosum L. interspecific hybrids) cultivars in the Western Cape, South Africa. Sci. Hortic. 2023, 307, 111493. [Google Scholar] [CrossRef]
- Ma, C.; Meng, L.; Wang, F. Dynamics of anthocyanin profiles of the fruits of four blueberry (Vacciniumsp.) cultivars during different growth stages. Int. J. Food Prop. 2022, 25, 1302–1316. [Google Scholar] [CrossRef]
- Li, H.; Zheng, T.; Lian, F.; Xu, T.; Yin, W.; Jiang, Y. Anthocyanin-rich blueberry extracts and anthocyanin metabolite protocatechuic acid promote autophagy-lysosomal pathway and alleviate neurons damage in vivo and in vitro models of Alzheimer’s disease. Nutrition 2022, 93, 111473. [Google Scholar] [CrossRef]
- Meng, L.; Li, B.; Li, D.; Wang, Y.; Lin, Y.; Meng, X.; Sun, X.; Liu, N. Cyanidin-3-O-glucoside attenuates amyloid-beta (1–40)-induced oxidative stress and apoptosis in SH-SY5Y cells through a Nrf2 mechanism. J. Funct. Foods 2017, 38, 474–485. [Google Scholar] [CrossRef]
- Ma, C. The Dynamic of Anthocyanin Profile of Blueberry During Development and the Protective Mechanism on AD Cell Apoptosis by Cyanidin-3-O-Glucoside. Ph.D. Thesis, Shanxi Agricultural University, Jinzhong, China, 2022; pp. 45–51. [Google Scholar]
- Meng, L.; Xin, G.; Li, B.; Li, D.; Sun, X.; Yan, T.; Li, L.; Shi, L.; Cao, S.; Meng, X. Anthocyanins Extracted from Aronia melanocarpa Protect SH-SY5Y Cells against Amyloid-beta (1–42)-Induced Apoptosis by Regulating Ca(2+) Homeostasis and Inhibiting Mitochondrial Dysfunction. J. Agric. Food. Chem. 2018, 66, 12967–12977. [Google Scholar] [CrossRef]
- Casado, Á.; Encarnación López-Fernández, M.; Concepción Casado, M.; de La Torre, R. Lipid Peroxidation and Antioxidant Enzyme Activities in Vascular and Alzheimer Dementias. Neurochem. Res. 2008, 33, 450–458. [Google Scholar] [CrossRef]
- Liang, L.; Luo, M.; Fu, Y.; Zu, Y.; Wang, W.; Gu, C.; Zhao, C.; Li, C.; Efferth, T. Cajaninstilbene acid (CSA) exerts cytoprotective effects against oxidative stress through the Nrf2-dependent antioxidant pathway. Toxicol. Lett. 2013, 219, 254–261. [Google Scholar] [CrossRef]
- Raghav, D.; Shukla, S.; Jadiya, P. Mitochondrial calcium signaling in non-neuronal cells: Implications for Alzheimer’s disease pathogenesis. Biochim. Biophys. Acta-Mol. Basis Dis. 2024, 1870, 167169. [Google Scholar] [CrossRef] [PubMed]
- Althobaiti, N.A.; Al-Abbas, N.S.; Alsharif, I.; Albalawi, A.E.; Almars, A.I.; Basabrain, A.A.; Jafer, A.; Ellatif, S.A.; Bauthman, N.M.; Almohaimeed, H.M.; et al. Gadd45A-mediated autophagy regulation and its impact on Alzheimer’s disease pathogenesis: Deciphering the molecular Nexus. Biochim. Et Biophys. Acta (BBA)-Mol. Basis Dis. 2024, 1870, 167353. [Google Scholar] [CrossRef] [PubMed]
- An, S.; Gao, Y.; Huang, Y.; Jiang, X.; Ma, K.; Ling, J. Short-term effects of calcium ions on the apoptosis and onset of mineralization of human dental pulp cells in vitro and in vivo. Int. J. Mol. Med. 2015, 36, 215–221. [Google Scholar] [CrossRef]
- Milenkovic, D.; Krga, I.; Dinel, A.; Morand, C.; Laye, S.; Castanon, N. Nutrigenomic modification induced by anthocyanin-rich bilberry extract in the hippocampus of ApoE−/− mice. J. Funct. Foods 2021, 85, 104609. [Google Scholar] [CrossRef]
- Chen, J.; Bai, X.; Wu, Q.; Chen, L.; Wang, H.; Zhang, J. Exercise Protects Against Cognitive Injury and Inflammation in Alzheimer’s Disease Through Elevating miR-148a-3p. Neuroscience 2023, 513, 126–133. [Google Scholar] [CrossRef]
- Pereira, S.R.; Almeida, L.M.; Dinis, T.C.P. Improving the anti-inflammatory activity of 5-aminosalicylic acid by combination with Cyanidin-3-glucoside: An in vitro study. J. Funct. Foods 2019, 63, 103586. [Google Scholar] [CrossRef]
- Zhang, J.; Wu, J.; Liu, F.; Tong, L.; Chen, Z.; Chen, J.; He, H.; Xu, R.; Ma, Y.; Huang, C. Neuroprotective effects of anthocyanins and its major component Cyanidin-3-O-glucoside (C3G) in the central nervous system: An outlined review. Eur. J. Pharmacol. 2019, 858, 172500. [Google Scholar] [CrossRef]
- You, M.; Cai, Y.; Fan, Z.; Abelson, H. Protective effect of Cy-3G on PC12 cells against beta-amyloid-induced apoptosis and the possible mechanism. Int. J. Clin. Exp. Med. 2017, 10, 4565–4573. [Google Scholar]
- Mark, P.; Mattson, B.C.D.D. beta-Amyloid peptides destabilize calcium homeostasis and render human cortical neurons vulnerable to excitotoxicity. J. Neurosci. 1992, 12, 367–389. [Google Scholar]
- Arispe, N.; Pollard, H.B.; Rojas, E. Giant multilevel cation channels formed by Alzheimer disease amyloid beta-protein [A beta P-(1-40)] in bilayer membranes. Proc. Natl. Acad. Sci. USA 1993, 90, 10573–10577. [Google Scholar] [CrossRef]
- Skulachev, V.P. Cytochrome c in the apoptotic and antioxidant cascades. FEBS Lett. 1998, 423, 275–280. [Google Scholar] [CrossRef] [PubMed]
- van Loo, G.; Saelens, X.; van Gurp, M.; MacFarlane, M.; Martin, S.J.; Vandenabeele, P. The role of mitochondrial factors in apoptosis: A Russian roulette with more than one bullet. Cell Death Differ. 2002, 9, 1031–1042. [Google Scholar] [CrossRef] [PubMed]
- de Thonel, A.; Eriksson, J.E. Regulation of death receptors—Relevance in cancer therapies. Toxicol. Appl. Pharmacol. 2005, 207, 123–132. [Google Scholar] [CrossRef]
- Supnet, C.; Bezprozvanny, I. Neuronal Calcium Signaling, Mitochondrial Dysfunction, and Alzheimer’s Disease. J. Alzheimer’s Dis. 2010, 20, S487–S498. [Google Scholar] [CrossRef]
- Lindsay, J.; Esposti, M.D.; Gilmore, A.P. Bcl-2 proteins and mitochondria--specificity in membrane targeting for death. Biochim. Biophys. Acta 2011, 1813, 532–539. [Google Scholar] [CrossRef]
- Howells, C.C.; Baumann, W.T.; Samuels, D.C.; Finkielstein, C.V. The Bcl-2-associated death promoter (BAD) lowers the threshold at which the Bcl-2-interacting domain death agonist (BID) triggers mitochondria disintegration. J. Theor. Biol. 2011, 271, 114–123. [Google Scholar] [CrossRef]


| Name of the Reagent | Article Number | Production Company | Place of Origin |
|---|---|---|---|
| Aβ1–42 | / | Gill Biochemical Co., Ltd. | Shenyang, China |
| MTT | WLA021a | All creatures | Shenyang, China |
| Reactive oxygen species detection kit | WLA131 | All creatures | Shenyang, China |
| MitoSOX Red Mitochondrial Superoxide Indicator | M36008 | Lloyds Kang biological | Shenyang, China |
| Mitochondrial membrane potential detection kit | C2006 | Blue skies | Shenyang, China |
| ATP detection KitBCA protein concentration detection kit | S0026 | Blue skies | Shenyang, China |
| Calcium checkerboard | WLA004a | Wanleibio | Shenyang, China |
| Apoptosis detection kit TRIpureBeyoRT I1M-MLV reverse transcription | RP1001 | BioTeke | Beijing, China |
| enzyme | D7160L | Blue skies | Shanghai, China |
| RNase inhibitor | RP5602 | BioTeke | Beijing, China |
| 2 × Taq PCR MasterMix | PC1150 | Solarbio | Beijing, China |
| SYBR Green | SY1020 | Solarbio | Beijing, China |
| Cytochrome C antibody | WL02410 | Wanleibio | Shenyang, China |
| Bcl-2 antibody | WL01556 | Wanleibio | Shenyang, China |
| Bax antibody | WL01637 | Wanleibio | Shenyang, China |
| Caspase-9 antibody | WL01838 | Wanleibio | Shenyang, China |
| Caspase3/cleaved-Caspase3 antibody | WL02117 | Wanleibio | Shenyang, China |
| Sheep Anti-Rabbit LG-HRP Internal | WLA023 | Wanleibio | Shenyang, China |
| Reference antibody P-actin total | WL01372 | Wanleibio | Shenyang, China |
| WLA019 | Wanleibio | Shenyang, China | |
| Protein extraction kit MEM medium | 41500 | Mr. Lai treasure | Shenyang, China |
| F12 medium | BL311A | Biosharp | Shenyang, China |
| Fetal bovine serum | 11011-8611 | Sijiqing | Shenyang, China |
| PBS | B548117 | Sangon | Shenyang, China |
| Pancreatic enzyme | T4799 | Sigma | Shenyang, China |
| EDTA | E6758 | Sigma | Shenyang, China |
| Sodium Pyruvate | S104174 | Aladdin | Shenyang, China |
| Gluta-max | 35050079 | Syme Fly | Shenyang, China |
| Rhod-2 AM probe | MX4507 | Shanghai Maokang Biological | Shenyang, China |
| Pluronic F127 | P6790 | Mr. Lai treasure | Shenyang, China |
| MitoTracker Green probe | C1048 | Blue skies | Shenyang, China |
| Instrument Used | Manufacturing Company | Place of Origin | Company |
|---|---|---|---|
| Ultra-pure water system | NW10LVF | Hong Kong | Heal Force |
| Ultra-high speed refrigerated centrifuge | H-2050R | Changsha, China | Hunan instrument |
| CO2 incubator inverted | HF-90 | Shanghai, China | Shanghai force |
| Phase contrast microscope ultra clean table | IX53 | Shanghai, China | OLYMPUS |
| Enzyme standard instrument | 800TS | Shanghai, China | BIOTEK |
| Flow cytometer | NovoCyte | Shanghai, China | Agilent |
| Multifunctional enzyme marker | SynergyH1 | Shanghai, China | Biotek |
| Micropipette | Proline | Suzhou, China | BIOHIT |
| Ultraviolet visible spectrophotometer | UV752N | Shanghai, China | Shanghai saso |
| Digital display constant temperature water bath | HH-4 | Jintan, China | The splendor instrument |
| Vacuum drying oven | DZF-6050 | Shanghai, China | SYSBERY |
| Fluorescence quantitative PCR instrument | Exicycler 96 | Shanghai, China | BIONEER |
| Electrophoresis apparatus | DYY-7C | Beijing, China | Beijing, June 1 |
| Transfer trough | DYCZ-40D | Beijing, China | Beijing, June 1 |
| Double vertical protein Electrophoresis gel | DYCZ-24DN | Beijing, China | Beijing, June 1 |
| Imaging system | WD-9413B | Beijing, China | Beijing, June 1 |
| Overspeed refrigerated Centrifuge electric | H-2050R | Changsha, China | Hunan instrument |
| Thermostatic incubator | DH36001B | Tianjin, China | Tianjin Tester |
| Calcium testing box | C004 | Nanjing, China | Nanjing Jiancheng Co., Ltd. |
Disclaimer/Publisher’s Note: The statements, opinions and data contained in all publications are solely those of the individual author(s) and contributor(s) and not of MDPI and/or the editor(s). MDPI and/or the editor(s) disclaim responsibility for any injury to people or property resulting from any ideas, methods, instructions or products referred to in the content. |
© 2025 by the authors. Licensee MDPI, Basel, Switzerland. This article is an open access article distributed under the terms and conditions of the Creative Commons Attribution (CC BY) license (https://creativecommons.org/licenses/by/4.0/).
Share and Cite
Ma, C.; Nie, Y.; Zhang, D.; Ran, L.; Xu, S.; Ran, X.; Huang, J.; Meng, L. Cyanidin-3-O-Glucoside Mitigates Amyloid-Beta (1–42)-Induced Apoptosis in SH-SY5Y Cells by Regulating Ca2+ Homeostasis and Inhibiting Mitochondrial Dysfunction. Antioxidants 2025, 14, 490. https://doi.org/10.3390/antiox14040490
Ma C, Nie Y, Zhang D, Ran L, Xu S, Ran X, Huang J, Meng L. Cyanidin-3-O-Glucoside Mitigates Amyloid-Beta (1–42)-Induced Apoptosis in SH-SY5Y Cells by Regulating Ca2+ Homeostasis and Inhibiting Mitochondrial Dysfunction. Antioxidants. 2025; 14(4):490. https://doi.org/10.3390/antiox14040490
Chicago/Turabian StyleMa, Chao, Yu Nie, Donglei Zhang, Lulu Ran, Su Xu, Xun Ran, Junya Huang, and Lingshuai Meng. 2025. "Cyanidin-3-O-Glucoside Mitigates Amyloid-Beta (1–42)-Induced Apoptosis in SH-SY5Y Cells by Regulating Ca2+ Homeostasis and Inhibiting Mitochondrial Dysfunction" Antioxidants 14, no. 4: 490. https://doi.org/10.3390/antiox14040490
APA StyleMa, C., Nie, Y., Zhang, D., Ran, L., Xu, S., Ran, X., Huang, J., & Meng, L. (2025). Cyanidin-3-O-Glucoside Mitigates Amyloid-Beta (1–42)-Induced Apoptosis in SH-SY5Y Cells by Regulating Ca2+ Homeostasis and Inhibiting Mitochondrial Dysfunction. Antioxidants, 14(4), 490. https://doi.org/10.3390/antiox14040490