Article

Optimization, Metabolomic Analysis, Antioxidant Potential and Depigmenting Activity of Polyphenolic Compounds from Unmature Ajwa Date Seeds (Phoenix dactylifera L.) Using Ultrasonic-Assisted Extraction

1
Department of Food Science and Biotechnology, Graduate School, Kyungpook National University, Daegu 41566, Republic of Korea
2
Food and Bio-Industry Research Institute, Inner Beauty/Antiaging Center, Kyungpook National University, Daegu 41566, Republic of Korea
3
Department of Chemistry, Kyungpook National University, Daegu 41566, Republic of Korea
4
Mass Spectroscopy Converging Research and Green-Nano Materials Research Center, Kyungpook National University, Daegu 41566, Republic of Korea
*
Author to whom correspondence should be addressed.
Antioxidants 2024, 13(2), 238; https://doi.org/10.3390/antiox13020238
Submission received: 19 January 2024 / Revised: 8 February 2024 / Accepted: 12 February 2024 / Published: 15 February 2024

Abstract

:
This study sought to optimize the ultrasonic-assisted extraction of polyphenolic compounds from unmature Ajwa date seeds (UMS), conduct untargeted metabolite identification and assess antioxidant and depigmenting activities. Response surface methodology (RSM) utilizing the Box–Behnken design (BBD) and artificial neural network (ANN) modeling was applied to optimize extraction conditions, including the ethanol concentration, extraction temperature and time. The determined optimal conditions comprised the ethanol concentration (62.00%), extraction time (29.00 min), and extraction temperature (50 °C). Under these conditions, UMS exhibited total phenolic content (TPC) and total flavonoid content (TFC) values of 77.52 ± 1.55 mgGAE/g and 58.85 ± 1.12 mgCE/g, respectively, with low relative standard deviation (RSD%) and relative standard error (RSE%). High-resolution mass spectrometry analysis unveiled the presence of 104 secondary metabolites in UMS, encompassing phenols, flavonoids, sesquiterpenoids, lignans and fatty acids. Furthermore, UMS demonstrated robust antioxidant activities in various cell-free antioxidant assays, implicating engagement in both hydrogen atom transfer and single electron transfer mechanisms. Additionally, UMS effectively mitigated tert-butyl hydroperoxide (t-BHP)-induced cellular reactive oxygen species (ROS) generation in a concentration-dependent manner. Crucially, UMS showcased the ability to activate mitogen-activated protein kinases (MAPKs) and suppress key proteins including tyrosinase (Tyr), tyrosinase-related protein-1 and -2 (Trp-1 and -2) and microphthalmia-associated transcription factor (MITF), which associated melanin production in MNT-1 cell. In summary, this study not only optimized the extraction process for polyphenolic compounds from UMS but also elucidated its diverse secondary metabolite profile. The observed antioxidant and depigmenting activities underscore the promising applications of UMS in skincare formulations and pharmaceutical developments.

1. Introduction

Extraction, the pivotal initial step in the retrieval and purification of bioactive compounds from plant sources, often relies on conventional methods characterized by lengthy extraction times and limited effectiveness [1]. To address these shortcomings, green extraction processes have been developed, offering an eco-friendly alternative. These processes are known to significantly reduce processing times, enhance heat and mass transfer rates, improve product quality, minimize solvent usage and promote the adoption of Generally Regarded as Safe (GRAS) solvents [2]. The adoption of green extraction methods not only conserves energy but also minimizes adverse impacts on the environment and human health. Among these techniques, ultrasound-assisted extraction (UAE) stands out as a green and highly efficient approach, demonstrating superior recovery yields and the preservation of target compound activities, making it particularly valuable for the extraction of antioxidants [3].
The conventional one-factor-at-a-time approach to optimization often overlooks the intricate interactions among variables, failing to guarantee optimal conditions and necessitating numerous trials, thereby increasing time, costs, and resource consumption [1]. To address this challenge, statistical methodologies such as the Box–Behnken design (BBD), a component of response surface methodology (RSM), have emerged, enabling the prediction of optimal extraction conditions and the comprehension of the relationships between extraction factors [4]. RSM encompasses a range of statistical and mathematical techniques for optimizing processes influenced by multiple variables, facilitating the development of new products and the enhancement of existing ones. It elucidates how independent variables affect processes, either individually or collectively, offering a mathematical model to represent chemical or biological procedures and assess the impact of independent factors [5]. Nonetheless, the forecast accuracy of RSM may be compromised in the presence of nonlinear relationships between variables [6]. Artificial neural networks (ANNs), with their capacity for learning algorithms and modeling nonlinear systems, are increasingly adopted as predictive tools across various disciplines, including food technology [7].
Free-radical reactions in biology play a crucial role in tissue damage and pathological events in living organisms, especially in aerobic life where lipids with polyunsaturated fatty acids are susceptible to oxidation [8]. Excess oxygen or insufficient reduction can generate reactive oxygen species (ROS) such as superoxide anions, hydroxyl radicals and hydrogen peroxide. Aerobic organisms have a natural antioxidant defense system, but if inadequate, ROSs may cause oxidative damage to macromolecules [9]. Phytochemicals with intrinsic antioxidant activity have emerged as potential remedies for oxidative stress-induced disorders. Antioxidative phenolics in plant tissues, serving various roles from structural to defensive, are believed to contribute to their medicinal actions. These compounds, studied extensively for their positive effects on human health, can orchestrate cellular protective signaling cascades, making them valuable candidates for mitigating oxidative stress-induced disorders. Exploring the therapeutic potential of these natural compounds holds promise in understanding and preventing diseases associated with free-radical reactions [8,9].
Melanogenesis, the intricate process of melanin synthesis involving melanocytes and keratinocytes, is central to skin pigmentation. Melanin, produced by melanocytes, is then transferred to adjacent keratinocytes, ultimately influencing skin color [10]. This physiological phenomenon serves multiple vital functions, including protection against harmful agents such as ultraviolet radiation (UVR) and various drugs. However, dysregulation of melanogenesis can lead to cosmetically undesirable outcomes, such as freckles, chloasma, dermatitis, and age-related skin pigmentation [10,11]. Thus, managing melanogenesis in the human epidermis is a challenging scientific and clinical pursuit. UVR exposure triggers DNA damage and activates p53, which in turn regulates tyrosinase (Tyr), tyrosinase-related protein-1 and -2 (Trp-1 and -2), through the microphthalmia-associated transcription factor (MITF) in melanocytes [12]. Additionally, several kinase proteins, including p38, c-jun N-terminal kinases (JNKs) and extracellular signal-regulated protein kinases (ERKs), influence melanogenesis [11].
The date palm, (Phoenix dactylifera L. Arecaceae family), is a globally popular and nutritionally significant fruit. Among its various cultivars, the Ajwa date stands out as one of the most esteemed and expensive varieties due to its ethnomedical associations with health-enhancing properties [13]. Preclinical research has highlighted its diverse health-promoting attributes, including antioxidative, anti-inflammatory, anticancer, hepatoprotective, antimicrobial, nephroprotective, antidiabetic and hyperlipidemic effects [14,15,16,17,18,19]. Additionally, the fruit is a rich source of dietary fiber, minerals, organic acids and vitamins, contributing to its nutritional and therapeutic significance, with carbohydrates constituting over 70% of its composition. Furthermore, it contains a plethora of bioactive components, such as polyphenols, encompassing phenolic acids, flavonoids and lignans [20]. Notably, the benefits of Ajwa dates extend beyond the fruit itself to its seeds, the often overlooked and underutilized byproducts of various date-related industries. These seeds, derived from technological or biological transformations of date fruits, are typically discarded or used as fertilizer or animal feed. However, they hold untapped potential as a source of high-value-added components, although limited research has explored their potential in pharmaceutical or nutraceutical product development [21].
This study unveils an innovative method to enhance the extraction of polyphenols from unmature Ajwa date seeds (UMS) by employing UAE, RSM-BBD and ANN. Through the systematic optimization of key parameters such as temperature, time and ethanol concentration, a robust model was developed to maximize polyphenol yield from UMS, representing a significant advancement in the field. Furthermore, the application of high-resolution mass spectrometry facilitated the comprehensive identification of bioactive secondary metabolites within UMS, shedding new light on their potential pharmacological benefits. Additionally, the evaluation of antioxidant potential underscores the promising applications of UMS in both food and pharmaceutical industries. An important aspect of this study is the investigation into UMS’s depigmentation properties using MNT-1 cells, accompanied by mechanistic studies. These findings not only emphasize UMS’s potential in dermatology and skincare but also lay the groundwork for future applications in this field.

2. Materials and Methods

2.1. Sample Collection and Preparation

Unmature Ajwa date fruits (Kimri stage), harvested in Al-Madina Al-Munawara, Saudi Arabia, were collected in July, 2022 and scientifically verified at the National Herbarium and Genebank of Saudi Arabia, with a voucher specimen (No. NHG005) stored for reference. UAE was conducted at a fixed 25 kHz frequency using specialized equipment (Elma Schmidbauer GmbH, Singen, Germany). Unmatured date seeds (UMS) were meticulously cleaned, air dried (40 ± 1 °C for 2 days using the laboratory dry oven) and ground (average particle size: 300 µm of diameter). Dry powder samples (1.0 g) underwent triple extraction with 10 mL of solvent, following the design in Table 1. Additionally, heat and maceration extraction followed established methods [22]. The extracted samples were filtered, concentrated in a rotary evaporator (Tokyo Rikakikai Co., Ltd., Tokyo, Japan) and lyophilized with a freeze dryer (Il-shin Biobase, Goyang, Republic of Korea). The resulting UMS extract was stored at −20 °C for subsequent experiments. The lyophilized extract was dissolved in a mixture of DMSO and dH2O (1:9) to create a stock solution of 100 μg/mL. Subsequently, serial dilution was performed using dH2O to prepare the experimental concentrations.

2.2. Measurement of Total Phenolic (TPC) and Total Flavonoid Content (TFC)

The TPC and TFC in UMS extracts were quantified using the Folin–Ciocalteu test and aluminum chloride colorimetric method, respectively [11]. For TPC measurement, 2 μL of a sample (100 μg/mL) was combined with 10 μL of Folin–Ciocalteu’s phenol reagent (Sigma-Aldrich, St. Louis, MO, USA). After 5 min, 100 μL of a 7% Na2CO3 solution was introduced, followed by the addition of 90 μL of dH2O. The mixture was then incubated in the dark for 90 min at room temperature. Absorbance was subsequently measured at 750 nm. On the other hand, for TFC measurement, 2 μL of the sample was mixed with a solution comprising 100 μL of dH2O, 5 μL of 5% NaNO2, and 10 μL of 10% AlCl3·6H2O. After 10 min, 40 μL of NaOH (1 M) was added, and the absorbance was measured against the reagent blank at 506 nm. The experiments were conducted in triplicates for each trial. Utilizing regression equations derived from calibration curves, the TPC (y = 0.0512x + 0.0018; r2 = 0.9835) and TFC (y = 0.014x + 0.0021; r2 = 0.9994) were determined. TPC was expressed as gallic acid equivalent (mg)/dry weight sample (g), and TFC as catechin equivalent (mg)/dry weight sample (g).

2.3. Cell-Free Antioxidant Assays

The free radical scavenging activity of UMS was evaluated using established protocols for DPPH, ABTS, superoxide, hydroxyl and nitric oxide radicals [8,9]. Percent inhibition was calculated using Equation (1) and IC50 values were determined for each radical to assess UMS efficacy.
R a d i c a l   s c a v e n g i n g   a c t i v i t y %   i n h i b i t i o n = A B A ×   100
where A and B denote the absorbance of the control and sample, respectively. Each sample was examined three times.
For DPPH and ABTS radical scavenging assays, various concentrations of the sample (2 μL) were mixed with 198 μL of DPPH (0.2 M in 50% methanol) and ABTS solutions (2.5 mM potassium persulfate and 7 mM ABTS). The mixtures stood for 10 min at room temperature in the dark, and absorbance readings were taken at 517 nm and 734 nm for the DPPH and ABTS assays, respectively. Ascorbic acid served as the reference antioxidant.
Additionally, DPPH and ABTS scavenging was expressed as µmol ascorbic acid equivalents per gram (μmol AAE/g) of UMS using calibrated regression equations (DPPH: y = 0.0069x + 0.035; r2 = 0.9905 and ABTS: y = 0.0083x + 0.0002; r2 = 0.9989).
Superoxide radical generation was verified using the non-enzymatic PMS/NADH complex, where NBT is reduced to formazan. Samples (2 µL) were mixed with a superoxide radical generation mixture (73 µM NADH, 50 µM NBT and 15 µM PMS in PBS), incubated for 30 min, and absorbance was read at 562 nm [9]. Gallic acid served as the reference antioxidant.
For hydroxyl radical scavenging activity, samples (5 µL) were added to the Fenton reaction mixture (3.6 mM deoxyribose, 0.1 mM EDTA, 0.1 mM ascorbic acid, 1 mM H2O2 and 0.1 mM FeCl3 in PBS). After a 1 h incubation at 37 °C, 1% TBA and 2.8% TCA were added, heated, and absorbance was measured at 532 nm. Quercetin was the standard.
For nitric oxide measurement, samples (10 µL) were mixed with sodium nitroprusside (10 mM) in PBS, incubated for 150 min, then reacted with Griss reagent (Sigma-Aldrich, St. Louis, MO, USA). Absorbance was measured at 546 nm using catechin as the reference compound.
Moreover, the reducing power potential of UMS was evaluated through cupric-reducing antioxidant capacity (CUPRAC) and ferric-reducing antioxidant power (FRAP) assays, following Alam et al. [8]. In FRAP and CUPRAC assays, samples (2 µL) were mixed with an FRAP reagent (20 mM FeCl3 and 10 mM TPTZ in acetic acid buffer), and absorbance was measured at 595 nm. For CUPRAC, samples were mixed with a solution of CuCl2, neocuproine (Sigma-Aldrich, St. Louis, MO, USA) and ammonium acetate buffer, incubated for 1 h at 25 °C, and absorbance was measured at 450 nm. The obtained values were expressed as (mmol AAE/g) of UMS using standard curves for each assay (CUPRAC: y = 0.0065x + 0.039; r2 = 0.9975; and FRAP: y = 0.013x + 0.0465; r2 = 0.9889).

2.4. Cell Culture and Intracellular ROS Generation Assay

RAW 264.7 macrophages (ATCC, Rockville, MD, USA) were maintained in DMEM supplemented with 10% FBS and 100 µg/mL each of streptomycin and penicillin, under standard culture conditions (37 °C, and 5% CO2). Cells (5 × 10⁵/mL) were seeded in 96-well plates and incubated for 12 h. Subsequently, they were treated with UMS (6.25–100 µg/mL) for 24 h, both alone and in combination with t-BHP (oxidative stress inducer). Cellular toxicity was assessed using the MTT assay, while reactive oxygen species (ROS) generation induced by t-BHP was evaluated by the DCFH-DA method, as previously described [8].

2.5. Effect of UMS on Melanin Content

Cells (5 × 10⁵ cells/mL) were cultured in a 24-well plate (BD Falcon, Bedford, MA, USA) overnight. Subsequent to media replacement, cells were exposed to UMS (25–100 μg/mL) or arbutin (100 μg/mL). Post-3-days, PBS-washed cells were lysed with 1 N NaOH, and absorbance at 405 nm was measured using a microplate reader (Thermo Fisher Scientific, Vantaa, Finland). The percentage of melanin inhibition was calculated using Equation (2).
M e l a n i n   p r o d u c t i o n %   i n h i b i t i o n = A B A ×   100
where A and B represent the absorbance of non-treated cells and treated with UMS or arbutin (positive control), respectively [11].

2.6. Preparation of Cell Lysates and Western Blotting

Cell lysates were treated with sodium dodecyl sulfate (SDS) buffer (3M, Maplewood, MN, USA) and denatured at 100 °C for 5 min. Proteins (30 µg) were separated on a 10% SDS-polyacrylamide gel, transferred to nitrocellulose membranes (Whatman, Dassel, Germany) and blocked with 5% skim milk in TBST buffer. After blocking, membranes were probed with primary antibodies (Supplementary Table S1), followed by secondary antibodies (anti-rabbit IgG-HRP; BioWorld Technology, St. Louis Park, MN, USA). Antigen–antibody reactions were detected using an ECL solution system (Perkin Elmer, Waltham, MA, USA) [11].

2.7. Single-Factor Experiment

Polyphenolic compound extraction was studied through single-factor experiments, varying the ultrasonic time (10–50 min), temperature (30–70 °C) and ethanol concentration (25–90%). Optimal ultrasonic-assisted extraction conditions were then determined based on these results (Table S2).

2.8. Experimental Design of RSM for the Extraction Process

In this study, BBD was employed to optimize the extraction process of UMS for maximizing TPC and TFC. The independent extraction variables considered were ethanol concentration (X1), extraction time (X2) and temperature (X3), while the response variables of interest were TPC (Y1) and TFC (Y2). The relationships between these variables were modeled using a second-order polynomial Equation (3):
Y = β 0 + i = 1 n β i X i + i = 1 n β i i X i i 2 + i n 1 j n β i j X i j
where Y represents the response variable; Xi and Xj are the coded independent variables; β0 is the constant coefficient; and βi, βii and βij are the coefficients for linear, quadratic and interaction effects, respectively. The outcomes of these interactions were visualized through three-dimensional (3D) surface plots.

2.9. Artificial Neural Network (ANN) Modeling

A multilayer perceptron (MLP) neural network was used to establish a link between independent variables (X1, X2 and X3) and response variables Y1 and Y2 using a backpropagation feed-forward ANN model [23]. The dataset was divided into training (70%), validation (15%) and testing (15%) sets. Training was conducted using a hit and trial technique to minimize the mean square error (MSE) calculated from Equation (4). Two different types of neural networks, feed-forward and cascade feed-forward, were utilized, employing the Broyden–Fletcher–Goldfarb–Shanno (BFGS) and Levenberg–Marquardt backpropagation (trainlm) algorithms. The ANN model’s architecture consisted of three layers, as depicted in Supplementary Figure S1, with the output generated through nonlinear activation functions in the hidden layer. Several statistical parameters, including R2, RMSE, AAD and SEP, were computed using specific Equations (5)–(8), to evaluate and compare the predictive performance of the ANN and RSM. This approach allowed for a robust assessment of the nonlinear relationships between input and output variables.
M S E = 1 N i = 1 N ( Y A N N Y E x p ) 2
R 2 = 1 i = 1 n ( x i x i k ) 2 i = 1 n ( x i k x z ) 2
R M S E = 1 n i = 1 n ( x i x i k ) 2
A D D   % = i = 1 n x i k x i / x i k n × 100
S E P   % = R M S E y m × 100
where Yp is the predicted response; Ye is the observed response; Ym is the average response variable; n is the number of experiments

2.10. Validation of the Model

To ascertain the optimal extraction parameters for UMS, a combination of response surface and Derringer’s desirability function was employed. Each response was transformed into a unique desirability function, ranging from 0 to 1 based on their relative desirability, from lowest to highest. These component functions were then integrated into a total desirability function using Equation (9) [1].
D = d 1 w 1 d 2 w 2 . d n w n 1 / w i
To assess the agreement between observed and expected UMS outcomes, calculations of the RSD and RSE were performed using Equations (10) and (11), respectively. According to the criteria set forth, data were considered consistent with predictions when RSD and RSE values fell below 10% and 5%, respectively [24,25].
R S D % = S t a n d a r d   d e v i a t i o n   b e t w e e n   p r e d i c t e d   a n d   a c t u a l   v a l u e s M e a n   v a l u e s   b e t w e e n   p r e d i c t e d   a n d   a c t u a l   v a l u e s ×   100
R S E ( % ) = ( A c t u a l   v a l u e P r e d i c t e d   v a l u e ) P r e d i c t e d   v a l u e × 100

2.11. Analysis of Chemical Compounds by ESI–MS/MS

In this study, negative-mode ESI–MS experiments were conducted using the Q-Exactive™ Orbitrap Mass Spectrometer (Thermo Fisher Scientific Inc., San Jose, CA, USA). Sample infusion into the ESI source was accomplished directly at a rate of 20 µL/min utilizing a 500-µL syringe (Hamilton Company Inc., based in Reno, NV, USA), coupled with a syringe pump (Harvard in Holliston, MA, USA, model 11). Data acquisition was conducted through Xcalibur 3.1 with Foundation 3.1. (San Jose, CA, USA). The ESI–MS conditions featured a mass resolution of 140,000, a mass spectra range of m/z 50–1000, sheath gas at a flow rate of 5 and auxiliary gas at 0. Additionally, a spray voltage of 4.20 kV, capillary temperature at 320 °C and automatic gain control set at 5 E 6 were applied. MS/MS studies employed three stepwise normalized collision energies (10, 20 and 30) [9]. The identification of m/z peaks was achieved by comparing calculated (exact) masses of deprotonated (M–H) adducts with m/z values and ESI–MS/MS fragmentation patterns from in-house and online databases such as FooDB [26], METLIN [27] and CFM-ID 4.0 [28]. The chemical structure was drawn using ChemDraw Professional 15.0 (PerkinElmer, Waltham, MA, USA).

2.12. Statistical Analysis

Experimental data underwent robust analysis employing Design Expert 11 (Stat-Ease, Minneapolis, MN, USA) and GraphPad Prism 9 (GraphPad Software 9.0.2, San Diego, CA, USA). MATLAB’s Neural Network ToolboxTM (MATLAB R2020a, MathWorks, Natick, MA, USA) facilitated artificial neural network (ANN) analysis. Results, presented as mean ± standard deviation from a minimum of three independent experiments (n = 3), were rigorously scrutinized for statistical significance at p < 0.001, < 0.01 and < 0.05. Design Expert 11 enabled RSM analysis. GraphPad Prism 9 conducted one-way analysis of variance and Tukey’s multiple comparison test for all biological activities, deeming p < 0.05 statistically significant.

3. Results and Discussion

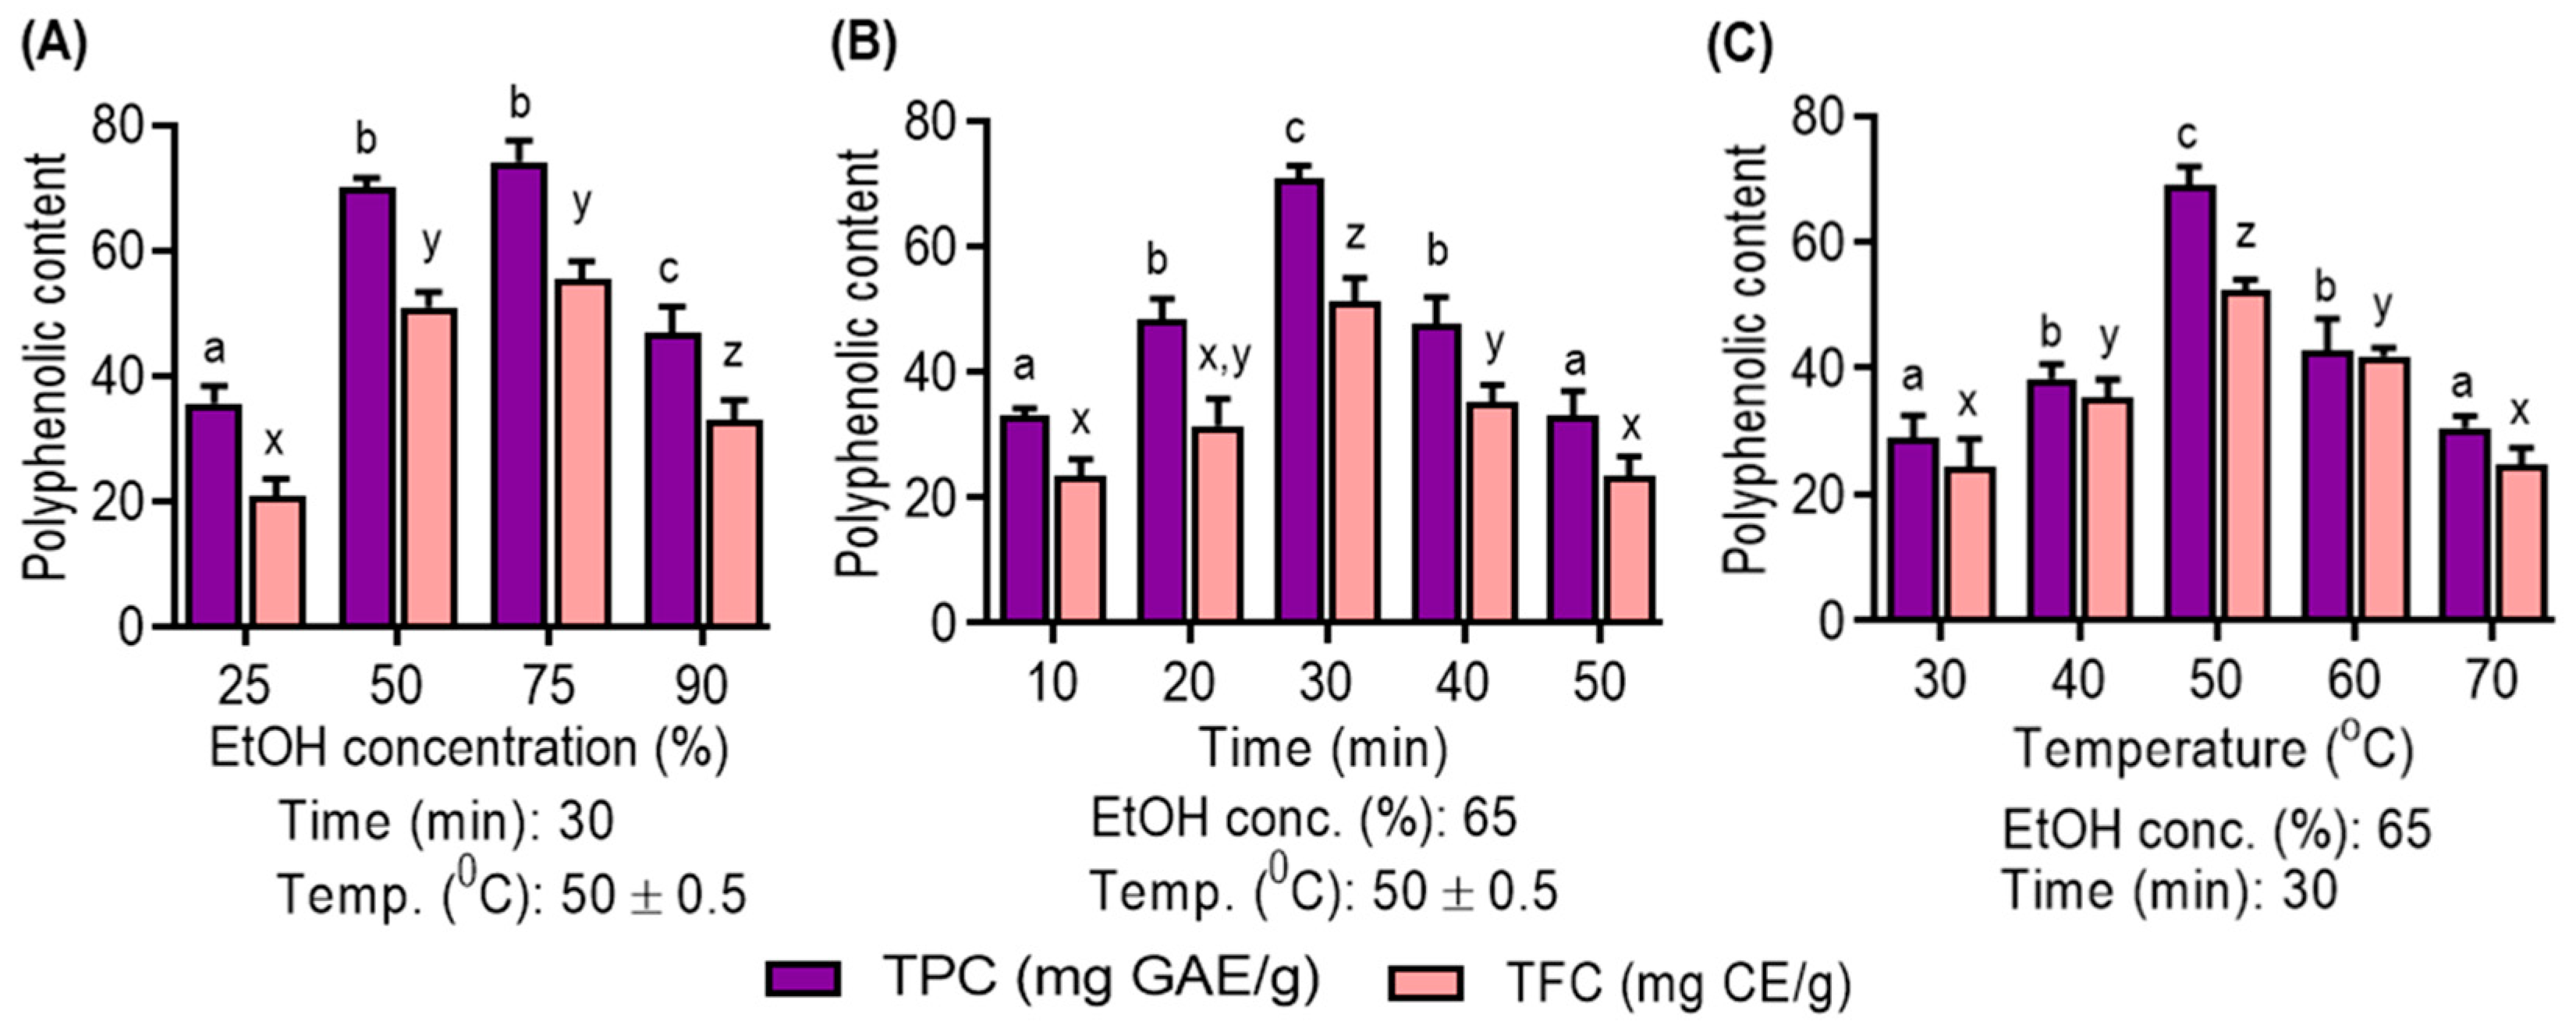
3.1. Single Factor Analysis

In this study, experiments were conducted to assess the individual effects of three key factors—ethanol concentration, extraction time and temperature—on the extraction yields of TPC and TFC from UMS.
As shown in Figure 1A, the choice of solvent concentration is pivotal. Ethanol, particularly at 75% concentration, is demonstrated to be the optimal choice due to its compatibility with the solubility of polyphenolic compounds. Notably, aqueous ethanol is favored for its low toxicity and cost-effectiveness, which enhance its efficiency in polyphenolic extraction, as corroborated by recent studies [4]. Figure 1B highlights the impact of the ultrasonic extraction time. Extended times (10–30 min) are beneficial for increased polyphenolic yield, but prolonged extraction negatively affects yields. This decline is attributed to structural degradation and solvent loss through vaporization, diminishing mass transfer efficiency [29]. Figure 1C emphasizes the role of temperature in polyphenolic compound extraction. Elevated temperatures (30 °C to 50 °C) enhance yields by disrupting cellular structures and reducing viscosity, consistent with prior research [30]. However, temperatures above 50 °C result in reduced yields due to decreased acoustic cavitation intensity, diminished extraction efficiency and potential thermosensitive compound degradation [31].

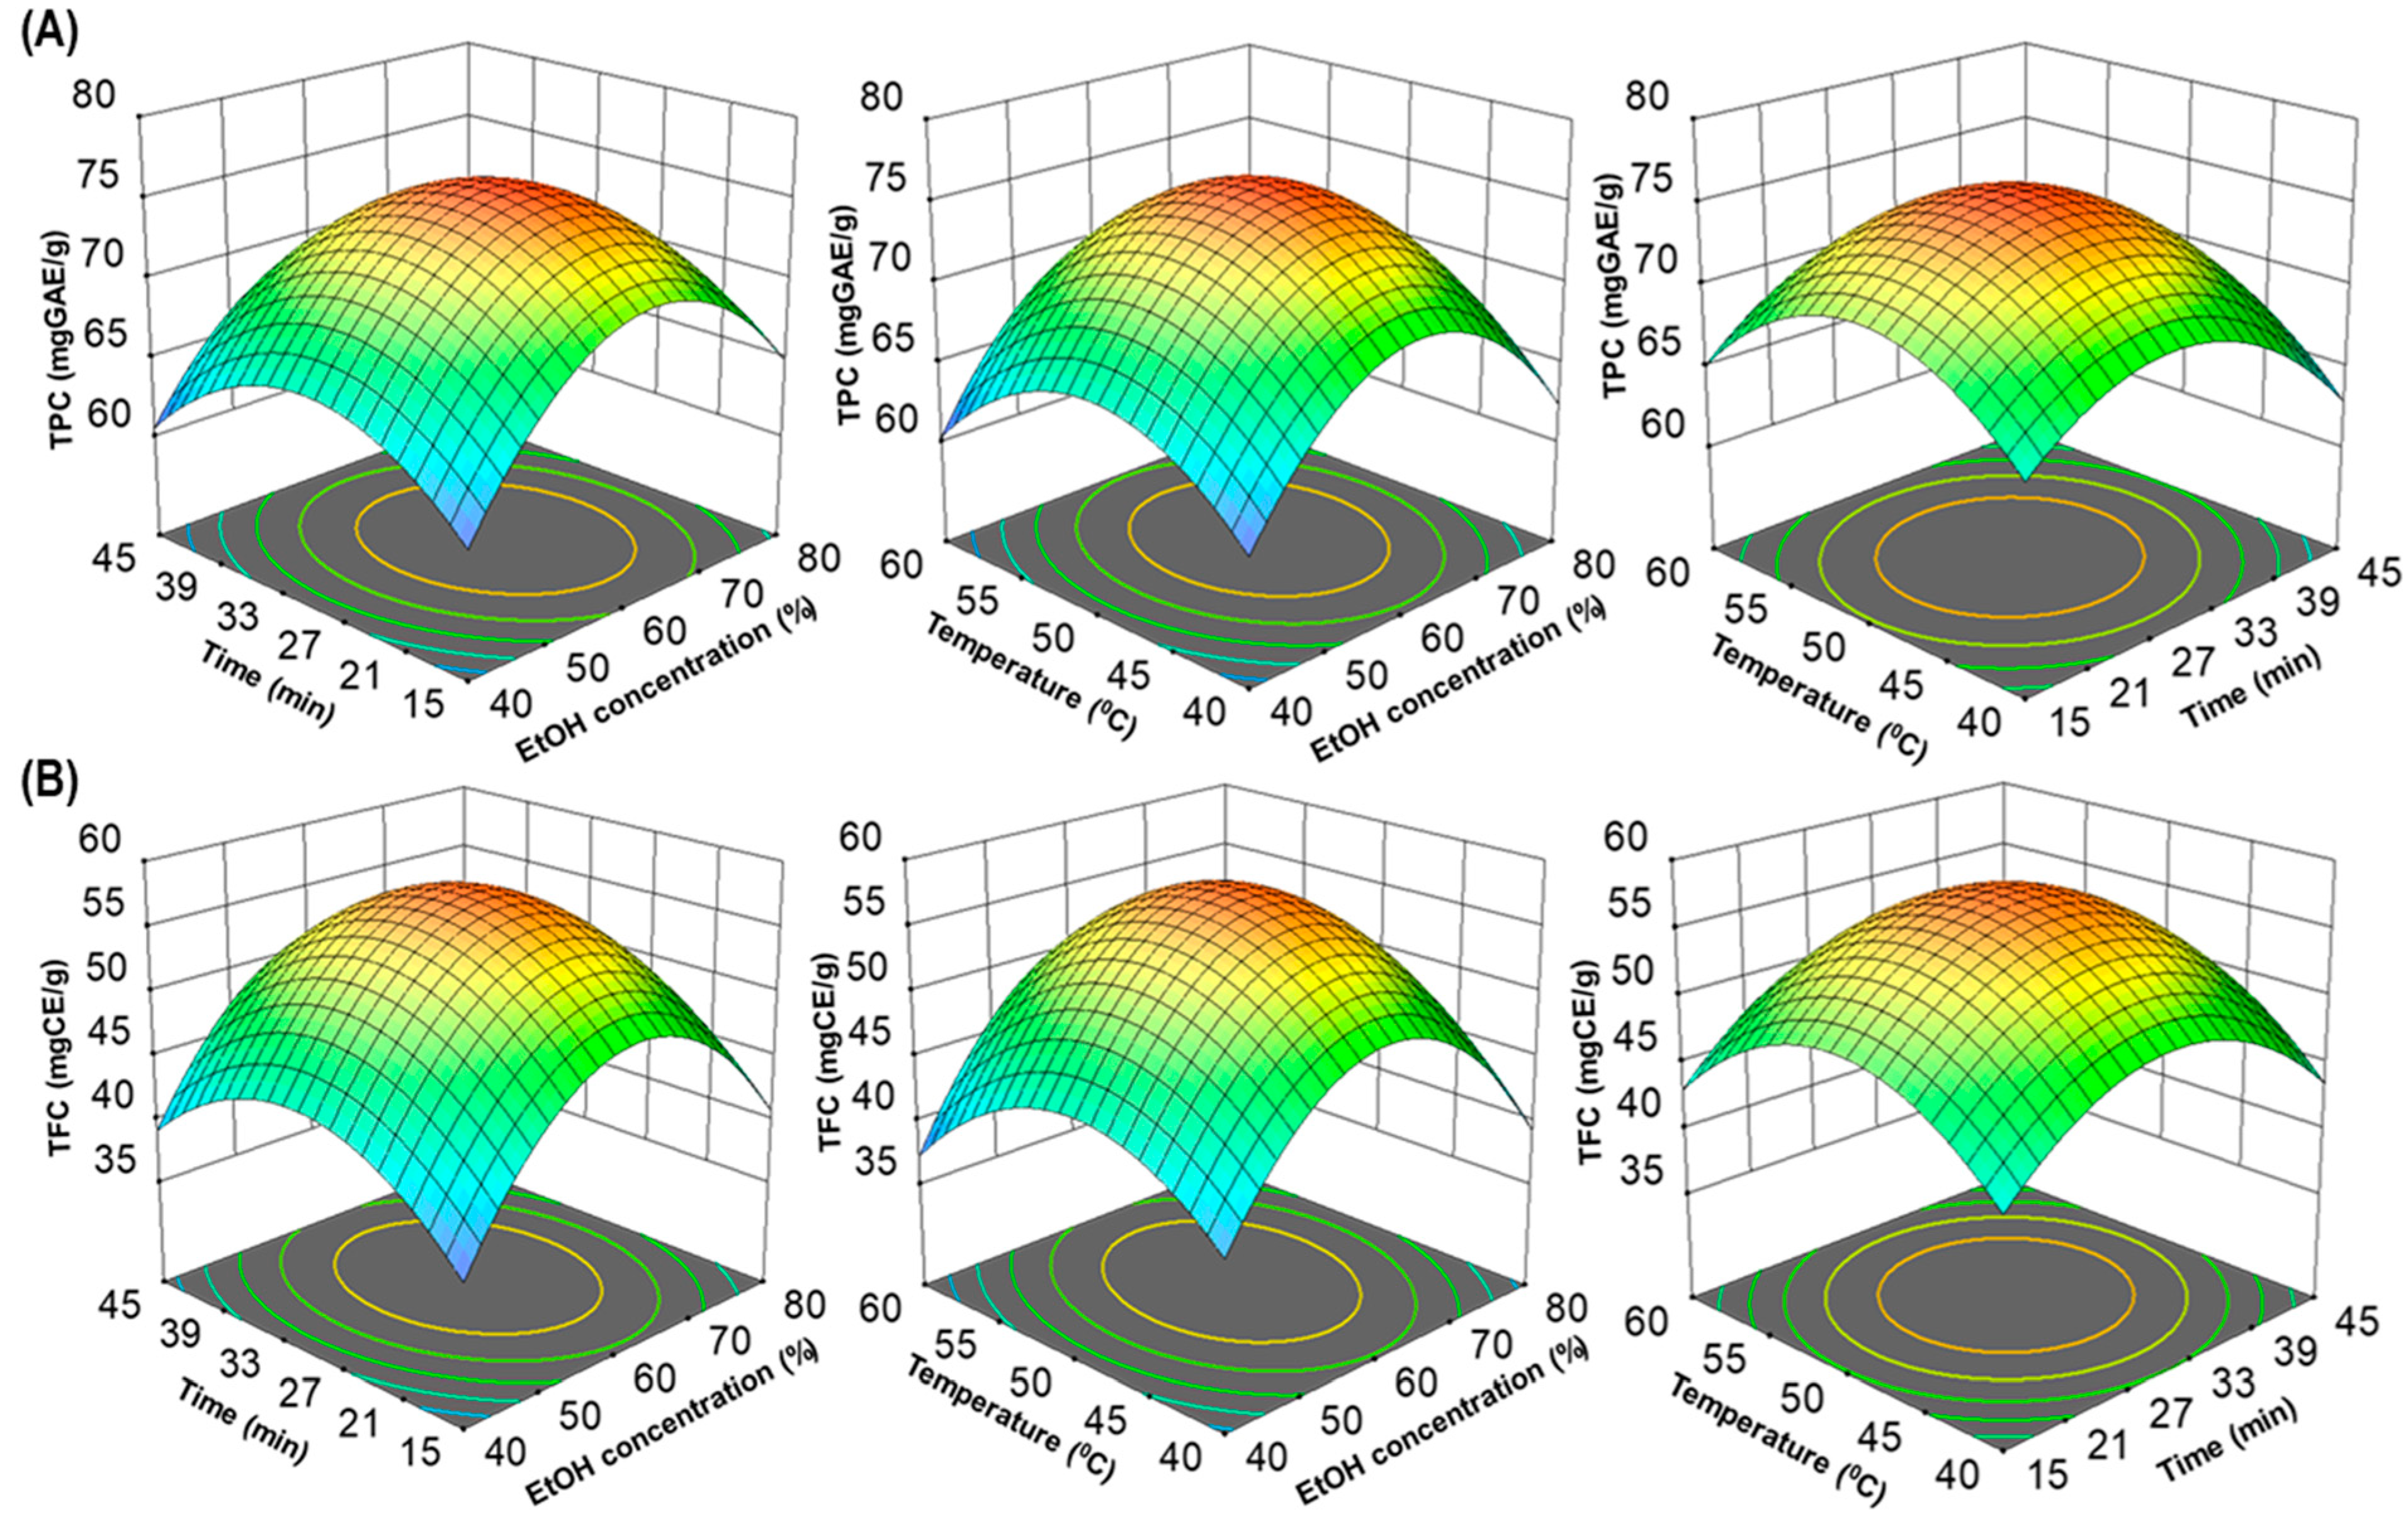
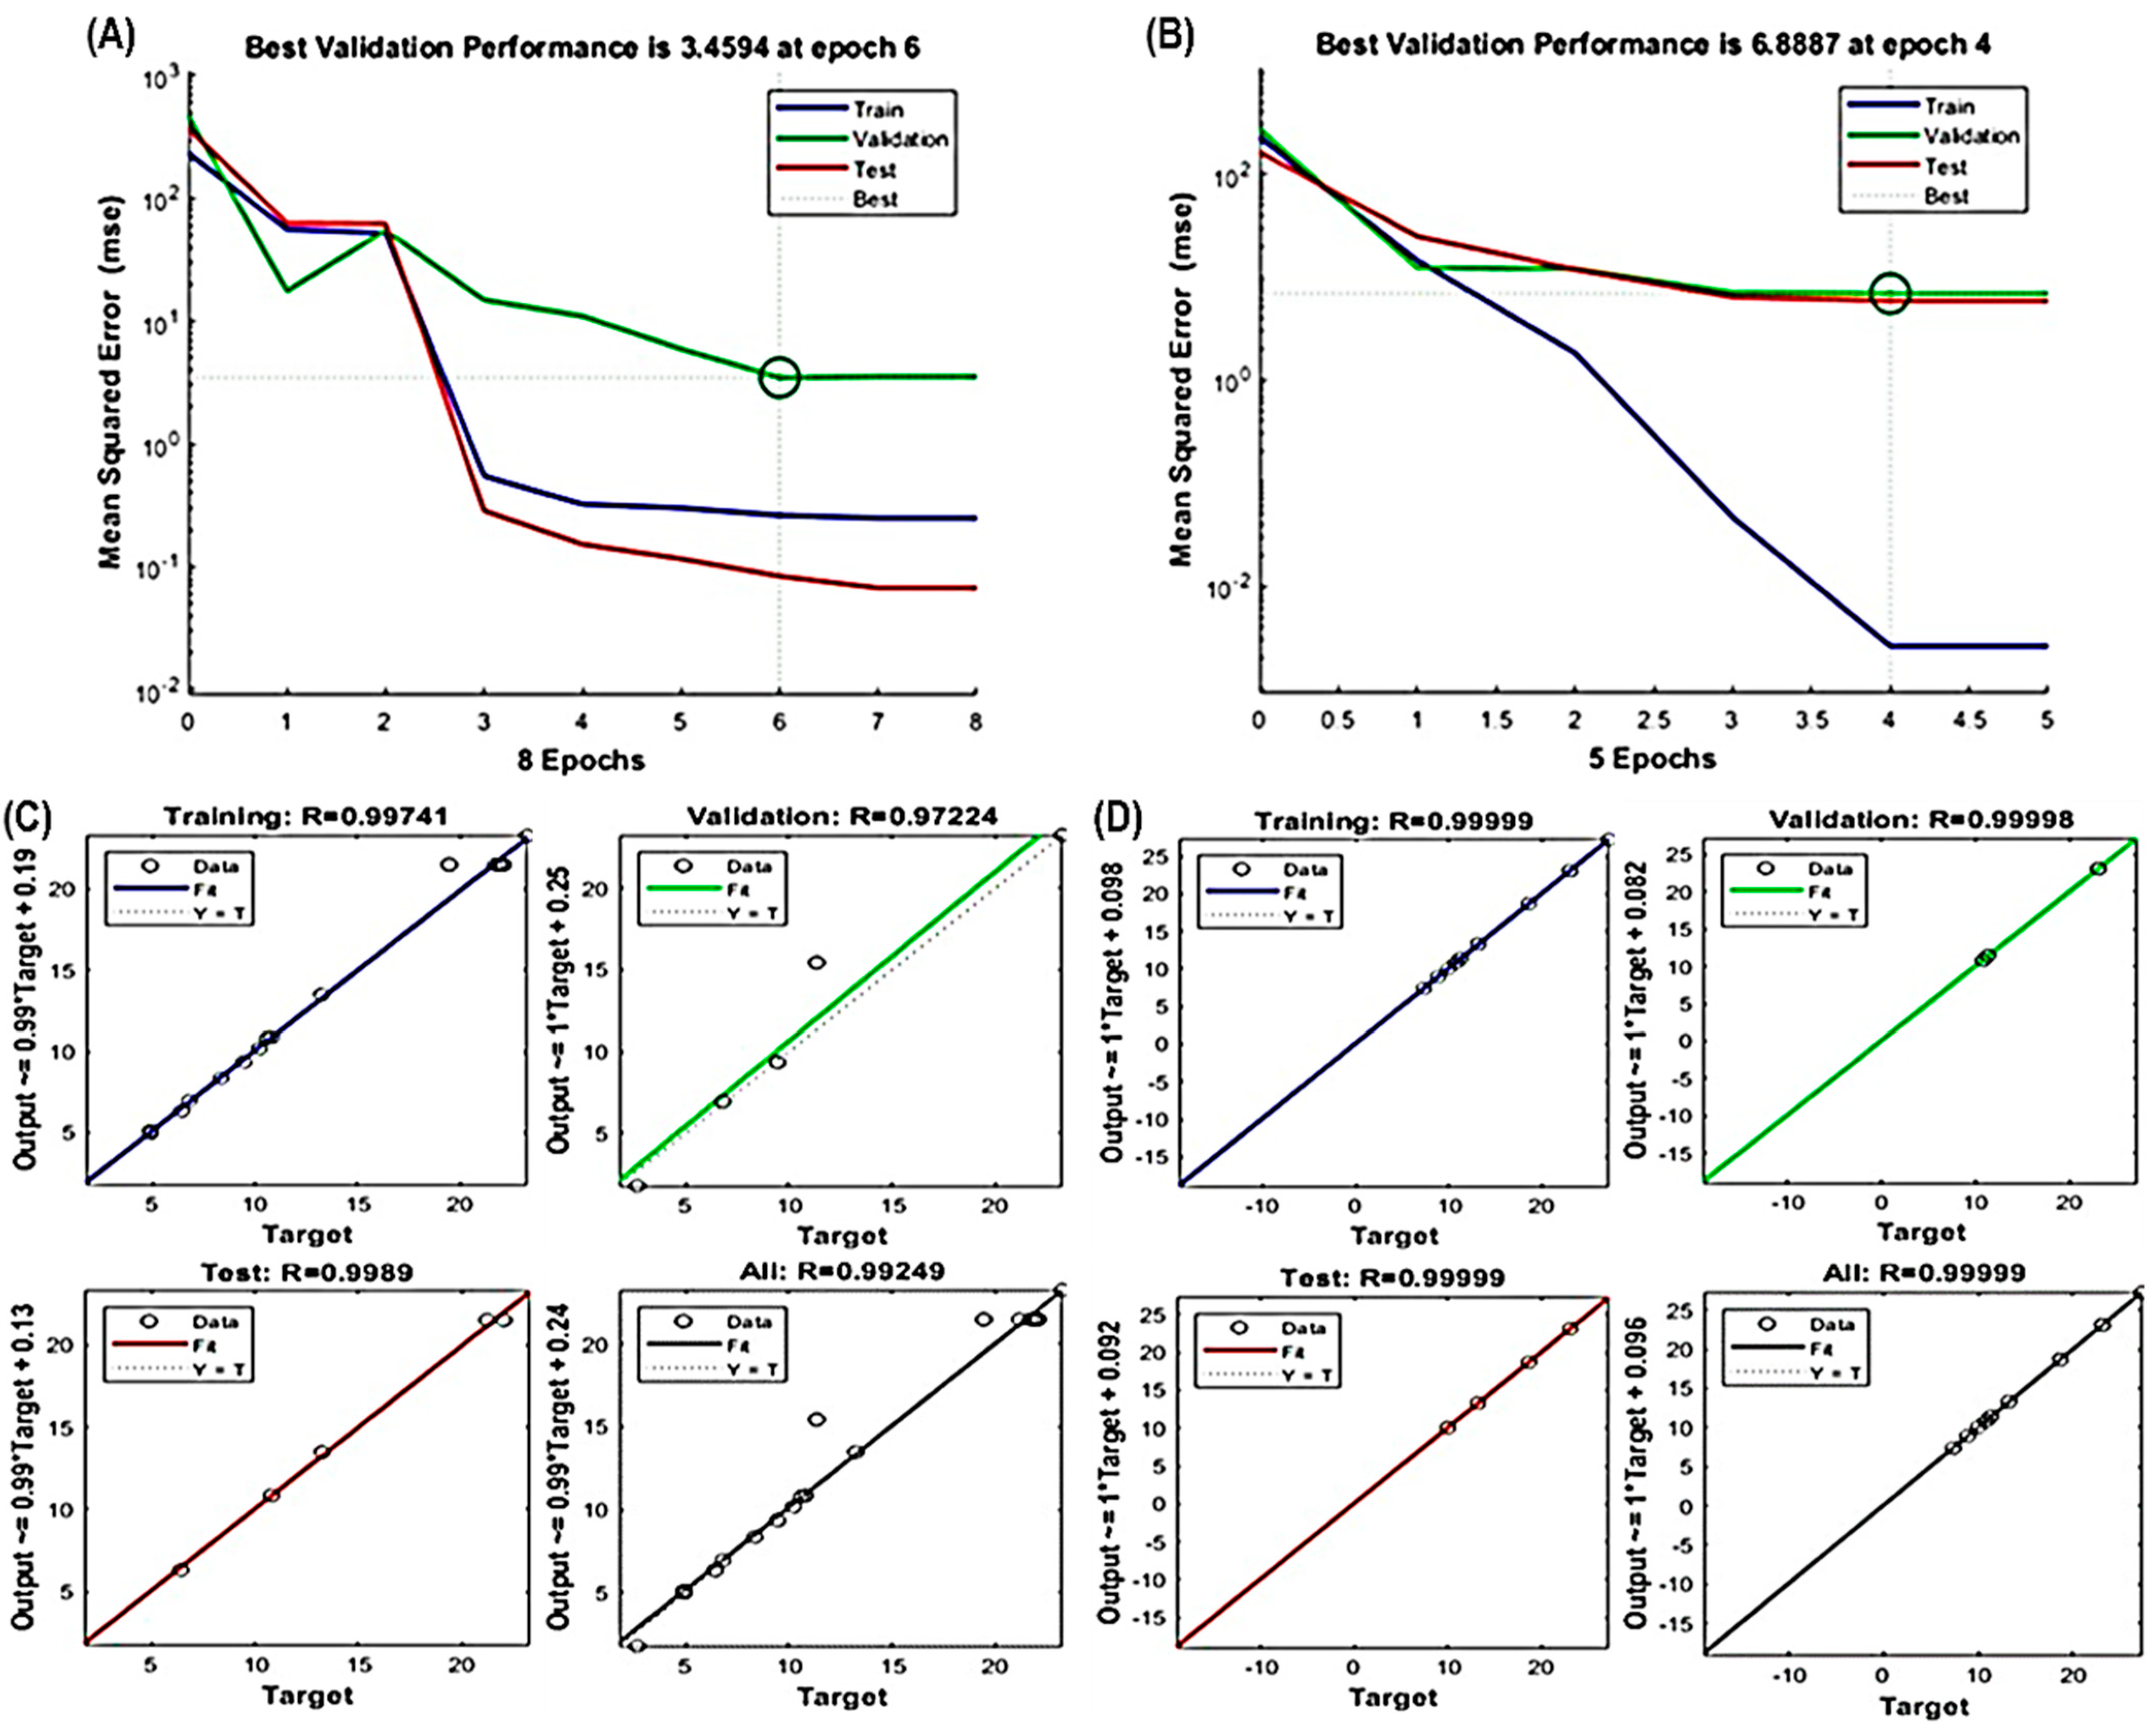
3.2. Fitting of the RSM and ANN Models

Table 1 presents the outcomes of 17 extraction scenarios, summarizing the experimental parameters and results. The yields of TPC and TFC in UMS extracts exhibited a range from 60.23 ± 0.79 to 76.65 ± 0.49 mgGAE/g and 37.62 ± 1.10 to 59.40 ± 0.89 mgCE/g, respectively. The peak TPC and TFC values were achieved at the central point of the design (X1: 60% EtOH; X2: 30 min; and X3: 50 °C). Both RSM and ANN predictions were closely aligned with experimental results, with minimal discrepancies. Quadratic polynomial equations (Equations (12) and (13)) were utilized to model the response variables (TPC and TFC, respectively), accounting for their variation concerning the extraction factors.
T P C   Y 1 = 75.77 + 1.21 X 1 0.9912 X 2 + 0.1438 X 3 8.12 X 1 2 5.59 X 2 2 5.73 X 3 2 0.6275 X 1 X 2 + 0.5975 X 1 X 3 + 0.5100 X 2 X 3
T F C   Y 2 = 57.42 + 1.44 X 1 + 0.6375 X 2 + 0.3691 X 3 10.86 X 1 2 6.81 X 2 2 6.83 X 3 2 0.1651 X 1 X 2 + 1.50 X 1 X 3 + 0.5177 X 2 X 3
As described in Table 2, ANOVA was utilized to evaluate the statistical significance of second-order quadratic model equations. Significance levels were determined by p-values, classifying terms as significant (p < 0.05), highly significant (p < 0.01) or exceptionally significant (p < 0.001). Conversely, terms with p-values above 0.05 were considered nonsignificant.
The statistical significance of the model equations, as determined by the F-test and p-values, underscores their reliability. The high F-values (for 107.80 TPC and 46.54 for TFC) with p-values less than 0.0001 confirm the models’ significance. Furthermore, lack of fit tests yielded non-significant p-values (for 0.1772 TPC and 0.3516 for TFC), affirming the appropriateness of the second-order polynomial models for predicting total polyphenolic extraction yields [1]. The determination coefficient (R2) demonstrates the model’s adequacy, with values of 0.9928 for TPC and 0.9836 for TFC, indicating that over 99% of the variation in total polyphenolic yield can be explained by the model. High adjusted (R2 adj: 0.9836 and 0.9624 for TPC and TFC, respectively) and predicted determination coefficients (R2 pred: 0.9192 and 0.8503 for TPC and TFC, respectively) further confirm the correlation between the observed and predicted data. Furthermore, low coefficient of variation (C.V.) values (1.21 for TPC and 3.40 for TFC) and high Adeq. precision values (25.0494 for TPC and 16.9654 for TFC) suggest a high degree of precision and reliability in the experimental data.
In addition, to visualize interactions between independent variables, 3D surfaces and contour plots were generated using multiple linear regression equations. These graphical representations (Figure 2A,B) help elucidate the main and cross-product effects of independent variables on the response variables, enhancing the understanding of the underlying processes. This comprehensive statistical analysis supports the robustness and validity of the model for predicting total polyphenolic extraction yields. The three-dimensional response surface analysis in RSM examined the relationship between TPC, TFC and extraction parameters. Contour plot shapes conveyed the significance of mutual interactions. Elliptical contours implied negligible interactions, while circular contours indicated significant interactions [22,25]. In Figure 2A,B, all response surfaces were convex, affirming the appropriate selection of variable ranges for ultrasonic time, temperature and ethanol concentration, highlighting their collective impact on TPC and TFC extraction yields.
There is a growing body of evidence supporting the superiority and sophistication of artificial neural network (ANN) modeling over RSM, making ANNs a promising alternative for intricate nonlinear multivariate modeling in various fields, particularly in biological processes. ANNs are inspired by the human CNS and its intricate network of interconnected neurons, enabling complex computations in response to input data [32,33]. In this study, experimental data were subjected to ANN modeling for validation. The predicted values from the ANN model closely matched the observed values (Table 1), affirming the model’s appropriateness.
The ANN model effectively captured the nonlinear relationships between extraction parameters (X1, X2 and X3) and response variables (Y1 and Y2), as evidenced in Figure 3A–D. Like RSM, the fitness and significance of the ANN model relied on various parameters, including R2 values for training, validation, testing, overall error reduction and the number of epochs to prevent overfitting or underfitting. Notably, the best validation performance for TPC occurred at epoch 6, and for TFC at epoch 4 (Figure 3A,B). Furthermore, high R2 values exceeding 0.97224 for TPC and 0.99998 for TFC (Figure 3C,D) underscore the model’s precision and its potential to accurately represent the complex relationships between the variables.

3.3. Comparison of the Prediction Abilities of the RSM and ANN Models

The comparative evaluation of RSM and ANN models for predicting TPC and TFC in UMS revealed the superior performance of the ANN model (Table 3). With higher R2 values (0.9963 for TPC and 0.9912 for TFC) than RSM (0.9928 for TPC and 0.9836 for TFC), the ANN model exhibited an enhanced predictive capability. Lower AAD and RMSE values indicated a better fit. The ANN model also exhibited lower SEP values (0.0171 for TPC and 0.0326 for TFC), further emphasizing its accuracy. The ANN model’s flexibility in approximating nonlinear systems surpassed the RSM model, being constrained to second-order polynomial regression. Additionally, the ANN model’s efficiency in handling multiple responses in a single run outperformed the RSM model, often requiring multiple runs for multi-response optimization. Dadgar et al. emphasized the ANN model’s superiority in accuracy, precision and fitting experimental data to target responses, establishing it as a more effective tool in this context [34].

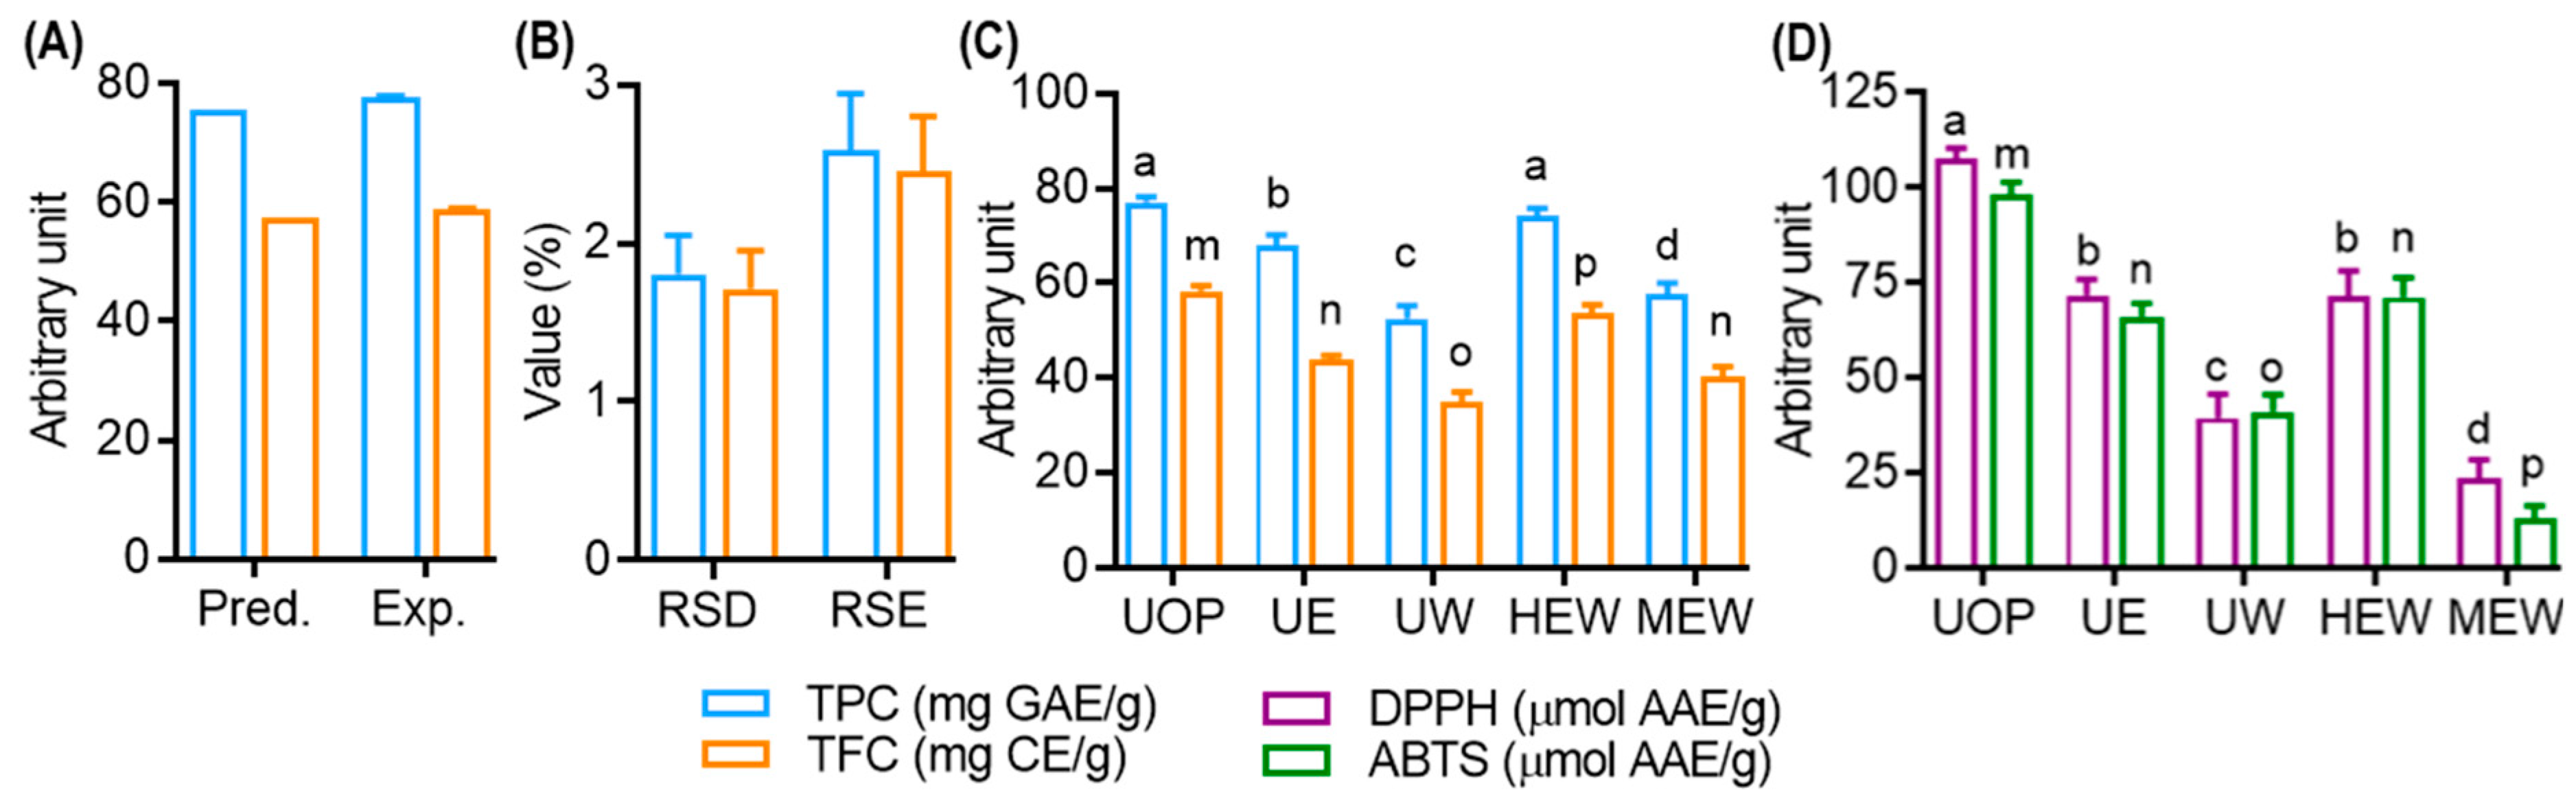
3.4. Model Validation and Comparison with Other Extraction Methods

The simultaneous optimization of TPC and TFC in UMS extracts was achieved using Derringer’s desirability function [34]. The maximum overall desirability (D = 0.953) was attained under specific conditions: ethanol concentration (X1, 61.43 ≅ 61.00%), extraction time (X2: 29.60 ≅ 30.00 min) and extraction temperature (X3, 50.24 ≅ 50.00 °C). The contour plot as a function of ethanol concentration, extraction time and temperature at the optimum condition are presented in the Supplementary Materials, Figure S2A–C. As described in Figure 4A,B, the predictive model was validated with triplicate experiments, resulting in TPC and TFC values of 77.52 ± 1.55 mgGAE/g and 58.85 ± 1.12 mgCAE/g, respectively, with low RSD% (1.80 for TPC and 1.71 for TFC) and RSE% (2.59 for TPC and 2.45 for TFC).
A comparative study was performed to evaluate the efficiency of the optimized extract (UOP) obtained through UAE in comparison to traditional methods. As shown in Figure 4C, UOP exhibited significantly higher TFC values compared to other extracts. Remarkably, UOP showed no significant difference in TPC compared to HEW (head assisted extraction coupled with 75% EtOH), while surpassing other methods. Similarly, UOP demonstrated superior 2,2-diphenyl-1-picrylhydrazyl (DPPH) and ABTS radical scavenging activity compared to all other extracts, while UE and HEW displayed no significant difference in their scavenging capacities (Figure 4D). These findings underscore the remarkable efficiency of UAE, which not only improves polyphenol yield and antioxidant activity but also minimizes extraction time. This improved efficiency may be attributed to various factors affecting ultrasonic energy transmission, including gas diffusion, gas–liquid phase transitions and chemical reactions [29].

3.5. Identification of Secondary Metabolites in UMS by High-Resolution Mass Spectroscopy

In the optimized UMS extracts, secondary metabolites were analyzed using ESI–MS/MS in the negative ionization mode. A total of 104 compounds were successfully identified, relying on the precursor ion mass, characteristic fragmentation patterns and comparisons with the reference standards, literature and online databases (Table 4). The significance of these findings was assessed based on confidence levels: Level 1 for compounds confirmed with reference standards, Level 2 for probable identifications supported by MSn data from the literature, and Level 3 for tentative candidates [35].
In Table 4, compounds 113 were identified as phenolic compounds in UMS based on mass fragmentation patterns. Notably, the phenolic acids in UMS were often in glucosidic form or conjugated with quinic and shikimic acid. While compounds 112 had been reported in various date cultivars in previous studies [1,17,22,24], compound 13, with a monoisotopic mass [M–H] of m/z 747.1895 and the molecular formula C38H36O16, was newly identified as 3-O-feruloyl-7-O-acyl-feruloyl-4-O-caffeoyl-quinic acid in the Ajwa date.
Flavonoids are a diverse group of polyphenolic compounds found in plants, categorized into seven subclasses based on their structural variations: flavonols, flavones, isoflavones, anthocyanidins, flavanones, flavanols and chalcones [36]. Among the flavonoids identified, flavone aglycones, including apigenin (14), luteolin (15), chrysoeriol (17) and methoxysinensetin (21), were identified along with their glycosides (compounds 25, 34, 46, 47 and 54) and sulfate conjugates as luteolin hexosyl sulfate (41) and chrysoeriol hexosyl sulfate (42) [17,20,22,24]. Quercetin (18), a major flavonol aglycone, was found alongside numerous flavonol glycosides (29, 30, 35, 38, 40, 43, 48, 49, 52 and 55–57), which were prevalent across various date variants [20,22,24]. Furthermore, UMS unveiled novel flavonol glycoside conjugates with hydroxycinnamic acids, specifically kaempferol 3-(3″,6″-di-p-coumaroylgalactoside) (51), quercetin 3-(6′′′′-p-coumaryl sophorotrioside) (58) and quercetin 3-(6″-caffeoyl sophorotrioside) (59), as determined through MSn data and previous studies [37,38]. Moreover, UMS contained flavonoid diversity, with compounds 23 and 26 identified as naringenin glycosides (flavanones) and compounds 28, 33 and 39 characterized as biochanin A glycoside, afrormosin glycoside and luteone glycoside (isoflavones). Compounds 16, 22, 27, 31, 32 and 36 were confirmed to be flavanols, mainly catechin/epicatechin and their glycosidic and gallate conjugates [24]. Interestingly, epigallocatechin (20) and epigallocatechin caffeate (37) were discovered for the first time in UMS. This study also revealed the presence of proanthocyanidins in UMS, including procyanidin A2 (44), procyanidin B2 (45), procyanidin B2-gallate (50) and epicatechin-(4beta->8)-epigallocatechin 3′-gallate (53), marking the first-time identification of these proanthocyanidins in UMS.
Terpenes, characterized by their five-carbon isoprene units, represent a significant category of secondary metabolites. Terpenoids, on the other hand, are derivatives of terpenes, displaying a variety of functional groups and methyl group rearrangements. Terpenoids are categorized into monoterpenes, sesquiterpenes, diterpenes, sesterpenes and triterpenes based on their carbon unit composition. Mass spectrometry of terpenoids unveils distinct ions resulting from the loss of neutral molecules, such as CH3 (15 Da) H2O (18 Da), CO (28 Da), COO (44 Da) and CH3COOH (60 Da). Furthermore, pseudo-molecular ions undergo retro-Diels–Alder (RDA) fragmentation reactions. Terpenoid glycosides can also generate terpenoid aglycones by shedding sugar units [39,40,41,42]. Comparing fragmentation patterns to the prior literature, sesquiterpenoids (compounds 6065, 68 and 72) and their lactone derivatives, including absindiol (66) and cymaroside A (75), were identified. Compound 74, with a deprotonated ion [M–H] at m/z 427.1974 and molecular formula C21H32O9, was recognized as the sesquiterpene glycoside cichorioside M. Additionally, two monoterpenoids (67 and 71), two diterpenoids (69 and 70) and two triterpenoids (73 and 76) were characterized in the study [40,42,43,44]. Notably, the study marks the first-ever report of the presence of terpenoids in UMS.
Compounds 7779 have been unequivocally identified as lignan glycosides. Notably, compound 77, 1,2-di-(syringoyl)-hexoside, had been previously discovered in Ajwa date pulp [22]. Compounds 78 and 79, newly discovered in UMS, exhibited deprotonated ions [M–H] at m/z 567.2084 and 581.2236, respectively and generated base peaks at m/z 405.15 and 419.17 by losing the glycosyl moiety (162 Da), confirming their identities as citrusin B (78) and lyoniresinol glucoside (79) [45,46].
Mass spectrometric analysis and data from the literature and online databases aided in the identification of compounds 80–86 as carboxylic acids and compounds 87–100 as fatty acids (Table 4). These findings are consistent with previous research [20,26,27,28,47,48,49]. Compounds 102 and 103, identified as N-acetyl-α-neuraminic acid and 1-deoxynojirimycin hexoside, were previously reported in Ajwa date pulp [24]. In contrast, compounds 101 and 104, dihydrojasmonic acid and icariside D1, were newly found in UMS, characterized by their deprotonated ions [M–H] at m/z 211.1335 and 415.1609, respectively, which was supported by their mass fragmentation behavior documented in earlier studies [50].

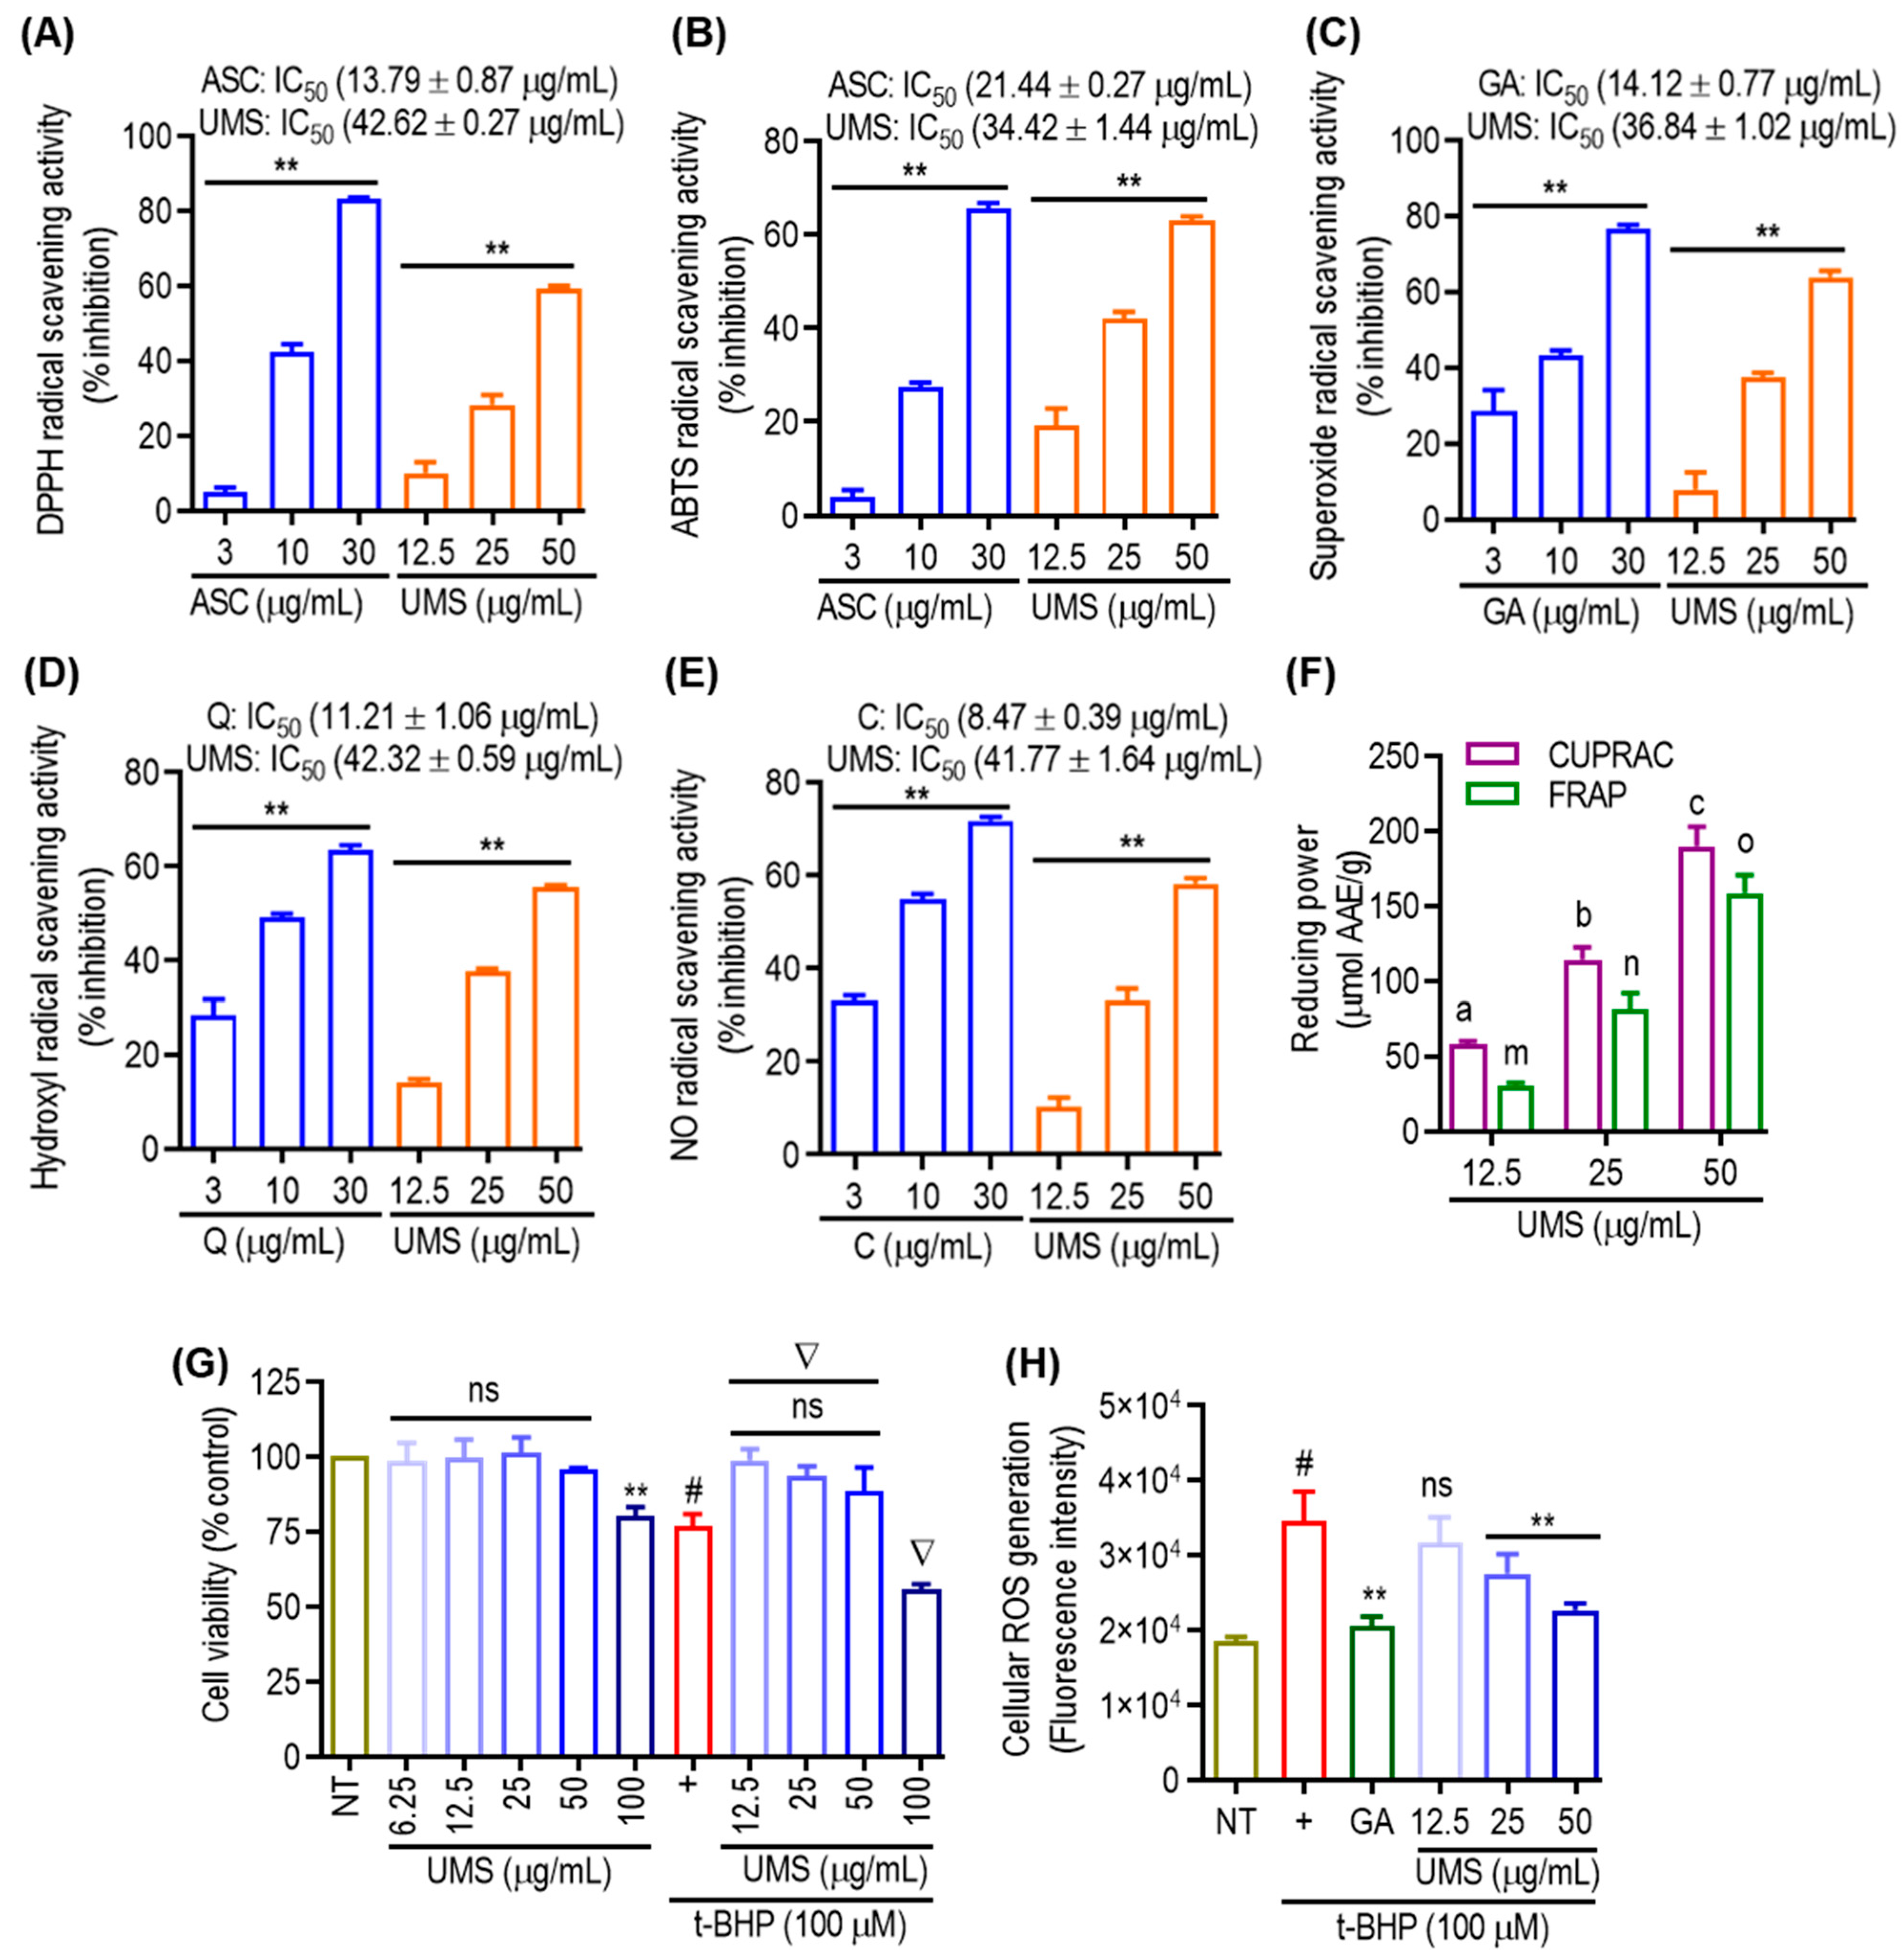
3.6. Antioxidant Effect of UMS

The assessment of antioxidant activities in phytochemicals necessitates a comprehensive understanding of various molecular mechanisms. In this investigation, multiple methodologies were employed to evaluate the antioxidant potential of UMS. The DPPH, ABTS, superoxide, hydroxyl and NO radical scavenging assays, as well as CUPRAC and FRAP assays, were utilized. As depicted in Figure 5A,B, UMS demonstrated a dose-dependent and significant DPPH and ABTS radical scavenging potential, exhibiting IC50 values of 42.62 ± 0.27 μg/mL and 34.42 ± 1.44 μg/mL, respectively. In comparison, the positive control, ascorbic acid, exhibited an IC50 value of 13.79 ± 0.87 μg/mL and 21.44 ± 0.27 μg/mL in the DPPH and ABTS assays, respectively, indicating that UMS not only engage in hydrogen atom transfer but also operates through a single electron transfer mechanism. The evaluation of superoxide and hydroxyl radical scavenging abilities employed the PMS–NADH superoxide-generating system and Fenton reaction, respectively [8]. Figure 5C,D illustrate UMS’s robust potential to scavenge superoxide and hydroxyl radicals, with IC50 values of 36.84 ± 1.02 μg/mL and 42.32 ± 0.59 μg/mL, respectively. In contrast, the positive controls, gallic acid and quercetin, had IC50 values of 14.12 ± 0.77 μg/mL and 11.21 ± 1.06 μg/mL for superoxide and hydroxyl radical scavenging, respectively. These results suggest that UMS employ a single electron transfer mechanism for its antioxidant activity. Moreover, UMS exhibited dose-dependent NO radical scavenging activity with an IC50 value of 41.77 ± 1.64 μg/mL, while the positive control catechin had an IC50 value of 8.47 ± 0.39 μg/mL (Figure 5E). Furthermore, CUPRAC and FRAP assays were performed, revealing UMS’s notable reduction capability with values of 189.42 ± 12.98 and 158.32 ± 12.05 μmol AAE/g at 50 μg/mL, respectively (Figure 5F).
Furthermore, t-BHP, a well-known short-chain lipid peroxide analogue that is frequently used to produce oxidative stress in cells, was employed to examine cellular responses to oxidative stress in both cellular and tissue settings in order to evaluate the potential of UMS in attenuating cellular oxidative stress. The induction of oxidative stress by t-BHP resulted in notable cell death. However, pretreatment with UMS and gallic acid effectively mitigated cellular toxicity at non-toxic concentrations (Figure 5G). Additionally, as depicted in Figure 5H, UMS demonstrated a dose-dependent reduction in the generation of cellular ROSs, further highlighting its antioxidative properties.
This study corroborates existing evidence indicating that date seed extracts, particularly from Ajwa seeds, exhibit high radical scavenging activity in various cell-free antioxidant methods. Ajwa seeds surpass date flesh in antioxidant properties, positioning them as a promising natural source of antioxidants. The attributed effectiveness of Ajwa seeds in addressing various conditions is likely linked to polyphenolic compounds functioning as reducing agents, free radical scavengers and hydrogen donors. The antioxidant properties and polyphenolic composition of date seeds are influenced by factors such as genetic diversity, soil conditions, maturity stages, storage conditions and extraction methods. Furthermore, UMS, containing cinnamic acid, benzoic acid hydroxylated derivatives and various flavonoids, is implicated in its antioxidant properties, offering protection against oxidative-stress-induced diseases such as inflammation, hyperlipidemia and diabetes.

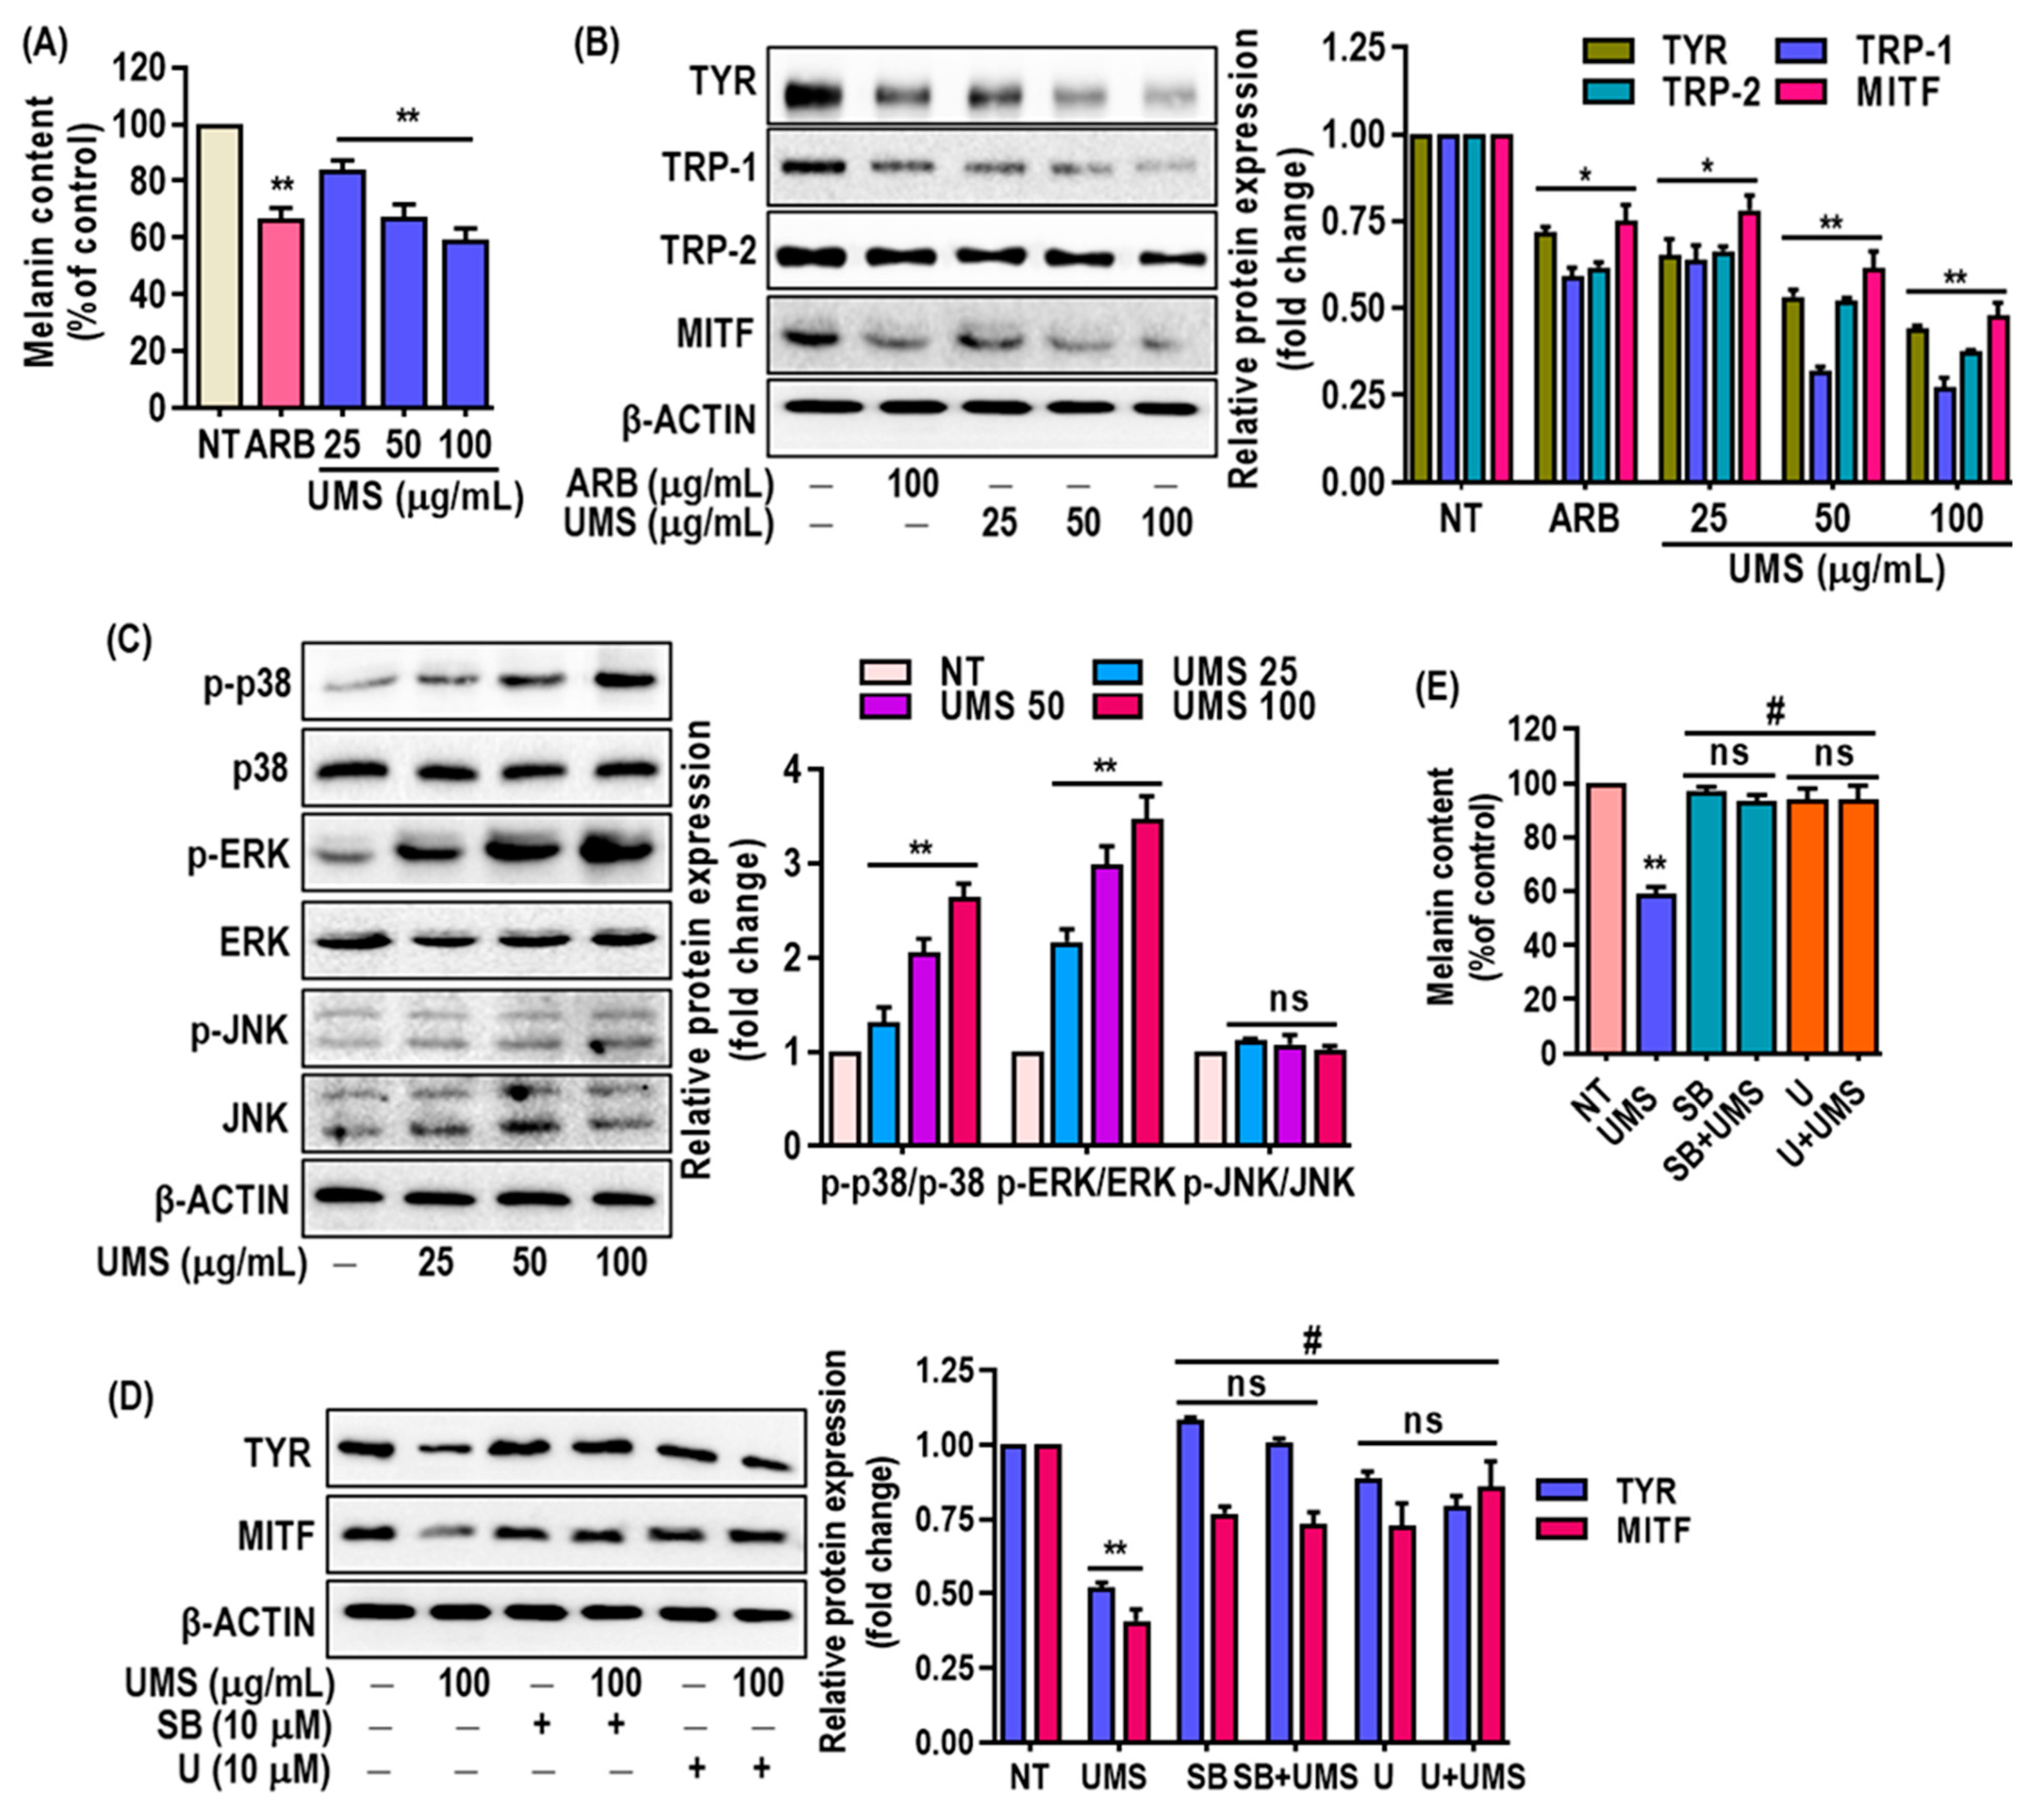
3.7. Depigmenting Effect of UMS on Hyperpigmented Melanocyte (MNT-1) Cells

Melanogenesis, the process of melanin production, plays a crucial role in skin pigmentation and can be implicated in various skin conditions [12]. Mushroom tyrosinase is a well-established enzyme used to test compounds that inhibit melanogenesis [51] and the results indicated that UMS significantly suppressed mushroom tyrosinase activity in a concentration-dependent manner, with a lower IC50 value (48.60 ± 1.02 μg/mL) compared to the positive control, arbutin (IC50 = 131.03 ± 2.01 μg/mL) (Figure S4).
Furthermore, the study examined the impact of UMS extract on melanin levels in MNT-1 cells and revealed a dose-dependent reduction (Figure 6A) without causing cytotoxicity (Figure S5). This reduction in melanin content was associated with the downregulation of key melanogenesis-related proteins, including Tyr, Trp-1, -2 and MITF, as confirmed through western blot analysis (Figure 6B). The inhibition of MITF expression is particularly significant, as MITF is a master regulator of melanogenesis. The presence of flavonoids and procyanidins in the UMS extract aligns with the observed depigmenting effects. Flavonoids (luteolin, taxifolin, quercetin catechin, epigallocatehin, procyanidinA2 and B2) have been previously linked to anti-melanogenic activity in the cosmetic industry [52,53], and the mass spectrometric analysis confirmed the abundance of these compounds in the UMS extract. Moreover, the study delved into the underlying mechanisms of UMS’s depigmenting effects. The study demonstrated that the UMS extract stimulated the p38 and ERK signaling pathways in MNT-1 cells, which play roles in regulating melanogenesis. In contrast, UMS fail to trigger JNK activation in MNT-1 cells (Figure 6C). Moreover, in order to confirm the involvement of the p38 and ERK signaling pathways in mediating UMS’s depigmenting effects, specific inhibitors for p38 and ERK were administered either alone or in combination with UMS. The findings indicated that inhibiting p38 and ERK selectively successfully reversed the depigmenting effects of UMS. This association linked the activation of these pathways to the reduction of MITF expression and the inhibition of Tyr expression (Figure 6D,E). This supports earlier research that demonstrated that polyphenolic-rich plant extracts achieve depigmentation through similar MAPKs’ signaling-mediated MITF downregulation [11,54].

4. Conclusions

This pioneering study investigated the optimization of UAE conditions for extracting bioactive compounds from unmature Ajwa date seeds using both RSM and ANN modeling. High-resolution mass spectrometry analysis identified phenolic acids, flavonoids, lignans and fatty acids in the extract. The ANN model outperformed the RSM model, exhibiting higher accuracy and reliability, with the optimal conditions determined to be 61% ethanol, 29 min of extraction time and an extraction temperature of 50 °C, while the extract/solvent ratio was fixed to 1:10 (g/mL). Under these conditions, the extract yielded maximum TPC of 77.52 ± 1.55 mg GAE/g and TFC of 58.85 ± 1.12 mg CE/g. Furthermore, UMS showed a potent antioxidant activity in various cell-free antioxidant assays and the mitigation of t-BHP induced cellular ROS generation. The date industry generates thousands of discarded byproducts, such as date pomace and seeds, that are rich with bioactive compounds. New aspects of using these byproducts to produce high-nutritional-value food products have recently attracted interest. Additionally, this study highlighted the extract’s potential as an anti-melanogenic agent, showing its ability to inhibit mushroom tyrosinase, reduce melanin levels and modulate melanogenesis-related proteins. The activation of p38 and ERK signaling pathways further supports its potential for pigmentation-related skin care products. This research underscores the significance of Ajwa date seeds as a source of bioactive compounds and encourages its further exploration in dermatology and cosmetics, including isolating bioactive markers and in vivo testing for therapeutic applications.

Supplementary Materials

The following supporting information can be downloaded at: https://www.mdpi.com/article/10.3390/antiox13020238/s1, Figure S1: The ANN models architecture; Figure S2: The contour plot as a function of ethanol concentration, extraction time and temperature at optimum condition; Figure S3: Mushroom tyrosinase inhibition activity of UMS optimized extract; Figure S4: Effect of UMS optimized extract on MNT-1 cell viability; Table S1: List of antibodies used in this study; Table S2: Independent process variables with experimental ranges and levels for ultrasound assistant extraction of UMS [47].

Author Contributions

F.A.: methodology, formal analysis, investigation, writing—original draft. M.N.: investigation, formal analysis. M.B.A.: conceptualization, investigation, formal analysis, writing—review and editing. S.K.: conceptualization, supervision, writing—review and editing. S.-H.L.: conceptualization, supervision, funding acquisition, writing—review and editing. All authors have read and agreed to the published version of the manuscript.

Funding

This study was supported by the National Research Foundation of Korea (NRF), funded by the Ministry of Science and ICT (2020R1A2C2011495, 2021R1IA1A01058062 and RS-2023-00278670).

Institutional Review Board Statement

Not applicable.

Informed Consent Statement

Not applicable.

Data Availability Statement

Data will be available upon request.

Acknowledgments

We thank all the laboratory members for their help during the experiments. Fanar Alshammari received the financial support for his Ph.D. studying a project from the Education Ministry of the Kingdom of Saudi Arabia (EMSA).

Conflicts of Interest

The authors declare that they have no known competing financial interests or personal relationships that could have appeared to influence the work reported in this paper.

References

  1. Sedraoui, S.; Badr, A.; Barba, M.G.M.; Doyen, A.; Tabka, Z.; Desjardins, Y. Optimization of the Ultrahigh-Pressure–Assisted Extraction of Phenolic Compounds and Antioxidant Activity from Palm Dates (Phoenix dactylifera L.). Food Anal. Methods 2020, 13, 1556–1569. [Google Scholar] [CrossRef]
  2. Galanakis, C.M. Emerging technologies for the production of nutraceuticals from agricultural by-products: A viewpoint of opportunities and challenges. Food Bioprod. Process. 2013, 91, 575–579. [Google Scholar] [CrossRef]
  3. Chen, M.; Zhao, Y.; Yu, S. Optimisation of ultrasonic-assisted extraction of phenolic compounds, antioxidants, and anthocyanins from sugar beet molasses. Food Chem. 2015, 172, 543–550. [Google Scholar] [CrossRef]
  4. Koraqi, H.; Petkoska, A.T.; Khalid, W.; Sehrish, A.; Ambreen, S.; Lorenzo, J.M. Optimization of the Extraction Conditions of Antioxidant Phenolic Compounds from Strawberry Fruits (Fragaria x ananassa Duch.) Using Response Surface Methodology. Food Anal. Methods 2023, 16, 1030–1042. [Google Scholar] [CrossRef] [PubMed]
  5. Bezerra, M.A.; Santelli, R.E.; Oliveira, E.P.; Villar, L.S.; Escaleira, L.A. Response surface methodology (RSM) as a tool for optimization in analytical chemistry. Talanta 2008, 76, 965–977. [Google Scholar] [CrossRef]
  6. Desai, K.M.; Survase, S.A.; Saudagar, P.S.; Lele, S.S.; Singhal, R.S. Comparison of artificial neural network (ANN) and response surface methodology (RSM) in fermentation media optimization: Case study of fermentative production of scleroglucan. Biochem. Eng. J. 2008, 41, 266–273. [Google Scholar] [CrossRef]
  7. Zobel, C.W.; Cook, D.F. Evaluation of neural network variable influence measures for process control. Eng. Appl. Artif. Intell. 2011, 24, 803–812. [Google Scholar] [CrossRef]
  8. Alam, M.B.; Ju, M.-K.; Lee, S.-H. DNA Protecting Activities of Nymphaea nouchali (Burm. f) Flower Extract Attenuate t-BHP-Induced Oxidative Stress Cell Death through Nrf2-Mediated Induction of Heme Oxygenase-1 Expression by Activating MAP-Kinases. Int. J. Mol. Sci. 2017, 18, 2069. [Google Scholar] [CrossRef]
  9. Alam, M.B.; Naznin, M.; Islam, S.; Alshammari, F.H.; Choi, H.J.; Song, B.R.; Kim, S.; Lee, S.H. High Resolution Mass Spec-troscopy-Based Secondary Metabolite Profiling of Nymphaea nouchali (Burm. f) Stem Attenuates Oxidative Stress via Regula-tion of MAPK/Nrf2/HO-1/ROS Pathway. Antioxidants 2021, 10, 719. [Google Scholar] [CrossRef]
  10. D’Mello, S.A.; Finlay, G.J.; Baguley, B.C.; Askarian-Amiri, M.E. Signaling Pathways in Melanogenesis. Int. J. Mol. Sci. 2016, 17, 1144. [Google Scholar] [CrossRef]
  11. Alam, M.B.; Ahmed, A.; Motin, M.A.; Kim, S.; Lee, S.-H. Attenuation of melanogenesis by Nymphaea nouchali (Burm. f) flower extract through the regulation of cAMP/CREB/MAPKs/MITF and proteasomal degradation of tyrosinase. Sci. Rep. 2018, 8, 13928. [Google Scholar] [CrossRef]
  12. Kondo, T.; Hearing, V.J. Update on the regulation of mammalian melanocyte function and skin pigmentation. Expert Rev. Dermatol. 2011, 6, 97–108. [Google Scholar] [CrossRef]
  13. Yasin, B.R.; El-Fawal, H.A.N.; Mousa, S.A. Date (Phoenix dactylifera) Polyphenolics and Other Bioactive Compounds: A Traditional Islamic Remedy’s Potential in Prevention of Cell Damage, Cancer Therapeutics and Beyond. Int. J. Mol. Sci. 2015, 16, 30075–30090. [Google Scholar] [CrossRef] [PubMed]
  14. Zhang, C.-R.; Aldosari, S.A.; Vidyasagar, P.S.P.V.; Shukla, P.; Nair, M.G. Health-benefits of date fruits produced in Saudi Arabia based on in vitro antioxidant, anti-inflammatory and human tumor cell proliferation inhibitory assays. J. Saudi Soc. Agric. Sci. 2017, 16, 287–293. [Google Scholar] [CrossRef]
  15. Samad, M.A.; Hashim, S.H.; Simarani, K.; Yaacob, J.S. Antibacterial Properties and Effects of Fruit Chilling and Extract Storage on Antioxidant Activity, Total Phenolic and Anthocyanin Content of Four Date Palm (Phoenix dactylifera) Cultivars. Molecules 2016, 21, 419. [Google Scholar] [CrossRef]
  16. Hasan, M.; Mohieldein, A. In Vivo Evaluation of Anti Diabetic, Hypolipidemic, Antioxidative Activities of Saudi Date Seed Extract on Streptozotocin Induced Diabetic Rats. J. Clin. Diagn. Res. JCDR 2016, 10, Ff06–Ff12. [Google Scholar] [CrossRef]
  17. Al-Yahya, M.; Raish, M.; AlSaid, M.S.; Ahmad, A.; Mothana, R.A.; Al-Sohaibani, M.; Al-Dosari, M.S.; Parvez, M.K.; Rafatullah, S. ‘Ajwa’ dates (Phoenix dactylifera L.) extract ameliorates isoproterenol-induced cardiomyopathy through downregulation of oxidative, inflammatory and apoptotic molecules in rodent model. Phytomedicine 2016, 23, 1240–1248. [Google Scholar] [CrossRef]
  18. Sheikh, B.Y.; Elsaed, W.M.; Samman, A.H.; Sheikh, B.Y.; Ladin, A. Ajwa dates as a protective agent against liver toxicity in rat. Eur. Sci. J. 2014, 10, 358–368. [Google Scholar]
  19. Khalid, S.; Khalid, N.; Khan, R.S.; Ahmed, H.; Ahmad, A. A review on chemistry and pharmacology of Ajwa date fruit and pit. Trends Food Sci. Technol. 2017, 63, 60–69. [Google Scholar] [CrossRef]
  20. Nematallah, K.A.; Ayoub, N.A.; Abdelsattar, E.; Meselhy, M.R.; Elmazar, M.M.; El-Khatib, A.H.; Linscheid, M.W.; Hathout, R.M.; Godugu, K.; Adel, A.; et al. Polyphenols LC-MS2 profile of Ajwa date fruit (Phoenix dactylifera L.) and their microemulsion: Potential impact on hepatic fibrosis. J. Funct. Foods 2018, 49, 401–411. [Google Scholar] [CrossRef]
  21. Ben-Youssef, S.; Fakhfakh, J.; Breil, C.; Abert-Vian, M.; Chemat, F.; Allouche, N. Green extraction procedures of lipids from Tunisian date palm seeds. Ind. Crops Prod. 2017, 108, 520–525. [Google Scholar] [CrossRef]
  22. Alshammari, F.; Alam, M.B.; Song, B.R.; Lee, S.H. Antioxidant, Tyrosinase, α-Glucosidase, and Elastase Enzyme Inhibition Activities of Optimized Unripe Ajwa Date Pulp (Phoenix dactylifera) Extracts by Response Surface Methodology. Int. J. Mol. Sci. 2023, 24, 3396. [Google Scholar] [CrossRef]
  23. Valipour, M.; Banihabib, M.E.; Behbahani, S.M.R. Comparison of the ARMA, ARIMA, and the autoregressive artificial neural network models in forecasting the monthly inflow of Dez dam reservoir. J. Hydrol. 2013, 476, 433–441. [Google Scholar] [CrossRef]
  24. Alshammari, F.; Alam, M.B.; Naznin, M.; Javed, A.; Kim, S.; Lee, S.-H. Profiling of Secondary Metabolites of Optimized Ripe Ajwa Date Pulp (Phoenix dactylifera L.) Using Response Surface Methodology and Artificial Neural Network. Pharmaceuticals 2023, 16, 319. [Google Scholar] [CrossRef]
  25. Zakaria, F.; Tan, J.-K.; Mohd Faudzi, S.M.; Abdul Rahman, M.B.; Ashari, S.E. Ultrasound-assisted extraction conditions optimisation using response surface methodology from Mitragyna speciosa (Korth.) Havil leaves. Ultrason. Sonochemistry 2021, 81, 105851. [Google Scholar] [CrossRef]
  26. Naveja, J.J.; Rico-Hidalgo, M.P.; Medina-Franco, J.L. Analysis of a large food chemical database: Chemical space, diversity, and complexity. F1000Research 2018, 77, 993. [Google Scholar] [CrossRef]
  27. Guijas, C.; Montenegro-Burke, J.R.; Domingo-Almenara, X.; Palermo, A.; Warth, B.; Hermann, G.; Koellensperger, G.; Huan, T.; Uritboonthai, W.; Aisporna, A.E.; et al. METLIN: A Technology Platform for Identifying Knowns and Unknowns. Anal. Chem. 2018, 90, 3156–3164. [Google Scholar] [CrossRef] [PubMed]
  28. Wang, F.; Liigand, J.; Tian, S.; Arndt, D.; Greiner, R.; Wishart, D.S. CFM-ID 4.0: More Accurate ESI-MS/MS Spectral Prediction and Compound Identification. Anal. Chem. 2021, 93, 11692–11700. [Google Scholar] [CrossRef]
  29. Ciric, A.; Krajnc, B.; Heath, D.; Ogrinc, N. Response surface methodology and artificial neural network approach for the optimization of ultrasound-assisted extraction of polyphenols from garlic. Food Chem. Toxicol. 2020, 135, 110976. [Google Scholar] [CrossRef] [PubMed]
  30. Xu, D.-P.; Zheng, J.; Zhou, Y.; Li, Y.; Li, S.; Li, H.-B. Ultrasound-assisted extraction of natural antioxidants from the flower of Limonium sinuatum: Optimization and comparison with conventional methods. Food Chem. 2017, 217, 552–559. [Google Scholar] [CrossRef]
  31. Nipornram, S.; Tochampa, W.; Rattanatraiwong, P.; Singanusong, R. Optimization of low power ultrasound-assisted extraction of phenolic compounds from mandarin (Citrus reticulata Blanco cv. Sainampueng) peel. Food Chem. 2018, 241, 338–345. [Google Scholar] [CrossRef] [PubMed]
  32. Huang, S.-M.; Kuo, C.-H.; Chen, C.-A.; Liu, Y.-C.; Shieh, C.-J. RSM and ANN modeling-based optimization approach for the development of ultrasound-assisted liposome encapsulation of piceid. Ultrason. Sonochemistry 2017, 36, 112–122. [Google Scholar] [CrossRef]
  33. Kuo, C.-H.; Liu, T.-A.; Chen, J.-H.; Chang, C.-M.J.; Shieh, C.-J. Response surface methodology and artificial neural network optimized synthesis of enzymatic 2-phenylethyl acetate in a solvent-free system. Biocatal. Agric. Biotechnol. 2014, 3, 1–6. [Google Scholar] [CrossRef]
  34. Derrien, M.; Badr, A.; Gosselin, A.; Desjardins, Y.; Angers, P. Optimization of a green process for the extraction of lutein and chlorophyll from spinach by-products using response surface methodology (RSM). LWT-Food Sci. Technol. 2017, 79, 170–177. [Google Scholar] [CrossRef]
  35. Schymanski, E.L.; Jeon, J.; Gulde, R.; Fenner, K.; Ruff, M.; Singer, H.P.; Hollender, J. Identifying Small Molecules via High Resolution Mass Spectrometry: Communicating Confidence. Environ. Sci. Technol. 2014, 48, 2097–2098. [Google Scholar] [CrossRef]
  36. Shen, N.; Wang, T.; Gan, Q.; Liu, S.; Wang, L.; Jin, B. Plant flavonoids: Classification, distribution, biosynthesis, and antioxidant activity. Food Chem. 2022, 383, 132531. [Google Scholar] [CrossRef]
  37. Liu, H.; Orjala, J.; Sticher, O.; Rali, T. Acylated Flavonol Glycosides from Leaves of Stenochlaena palustris. J. Nat. Prod. 1999, 62, 70–75. [Google Scholar] [CrossRef]
  38. Murakami, T.; Kohno, K.; Ninomiya, K.; Matsuda, H.; Yoshikawa, M. Medicinal foodstuffs. XXV. Hepatoprotective principle and structures of ionone glucoside, phenethyl glycoside, and flavonol oligoglycosides from young seedpods of garden peas, Pisum sativum L. Chem. Pharm. Bull. 2001, 49, 1003–1008. [Google Scholar] [CrossRef]
  39. Biswal, R.P.; Dandamudi, R.B.; Patnana, D.P.; Pandey, M.; Vutukuri, V. Metabolic fingerprinting of Ganoderma spp. using UHPLC-ESI-QTOF-MS and its chemometric analysis. Phytochemistry 2022, 199, 113169. [Google Scholar] [CrossRef] [PubMed]
  40. Wu, S.; Wu, Z.; Fu, C.; Wu, C.; Yuan, J.; Xian, X.; Gao, H. Simultaneous identification and analysis of cassane diterpenoids in Caesalpinia minax Hance by high-performance liquid chromatography with quadrupole time-of-flight mass spectrometry. J. Sep. Sci. 2015, 38, 4000–4013. [Google Scholar] [CrossRef] [PubMed]
  41. Tian, Q.; Schwartz, S.J. Mass spectrometry and tandem mass spectrometry of citrus limonoids. Anal. Chem. 2003, 75, 5451–5460. [Google Scholar] [CrossRef]
  42. Girardi, C.; Jullian, V.; Haddad, M.; Vansteelandt, M.; Cabanillas, B.J.; Kapanda, C.N.; Herent, M.F.; Quetin-Leclercq, J.; Fabre, N. Analysis and fragmentation mechanisms of hirsutinolide-type sesquiterpene lactones by ultra-high-performance liquid chromatography/electrospray ionization linear ion trap Orbitrap mass spectrometry. Rapid Commun. Mass Spectrom. RCM 2016, 30, 569–580. [Google Scholar] [CrossRef]
  43. Tugizimana, F.; Steenkamp, P.A.; Piater, L.A.; Dubery, I.A. Ergosterol-induced sesquiterpenoid synthesis in tobacco cells. Molecules 2012, 17, 1698–1715. [Google Scholar] [CrossRef]
  44. Aisa, H.A.; Xin, X.L.; Tang, D. Chemical constituents and their pharmacological activities of plants from Cichorium genus. Chin. Herb. Med. 2020, 12, 224–236. [Google Scholar] [CrossRef]
  45. Zhu, H.; Tu, P. A New Triterpenoid Saponin and Two Neolignans from Ligularia veitchiana. Z. Für Naturforschung B 2004, 59, 1063–1066. [Google Scholar] [CrossRef]
  46. Jia, X.; Yang, D.; Xie, H.; Jiang, Y.; Wei, X. Non-flavonoid phenolics from Averrhoa carambola fresh fruit. J. Funct. Foods 2017, 32, 419–425. [Google Scholar] [CrossRef]
  47. Alam, M.B.; Park, N.H.; Song, B.R.; Lee, S.H. Antioxidant Potential-Rich Betel Leaves (Piper betle L.) Exert Depigmenting Action by Triggering Autophagy and Downregulating MITF/Tyrosinase In Vitro and In Vivo. Antioxidants 2023, 12, 374. [Google Scholar] [CrossRef]
  48. Islam, S.; Alam, M.B.; Ahmed, A.; Lee, S.; Lee, S.-H.; Kim, S. Identification of secondary metabolites in Averrhoa carambola L. bark by high-resolution mass spectrometry and evaluation for α-glucosidase, tyrosinase, elastase, and antioxidant potential. Food Chem. 2020, 332, 127377. [Google Scholar] [CrossRef] [PubMed]
  49. Najm, O.A.; Addnan, F.H.; Mohd-Manzor, N.F.; Elkadi, M.A.; Abdullah, W.O.; Ismail, A.; Mansur, F.A.F. Identification of Phytochemicals of Phoenix dactylifera L. Cv Ajwa with UHPLC-ESI-QTOF-MS/MS. Int. J. Fruit Sci. 2021, 21, 848–867. [Google Scholar] [CrossRef]
  50. Hassanen, E.I.; Tohamy, A.F.; Issa, M.Y.; Ibrahim, M.A.; Farroh, K.Y.; Hassan, A.M. Pomegranate Juice Diminishes The Mitochondria-Dependent Cell Death And NF-kB Signaling Pathway Induced By Copper Oxide Nanoparticles On Liver And Kidneys Of Rats. Int. J. Nanomed. 2019, 14, 8905–8922. [Google Scholar] [CrossRef] [PubMed]
  51. Liu, W.Y.; Zou, C.M.; Hu, J.H.; Xu, Z.J.; Si, L.Q.; Liu, J.J.; Huang, J.G. Kinetic Characterization of Tyrosinase-catalyzed Oxidation of Four Polyphenols. Curr. Med. Sci. 2020, 40, 239–248. [Google Scholar] [CrossRef]
  52. Feng, D.; Fang, Z.; Zhang, P. The melanin inhibitory effect of plants and phytochemicals: A systematic review. Phytomedicine 2022, 107, 154449. [Google Scholar] [CrossRef] [PubMed]
  53. Chai, W.-M.; Huang, Q.; Lin, M.-Z.; Ou-Yang, C.; Huang, W.-Y.; Wang, Y.-X.; Xu, K.-L.; Feng, H.-L. Condensed Tannins from Longan Bark as Inhibitor of Tyrosinase: Structure, Activity, and Mechanism. J. Agric. Food Chem. 2018, 66, 908–917. [Google Scholar] [CrossRef] [PubMed]
  54. Monmai, C.; Kim, J.-S.; Chin, J.H.; Lee, S.; Baek, S.-H. Inhibitory Effects of Polyphenol- and Flavonoid-Enriched Rice Seed Extract on Melanogenesis in Melan-a Cells via MAPK Signaling-Mediated MITF Downregulation. Int. J. Mol. Sci. 2023, 24, 11841. [Google Scholar] [CrossRef] [PubMed]
Figure 1. Effect of (A) ethanol concentration; (B) extraction time; and (C) extraction temperature on UMS extraction on ethanol concentration, time and temperature single factor on the yield of TPC and TFC of UMS extract. Different letters represent statistical significance (p < 0.05) between each group. (a, b, c and d for TPC; x, y and z for TFC).
Antioxidants 13 00238 g001
Figure 2. The three-dimensional (3D) response surface plots of UMS extraction on ethanol concentration, time and temperature for TPC (A) and TFC (B).
Antioxidants 13 00238 g002
Figure 3. Evaluation of ANN model performance. Assessing the validation of the constructed ANN model for (A) TPC and (B) TFC. Illustration of the optimal multilayer perceptron (MLP) architecture used in training, testing and validating the regression analysis to minimize errors for ANN model development for (C) TPC and (D) TFC.
Antioxidants 13 00238 g003
Figure 4. Model validation and comparative study of TPC and TFC of various extraction methods. (A) TPC and TFC value of optimized condition. (B) Relative standard deviation (RSD) and relative standard error (RSE) value of optimized condition. (C) Effect of various extraction techniques on the yield of TPC and TFC of UMS extract. (D) Effect of various extraction techniques on the DPPH and ABTS radical scavenging effects of UMS extract. Different letters represent statistical significance (p < 0.05) between each group. (a, b, c and d for TPC; m, n, o, and p for TFC). U: ultrasonic assisted extraction; H: heat assisted extraction; M: maceration extract; OP: optimized condition; E: 100% EtOH; W: 100% aqueous; EW: 75% EtOH; AAE: ascorbic acid equivalent.
Antioxidants 13 00238 g004
Figure 5. Antioxidant effects of UMS. Cell-free (A) DPPH; (B) ABTS; (C) superoxide; (D) hydroxyl; and (E) NO radical scavenging activities of UMS. ** p < 0.01 vs. NT. (F) Reducing power activities of UMS in CUPRAC and FRAP assay. Different letters represent statistical significance (p < 0.05) between each group. (a, b and c for CUPRAC; m, n and o for FRAP). (G) Cell viability of UMS in RAW 264.7 cells. ** p < 0.05 vs. NT, # p < 0.01 vs. NT, ns: non-significant vs. NT, p < 0.01 vs. UVB alone. (H) Effect of UMS on t-BHP induced cellular ROS generation. # p < 0.001 vs. NT, ** p < 0.01 vs. UVB alone, ns: non-significant vs. UVB alone. ASC: ascorbic acid; GA: gallic acid; Q: quercetin and C: catechin. AAE: ascorbic acid equivalent.
Antioxidants 13 00238 g005
Figure 6. Effects of UMS on melanogenesis in MNT-1 cells. Cells were cultured with UMS (25–100 μg/mL) for 3 days. (A) Melanin content was determined. Western blot analysis of (B) melanogenesis factors such as Tyr, Trp-1, -2 and MITF, (C) MAPK proteins including p38, ERK and JNK. MNT-1 cells were co-treated with UMS and selective inhibitors of ERK (U0126) and p38 (SB239063). (D) MITF and Tyr levels were determined by western blot analysis, and (E) melanin content was also determined. * p < 0.05, ** p < 0.01 vs. NT, # p < 0.01 vs. UMS alone, ns: non-significant vs. NT, ARB: arbutin.
Antioxidants 13 00238 g006
Table 1. Box–Behnken design (BBD) for the independent variables and corresponding response value (experimental).
RunIndependent VariablesResponse
EC (%) (X1)Time (min) (X2)Temp (°C) (X3)TPC (mg GAE/g) (Y1)TFC (mg CE/g) (Y2)
RSM (prd.) ANN (prd.) Exp. RSM (prd.) ANN (prd.) Exp.
180155064.9965.5965.15 ± 1.1540.7141.6639.25 ± 1.05
280304062.3062.6061.56 ± 0.5239.2839.2540.25 ± 0.98
360456064.1364.8963.55 ± 1.1545.2944.5744.80 ± 0.56
460305075.7076.8875.26 ± 1.0157.4157.9558.32 ± 0.28
560305075.7776.8575.56 ± 0.8957.4157.2057.01 ± 1.15
660305075.8775.3276.15 ± 0.6957.4157.6959.40 ± 0.89
780455061.5761.6061.95 ± 1.0041.6541.2541.53 ± 0.79
860156065.6266.2964.55 ± 1.1542.9842.7743.83 ± 0.69
960454062.9762.5763.35 ± 0.6943.5244.0942.67 ± 1.09
1040155061.2161.5560.92 ± 0.5937.5038.8337.62 ± 1.10
1160154065.8066.3366.39 ± 1.0143.2842.6243.77 ± 0.99
1240306060.3460.9561.09 ± 1.1537.1436.9936.17 ± 1.09
1340455060.3861.7560.23 ± 0.7939.1039.5640.56 ± 1.00
1460305075.1776.6076.65 ± 0.4957.4158.2556.32 ± 1.02
1560305075.7776.0575.25 ± 0.8957.4157.8556.01 ± 0.58
1640304061.1061.5960.89 ± 0.9239.4140.6638.79 ± 0.65
1780306064.0365.6064.15 ± 1.0943.0344.2543.64 ± 0.45
X1: Ethanol concentration (EC); X2: time; X3: temperature; TPC: total phenolic content; TFC: total flavonoid content; RSM (prd.): predicted value by response surface method; ANN (prd.): predicted value by artificial neural network method; mgGAE/g: mg gallic acid equivalent/g dry weight of sample; mgCE/g: mg catechin equivalent/g dry weight of sample.
Table 2. ANOVA for quadratic model (function: none).
ANOVA for Quadratic Model for TPC
SourceRCSSDFMSF-Value p-Value
Model 632.77970.31107.80<0.0001Significant
Intercept 75.77
Linear terms
X1 1.2111.71111.7117.960.0039Significant
X2 −0.99127.8617.8612.050.0104Significant
X3 0.14380.165310.16530.25350.6301Not Significant
Interaction terms
X1X2−0.62751.5811.582.410.1641Not significant
X1X30.59751.4311.432.190.1825Not significant
X2X30.51001.0411.041.600.2470Not Significant
Quadratic terms
X12−8.12277.931277.93426.15<0.0001Significant
X22−5.59131.431131.43201.52<0.0001Significant
X32−5.73138.101138.10211.75<0.0001Significant
Lack of Fit 3.0731.022.740.1772Not significant
Pure error 1.4940.3733
R2 0.9928
Adjusted R2 0.9836
Pred. R2 0.9192
Adeq Precision 25.0494
C.V. % 1.21
ANOVA for quadratic model for TFC
SourceRCSSDFMSF-valuep-value
Model 1016.659112.9646.54<0.0001Significant
Intercept 57.42
Linear terms
X1 1.4416.62116.626.850.0346Significant
X2 0.63753.2513.251.340.2851Not Significant
X3 0.36911.0911.090.44890.5243Not Significant
Interaction terms
X1X2−0.16510.109010.10900.04490.8382Not significant
X1X31.509.0419.043.720.0949Not significant
X2X30.51771.0711.070.44160.5276Not Significant
Quadratic terms
X12−10.86496.931496.93204.73<0.0001Significant
X22−6.81195.121195.1280.39<0.0001Significant
X32−6.83196.581196.5880.99<0.0001Significant
Lack of Fit 8.8832.961.460.3516Not significant
Pure error 8.1142.03
R2 0.9836
Adjusted R2 0.9624
Pred. R2 0.8503
Adeq Precision 16.9654
C.V. % 3.40
X1: ethanol concentration (%); X2: time (min); X3: temperature (°C). RC: Regression coefficient; SS: sum of squares; DF: the total degrees of freedom; MS: mean square.
Table 3. Comparison of the prediction ability of RSM and ANN.
Parameters TPC TFC
RSMANNRSMANN
R20.99280.99630.98360.9912
RMSE6.71391.77603.84642.2384
AAD (%)0.92370.13900.78280.2201
SEP (%)0.06490.01710.05610.0326
R2: correlation coefficients; RMSE: root mean square error; AAD: absolute average deviation; SEP: standard error of prediction.
Table 4. List of possible identified compounds of UMS using ESI–MS/MS in the negative ionization mode ([M–H]).
GroupsNo.Compound NameEFOM (m/z)CM (m/z)MS/MSCL
Phenolic acids and derivatives1p-Coumaroyl aspartic acidC13H13NO6278.0669278.0664260.05, 234.07, 216.062
24-Hydroxybenzoyl glucoseC13H16O8299.0773299.0766137.02, 163.021
3Coumaroylshikimic acid C16H16O7319.0824319.0817173.04, 163.03, 145.022
4Vanillic acid glucoside C14H18O9329.0879329.0872167.03, 152.02, 123.041
5Caffeoyl shikimic acid C16H16O8335.0771335.0772179.01, 161.03, 155.03, 137.051
6Glucosyringic acidC15H20O10359.0985359.0978197.04, 182.01, 153.052
7Caffeic acid derivatives C18H18O9377.0853377.0878341.10, 215.03, 179.06, 161.042
8Sinapic acid hexosideC17H22O10385.1154385.1135223.06, 205.051
9SinapoylspermineC21H36N4O4407.2649407.2658350.20, 279.13, 201.202
10Methyl 4,6-di-O-galloyl-glucose C21H22O14497.0927497.0931345.05, 183.12, 169.05, 125.012
11Caffeoyl shikimic acid hexosideC22H26O13497.1278497.1295335.01, 178.02, 135.022
12Cinnamoyl-1,2-digalloyl glucoseC29H26O15613.1126613.1193483.07, 443.09, 169.01, 147.04 2
133-O-feruloyl-7-O-acyl-feruloyl-4-O-caffeoyl-quinic acidC38H36O16747.1895747.1931729.05, 687.15, 571.02, 529.05, 409.12, 381.05, 357.062
Flavonoids and derivatives 14Apigenin C15H10O5269.0454269.045241.01, 151.01, 149.031
15Luteolin C15H10O6285.0405285.0399267.05, 241.03, 151.00, 133.021
16Catechin/Epicatechin C15H14O6289.0718289.0712245.04, 205.05, 179, 151.04, 137.021
17Chrysoeriol C13H16O8299.0561299.0555285.03, 255.02, 153.01, 135.03, 125.032
18Quercetin C15H10O7301.0352301.0348273.04, 257.04, 179.00, 151.001
19Taxifolin C15H12O7303.0511303.0504285.04, 275.02, 241.05, 151.04, 125.022
20Epigallocatechin C15H14O7305.0637305.0661287.05, 137.02, 125.021
21Methoxysinensetin C21H22O8401.1299401.1236371.11, 339.08, 191.712
22Epicatechin hydroxybenzoate C22H18O8409.0924409.0923289.07, 271.06, 137.02, 119.012
23Naringenin rhamnoside C21H22O9417.1249417.1186271.06, 187.03, 151.00, 119.052
24Epiafzelechin gallate C22H18O9425.0877425.0872287.05, 273.07, 169.01, 151.002
25Apigenin hexoside C21H20O10431.0989431.0978269.04, 241.01, 151.01, 149.031
26Naringin C21H22O10433.1137433.1134271.06, 187.03, 151.00, 119.051
27Epicatechin gallate C22H18O10441.0810441.0821135, 169, 273, 371, 399, 413, 4272
28Biochanin A glucoside C22H22O10445.1199445.1135283.06, 268.03, 239.03, 211.04, 132.022
29Kaempferol hexoside C21H20O11447.0929447.0927285.04, 241.03, 151.00, 133.02 1
30Taxifolin rhamnoside C21H22O11449.1089449.1089303.05, 285.04, 275.02, 151.04, 125.022
31Catechin glucoside C21H24O11451.1356451.1240289.15, 151.10, 137.08, 123.102
32Epicatechin 3-(3-methylgallate) C23H20O10455.1018455.0978289.02, 183.05, 124.012
33Afrormosin glucoside C23H24O10459.1354459.1291297.07, 281.04, 267.062
34Chrysoeriol hexoside C22H22O11461.1085461.1083299.05, 285.03, 153.01, 135.03, 125.032
35Isoquercitrin C21H20O12463.0884463.0876301.05, 268.01, 179.02, 151.011
36Epicatechin glucuronide C21H22O12465.1036465.1033289.15, 151.10, 137.08, 123.102
37Epigallocatechin caffeate C24H20O10467.0980467.0978305.06, 287.05, 179.03, 137.02, 125.02 2
38Isorhamnetin glucoside C22H22O12477.1035477.1033315.05, 300.01, 255.05, 179.05, 151.022
39Luteone glucoside C26H28O11515.1615515.1553353.10, 311.05, 297.042
40Isorhamnetin malonyl hexoside C24H24O13519.1141519.1138315.05, 300.02, 227.01, 204.04, 177.01 2
41Luteolin hexosyl sulfate C21H20O14S527.0502527.0495447.05, 285.01, 241.062
42Chrysoeriol hexosyl sulfate C22H22O14S541.0658541.0652299.05, 284.05, 241.022
43Isoquercitrin sulfate C21H20O15S543.0448543.0444463.05, 301.01, 268.01, 179.02, 151.012
44Procyanidin A2 C30H24O12575.1195575.1189539.09, 449.08, 423.07, 289.07, 285.04, 269.04, 125.021
45Procyanidin B2 C30H26O12577.1352577.1346451.10, 425.08, 407.07, 289.07, 287.05, 269.04, 125.02 1
46Luteolin rhamnosyl hexosideC27H30O15593.1509593.1506447.09, 285.03, 153.01, 135.042
47Chrysoeriol rhamnosyl hexosideC28H32O15607.1672607.1663461.10, 299.05, 284.03, 153.01, 149.052
48Isorhamnetin rhamnosyl hexosideC28H32O16623.1609623.1612477.10, 315.05, 299.05, 165.052
49Isorhamnetin dihexosideC28H32O17639.1556639.1561447.01, 315.012
50Procyanidin B2 gallateC37H30O16729.1473729.1455451.10, 425.08, 407.07, 289.07, 287.05, 169.01, 125.022
51Kaempferol 3-(3″,6″-di-p-coumaroyl galactoside) (Stenopalustroside A)C39H32O15739.1679739.1663593.12, 575.11, 285.03, 163.032
52Quercetin 3-O-xylosyl-rutinosideC32H38O20741.1846741.1878609.14, 301.032
53Epicatechin-(4beta- >8)-epigallocatechin gallateC37H30O17745.1395745.1404441.08, 303.05, 169.01, 125.022
54Luteolin rhamnosyl dihexosideC33H40O20755.1990755.2034709.16, 593.10, 575.05, 285.012
55Quercetin rhamnosyl dihexosideC33H40O21771.1969771.1983609.14, 591.05, 301.03, 153.02, 125.002
56Isorhamnetin rhamnosyl dihexosideC34H42O21785.2110785.2140623.16, 477.10, 315.052
57Quercetin 3-sophorotriosideC33H40O22787.1909787.1933625.10, 463.09, 301.012
58Quercetin 3-(6′′′′-p-coumaryl sophorotrioside) (Pisumflavonoside I)C42H46O24933.2302933.2300787.19, 625.10, 463.09, 301.012
59Quercetin 3-(6″-caffeoyl sophorotrioside)C42H46O25949.2223949.2250787.19, 625.10, 463.09, 301.012
Terpenoids 608-Hydroxy-(+)-δ-cadineneC15H24O219.175219.1748203.14, 201.16, 179.142
61Valerenic acidC15H22O2233.1544233.1541219.13, 189.16, 161.132
62β-Ionyl acetateC15H24O2235.1700235.1698193.15, 175.14, 149.132
63Valerenolic acidC15H22O3249.1528249.1490231.13, 205.15, 187.14, 177.122
64Phytuberol C15H24O3251.1651251.1647233.15, 221.15, 193.122
65CurcolonolC15H20O4263.1288263.1283245.11, 227.10, 205.082
66Absindiol C15H22O4265.1445265.1439247.13, 221.15, 209.112
67Acoric acid C15H24O4267.1602267.1596249.14, 223.16, 181.122
68PhytuberinC17H26O4293.1758293.1752251.16, 233.15, 221.15, 193.122
69Trilobinol C20H28O2299.2016299.2011283.16, 265.15, 257.152
70Abietadiene-diol C20H32O2303.2330303.2324287.20, 257.22, 241.19, 215.182
71Piperochromenoic acid C22H28O3339.2000339.1960325.18, 295.20, 189.05, 137.022
72Eucannabinolide C22H28O8419.1710419.1705389.16, 371.14, 359.14, 347.142
73β-Amyrenone C30H48O423.3624423.3626407.33, 391.302
74Cichorioside M C21H32O9427.1974427.1968265.14, 247.13, 221.15, 209.112
75Cynaroside A C21H32O10443.1921443.1917281.13, 263.12, 237.14, 193.122
76Oleanonic acid C30H46O3453.3376453.3368241, 323, 341, 3792
Lignans771,2-Di-(syringoyl)-hexosideC24H28O14539.1385539.1401359.09, 341.08, 197.04, 153.052
78Citrusin BC27H36O13567.2084567.2077405.15, 387.14, 358.14, 209.08, 197.08 3
79Lyoniresinol glucosideC28H37O13581.2236581.2234419.17, 265.10, 247.093
Carboxylic acid, fatty acids and amino acids80Fumaric acidC4H4O4115.0026115.003771.012
81Succinic acid C4H6O4117.0183117.018799.00, 73.022
82Malic acidC4H6O5133.0133133.0142115.00, 89.02, 71.012
83Tartaric acidC4H6O6148.9235149.008687.052
84Ribonic acidC5H10O6165.0398165.0418149.04, 105.01, 87.00, 75.002
85Citric acidC6H8O7191.0191191.0197173.00, 129.01, 111.002
86Homocitric acidC7H10O7205.0349205.0348161.04. 143.04. 117.052
87Lauric acidC12H24O2199.1698199.1698181.16, 165.13, 163.11, 139.11, 135.112
88Myristic acidC14H28O2227.2014227.2011209.19, 183.21, 179.182
89Methylmyristic acidC15H30O2241.2171241.2167227.20, 209.19, 183.21, 179.182
90Palmitic acidC16H32O2255.2327255.233237.23, 211.24, 197.222
9116-Hydroxypalmitic acidC16H32O3271.2279271.2273253.12, 237.22. 225.25, 211.24. 195.212
92α-Linoleic acidC18H32O2279.2328279.233261.222
93Oleic acid C18H34O2281.2485281.2486263.25, 181.21, 127.252
94Dihydroxy octadecadienoic acidC18H32O4311.2226311.2239293.22, 275.232
95Dihydroxy octadecenoic acidC18H34O4313.2383313.2378295.23, 277.25, 183.322
96Dihydroxy octadecanoic acidC18H36O4315.2538315.2535297.23, 279.25, 2
97Trihydroxy octadecadienoic acidC18H32O5327.2175327.2171309.23, 291.25, 273.232
98Trihydroxy octadecenoic acidC18H34O5329.2332329.2333311.25, 293.26, 275.232
99α-Hydroxybehenic acidC22H44O3355.3217355.3212337.31, 311.33, 293.32, 281.322
10026-Hydroxyhexacosanoic acidC26H52O3411.3842411.3838393.37, 381.37, 367.392
Others101Dihydrojasmonic acidC12H20O3211.1335 211.1334167.14, 111.08, 59.102
102N-acetyl-α-neuraminic acid C11H19NO9308.0986308.0987290.09, 219.06, 200.05, 146.08, 128.072
1031-Deoxynojirimycin hexoside C12H23NO9324.1298324.1295161.04, 144.06, 143.03, 113.022
104Icariside D1 C19H28O10415.1609415.1604398.15, 384.14, 250.122
EF: elemental formula; OM: observed mass; CM: calculated mass; CL: confidence level.
Disclaimer/Publisher’s Note: The statements, opinions and data contained in all publications are solely those of the individual author(s) and contributor(s) and not of MDPI and/or the editor(s). MDPI and/or the editor(s) disclaim responsibility for any injury to people or property resulting from any ideas, methods, instructions or products referred to in the content.

