Article

Harnessing γ-TMT Genetic Variations and Haplotypes for Vitamin E Diversity in the Korean Rice Collection

1
Department of Plant Resources, College of Industrial Sciences, Kongju National University, Yesan 32439, Republic of Korea
2
Department of Industrial and Systems Engineering, College of Engineering, Kongju National University, Cheonan 31080, Republic of Korea
*
Author to whom correspondence should be addressed.
These authors contributed equally to this work.
Antioxidants 2024, 13(2), 234; https://doi.org/10.3390/antiox13020234
Submission received: 22 December 2023 / Revised: 31 January 2024 / Accepted: 10 February 2024 / Published: 14 February 2024
(This article belongs to the Special Issue Vitamin E: Food Sources, Metabolism and Bioavailability)

Abstract

:
Gamma-tocopherol methyltransferase (γ-TMT), a key gene in the vitamin E biosynthesis pathway, significantly influences the accumulation of tocochromanols, thereby determining rice nutritional quality. In our study, we analyzed the γ-TMT gene in 475 Korean rice accessions, uncovering 177 genetic variants, including 138 SNPs and 39 InDels. Notably, two functional SNPs, tmt-E2-28,895,665-G/A and tmt-E4-28,896,689-A/G, were identified, causing substitutions from valine to isoleucine and arginine to glycine, respectively, across 93 accessions. A positive Tajima’s D value in the indica group suggests a signature of balancing selection. Haplotype analysis revealed 27 haplotypes, with two shared between cultivated and wild accessions, seven specific to cultivated accessions, and 18 unique to wild types. Further, profiling of vitamin E isomers in 240 accessions and their association with haplotypes revealed that Hap_2, distinguished by an SNP in the 3′ UTR (tmt-3UTR-28,897,360-T/A) exhibited significantly lower α-tocopherol (AT), α-tocotrienol (AT3), total tocopherol, and total tocotrienol, but higher γ-tocopherol (GT) in the japonica group. Additionally, in the indica group, Hap_2 showed significantly higher AT, AT3, and total tocopherol, along with lower GT and γ-tocotrienol, compared to Hap_19, Hap_20, and Hap_21. Overall, this study highlights the genetic landscape of γ-TMT and provides a valuable genetic resource for haplotype-based breeding programs aimed at enhancing nutritional profiles.

1. Introduction

Tocochromanols, commonly known as vitamin E, are crucial for human nutrition due to their lipid-soluble antioxidant properties [1,2]. These amphiphilic lipids, comprising tocopherols and tocotrienols, play a vital role in human and animal diets. They are categorized into α-, β-, γ-, and δ-subforms based on the number and position of methyl groups on their structure [3,4]. Among them, α-tocopherol is prevalent in plant tissues like leaves, dicot seeds, and monocot embryos [5,6]. It is preferentially absorbed and retained in the human body, contributing significantly to its bioactivity in preventing various diseases such as inflammatory conditions, cardiovascular diseases, Alzheimer’s, cancer, and cataracts [7,8]. Tocotrienols, though rarer in nature than tocopherols, are gaining attention for potential anti-cancer, anti-inflammatory, and cholesterol-lowering properties. As research continues, the dietary and therapeutic significance of these compounds is ever-increasing [9].
The biosynthesis pathway of vitamin E in plants is a complex that primarily employs products from the shikimate metabolic (SK) and methylerythritol phosphate (MEP) pathways. Homogentisic acid (HGA), derived from the SK pathway, serves as a hydrophilic head, while phytyldiphosphate (PDP) or geranylgeranyl-diphosphate (GGDP) from the MEP pathway provides the hydrophobic tail, crafting the structure of tocopherols or tocotrienols [10]. This synthesis involves key enzymes like 4-hydroxyphenylpyruvic acid dioxygenase (HPPD/PSD1), Tocopherol cyclase (TC/VTE1), Homogentisate geranylgeranyl transferase (HGGT), Homogenesate phytyltransferase (HPT/VTE2), 2-methyl-6-phytylplastoquinol methyltransferase (MT/VTE3), and γ-tocopherol methyltransferase (γ-TMT/VTE4) [11,12]. Tocopherols are synthesized using PDP, whereas tocotrienols are produced with geranylgeranyl-diphosphate (GGPP). HGA phytyltransferases (HPTs) facilitate this reaction, displaying varying substrate preferences across different organisms. Arabidopsis HPT (AtHPT) preferentially uses PDP, but can also utilize GGPP to produce tocotrienols under specific conditions. This enzyme plays a role in the accumulation of diverse tocochromanol forms, influenced by HGA availability. Poaceae plants utilize HGGT for tocotrienol synthesis, accepting both PDP and GGPP as substrates. The products of these reactions are prenylated benzoquinols, serving as precursors for δ- and β-tocochromanols, or can undergo methylation to form dimethyl-benzoquinols, leading to γ-tocochromanols. The tocopherol cyclase (TC/VTE1) enzyme further cyclizes these compounds into δ- and γ-tocochromanols. Finally, the γ-tocopherol methyltransferase (γ-TMT/VTE4) converts γ- and δ-tocochromanols into α- and β-tocochromanols, respectively [13]. Given the crucial role of vitamin E, the tocopherol and tocotrienol pathway was unraveled in Arabidopsis thaliana L. [14], soybean (Glycine max L.) [15], tomato (Solanum lycopersicum L.) [16], and rice (Oryza sativa L.) [17].
Rice (Oryza sativa L.) stands as a pillar of sustenance for approximately half of the world’s population [18,19]. It thrives in diverse ecotypes, mirroring its adaptability to various environmental conditions and cultivation practices [20,21]. Over millennia, rice has diversified into several distinct ecotypes: the cold-resilient temperate japonica, grown primarily in temperate regions [22]; tropical japonica adapted to warmer climates [23]; indica with its long, slender grains ideal for tropical and subtropical zones [24]; aus, closely related to indica and named after its drought resistance [25]; and the aromatic group, distinguished for its unique fragrance, with basmati being the most renowned [22]. Additionally, there are admixture varieties, resulting from intermixing between primary rice groups, which encapsulate traits from multiple primary ecotypes [26]. Besides being a dietary staple, rice grains are rich in bioactive compounds, including vitamin E isoforms, flavonoids, phytic acid, γ-oryzanols, and phenolic compounds [27]. The γ-TMT gene is particularly significance in the context of vitamin E biosynthesis. It plays a pivotal role in modulating the metabolic flow of tocopherol synthesis, specifically catalyzing the conversion of γ-tocopherol to α-tocopherol [28]. Extensive research on γ-TMT underscores its significance. For instance, variations (such as insertions and deletions) in the γ-TMT gene in maize (Zea mays L.) have been shown to influence α-tocopherol levels critically [29]. Furthermore, extensive haplotype analysis has pinpointed beneficial alleles of γ-TMT to enhance vitamin E accumulation in maize [30]. In rice, analysis of 34 accessions revealed considerable diversity in vitamin E isomers across rice cultivars [31]. Moreover, a genome-wide association study (GWAS) identified γ-TMT as a major candidate gene influencing vitamin E variation in 137 rice accession references. Studies in other plants, such as Arabidopsis, soybean, and maize, have revealed that overexpressing the γ-TMT gene can lead to a substantial increase in tocochromanol accumulation [15,32,33]. These findings emphasize the transformative potential of γ-TMT in optimizing the pathway to boost vitamin E levels in crops, promising enhanced nutritional benefits.
With the advent of next-generation sequencing (NGS), understanding the genetic architecture of rice has been revolutionized. This study investigates the genetic architecture of the γ-TMT gene across 475 rice accessions, aiming to uncover functional haplotypes, natural genetic variations, and the evolutionary dynamics among ecotypes. Our findings will provide invaluable insights for rice breeding, potentially enhancing its nutritional profile.

2. Materials and Methods

2.1. Plant Materials

In this study, we utilized the Korean rice (KRICE) collection, comprising 475 accessions, including 421 cultivated and 54 wild accessions (Table S1). The core set of 421 rice accessions was previously selected from a global collection of 4406 accessions by the National Genebank of the Rural Development Administration (RDA-Genebank, Jeonju-si, Republic of Korea) using the PowerCore program [34]. Based on whole-genome resequencing data, these accessions were categorized into six ecotypes: temperate japonica (n = 279), tropical japonica (n = 26), indica (n = 102), aus (n = 9), aromatic (n = 2), admixture (n = 3) [35]. Additionally, we included 54 wild rice accessions sourced from the International Rice Research Institute (IRRI) to provide a broader perspective on the genetic background.

2.2. Resequencing Data Processing and Variant Calling for γ-TMT Gene

To gain insights into the evolution of the γ-TMT gene within the KRICE collection, we analyzed resequencing data obtained from 475 rice accessions using a HiSeq 2500 sequencer (Illumina, San Diego, CA, USA), with an average coverage of approximately 15× [36]. The resequencing data underwent a series of processing steps, including data preparation, filtering, mapping, sorting, and variant calling. Firstly, we processed the raw data to ensure an average quality score (QS) of at least 20 per read using SICKLE (https://github.com/najoshi/sickle accessed on 1 August 2023) for trimming the 3′-end of reads. The decoded sequences were saved in fasta Q file format. To eliminate missing values, we used VCFtools (variant call format) version 0.1.15 [37], filtering each SNP for a ‘maximum missing’ value of 0.8 (allowing a maximum of 20% missing data) and a minor allele frequency (MAF) of 0.05. Subsequently, high-quality reads were aligned to the reference genome IRGSP-1.0 sequence using BWA v0.7.15, and Samtools v1.3.1. The aligned reads were stored in BAM (binary alignment map), and PICARDv1.88 was used to filter duplicate reads (Toolkit 2019). Subsequently, variant calling was performed using the Genome Analysis Tool Kit-V4.0.1.2 (GATK) [38] and filtered with VCFtools-V0.1.15 to eliminate potential false-positive SNPs/InDels, retaining variants with a minor allele frequency (MAF) of 0.05 or higher and a maximum missing data ratio (MDR) of 0.2. Finally, the γ-TMT gene region (chromosome 2, Chr02_28,894,065…..28,897,418) was extracted using BCFtools (v1.8) to retrieve the genetic variants within the gene and utilized for subsequent analyses.

2.3. Population Structure Analysis

In our study, we investigated the population structure of KRICE in relation to the γ-TMT gene. For this purpose, we utilized PLINK v1.07 [39] to transform the VCF file into a plink format. Using a custom Python script, we generated both bim and fam files. The population structure was then evaluated with fastStructure [40], where we tested K-values from 2 to 7. Subsequently, we employed the average Q-values in POPHELPER v2.3.1 to infer admixture patterns [41]. For a visual representation of the γ-TMT genetic composition within KRICE, we conducted a principal component analysis (PCA) using TASSEL5 [39]. The first two principal components, PC1 and PC2, were illustrated as a two-dimensional (2D) scatterplot generated with ggplot2 v3.6.2.

2.4. Nucleotide Diversity, Tajima’s D Analysis, and Fixation Index (FST)

To gauge the polymorphism among the ecotypes of KRICE, we evaluated nucleotide diversity (π) and derived Tajima’s D values. We utilized VCFtools to extract the γ-TMT gene region for each respective group. A sliding window size of 500 bp was adopted for both Tajima’s D and nucleotide diversity analyses, and subsequent values were contrasted across ecotypes. Moreover, the fixation index (FST) was estimated to ascertain genetic disparities across groups concerning the γ-TMT gene. This involved using a 500 bp sliding window set at 500 bp intervals.

2.5. Haplotype Analysis

We imported the VCF file encompassing the γ-TMT gene region from KRICE into TASSEL 5.0 to determine genetic variants across the accessions. To perform the haplotype analysis, this VCF file was transformed into FASTA format and subsequently aligned using MEGAX [42]. The alignment, after conversion to nexus format, was loaded into DnaSP (v6.12.03) [43] to ascertain the total number of haplotypes. A catalog of mutated sequences was curated for each group, laying the foundation for constructing the haplotype network utilizing Population Analysis with Articulate Tree (PopARTv1.7) [44] to form a TSC network. The dendrogram was constructed using FigTree version 1.4.3 and was based on the neighbor-joining method, encompassing 1000 bootstrap replications. This dendrogram was further visualized with the online tool iTOL [45].

2.6. Determination of Vitamin E Isomers by Gas Chromatography (GC)

The preparation of rice samples was adapted from the method presented by [46], with minor adjustments. Firstly, rice grains were de-hulled and finely ground. A mixture was created using five grams of the resulting rice powder and 20 mL of absolute ethanol. Subsequently, 0.5 g of ascorbic acid, serving as an antioxidant agent, was incorporated into each sample tube. These tubes were then submerged in an 80 °C water bath, agitated at 150 rpm for 10 min. To this mixture, 600 µL of 44% KOH was added, and the heating step was reiterated for 18 min. Once the saponification was complete, the samples were promptly cooled in an ice bath for 30 min. This was followed by the addition of 10 mL of distilled water and 10 mL of n-hexane. After centrifugation at 3000 rpm and 4 °C for 5 min, the supernatant was transferred to a new tube. This extraction step was performed thrice.
For purification, about 10 mL of distilled water was added, and the samples were passed through anhydrous sodium sulfate (Na2SO4) to remove any residual water. Afterward, samples were concentrated using a rotary evaporator (EYELA). For dissolution, 1 mL of iso-octane was added to each extracted sample tube. A total of 1 mL of this solution was transferred into a GC vial, from which 1 µL was injected into the GC instrument (GC-450, Variant). The instrument was equipped with a flame ionization detector and a CP-SIL 8CB column (30 m × 0.25 mm, 0.4 µm film thickness, Agilent, Santa Clara, CA, USA) set at 290 °C, operated with a split ratio of 1:20 and a continuous helium gas flow (1.0 mL/min). The initial temperature was set at 220 °C for 2 min, raised to 290 °C at a rate of 5 °C/min, maintained for 14 min, increased to 310 °C at 10 °C/min, and then held for 18 min. All analyses were performed in triplicates, with data from three biological replicates.
Compounds including α-tocopherol, γ-tocopherol, α-tocotrienol, and γ-tocotrienol were quantified based on standard curves. To create the standard curves, a series of known concentrations of eight tocochromanol isomers obtained from Sigma Aldrich (tocopherols: α, β, γ, δ, and tocotrienols: α, β, γ, δ) were subjected to the same GC analysis. The resulting detector responses for these known concentrations were plotted to establish a linear relationship. Using these standard curves, the concentrations of these compounds in unknown samples were determined (Figure S1).

2.7. Statistical Analysis

We utilized R (v4.2.3) for all statistical evaluations. To probe the relationship between functional γ-TMT haplotypes and variations in tocochromanol, a haplotype–trait association analysis was conducted. For accessions carrying similar haplotypes, the average tocochromanol concentration was determined and Student’s t-test was then employed to determine statistical differences in tocochromanol concentrations between the haplotypes.

3. Results

3.1. Genetic Polymorphisms in the γ-TMT of KRICE

Genetic variants within the γ-TMT gene of 475 KRICE samples were categorized into three main types: single-nucleotide polymorphisms (SNPs), insertions (Ins), and deletions (Dels). Of the 177 polymorphic sites detected in KRICE, 122 resided in intronic regions (Figure 1A). Within the transcript regions, 44 of the 55 identified sites were situated in exons, and 11 polymorphisms were observed in the 3′UTR region (Figure 1A). The wild group demonstrated the most pronounced genetic variants. Specifically, O. nivara and O. rufipogon, each with three accessions, exhibited 21 and 20 variations, respectively, whereas the remaining forty-eight wild accessions presented 140 variations. Among the cultivated varieties, indica had the highest genetic variants, trailed by admixture and then aus (Figure 1B).

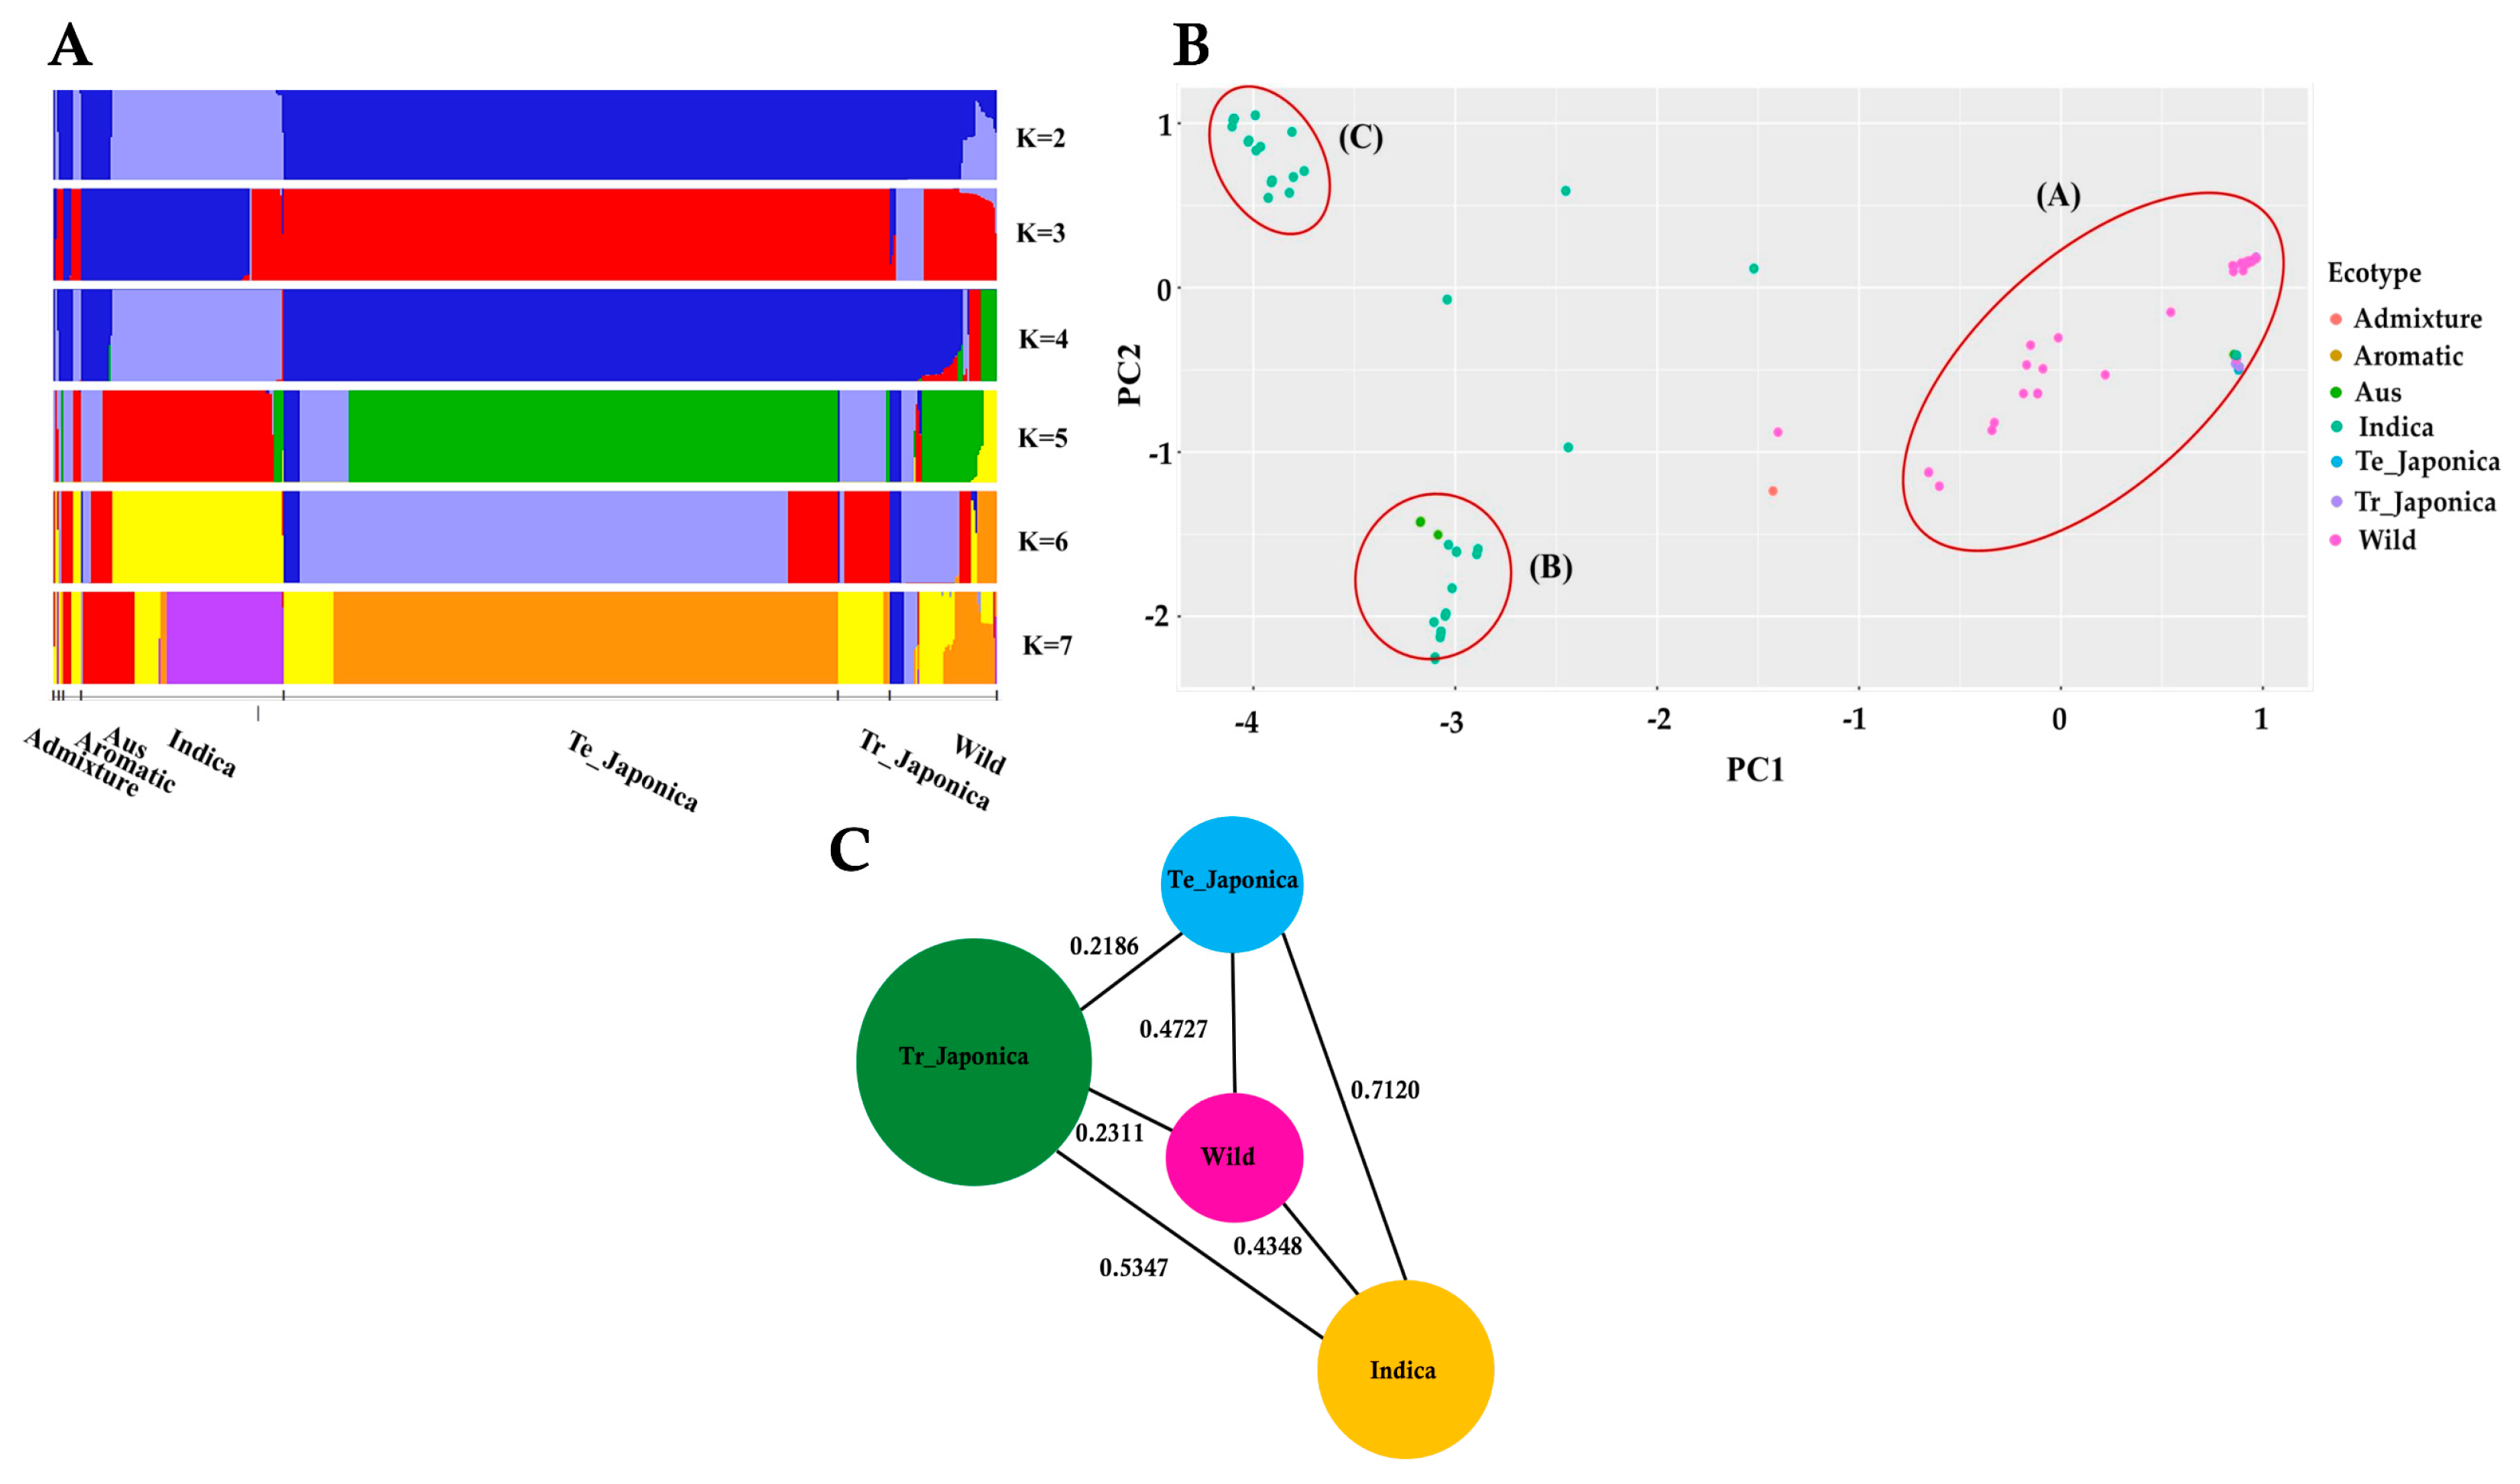
3.2. Population Structure of KRICE Based on the γ-TMT

To elucidate the composition of KRICE in terms of shared genetic variation in γ-TMT, we conducted a population structure analysis. Evaluating varying K values, ranging from 2 to 7, we observed mixed groupings among the samples (Figure 2A). Notably, at K = 3, the indica and japonica groups separated, while the wild group displayed a mixed pattern. Tropical japonica mirrored the structure of temperate japonica, and aus aligned closely with indica across all K values. With increasing K values, fragmentation became more pronounced within indica and wild accessions. Distinct genetic architectures for indica and aus were evident at K = 6 and K = 7, underscoring potential genetic divergence within the γ-TMT gene region for these groups. In contrast, throughout all K values, wild accessions consistently demonstrated an admixture pattern, signifying genetic overlap and allele sharing between wild and cultivated groups (Figure 2A).
We further investigated the principal component analysis (PCA) to ascertain the genetic relationships within the γ-TMT gene region. The PCA results revealed three distinct clusters, as depicted in Figure 2B. Cluster A encompassed all japonica, wild, aromatic, and some indica accessions. Cluster B comprised aus and indica accessions, while Cluster C was exclusively populated by indica accessions. The genetic distribution was more dispersed among the wild and indica groups, with a majority of wild accessions falling into Cluster A (Figure 2B). Collectively, these findings suggest that the wild subgroup shares a closer genetic similarity with cultivated groups, especially the japonica varieties.

3.3. Assessment of Population Differentiation via γ-TMT Gene Variations

To estimate the degree of population differentiation stemming from variations in the γ-TMT gene, we utilized the fixation index (FST) as an indicator (Figure 2C and Table S2). The highest FST values observed were 0.08824 (between temperate japonica and admixture), followed by 0.8357 (temperate japonica vs. aus) and 0.7120 (temperate japonica vs. indica). A high level of gene migration (low FST) was noted between admixture vs. aromatic and wild vs. aromatic groups, with FST value = 0, followed by admixture and indica groups (0.0249), indicating relatively low differentiation among these groups. Interestingly, there was evidence of substantial gene flow (indicated by low FST values) between the admixture and aromatic groups, as well as between the wild and aromatic groups, both registering an FST value of 0. Similarly, a modest FST value of 0.0249 was observed between the admixture and indica groups, further emphasizing their close genetic alignment. Notably, the wild group exhibited lesser differentiation compared to tropical japonica (0.2311), temperate japonica (0.4727), and indica (0.4348) than the differentiation observed between indica vs. tropical japonica (0.5347) and indica vs. temperate japonica (0.7120) (Figure 2C).

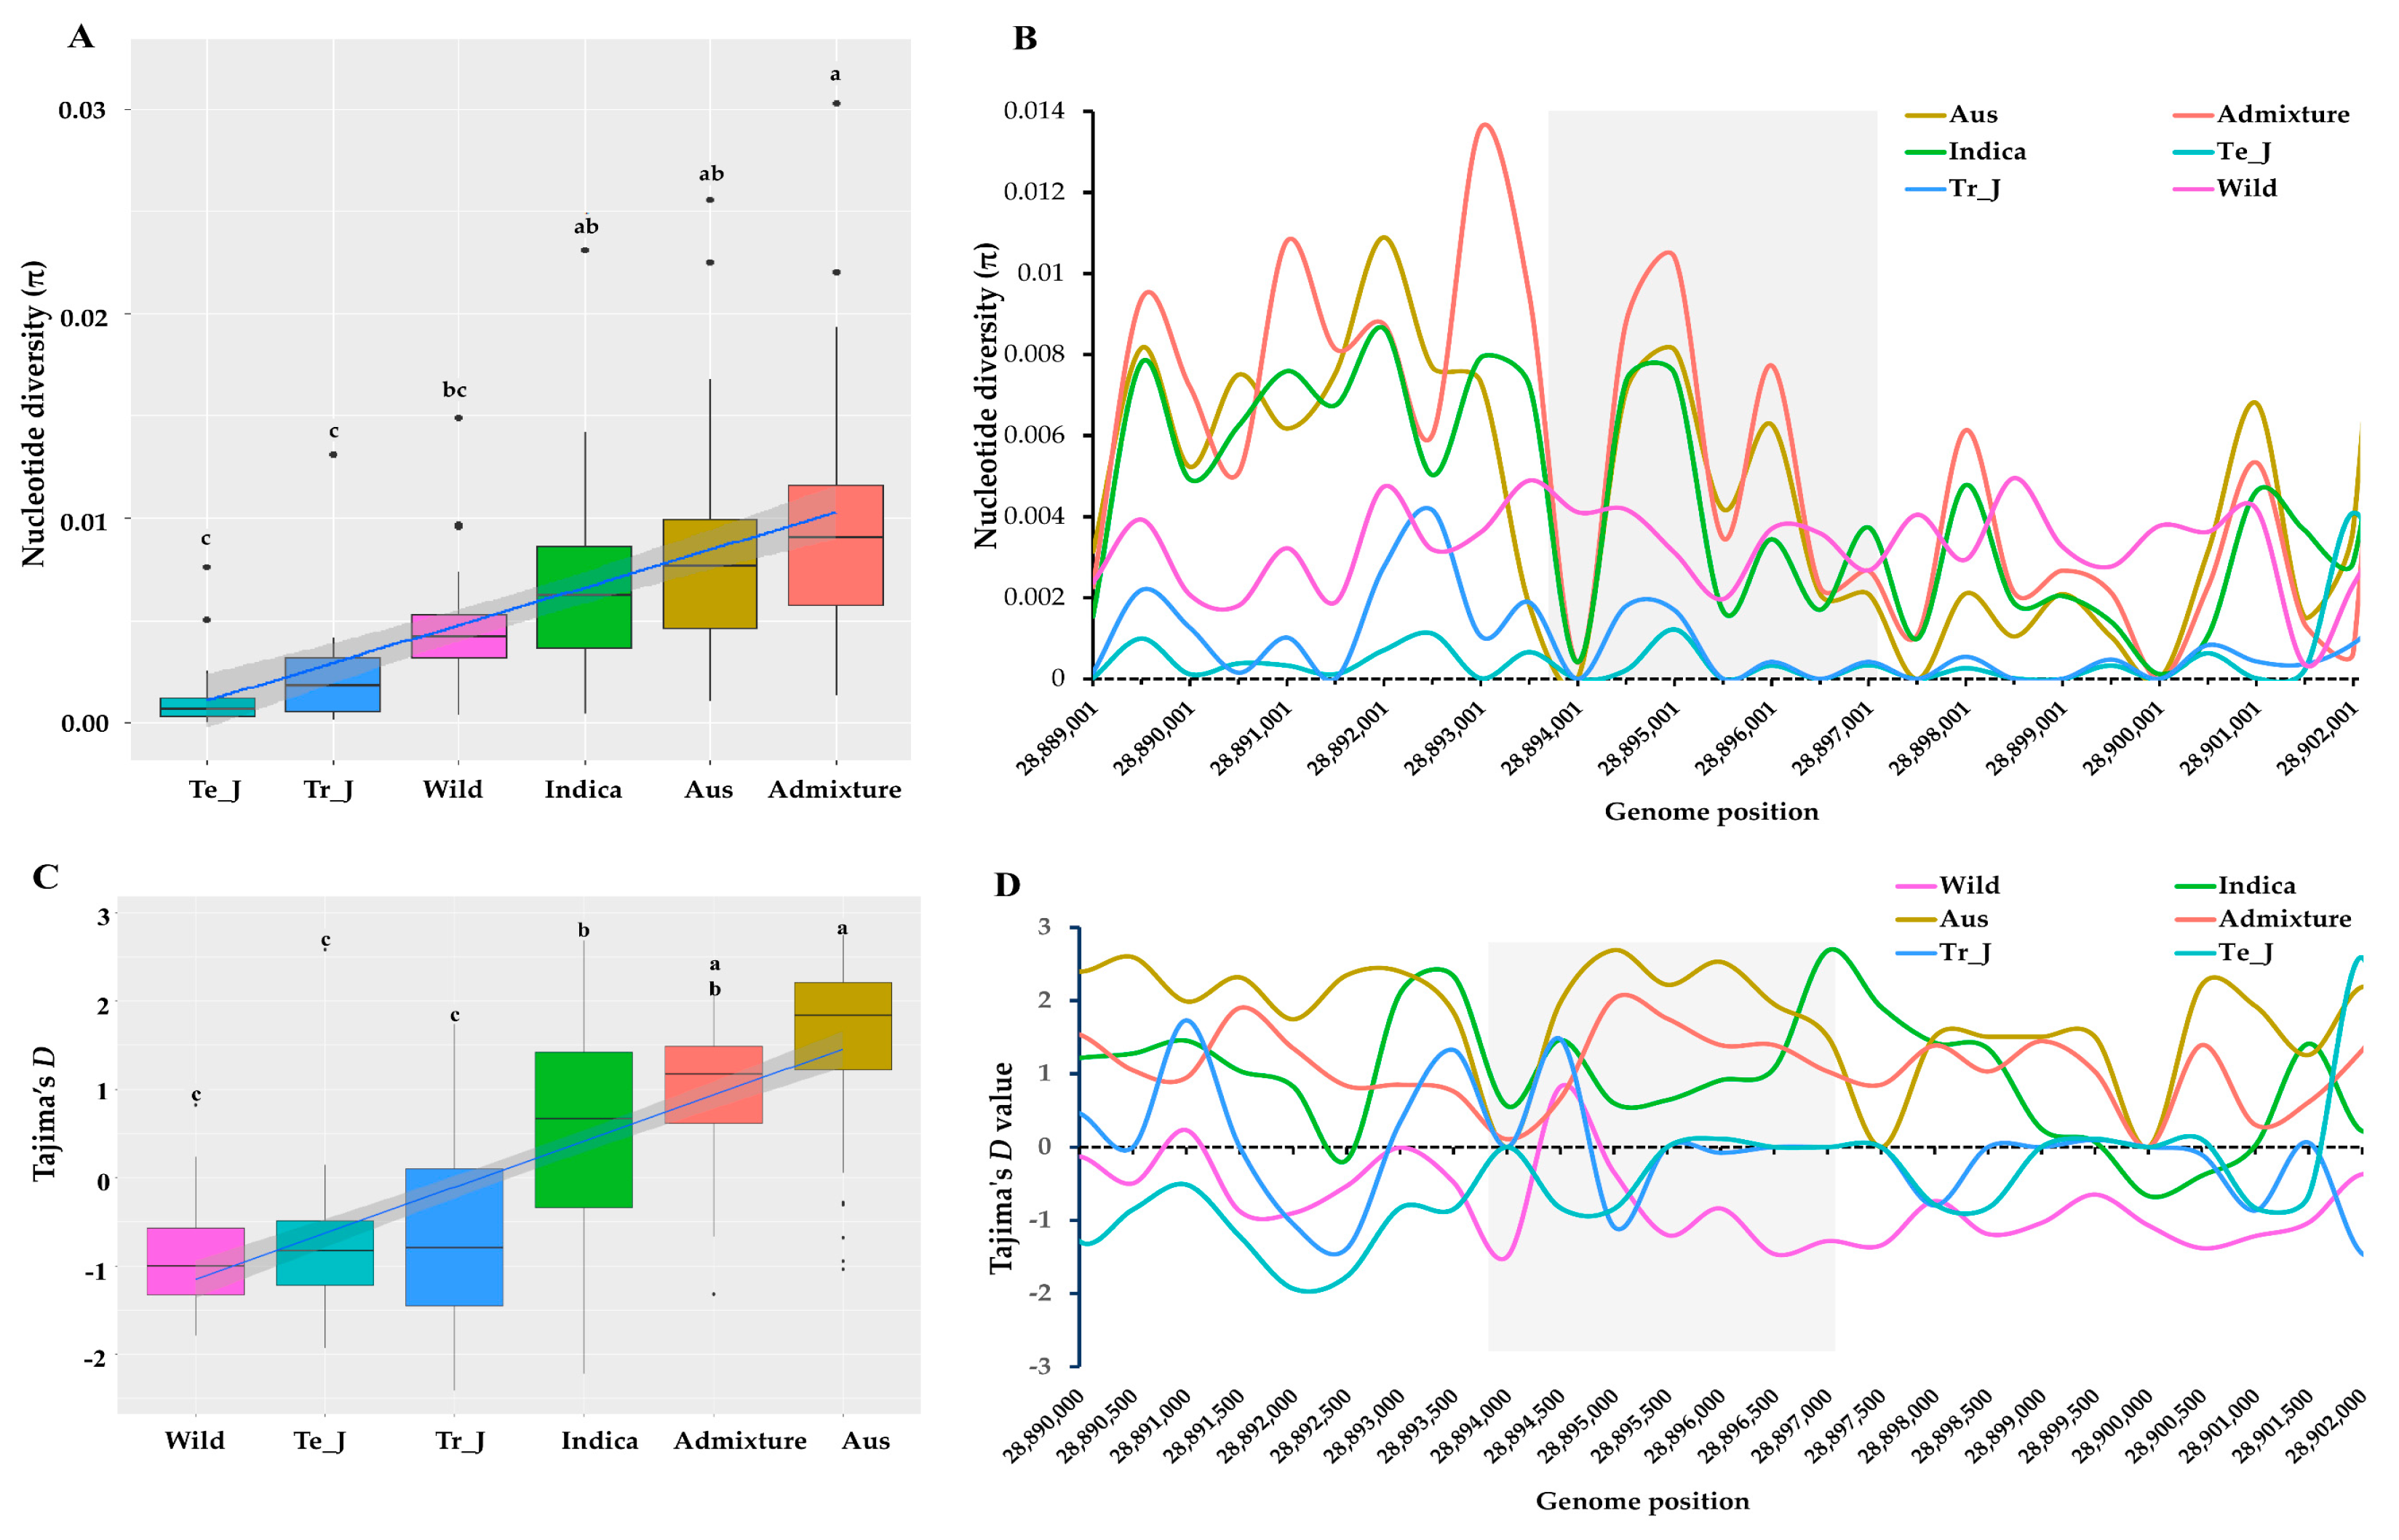
3.4. Polymorphism Assessment in KRICE Groups Based on the γ-TMT Gene

To assess the extent of polymorphism influenced by the γ-TMT variations across KRICE groups, we computed nucleotide diversity (π) values. Among the groups, the indica group displayed the highest mean nucleotide diversity (π = 0.0060), followed by wild (π = 0.0045), tropical japonica (π = 0.0015), and temperate japonica (π = 0.0009) (Figure 3A). In a sliding window analysis, the highest π value for the indica group was recorded at position 2,889,450, registering at π = 0.00552. Conversely, peak values for temperate japonica and tropical japonica were substantially lower, registering at 0.00022 and 0.00028, respectively. Towards the terminal region of the γ-TMT gene, there was a notable decline in π values for the indica and japonica groups. However, the wild group’s π values displayed an upward trend (Figure 3B).

3.5. Insights into Selection Patterns within the γ-TMT Gene

To further understand the differences between observed nucleotide diversity and the estimated number of segregating sites for the γ-TMT gene, we applied Tajima’s D test. The average Tajima’s D value for the indica group (0.6293) was significantly higher than that of the japonica and wild groups (Figure 3C). The indica group recorded the highest Tajima’s D value of 2.09848 at position 28,897,500. This positive value suggests an excess of intermediate-frequency alleles in the indica group, possibly indicative of balancing selection or a population contraction (Figure 3D). On the other hand, both japonica groups (temperate and tropical) and the wild group consistently displayed negative Tajima’s D values across all positions, indicating an abundance of rare alleles. This can be seen as evidence for either recent population expansion or positive selection in these groups.

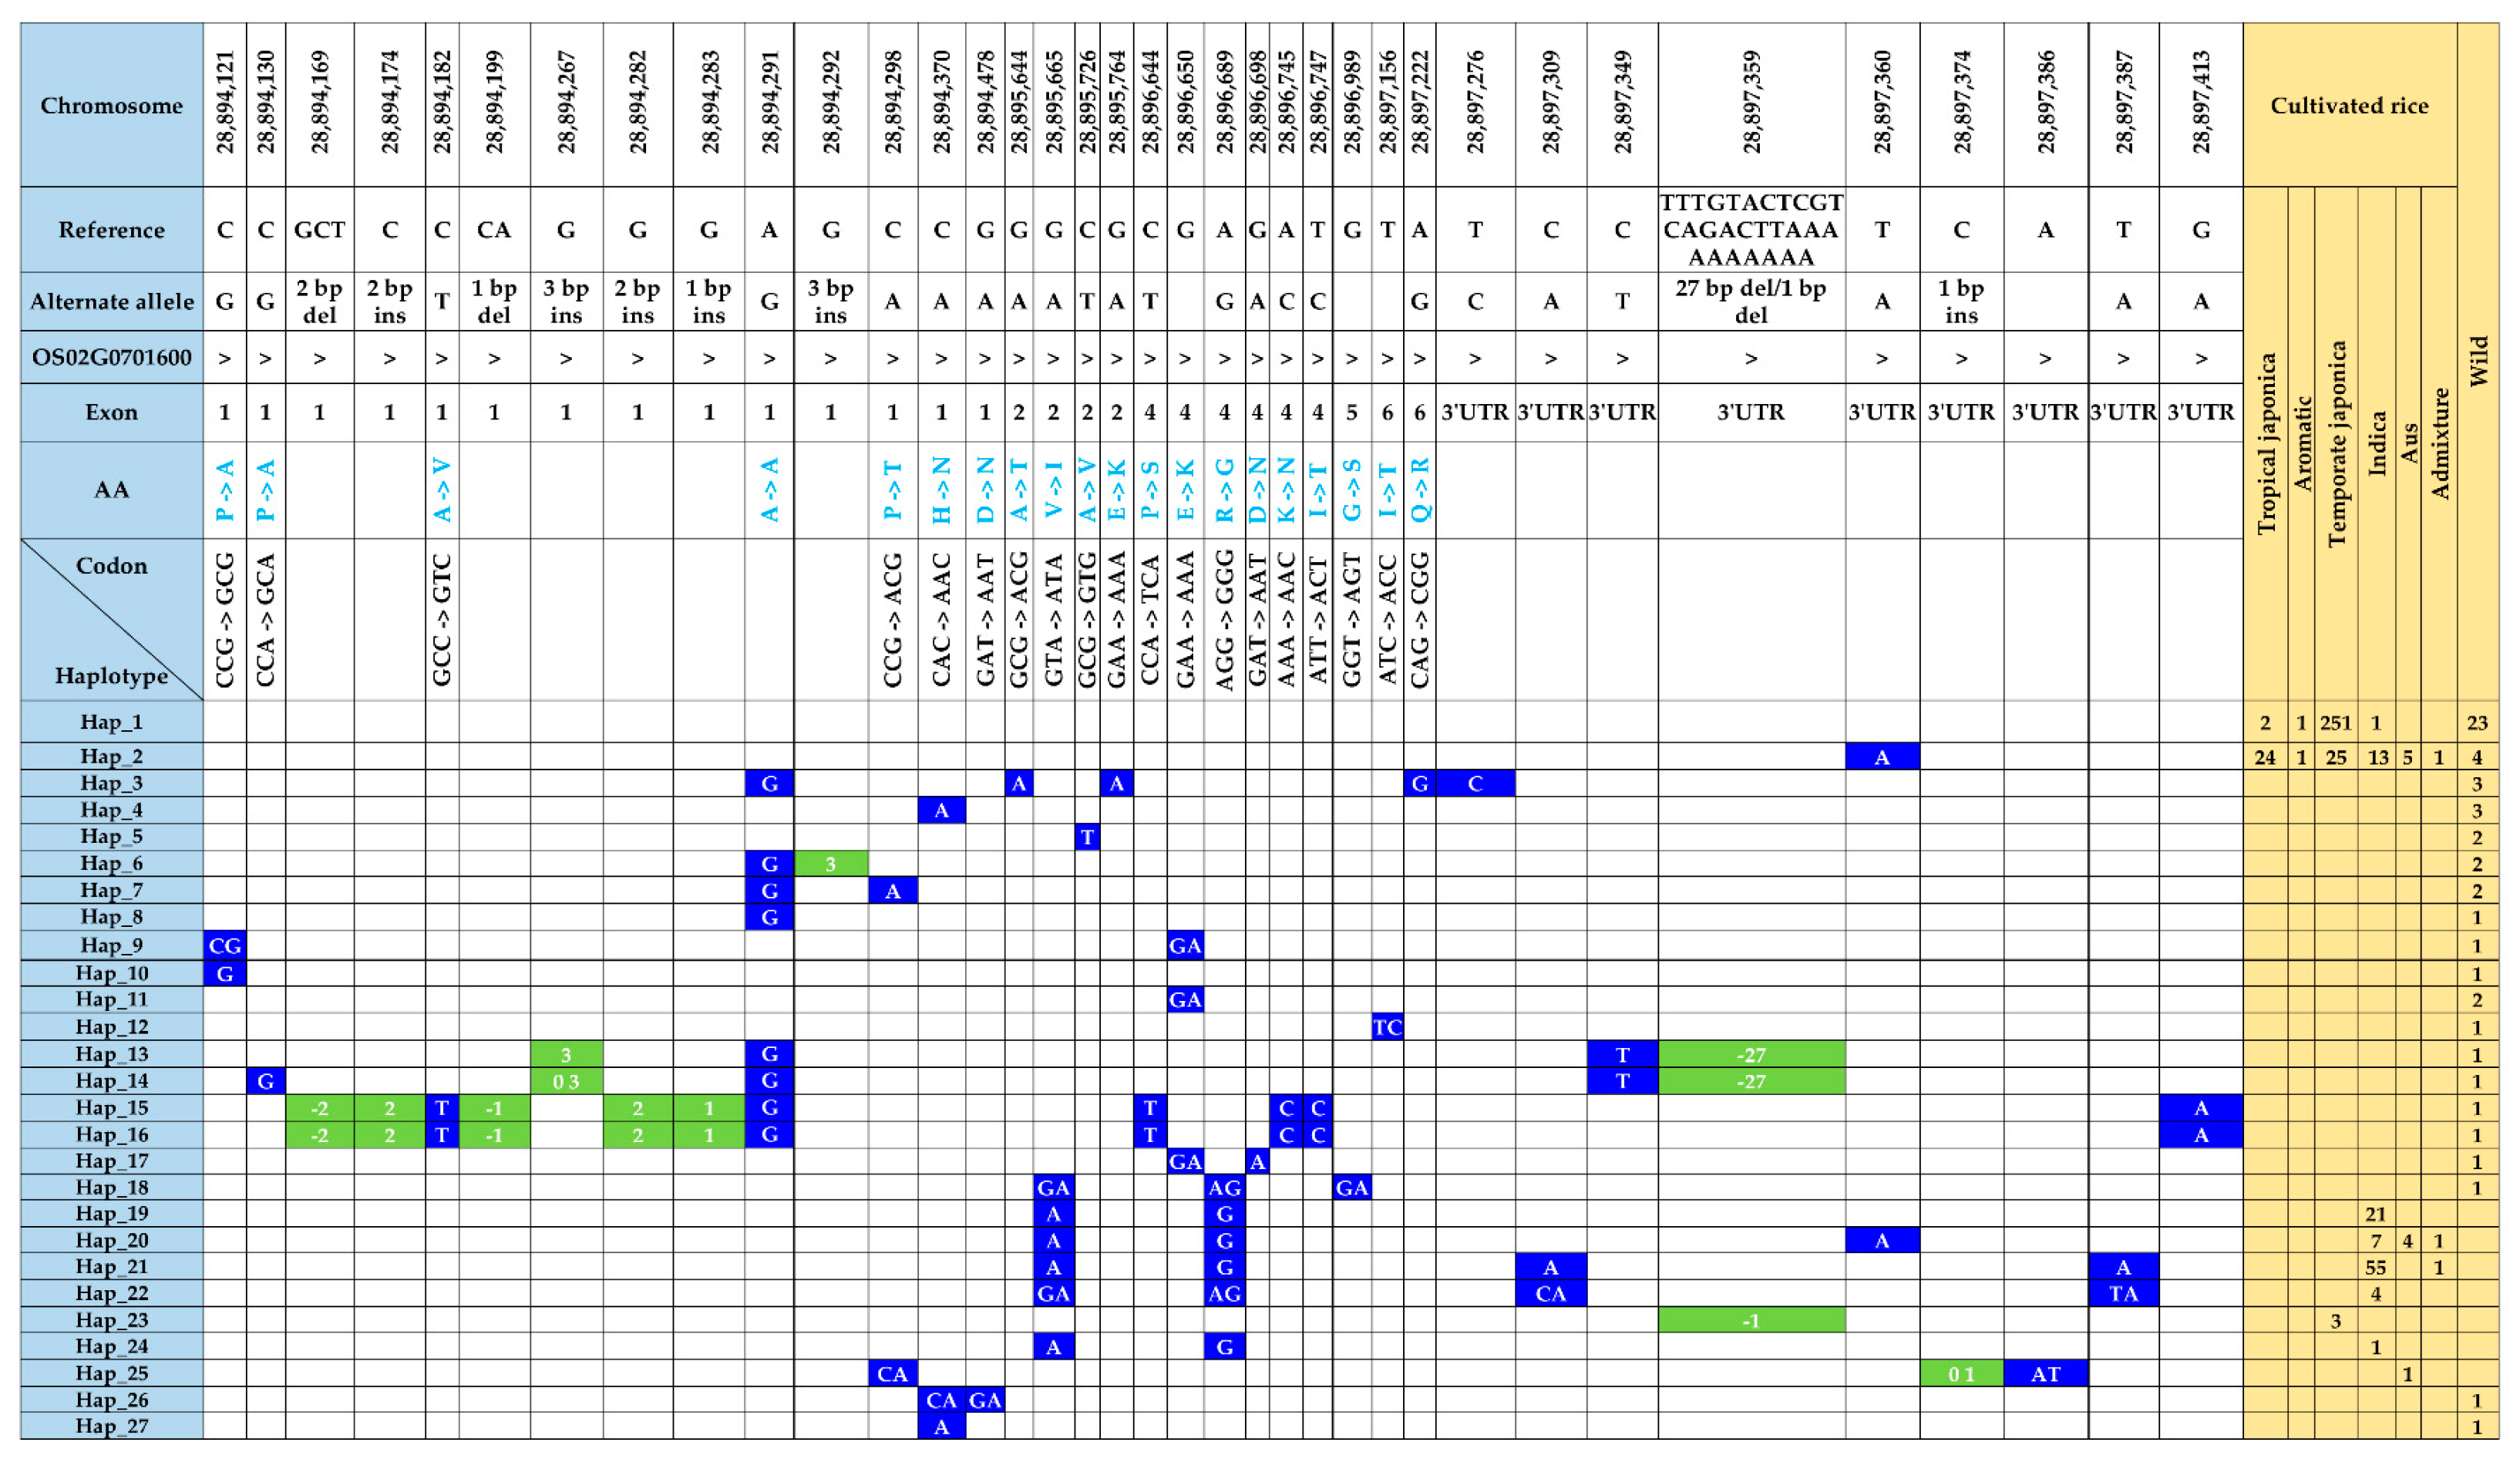
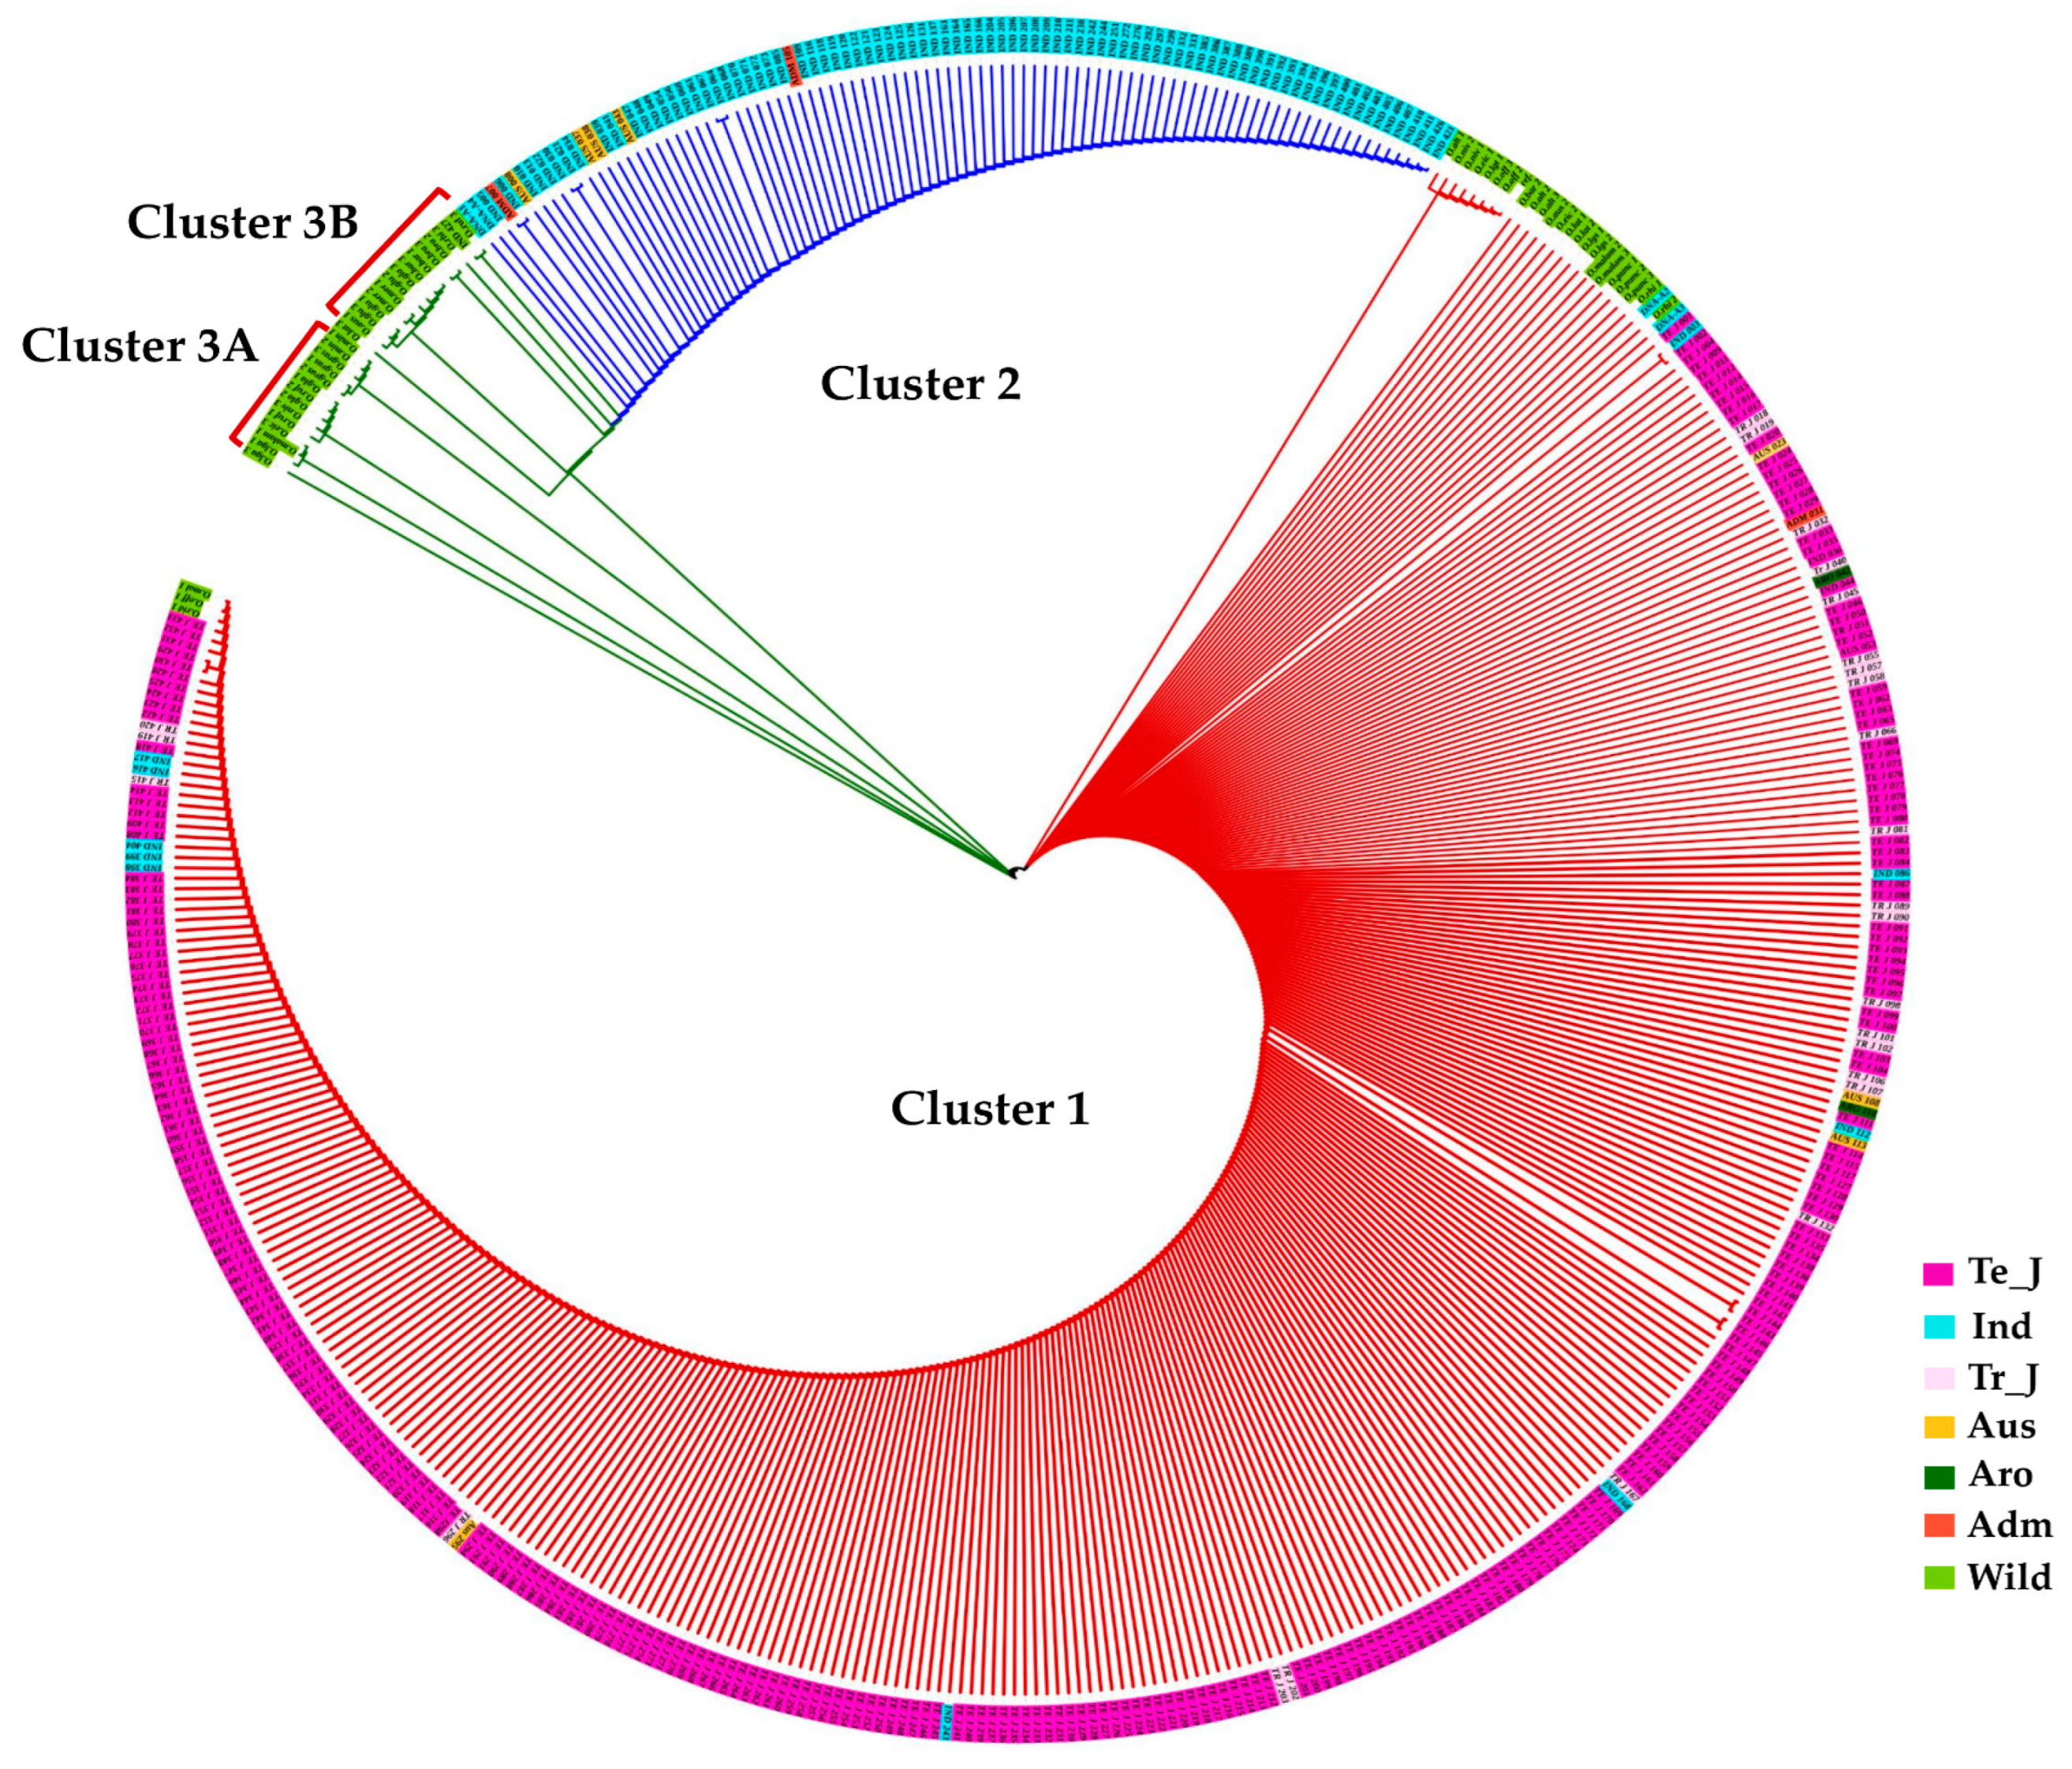
3.6. Functional Polymorphisms in the γ-TMT and Phylogenetic Analysis

Within the transcript region of the γ-TMT gene, we identified forty-six SNPs and nine InDels (Table S3). Among these, 28 polymorphic sites, including nonsynonymous SNPs and indels in exons, caused amino acid changes (hereafter referred to as fSNPs). Notably, among 55 polymorphic sites, 48 were present in wild accessions, while only nine were identified in cultivated accessions (Figure 4). In cultivated rice, two nonsynonymous SNPs, including G/A substitution in exon 2 (tmt-E2-28,895,665-G/A), caused a valine (V)-to-isoleucine (I) change, while another nonsynonymous A/G substitution in exon 4 (tmt-E4-28,896,689-A/G) resulted in an arginine (R)-to-glycine (G) change. Interestingly, both these alleles were detected in a subset of ninety-three accessions, which comprised eighty-seven indica, four aus, and two admixture accessions. In contrast, the wild-specific fSNPs, consisting of seventeen SNPs and eight indels, were present in 26 wild accessions (Table S3).
To gain deeper insights into the evolutionary relationship based on these polymorphisms, we constructed a phylogenetic tree using the maximum likelihood method. This analysis revealed that KRICE accessions could be grouped into three main clusters. The major clade, Cluster-1, predominantly comprised cultivated rice accessions but also included some wild accessions, hinting at their close genetic lineage (Figure 5). Interestingly, cultivated accessions carrying the two aforementioned fSNPs, tmt-E2-28,895,665-G/A, and tmt-E4-28,896,689-A/G, formed Cluster-2. In contrast, Cluster-3 was predominantly populated by wild accessions (Figure 5).

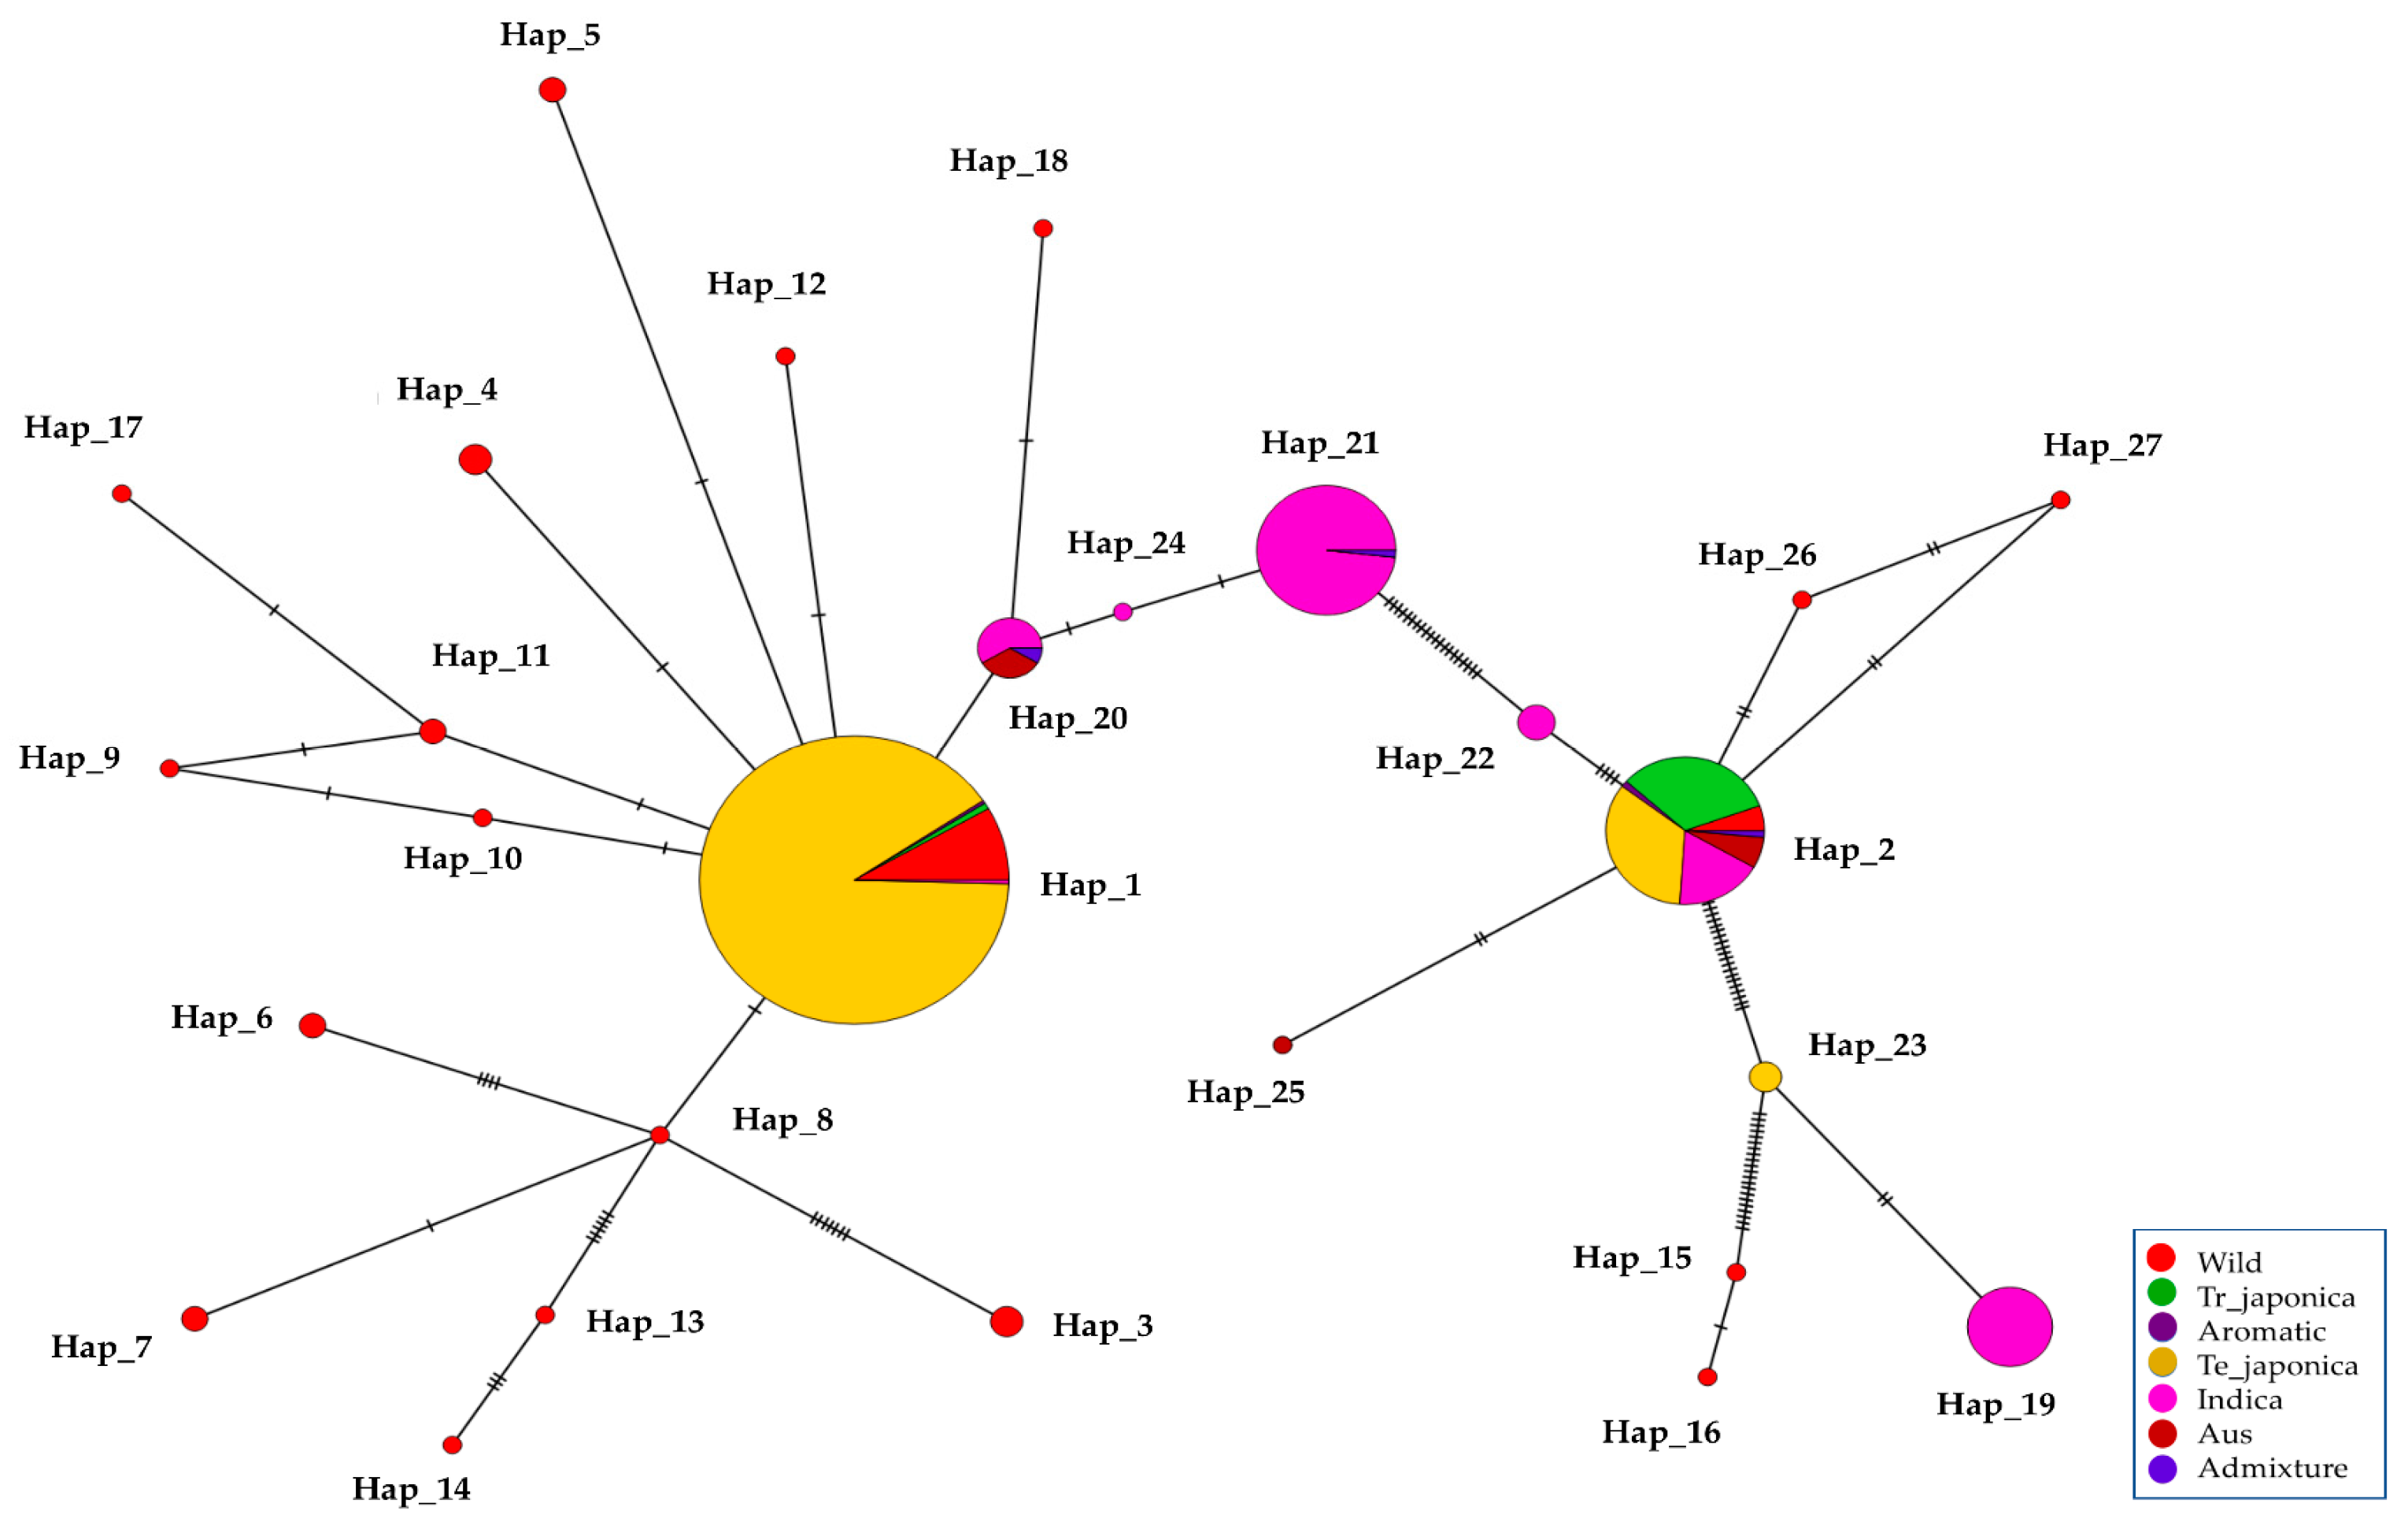
3.7. Haplotype Diversity in the γ-TMT Gene Region

The genetic variants found in the γ-TMT were categorized into 27 distinct haplotypes. Notably, only two haplotypes, Hap_1 and Hap_2, were common to both cultivated and wild rice groups. Seven haplotypes (Hap_19 to Hap_25) were unique to cultivated accessions, whereas the remaining eighteen haplotypes (Hap_3 to Hap_18, Hap_26, and Hap_27) were specific to the wild group (Figure 4 and Table S4). Hap_1, sharing its sequence with the Nipponbare reference, was the most prevalent, encompassing 278 accessions. This group included 251 accessions from temperate japonica, 23 from wild, 2 from tropical japonica, and 1 from indica (Figure 4). Hap_2, distinguished by an SNP in the 3′ UTR (tmt-3UTR- 28,897,360-T/A), was present in 73 accessions across all groups, including tropical japonica (24), temperate japonica (25), indica (13), aus (5), aromatic (1), admixture (1), and wild (4). Furthermore, seven haplotypes specific to cultivated accessions were characterized by seven SNPs and two indels (Figure 4). Hap_19, harboring two fSNPs, tmt-E2-28,895,665-G/A, and tmt-E4-28,896,689-A/G, was found in 21 indica accessions. In addition to the above two fSNPs, tmt-3UTR-28,897,360-T/A formed Hap_20 with 12 accessions. Two SNPs from the 3′ UTR along with tmt-E2-28,895,665-G/A, and tmt-E4-28,896,689-A/G detected in 56 accessions (55 indica and 1 aus) were grouped in Hap_21. Interestingly, Hap_24, characterized by a 1 bp deletion at 28,897,359, was found in three temperate japonica accessions. Additionally, haplotypes specific to wild accessions were characterized by twenty-two SNPs, three deletions, and five insertions (Figure 4).
To unravel the genetic relationships within KRICE ecotypes, we constructed a haplotype network. Our analysis spotlighted a total of seven haplotypes that branched directly from the predominant Hap_1. Interestingly, six of these were exclusive to the wild types. The cultivated-specific haplotype, Hap_20, appears to have evolved through a few mutational steps from Hap_1. Remarkably, the wild-specific Hap_15, Hap_16, Hap_25, and Hap_27 appeared to have been derived from Hap_2. Furthermore, Hap_8, which branched from Hap_1, led to the emergence of another five distinct haplotypes (Figure 6).

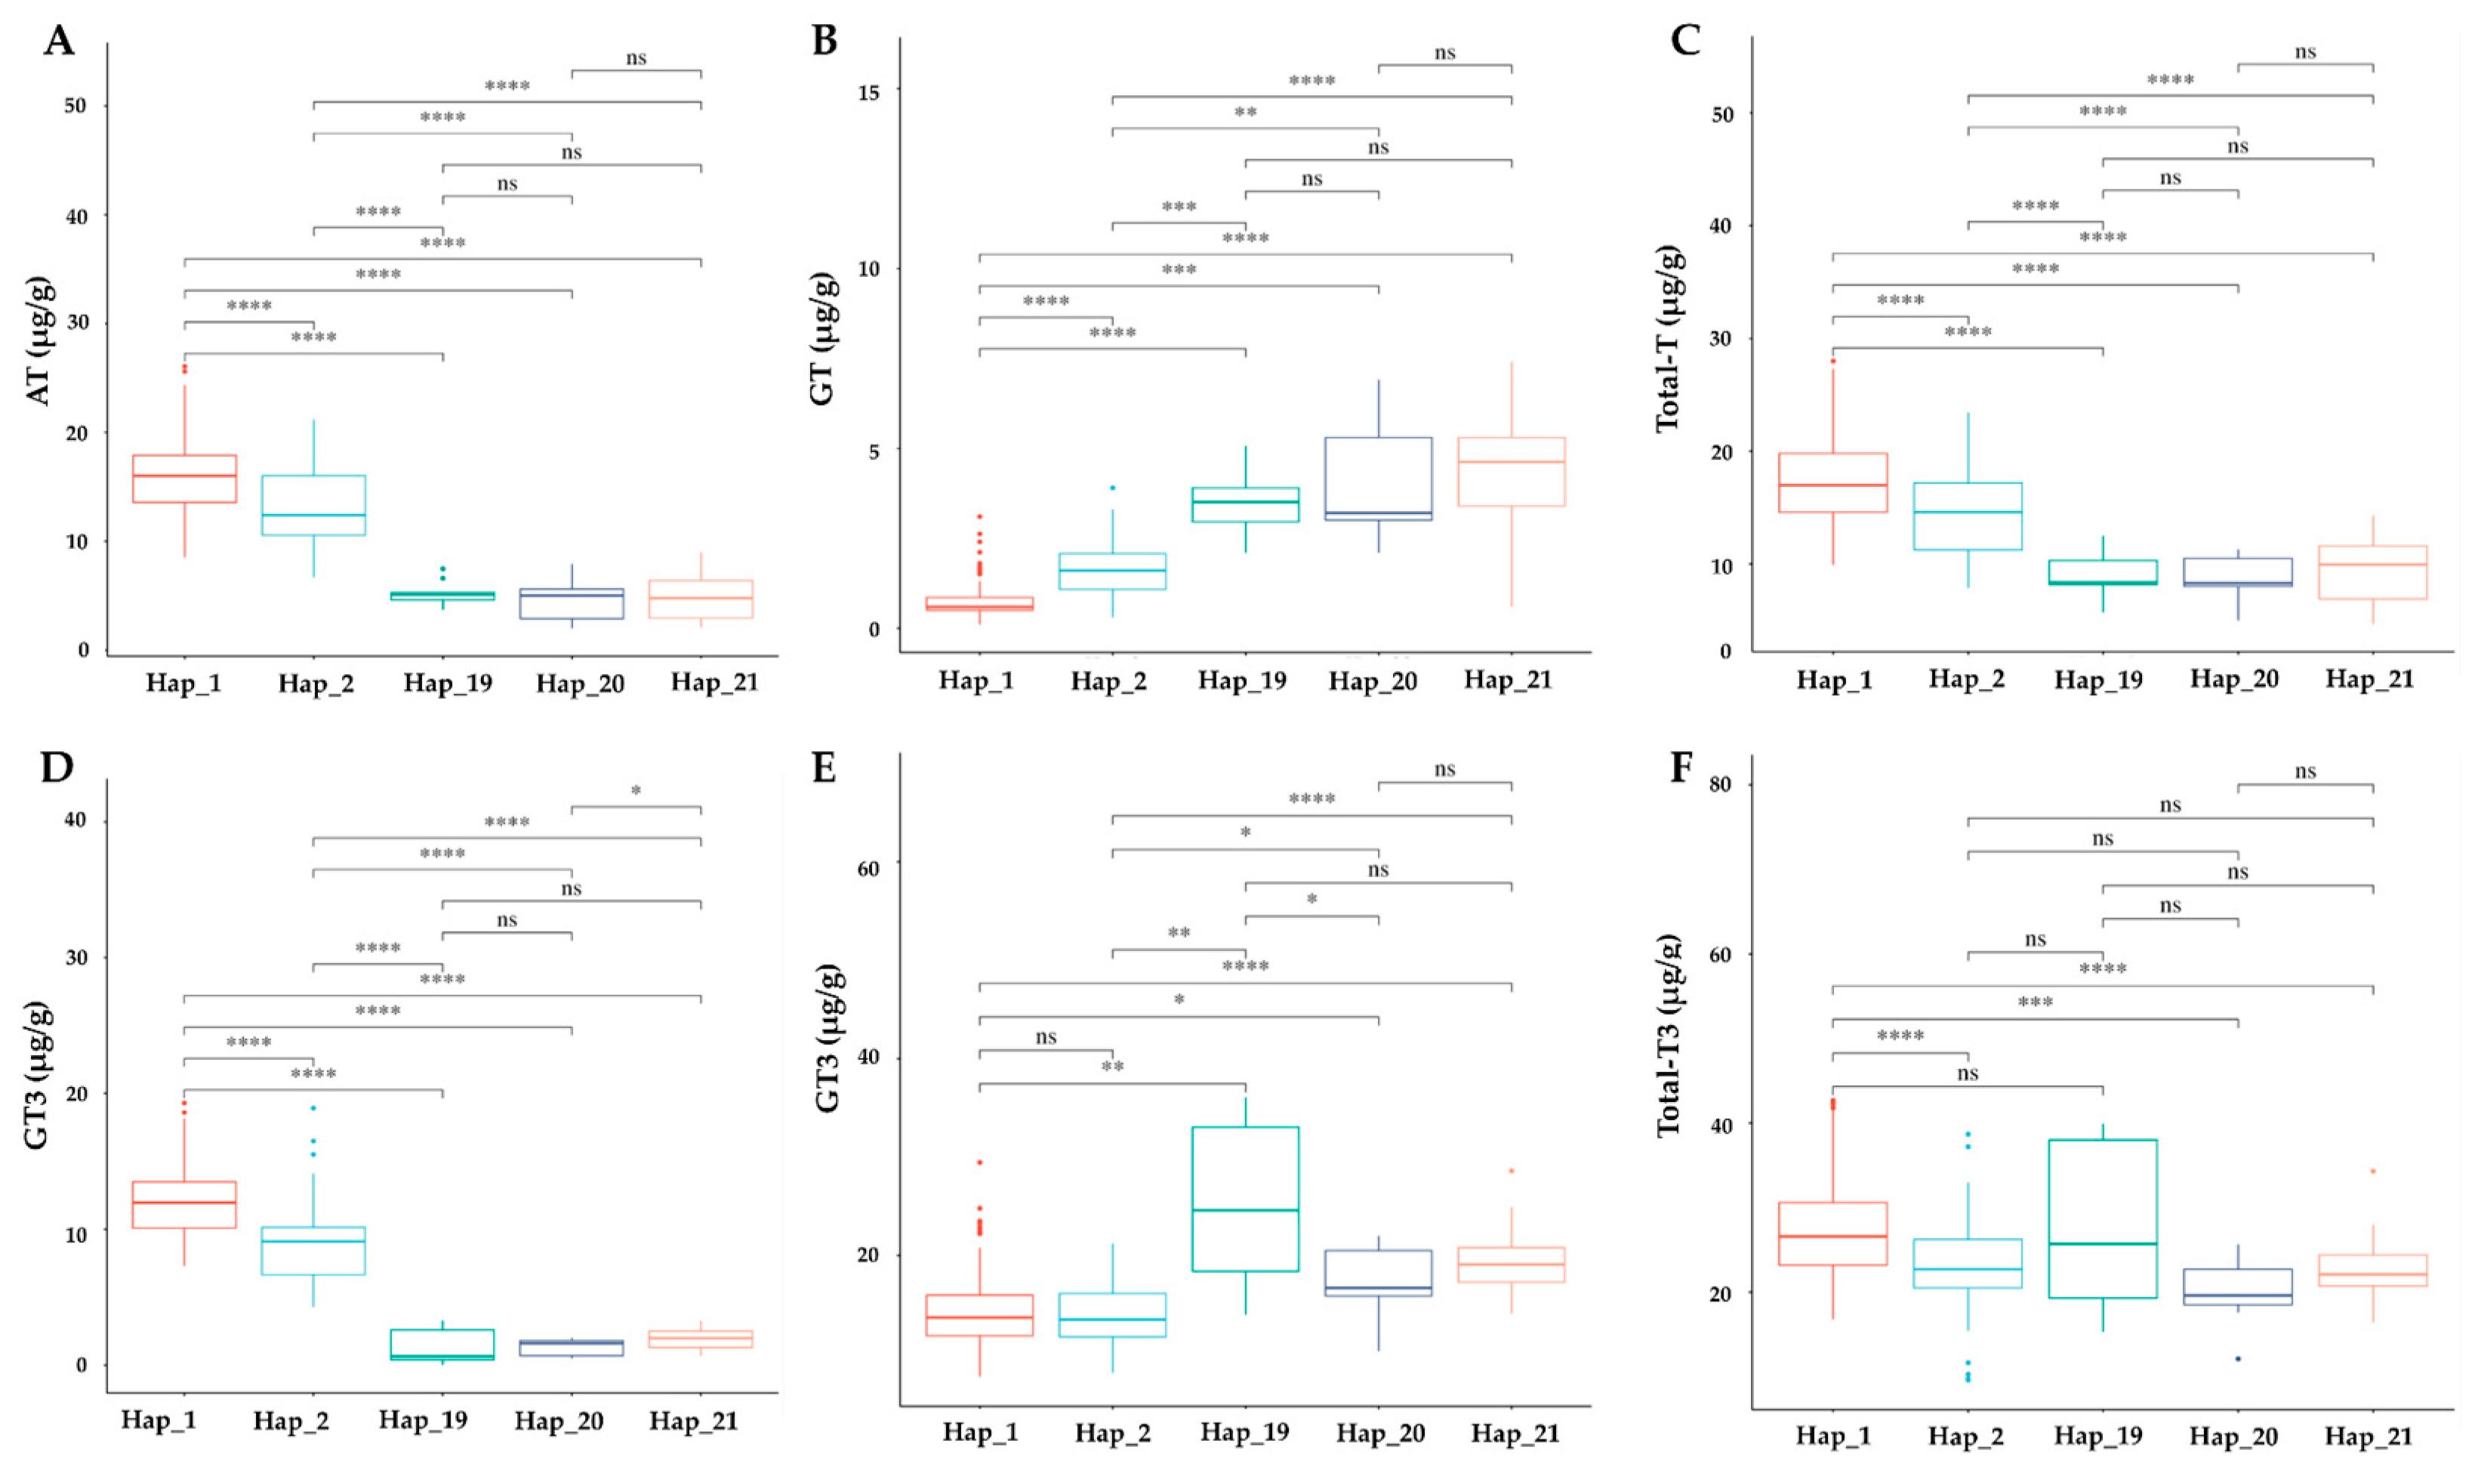
3.8. Phenotypic Effect of TMT Haplotypes on Tocochromanol Accumulation

We explored the association between γ-TMT haplotypes and tocochromanol concentrations in cultivated rice. The analyzed haplotypes included Hap_1 (138 accessions), Hap_2 (55 accessions), Hap_19 (9 accessions), Hap_20 (9 accessions), and Hap_21 (9 accessions), totaling 240 selected accessions (Table S5). Significant differences in the levels of α-tocopherol (AT), α-tocotrienol (AT3), total tocopherol (TT), and total tocotrienol (TT3) were observed across these haplotypes. Hap_1 displayed notably higher levels of these compounds, except for total tocotrienol, compared to Hap_19. Conversely, γ-tocopherol (GT) and γ-tocotrienol (GT3) contents were lower in Hap_1, with the exception of GT3 recorded between Hap_1 and Hap_2 (Figure 7). Hap_2 also exhibited higher AT, AT3, and total tocopherol levels, but lower GT and GT3 compared to Hap_19, Hap_20, and Hap_21. The latter three haplotypes showed no significant differences among themselves, except for AT3 between Hap_20 and Hap_21, and GT3 between Hap_19 and Hap_20 (Figure 7). Total vitamin content was significantly higher in Hap_1 and Hap_2 compared to other haplotypes (Figure S2). When comparing ecotypes, a significant decrease in AT, AT3, TT, and TT3 was observed in Hap_2 relative to Hap_1 among japonica accessions (Figure S3). In indica varieties, AT and AT3 levels were significantly lower in Hap_19 to Hap_21, while GT and γ-tocotrienol GT3 levels increased. However, TT and TT3 showed no significant differences, except between Hap_2 and Hap_19 for TT3 (Figure S4). In the aus group, accessions of Hap_2 and Hap_20 displayed significant differences in AT and AT3 levels (Figure S5). The total vitamin content did not show any significant variations in indica haplotypes, but in japonica and aus groups, a significant decrease was observed between Hap_1 and Hap_2, and between Hap_2 and Hap_20, respectively (Figure S6).

4. Discussion

The growing health consciousness and demand for nutritionally enriched foods have heightened interest in the nutritional quality of rice, particularly in relation to consumer acceptance. This trend has spurred the development of elite rice varieties enriched with bioactive compounds, especially focusing on enhancing vitamin E content [27]. Nonetheless, it is crucial to recognize that the vitamin E content in rice is profoundly influenced by both genetic variations among cultivars and environmental factors [47]. Given that vitamin E deficiency is linked to a variety of serious health issues worldwide [8,48] and humans cannot naturally synthesize this nutrient, dietary intake becomes essential [49].
The γ-TMT gene has emerged as a focal point in metabolic engineering efforts aimed at increasing α-tocopherol levels in crops [50]. In rice, two main subspecies are preferred in Asia: indica, predominantly grown in tropical and subtropical environments, and japonica, widely cultivated in temperate climates. These varieties display distinct divergences in morphological characteristics, agronomic traits, environmental adaptation, and physiological and biochemical properties through the domestication process [51]. Consequently, exploring genetic variations for micronutrient content in crops like rice is a vital strategy for improving the nutritional quality of human diets on a large scale [52]. In rice, the γ-TMT gene plays a pivotal role in vitamin E accumulation, particularly in japonica and indica varieties [7]. A comprehensive understanding of their evolutionary background and genetic diversity is key to deploying this knowledge for targeted improvements in rice breeding programs.
In our study, we investigated the genetic variation within the γ-TMT gene region, utilizing whole-genome resequencing data from a core set of 475 accessions. This approach facilitated our exploration of genetic diversity, evolutionary patterns, and haplotypes in the γ-TMT gene. Variant analysis of the γ-TMT gene revealed 177 genetic variants, comprising 138 SNPs and 39 InDels, with the highest level of genetic diversity observed in wild rice compared to its cultivated counterparts (Figure 1). In our population structure analysis, we observed a distinct separation of cultivated groups from wild types at most K-values, particularly from K = 5 to 7, indicating distinct cultivated groups (Figure 2A). Further PCA analysis revealed an admixture pattern in wild accessions, suggesting genetic overlap and allele sharing between wild and cultivated groups (Figure 2B). Additionally, genetic differentiation, assessed using the fixation index (FST), showed high FST values between indica and japonica groups (both tropical and temperate), implying significant genetic differentiation between these two subspecies (Figure 2C). The concept of nucleotide diversity, essential in molecular genetics, measures the degree of polymorphism within a population [50]. Our findings indicate a reduction in genetic diversity during domestication, more pronounced in the japonica group than in indica. This is evidenced by the lower nucleotide diversity in japonica following indica (Figure 3). Previous research has highlighted a narrower genetic diversity in japonica compared to indica rice, likely due to a domestication bottleneck [22,53]. Furthermore, breeding efforts over the past century have further narrowed the genetic diversity among cultivars, particularly those selected for cultivation in diverse agro-ecological environments [53,54]. In terms of Tajima’s D measurement, indica was the only group with a positive value, suggesting that rare alleles are more likely to be lost during bottleneck events [55]. Conversely, the occurrence of negative values in other groups, especially in wild rice, indicates an accumulation of segregation sites at rare frequencies, consistent with population expansion scenarios, such as selective sweeps or post-bottleneck expansion [55,56,57].
Analyzing haplotype variation offers a promising approach to identify different types of polymorphisms located on the same chromosome. These polymorphisms tend to be inherited together with minimal alteration due to contemporary recombination [58]. In our study, 27 distinct haplotypes were identified within the transcript region of all the rice accessions. Notably, the predominant haplotype, Hap_1, was shared between both cultivated and wild types, encompassing 278 accessions. Similarly, Hap_2, characterized by the SNP tmt-3UTR-28,897,360-T/A, was found in both wild and cultivated accessions. Additionally, two functional SNPs (fSNPs), tmt-E2-28,895,665-G/A and tmt-E4-28,896,689-A/G, leading to amino acid substitutions from valine (V) to isoleucine (I) and arginine (R) to glycine (G), respectively, were detected in 93 accessions. These accessions were distributed across five haplotypes due to variations in the 3′UTR (Figure 4). Interestingly, the fSNP tmt-E2-28,895,665-G/A was also identified in a genome-wide association study (GWAS) involving 137 accessions, where it was associated with AT content [7]. Among haplotypes, Hap_19, Hap_22, and Hap_24 were specific to indica varieties, while Hap_20 (comprising seven indica, four aus, and one admixture) and Hap_21 (fifty-five indica and one admixture) were predominantly found in indica accessions (Figure 4). To further explore the γ-genetic variants in a larger set of accessions, we queried the RiceVarMapv2.0 database (http://ricevarmap.ncpgr.cn/ accessed on 20 September 2023) [59]. Among a dataset of 4726 accessions, a total of 80 polymorphisms were detected, of which 59 were shared with KRICE. The A and G alleles of tmt-E2-28,895,665-G/A and tmt-E4-28,896,689-A/G, respectively, showed a frequency of 53.1% in all accessions, 85% in all indica, 92.3% in indica-I, 82.9 in indica-II, 49.4% in aus, and only 0.03% in tropical japonica, and 0.06% in temperate japonica (Table S6). This distribution underscores the genetic diversity and specificity of haplotypes in relation to rice ecotypes and their potential implications for rice breeding and improvement.
In our study, a detailed pairwise comparison among haplotypes revealed significant differences in tocochromanol content. Notably, the reference haplotype Hap_1 displayed significantly higher levels of α-tocopherol (AT), α-tocotrienol (AT3), and total tocopherol (TT) compared to other haplotypes, as determined by a pairwise t-test at a significance level of 0.005. However, γ-tocopherol (GT) and γ-tocotrienol (GT3) levels were notably lower in Hap_1, except GT3 when comparing Hap_1 to Hap_2 (Figure 7). Accessions with Hap_2, distinguished by the SNP tmt-3UTR-28,897,360-T/A, showed significant differences in all compounds compared to Hap_20, which harbors the same tmt-3UTR-28,897,360-T/A and two fSNPs (tmt-E2-28,895,665-G/A and tmt-E4-28,896,689-A/G) (Figure 7 and Figure S2). In the japonica group, Hap_2 was associated with significantly lower AT, AT3, TT, TT3, and total vitamin E content, but higher GT (Figures S3 and S6), while indica haplotypes, Hap_19 with two fSNPs (tmt-E2-28,895,665-G/A and tmt-E4-28,896,689-A/G), Hap-20, and Hap_21 (which possess tmt-3UTR-28,897,309-C/T and tmt-3UTR-28,897,387-T/A, respectively, in addition to two fSNPs), displayed no significant differences among them (Figure S4). UTRs, particularly the 3′ UTR, are known to contain elements that influence the stability, localization, and translation efficiency of mRNAs [60]. Research has shown that variations in the UTR regions can lead to differences in gene expression levels, which can impact traits such as grain size and yield [59,60]. The UTRs of genes involved in biosynthetic pathways can impact rice grain quality traits, nutritional properties [61,62,63,64,65], and herbicide resistance. Overall, variations in the γ-TMT gene underscore the effect of haplotype variation in determining the tocochromanol contents of rice ecotypes.

5. Conclusions

This study leveraged resequencing data from 475 rice accessions to delve into the evolutionary aspects and genetic diversity within the γ-TMT gene region. We identified a total of 177 genetic variants in the γ-TMT region, forming 27 haplotypes. Our genetic diversity analyses highlighted variations among the different rice ecotypes. Phenotypic analysis revealed significant variations in vitamin E profiles, particularly linked to two functional SNPs (fSNPs), tmt-E2-28,895,665-G/A and tmt-E4-28,896,689-A/G, and a 3’ UTR SNP (tmt-3UTR-28,897,360-T/A), impacting vitamin E isomers in both japonica and indica accessions. Overall, our research provides insights into the genetic diversity and evolutionary dynamics of the γ-TMT gene in rice, especially in the context of enhancing its vitamin E content. Through an extensive analysis of various Korean rice accessions, we have pinpointed key genetic variants and haplotypes that significantly influence rice’s nutritional quality. These findings are instrumental for future rice breeding programs aimed at improving the health benefits of this staple crop.

Supplementary Materials

The following supporting information can be downloaded at: https://www.mdpi.com/article/10.3390/antiox13020234/s1, Figure S1: Vitamin E standard (a) Chromatogram of mixed standard for eight tocochromanol isomers; Figure S2: Variation in total vitamin E content among the haplotypes; Figure S3: Evaluation of japonica haplotypes impact on vitamin E profile; Figure S4: Evaluation of indica haplotypes impact on vitamin E profile; Figure S5: Evaluation of aus haplotypes impact on vitamin E profile; Figure S6: Evaluation of haplotypes impact on total vitamin E content; Table S1: Passport information of the Korean rice collection of 475 accessions used in this study; Table S2: Pairwise estimation of genetic differentiation (FST values) of the γ-TMT gene region among ecotypes of Korean rice collection; Table S3: Details of genetic variants detected in γ-TMT gene of Korean rice collection; Table S4: List of haplotype and accessions found in γ-TMT gene of Korean rice collection; Table S5: Vitamin E profiling of selected 240 accessions from haplotypes from Korean rice collection; Table S6: Genetic variants in γ-TMT gene region and its allele frequency distribution in different ecotypes of 4726 rice accessions.

Author Contributions

Conceptualization, Y.-J.P.; methodology, A.S. and S.-H.C.; software, A.S., S.-H.C. and B.N.; validation, Y.-J.P. and S.-H.C.; formal analysis, A.S., S.-H.C. and B.N.; investigation, A.S.; resources, Y.-J.P. and S.-H.C.; writing—original draft preparation, A.S. and B.N.; writing—review and editing, Y.-J.P., S.-H.C., B.N. and C.-Y.L.; supervision, Y.-J.P.; project administration, Y.-J.P.; funding acquisition, Y.-J.P. All authors have read and agreed to the published version of the manuscript.

Funding

This work was supported by National Research Foundation of Korea (NRF) grants funded by the Korean government (MSIT) (No. NRF-2022R1A4A1030348 and 2023R1A2C1004432).

Institutional Review Board Statement

Not applicable.

Informed Consent Statement

Not applicable.

Data Availability Statement

Data are contained within the article and Supplementary Materials.

Conflicts of Interest

The authors declare no conflicts of interest.

References

  1. Mène-Saffrané, L.; Jones, A.D.; DellaPenna, D. Plastochromanol-8 and tocopherols are essential lipid-soluble antioxidants during seed desiccation and quiescence in Arabidopsis. Proc. Natl. Acad. Sci. USA 2010, 107, 17815–17820. [Google Scholar] [CrossRef]
  2. Maeda, H.; Sakuragi, Y.; Bryant, D.A.; DellaPenna, D. Tocopherols protect Synechocystis sp. strain PCC 6803 from lipid peroxidation. Plant Physiol. 2005, 138, 1422–1435. [Google Scholar] [CrossRef]
  3. Muñoz, P.; Briones, M.; Munné-Bosch, S. Photoinhibition and photoprotection during flower opening in lilies. Plant Sci. 2018, 272, 220–229. [Google Scholar] [CrossRef] [PubMed]
  4. Stacey, M.G.; Cahoon, R.E.; Nguyen, H.T.; Cui, Y.; Sato, S.; Nguyen, C.T.; Phoka, N.; Clark, K.M.; Liang, Y.; Forrester, J.; et al. Identification of homogentisate dioxygenase as a target for vitamin E biofortification in oilseeds. Plant Physiol. 2016, 172, 1506–1518. [Google Scholar] [CrossRef] [PubMed]
  5. Zhang, Y.; Liu, K.; Zhu, X.; Wu, Y.; Zhang, S.; Chen, H.; Ling, J.; Wang, Y.; Fang, X. Rice tocopherol deficiency 1 encodes a homogentisate phytyltransferase essential for tocopherol biosynthesis and plant development in rice. Plant Cell Rep. 2018, 37, 775–787. [Google Scholar] [CrossRef] [PubMed]
  6. Yang, W.; Cahoon, R.E.; Hunter, S.C.; Zhang, C.; Han, J.; Borgschulte, T.; Cahoon, E.B. Vitamin E biosynthesis: Functional characterization of the monocot homogentisate geranylgeranyl transferase. Plant J. 2011, 65, 206–217. [Google Scholar] [CrossRef] [PubMed]
  7. Wang, X.-Q.; Yoon, M.-Y.; He, Q.; Kim, T.-S.; Tong, W.; Choi, B.-W.; Lee, Y.-S.; Park, Y.-J. Natural variations in OsγTMT contribute to diversity of the α-tocopherol content in rice. Mol. Genet. Genom. 2015, 290, 2121–2135. [Google Scholar] [CrossRef] [PubMed]
  8. Das, A.K.; Muthusamy, V.; Zunjare, R.U.; Baveja, A.; Chauhan, H.S.; Bhat, J.S.; Guleria, S.K.; Kumar, B.; Saha, S.; Hossain, F. Genetic variability for kernel tocopherols and haplotype analysis of γ-tocopherol methyl transferase (vte4) gene among exotic- and indigenous- maize inbreds. J. Food Compos. Anal. 2020, 88, 103446. [Google Scholar] [CrossRef]
  9. Wong, R.S.; Radhakrishnan, A.K. Tocotrienol research: Past into present. Nutr. Rev. 2012, 70, 483–490. [Google Scholar] [CrossRef]
  10. Tanaka, H.; Yabuta, Y.; Tamoi, M.; Tanabe, N.; Shigeoka, S. Generation of transgenic tobacco plants with enhanced tocotrienol levels through the ectopic expression of rice homogentisate geranylgeranyl transferase. Plant Biotechnol. 2015, 32, 233–238. [Google Scholar] [CrossRef]
  11. Lushchak, V.I.; Semchuk, N.M. Tocopherol biosynthesis: Chemistry, regulation and effects of environmental factors. Acta Physiol. Plant. 2012, 34, 1607–1628. [Google Scholar] [CrossRef]
  12. Chaudhary, N.; Khurana, P. Vitamin E biosynthesis genes in rice: Molecular characterization, expression profiling and comparative phylogenetic analysis. Plant Sci. 2009, 177, 479–491. [Google Scholar] [CrossRef]
  13. Dwiyanti, M.S.; Yamada, T.; Sato, M.; Abe, J.; Kitamura, K. Genetic variation of γ-tocopherol methyltransferase gene contributes to elevated α-tocopherol content in soybean seeds. BMC Plant Biol. 2011, 11, 152. [Google Scholar] [CrossRef] [PubMed]
  14. Mène-Saffrané, L. Vitamin E biosynthesis and its regulation in plants. Antioxidants 2017, 7, 2. [Google Scholar] [CrossRef] [PubMed]
  15. Van Eenennaam, A.L.; Lincoln, K.; Durrett, T.P.; Valentin, H.E.; Shewmaker, C.K.; Thorne, G.M.; Jiang, J.; Baszis, S.R.; Levering, C.K.; Aasen, E.D.; et al. Engineering vitamin E content: From Arabidopsis mutant to soy oil. Plant Cell 2003, 15, 3007–3019. [Google Scholar] [CrossRef] [PubMed]
  16. Almeida, J.; Quadrana, L.; Asís, R.; Setta, N.; De Godoy, F.; Bermúdez, L.; Otaiza, S.N.; Corrêa Da Silva, J.V.; Fernie, A.R.; Carrari, F.; et al. Genetic dissection of vitamin E biosynthesis in tomato. J. Exp. Bot. 2011, 62, 3781–3798. [Google Scholar] [CrossRef] [PubMed]
  17. Hwang, J.E.; Ahn, J.-W.; Kwon, S.-J.; Kim, J.-B.; Kim, S.H.; Kang, S.-Y.; Kim, D.S. Selection and molecular characterization of a high tocopherol accumulation rice mutant line induced by gamma irradiation. Mol. Biol. Rep. 2014, 41, 7671–7681. [Google Scholar] [CrossRef] [PubMed]
  18. Zhao, M.; Lin, Y.; Chen, H. Improving nutritional quality of rice for human health. Theor. Appl. Genet. 2020, 133, 1397–1413. [Google Scholar] [CrossRef]
  19. Londo, J.P.; Chiang, Y.-C.; Hung, K.-H.; Chiang, T.-Y.; Schaal, B.A. Phylogeography of Asian wild rice, Oryza rufipogon, reveals multiple independent domestications of cultivated rice, Oryza Sativa. Proc. Natl. Acad. Sci. USA 2006, 103, 9578–9583. [Google Scholar] [CrossRef]
  20. Hoang, A.T.P.; Prinpreecha, N.; Kim, K.-W. Influence of mining activities on arsenic concentration in rice in Asia: A Review. Minerals 2021, 11, 472. [Google Scholar] [CrossRef]
  21. Sajid, M.; Khan, S.A.; Khurshid, H.; Iqbal, J.; Muhammad, A.; Saleem, N.; Shah, S.M.A. Characterization of rice (Oryza Sativa L.) germplasm through various agro-morphological traits. Sci. Agric. 2015, 9, 83–88. [Google Scholar] [CrossRef]
  22. Garris, A.J.; Tai, T.H.; Coburn, J.; Kresovich, S.; McCouch, S. Genetic structure and diversity in Oryza Sativa L. Genetics 2005, 169, 1631–1638. [Google Scholar] [CrossRef]
  23. Oka, H.I. Origin of Cultivated Rice; Elsevier: Amsterdam, The Netherlands, 2012; Volume 14, ISBN 0-444-98919-6. [Google Scholar]
  24. Khush, G.S. Origin, dispersal, cultivation and variation of rice. Plant Mol. Biol. 1997, 35, 25–34. [Google Scholar] [CrossRef]
  25. Bhandari, A.; Sandhu, N.; Bartholome, J.; Cao-Hamadoun, T.-V.; Ahmadi, N.; Kumari, N.; Kumar, A. Genome-wide association study for yield and yield related traits under reproductive stage drought in a diverse indica-aus rice panel. Rice 2020, 13, 53. [Google Scholar] [CrossRef]
  26. Huang, X.; Kurata, N.; Wei, X.; Wang, Z.-X.; Wang, A.; Zhao, Q.; Zhao, Y.; Liu, K.; Lu, H.; Li, W.; et al. A map of rice genome variation reveals the origin of cultivated rice. Nature 2012, 490, 497–501. [Google Scholar] [CrossRef] [PubMed]
  27. Shammugasamy, B.; Ramakrishnan, Y.; Ghazali, H.M.; Muhammad, K. Tocopherol and tocotrienol contents of different varieties of rice in Malaysia. J. Sci. Food Agric. 2015, 95, 672–678. [Google Scholar] [CrossRef] [PubMed]
  28. Guo, Y.; Li, D.; Liu, T.; Liao, M.; Li, Y.; Zhang, W.; Liu, Z.; Chen, M. Effect of overexpression of γ-tocopherol methyltransferase on α-tocopherol and fatty acid accumulation and tolerance to salt stress during seed germination in Brassica napus L. Int. J. Mol. Sci. 2022, 23, 15933. [Google Scholar] [CrossRef] [PubMed]
  29. Li, Q.; Yang, X.; Xu, S.; Cai, Y.; Zhang, D.; Han, Y.; Li, L.; Zhang, Z.; Gao, S.; Li, J.; et al. Genome-wide association studies identified three independent polymorphisms associated with α-tocopherol content in maize kernels. PLoS ONE 2012, 7, e36807. [Google Scholar] [CrossRef] [PubMed]
  30. Xie, L.; Yu, Y.; Mao, J.; Liu, H.; Hu, J.; Li, T.; Guo, X.; Liu, R. Evaluation of biosynthesis, accumulation and antioxidant activity of vitamin E in sweet corn (Zea Mays L.) during kernel development. Int. J. Mol. Sci. 2017, 18, 2780. [Google Scholar] [CrossRef] [PubMed]
  31. Zhang, G.-Y.; Liu, R.-R.; Zhang, P.; Xu, Y.; Zhu, J.; Gu, M.-H.; Liang, G.-H.; Liu, Q.-Q. Variation and distribution of vitamin E and composition in seeds among different rice varieties. Acta Agron. Sin. 2012, 38, 55–61. [Google Scholar] [CrossRef]
  32. Shintani, D.; DellaPenna, D. Elevating the vitamin E content of plants through metabolic engineering. Science 1998, 282, 2098–2100. [Google Scholar] [CrossRef]
  33. Zhang, G.-Y.; Liu, R.-R.; Xu, G.; Zhang, P.; Li, Y.; Tang, K.-X.; Liang, G.-H.; Liu, Q.-Q. Increased α-tocotrienol content in seeds of transgenic rice overexpressing Arabidopsis γ-Tocopherol Methyltransferase. Transgenic. Res. 2013, 22, 89–99. [Google Scholar] [CrossRef] [PubMed]
  34. Kim, K.-W.; Chung, H.-K.; Cho, G.-T.; Ma, K.-H.; Chandrabalan, D.; Gwag, J.-G.; Kim, T.-S.; Cho, E.-G.; Park, Y.-J. PowerCore: A program applying the advanced m strategy with a heuristic search for establishing core sets. Bioinformatics 2007, 23, 2155–2162. [Google Scholar] [CrossRef]
  35. Phitaktansakul, R.; Kim, K.-W.; Aung, K.M.; Maung, T.Z.; Min, M.-H.; Somsri, A.; Lee, W.; Lee, S.-B.; Nam, J.; Kim, S.-H.; et al. Multi-omics analysis reveals the genetic basis of rice fragrance mediated by betaine aldehyde dehydrogenase 2. J. Adv. Res. 2022, 42, 303–314. [Google Scholar] [CrossRef] [PubMed]
  36. Danecek, P.; Auton, A.; Abecasis, G.; Albers, C.A.; Banks, E.; DePristo, M.A.; Handsaker, R.E.; Lunter, G.; Marth, G.T.; Sherry, S.T.; et al. The variant call format and VCFtools. Bioinformatics 2011, 27, 2156–2158. [Google Scholar] [CrossRef]
  37. Li, H.; Durbin, R. Fast and accurate long-read alignment with Burrows–Wheeler transform. Bioinformatics 2010, 26, 589–595. [Google Scholar] [CrossRef]
  38. McKenna, A.; Hanna, M.; Banks, E.; Sivachenko, A.; Cibulskis, K.; Kernytsky, A.; Garimella, K.; Altshuler, D.; Gabriel, S.; Daly, M.; et al. The genome analysis toolkit: A MapReduce framework for analyzing next-generation DNA sequencing data. Genome Res. 2010, 20, 1297–1303. [Google Scholar] [CrossRef] [PubMed]
  39. Bradbury, P.J.; Zhang, Z.; Kroon, D.E.; Casstevens, T.M.; Ramdoss, Y.; Buckler, E.S. TASSEL: Software for association mapping of complex traits in diverse samples. Bioinformatics 2007, 23, 2633–2635. [Google Scholar] [CrossRef]
  40. Raj, A.; Stephens, M.; Pritchard, J.K. fastSTRUCTURE: Variational inference of population structure in large SNP data sets. Genetics 2014, 197, 573–589. [Google Scholar] [CrossRef]
  41. Francis, R.M. POPHELPER: An R package and web App to analyse and visualize population structure. Mol. Ecol. Resour. 2017, 17, 27–32. [Google Scholar] [CrossRef]
  42. Kumar, S.; Stecher, G.; Li, M.; Knyaz, C.; Tamura, K. MEGA X: Molecular evolutionary genetics analysis across computing platforms. Mol. Biol. Evol. 2018, 35, 1547–1549. [Google Scholar] [CrossRef]
  43. Rozas, J.; Ferrer-Mata, A.; Sánchez-DelBarrio, J.C.; Guirao-Rico, S.; Librado, P.; Ramos-Onsins, S.E.; Sánchez-Gracia, A. DnaSP 6: DNA sequence polymorphism analysis of large data sets. Mol. Biol. Evol. 2017, 34, 3299–3302. [Google Scholar] [CrossRef] [PubMed]
  44. Leigh, J.W.; Bryant, D. POPART: Full-feature software for haplotype network construction. Methods Ecol. Evol. 2015, 6, 1110–1116. [Google Scholar] [CrossRef]
  45. Letunic, I.; Bork, P. Interactive tree of life (iTOL) v5: An online tool for phylogenetic tree display and annotation. Nucleic Acids Res. 2021, 49, W293–W296. [Google Scholar] [CrossRef] [PubMed]
  46. Bhandari, S.R.; Basnet, S.; Chung, K.H.; Ryu, K.-H.; Lee, Y.-S. Comparisons of nutritional and phytochemical property of genetically modified cmv-resistant red pepper and its parental cultivar. Hortic. Environ. Biotechnol. 2012, 53, 151–157. [Google Scholar] [CrossRef]
  47. Bergman, C.J.; Xu, Z. Genotype and environment effects on tocopherol, tocotrienol, and γ-Oryzanol contents of southern U.S. rice. Cereal Chem. 2003, 80, 446–449. [Google Scholar] [CrossRef]
  48. Dror, D.K.; Allen, L.H. Vitamin E deficiency in developing countries. Food Nutr. Bull. 2011, 32, 124–143. [Google Scholar] [CrossRef] [PubMed]
  49. Miyazawa, T.; Burdeos, G.C.; Itaya, M.; Nakagawa, K.; Miyazawa, T. Vitamin E: Regulatory redox interactions. IUBMB Life 2019, 71, 430–441. [Google Scholar] [CrossRef]
  50. Fritsche, S.; Wang, X.; Jung, C. Recent advances in our understanding of tocopherol biosynthesis in plants: An overview of key genes, functions, and breeding of vitamin E improved crops. Antioxidants 2017, 6, 99. [Google Scholar] [CrossRef]
  51. Yang, Y.; Zhu, K.; Xia, H.; Chen, L.; Chen, K. Comparative proteomic analysis of indica and japonica rice varieties. Genet. Mol. Biol. 2014, 37, 652–661. [Google Scholar] [CrossRef]
  52. Palanisamy, S. Genetic analysis of biofortification of micronutrient breeding in rice (Oryza Sativa L.). In Rice Crop—Current Developments; Shah, F., Khan, Z.H., Iqbal, A., Eds.; InTech: London, UK, 2018; ISBN 978-1-78923-600-2. [Google Scholar]
  53. Reig-Valiente, J.L.; Viruel, J.; Sales, E.; Marqués, L.; Terol, J.; Gut, M.; Derdak, S.; Talón, M.; Domingo, C. Genetic diversity and population structure of rice varieties cultivated in temperate regions. Rice 2016, 9, 58. [Google Scholar] [CrossRef] [PubMed]
  54. Min, M.-H.; Maung, T.Z.; Cao, Y.; Phitaktansakul, R.; Lee, G.-S.; Chu, S.-H.; Kim, K.-W.; Park, Y.-J. Haplotype analysis of Badh1 by next-generation sequencing reveals association with salt tolerance in rice during domestication. Int. J. Mol. Sci. 2021, 22, 7578. [Google Scholar] [CrossRef] [PubMed]
  55. Zhai, T.; Yang, H.-Q.; Zhang, R.-C.; Fang, L.-M.; Zhong, G.-H.; Fang, S.-G. Effects of population bottleneck and balancing selection on the chinese alligator are revealed by locus-specific characterization of MHC genes. Sci. Rep. 2017, 7, 5549. [Google Scholar] [CrossRef]
  56. Carlson, C.S.; Thomas, D.J.; Eberle, M.A.; Swanson, J.E.; Livingston, R.J.; Rieder, M.J.; Nickerson, D.A. Genomic regions exhibiting positive selection identified from dense genotype data. Genome Res. 2005, 15, 1553–1565. [Google Scholar] [CrossRef]
  57. Tajima, F. Statistical method for testing the neutral mutation hypothesis by DNA polymorphism. Genetics 1989, 123, 585–595. [Google Scholar] [CrossRef] [PubMed]
  58. Bhat, J.A.; Yu, D.; Bohra, A.; Ganie, S.A.; Varshney, R.K. Features and applications of haplotypes in crop breeding. Commun. Biol. 2021, 4, 1266. [Google Scholar] [CrossRef]
  59. Zhao, H.; Li, J.; Yang, L.; Qin, G.; Xia, C.; Xu, X.; Su, Y.; Liu, Y.; Ming, L.; Chen, L.-L.; et al. An inferred functional impact map of genetic variants in rice. Mol. Plant 2021, 14, 1584–1599. [Google Scholar] [CrossRef]
  60. Mignone, F. UTRdb and UTRsite: A Collection of sequences and regulatory motifs of the untranslated regions of eukaryotic mRNAs. Nucleic Acids Res. 2004, 33, D141–D146. [Google Scholar] [CrossRef]
  61. Si, L.; Chen, J.; Huang, X.; Gong, H.; Luo, J.; Hou, Q.; Zhou, T.; Lu, T.; Zhu, J.; Shangguan, Y.; et al. OsSPL13 controls grain size in cultivated rice. Nat. Genet. 2016, 48, 447–456. [Google Scholar] [CrossRef]
  62. Peng, B.; Kong, H.; Li, Y.; Wang, L.; Zhong, M.; Sun, L.; Gao, G.; Zhang, Q.; Luo, L.; Wang, G.; et al. OsAAP6 functions as an important regulator of grain protein content and nutritional quality in rice. Nat. Commun. 2014, 5, 4847. [Google Scholar] [CrossRef]
  63. Gong, D.; Zhang, X.; He, F.; Chen, Y.; Li, R.; Yao, J.; Zhang, M.; Zheng, W.; Yu, G. Genetic improvements in rice grain quality: A review of elite genes and their applications in molecular breeding. Agronomy 2023, 13, 1375. [Google Scholar] [CrossRef]
  64. Cai, X.; Wang, Z.; Xing, Y.; Zhang, J.; Hong, M. Aberrant splicing of intron 1 leads to the heterogeneous 5′ UTR and decreased expression of Waxy gene in rice cultivars of intermediate amylose content. Plant J. 1998, 14, 459–465. [Google Scholar] [CrossRef] [PubMed]
  65. Wu, Y.; Xiao, N.; Cai, Y.; Yang, Q.; Yu, L.; Chen, Z.; Shi, W.; Liu, J.; Pan, C.; Li, Y.; et al. CRISPR-Cas9-mediated editing of the OsHPPD 3′ UTR confers enhanced resistance to HPPD-inhibiting herbicides in rice. Plant Commun. 2023, 4, 100605. [Google Scholar] [CrossRef] [PubMed]
Figure 1. Genetic variants in γ-TMT gene region. (A) Distribution of SNPs and indels in γ-TMT gene region. (B) Distribution of SNPs and indels among the ecotypes of KRICE. Te_J: Temperate japonica, Tr_J: Tropical japonica.
Antioxidants 13 00234 g001
Figure 2. Population structure of KRICE based on the γ-TMT gene. (A) Population structure of all ecotypes visualized through fastStructure for K-values ranging from 2 to 7, where each color represents a distinct cluster. (B) Principal component analysis (PCA) rice accessions. Circle-A: japonica, wild, aromatic, and some indica accessions; Circle-B: aus and indica accessions; Circle-C: exclusively indica accessions. (C) Pairwise estimation of genetic differentiation (FST) among the ecotypes. Te_: Temperate, Tr_: Tropical.
Antioxidants 13 00234 g002
Figure 3. Nucleotide diversity and Tajima’s D values based on γ-TMT region across ecotypes of KRICE. (A) Variation in mean nucleotide diversity among the ecotypes. Different letters above each boxplot indicate significant differences among ecotypes according to Sheffe’s test (p < 0.05). (B) Nucleotide diversity values with 500 bp sliding window. The highlighted gray color shows the γ-TMT gene region. (C) Variation in mean Tajima’s D values among the ecotypes. Different letters above each boxplot indicate significant differences among ecotypes according to Sheffe’s test (p < 0.05). (D) Tajima’s D values with 500 bp sliding window. The highlighted gray color shows the γ-TMT gene region.
Antioxidants 13 00234 g003
Figure 4. Atlas of haplotype variations in γ-TMT transcript region. The distribution of functional SNPs with respective haplotypes is shown with the number of accessions from each ecotype. SNPs and indels are highlighted in blue- and green-colored boxes, respectively, and the blank cell represents the same SNP as the reference.
Antioxidants 13 00234 g004
Figure 5. Phylogenetic analysis of KRICE based on γ-TMT. Circular dendrogram constructed using the neighbor-joining method with 1000 bootstraps. Te_J: Temperate japonica, Tr_J: Tropical japonica, Ind: Indica, Aro: Aromatic, Adm: Admixture.
Antioxidants 13 00234 g005
Figure 6. Haplotype network of KRICE based on γ-TMT transcript region. The circle size is proportional to the number of samples and ecotypes, and the dashes between haplotypes represent mutational steps between alleles.
Antioxidants 13 00234 g006
Figure 7. Evaluation of haplotype impact on vitamin E profile. Boxplot showing the impact of haplotypes on (A) AT, α-tocopherol; (B) GT, γ-tocopherol; (C) Total_T, total tocopherol; (D) AT3, α-tocotrienol; (E) GT3, γ-tocotrienol; (F) Total_T3, total tocotrienol. The significant difference between each haplotype was investigated with p < 0.0001, 0.001, 0.01, 0.05 indicated by ****, ***, **, * and ns (non-significant) based on t-test statistics.
Antioxidants 13 00234 g007
Disclaimer/Publisher’s Note: The statements, opinions and data contained in all publications are solely those of the individual author(s) and contributor(s) and not of MDPI and/or the editor(s). MDPI and/or the editor(s) disclaim responsibility for any injury to people or property resulting from any ideas, methods, instructions or products referred to in the content.

