Article

First Characterization of a Cyanobacterial Xi-Class Glutathione S-Transferase in Synechocystis PCC 6803

Université Paris-Saclay, CEA, CNRS, Institute for Integrative Biology of the Cell (I2BC), 91198 Gif-sur-Yvette, France
*
Author to whom correspondence should be addressed.
Antioxidants 2024, 13(12), 1577; https://doi.org/10.3390/antiox13121577
Submission received: 8 November 2024 / Revised: 13 December 2024 / Accepted: 17 December 2024 / Published: 20 December 2024

Abstract

:
Glutathione S-transferases (GSTs) are evolutionarily conserved enzymes crucial for cell detoxication. They are viewed as having evolved in cyanobacteria, the ancient photosynthetic prokaryotes that colonize our planet and play a crucial role for its biosphere. Xi-class GSTs, characterized by their specific glutathionyl–hydroquinone reductase activity, have been observed in prokaryotes, fungi and plants, but have not yet been studied in cyanobacteria. In this study, we have analyzed the presumptive Xi-class GST, designated as Slr0605, of the unicellular model cyanobacterium Synechocystis PCC 6803. We report that Slr0605 is a homodimeric protein that has genuine glutathionyl–hydroquinone reductase activity. Though Slr0605 is not essential for cell growth under standard photoautotrophic conditions, it plays a prominent role in the protection against not only benzoquinone, but also cobalt-excess stress. Indeed, Slr0605 acts in defense against the cobalt-elicited disturbances of iron homeostasis, iron–sulfur cluster repair, catalase activity and the level of reactive oxygen species, which are all crucial for cell life.

Graphical Abstract

1. Introduction

Glutathione S-transferases (GSTs, EC 2.5.1.18) constitute a superfamily of evolutionarily conserved enzymes acting in cell detoxication [1], which have great importance for human health [2,3] and agriculture [4,5]. They conjugate the crucial antioxidant metabolite glutathione (γ-glutamyl-cysteinyl-glycine, GSH) on many endogenous or exogenous molecules (metabolite by-products, chemicals, metals, oxidants), which are then detoxified and/or eliminated [6,7,8,9]. GSTs can also modulate protein activity by glutathionylation/deglutathionylation (the formation/reduction of a disulfide bridge between the cysteinyl residue of GSH and the cysteinyl residue of a target protein) [10,11].
Glutathione S-transferases are commonly divided into various families named with Greek letters: alpha, beta, chi, …, xi and zeta. Xi-class GSTs have been recently identified as being specifically endowed with glutathionyl–hydroquinone reductase activity. They are widely distributed in prokaryotes, fungi and plants [12,13,14], but their role in stress tolerance has been overlooked. Furthermore, Xi-class GSTs have not been studied in cyanobacteria, although these photosynthetic prokaryotes are regarded as the originators of GSH-dependent enzymes that protect themselves from the metabolic and environmental stresses they frequently experience [1,15,16]. Furthermore, in colonizing our planet, cyanobacteria are very important organisms that produce a large amount of biomass and oxygen for our food chain [17]. Hence, they constitute the first biological barrier against the entry of pollutants, like heavy metals, into our food web, which are increasingly being released into the environment by natural sources (volcanoes or forest fires) and anthropogenic activities (mining, fossil-fuels burning, metallurgy, etc.) [18]. Moreover, cyanobacteria have great biotechnological potential for bioremediation and the bioproduction of chemicals from solar energy, water (fresh and/or marine) and CO2 [19,20].
The model unicellular cyanobacterium Synechocystis PCC 6803 (hereafter Synechocystis) is suitable for in vivo analysis of GSTs, with its small (4.0 Mb) manipulable genome encoding six evolutionarily conserved GSTs, designated as Sll0067, Sll1147, Sll1545, Sll1902, Slr0236 and Slr0605 [1,21]. Both Sll1545 and Slr0236 were found to contribute to protection against photo-oxidative stress [21,22,23], while Sll1147 was shown to contribute to resistance to heat and lipid peroxidation [24]. Sll0067 appeared to act in the detoxication of isothiocyanates [25] and methylglyoxal [6,26], the latter of which is a metabolic by-product causing diabetes in humans [1] and age-related disorders [27].
In this study, we have analyzed the role of the presumptive Xi-class GST, Slr0605, using deletion/complementation, purification from Synechocystis and enzyme assays. We report that Slr0605 plays a role in defending against excess cobalt (Co), a metal required in trace amounts for the synthesis of vitamin B12 and other cobalamins [28,29,30], which can become toxic at high doses [31]. We also show that Slr0605 is a true Xi-class GST, endowed with a genuine dimeric form and glutathionyl–hydroquinone reductase activity. Furthermore, Slr0605 plays an important role in protecting against Co-elicited disturbances of iron (Fe) homeostasis and the biogenesis/repair of enzymatic iron–sulfur [Fe-S] clusters, which trigger oxidative stress.

2. Materials and Methods

2.1. Bacterial Strains, Growth Conditions and Gene-Transfer Procedures

Escherichia coli (E. coli) strains (Table S1) used for gene manipulations (TOP10 and NEB10 beta) or the conjugative transfer (CM404) of the RSF1010-derived replicative plasmids to Synechocystis PCC 6803 (Synechocystis) were grown at 37 °C (TOP10 and NEB10 beta) or at 30 °C (CM404) on LB medium containing appropriate antibiotics: ampicillin (Ap) 100 μg·mL−1, kanamycin (Km) 50 μg·mL−1, streptomycin (Sm) 25 μg·mL−1 or spectinomycin (Sp) 75 μg·mL−1. Synechocystis was grown at 30 °C, under continuous white light (cool white Sylvania Luxline Plus; 1100 lux; 14 μE m−2 s−1 or 7500 lux; 94 μE m−2 s−1) in liquid mineral medium (MM), i.e., BG11 [32] enriched with 3.78 mM Na2CO3, under continuous agitation (140 rpm, Infors rotary shaker, Basel, Switzerland). For some experiments, Co or p-benzoquinone (Sigma-Aldrich, Saint Quentin-Falavier, France) were added to MM at the indicated concentrations. Growth was monitored by regular measurements of optical density at 750 nm (OD750; 1 OD750 = 5 × 10⁷ cell.mL−1). In some cases, exponentially growing cells were serially diluted (5-fold) in MM, spread on MM (with or without the indicated metals) solidified with 10 g·L−1 Bacto Agar (Difco) and incubated for several days under photoautotrophic conditions until photography and/or analysis. The DNA cassettes for the targeted deletion of sufR and slr0605 were introduced in Synechocystis by transformation [33]. The pCK-derived plasmids for the high-level expression of slr0605 (pCKslr0605) or its derivative (pCKslr0605strep), translationally fused to the Strep-tagII sequence for easy protein purification (Table S1), were introduced in Synechocystis by conjugation [34] using a 24 h co-incubation of E. coli and Synechocystis cells. Transformants and conjugants were plated on solid MM. The antibiotics used for selection were kanamycin (Km) 50–300 μg·mL−1, spectinomycin (Sp) 5 μg·mL−1 and streptomycin (Sm) 5 μg·mL−1. The integration of the slr0605 deletion cassette into the Synechocystis chromosome and the presence of the slr0605 expression plasmids were verified by PCR and DNA sequencing (Mix2Seq Kit, Eurofins Genomics, Nantes, France) using appropriate oligonucleotide primers (Table S2).

2.2. Construction of ΔsufR::KmR Deletion Cassette for Targeted Deletion of sufR Gene

The ΔsufR::KmR deletion cassette was constructed by replacing the sll0088 coding sequence (CS, from codon 8 to codon 192) with a transcription-terminator-less kanamycin resistance gene (KmR) for selection, while preserving the sll0088 flanking regions for homologous recombination mediating targeted gene replacement in Synechocystis [33]. These DNA regions (about 300 bp) were PCR amplified from the Synechocystis chromosome with specific primers (Table S2) and joined by PCR-driven overlap extension in a single DNA segment harboring a SmaI restriction site in place of the sufR CS (Figure S1). After cloning in pGEM-T, the resulting plasmid was opened at its unique SmaI site, where we cloned the transcription-terminator-less KmR marker (a HincII segment from pUC4K plasmid) in the same orientation as the sufR CS that it replaced (Figure S1). The ΔsufR::KmR resulting plasmid was verified by PCR (Figure S2) and DNA sequencing (Mix2Seq Kit, Eurofins Genomics). It was then transformed to Synechocystis, where a double crossing-over occurring in the sufR flanking regions integrated the KmR marker in place of the sufR CS in all copies of the polyploid [33] Synechocystis chromosome. The absence of WT chromosome copies in the ΔsufR::KmR mutant was confirmed by analyzing cells grown for multiple generations in the absence of Km to allow the propagation of WT (sufR+, KmS) chromosome copies which could have escaped PCR detection. As expected, the ΔsufR::KmR mutant possessed only sufR::KmR chromosomes (Figure S2, see the 580 bp and 720 bp products from PCR1 and PCR2, respectively), and WT chromosomes (with the absence of 538 bp and 783 bp bands from PCR3 and PCR4, respectively).

2.3. Construction of Δslr0605::KmR Deletion Cassette for Targeted Deletion of slr0605 Gene

The two Synechocystis chromosomal DNA regions flanking the slr0605 coding sequence (CS) were amplified by PCR (Phusion, Invitrogen, ThermoFisher, Ottawa, ON, Canada) from the Synechocystis chromosome, using specific oligonucleotide primers (Table S2). In parallel, the transcription-terminator-less SmR/SpR marker gene was PCR amplified from the pFC1 plasmid [34] using specific primers (Table S2). These three PCR products were assembled (NEBuilder® HiFi DNA Assembly) with the pGEM-T plasmid (Promega, Charbonnière-les-bains, France). The Δslr0605::SmR/SpR resulting plasmid was verified by PCR (Figure S3) and nucleotide sequencing (Mix2Seq Kit, Eurofins Genomics). It was then transformed to Synechocystis, where homologous recombinations occurring in the slr0605 flanking regions replaced the slr0605 CS by the SmR/SpR marker in all copies of the Synechocystis chromosome (Figure S3). We verified that the Δslr0605:SmR/SpR mutant possesses only Δslr0605::SmR/SpR mutant chromosomes, even when growing in the absence of Sm and Sp, to stop the counter-selection of possible WT chromosome copies that could have escaped PCR detection.

2.4. Construction of pCKslr0605 and pCKslr0605 Plasmids Expressing slr0605 Gene, or Its Strep-Tagged Derivative, Respectively

The slr0605 coding sequence was PCR amplified from Synechocystis DNA with specific oligonucleotide primers (Table S2) that introduced an NdeI restriction site upstream of its start codon and an EcoRI site downstream of its stop codon. This PCR product was cut with both NdeI and EcoRI and cloned in the pCK plasmid opened with the same enzymes, yielding the pCKslr0605 plasmid (Figure S4). Similarly, the slr0605 gene, translationally fused at its 3′OH side to the Strep-tagII for the facile purification of the Slr0605 protein, was also cloned in pCK, yielding the pCKslr0605 plasmid.

2.5. Pigment Extraction and Quantification

Synechocystis cells incubated on plates were re-suspended in 1 mL of ultra-pure water (A750 nm = 0.2), centrifuged (10 min, 14,000 rpm at 4 °C) and the pellet was carefully resuspended in 1 mL of cooled methanol (4 °C). The absorbance of the solution was then measured at 470, 665 and 720 nm, and pigment concentrations were calculated using the following equations: chlorophyll a concentration (µg/mL): [Chl a] = 12.9447 (A665nm − A720nm) [35]; total carotenoids in µg/mL = 1000 (A470nm − A720nm) − 2.86 ([Chl a]/221) [36]. To measure the phycocyanin content, the 1 mL cell suspension in ultra-pure water was heated for 8 min at 75 °C, and the phycocyanin concentration was estimated as follows: [PC] = (A620nm − A750nm) − (A620nm heated − A750nm heated) [37].

2.6. Reactive Oxygen Species (ROS) Assay

The content of ROS (H2O2, HO• and ROO•) was measured as previously described [21], using the standard probe 2′,7′-dichlorodihydrofluorescein diacetate (DCFH-DA; Sigma-Aldrich) that is oxidized into the fluorescent derivative dichlorofluorescein (DCF) by the sequential action of cellular esterases and ROS [38]. Briefly, WT and mutant cells incubated under standard or stress conditions (OD750 = 0.5) were collected by a 10 min centrifugation at 5000 rpm and resuspended in fresh MM (2.5 × 10⁷ cells.mL−1). They were incubated in the dark for 1 h at 30 °C in the presence of 5 μM DCFH-DA, solubilized in ethanol. Then, the fluorescence excitation/emission, normalized on the basis of the OD750, was read at λexcem = 485/520 nm at 30 °C using a microplate reader (CLARIOstar; BMG LABTECH, Champigny sur Marne, France).

2.7. Protein Extraction and Purification

Multiple 50 mL cultures of the Synechocystis strain harboring the pCKslr0605strep plasmid (OD750 = 0.5; 1.25 × 10⁹ cells) were harvested by centrifugation (7000× g for 5 min at 4 °C) and resuspended in 1.5 mL of 50 mM Tris-HCl buffer at pH 7.6. Cells were immediately frozen in an Eaton press chamber pre-cooled in a dry-ice ethanol bath and disrupted (250 MPa). Cell debris were eliminated by centrifugation (10 min, 14,000 rpm at 4 °C). The supernatant was ultracentrifuged (10 min, 60,000 rpm at 4 °C in TLA-100 rotor) to separate soluble and insoluble fractions. Protein concentration was measured by the Bradford assay (Biorad, Marnes-la-Coquette, France), using BSA (bovine serum albumin) as the standard. Proteins of 5 to 10 μg were separated onto a 12% (w/v) SDS-PAGE (stacking gel: 4% acrylamide-bis-acrylamide, 125 mM Tris/HCl pH 6.8, 8.33% glycerol, 0.21% SDS; running gel: 12% acrylamide-bis-acrylamide, 375 mM Tris/HCl pH 8.8, 10% glycerol, 0.02% SDS), run for 2 h at 100 V under denaturing conditions (40 mM Tris, 300 mM glycine, 0.1% SDS). The gels were either stained with 0.25% Coomassie blue, 45% ethanol, or 9% acetic acid and then discolored (25% ethanol, 10% acetic acid), or analyzed by Western blotting. The blue prestained protein ladder (Sigma Aldrich) was used as the molecular weight marker.
The Slr0605–Strep-tagged protein was purified from 100 mL of liquid culture at 2.0 OD750 = 2; 5 × 10⁹ cells. After ultracentrifugation, the soluble fraction was diluted in 4 mL of binding buffer (100 mM Tris-HCl, 150 mM NaCl, 1 mM EDTA, pH 8). The Slr0605–Strep-tagged protein was purified using 1 mL of Strep-Tactin XT Sepharose (Cytiva, Velizy Villacoublay, France) and eluted, according to the supplier’s recommendation, in the presence of 50 mM biotin. Then, Slr0605-strep was concentrated 80-fold using the Amicon® Ultra-15 10K kit (Merck, Guyancourt, France) to eliminate of molecules with a mass <10 kDa. The absorbance at 280 nm was measured using Nanodrop® (ThermoFisher, Ottawa, ON, Canada). The concentration of the purified recombinant proteins was calculated using the molecular mass (37,665.53 g.mol−1) and molar absorption coefficients (88,935 M−1.cm−1) calculated by Expasy ProtParam [39].

2.8. Western Blot Analysis

After SDS-PAGE, proteins were transferred onto a Polyvinylidene Difluoride membrane (PVDF, GE Healthcare, AmershamTM, Les Ulis, France) 1 h at 100 V (transfer buffer: 25 mM Tris, 192 mM glycine, 0.1% (w/v) SDS, 20% (v/v) ethanol) at room temperature (T°). The membrane was saturated for 2 h at room T° in the TBST buffer (50 mM Tris, 150 mM NaCl, 0.1% (v/v) Tween 20, 5% (w/v) BSA, pH 7.4). The membrane was probed for 2 h at room T° with primary mouse antibodies raised against the PsbA (Agrisera, 1:10,000 dilution), PsaA (Agrisera, 1:10,000 dilution) proteins or Strep-tagII (Sigma; 1:5000 dilution in TBST with BSA (w/v) 1%). The membrane was washed 5 times for 5 min in TBST and incubated with secondary horseradish peroxidase (HRP)-conjugated rabbit anti-mouse antibodies (Sigma; 1:5000 dilution). The membrane was washed 5 times for 5 min in TBST. Immune complexes were detected using a chemiluminescent HRP substrate, as described [40]. For accurate quantification, various protein amounts were migrated onto the gel, and immune complexes band intensity was measured using ImageJ 1.x software (densitometry measurement). The relative band intensity was calculated using the value obtained for the wild-type (WT) strain incubated under standard conditions as a reference.

2.9. Catalase Assay

It was performed as described [41]. Briefly, cell-free lysates containing 10 μg of total proteins from WT and Δslr0605 mutant strains were separated on a non-denaturating 12% (w/v) polyacrylamide gel. Then, the gel was washed 3 times for 10 min at room T° in ultra-pure water, with gentle agitation. It was then incubated for 10 min in a 0.01% (v/v) H2O2 solution, rinsed with ultra-pure water and soaked in a freshly-prepared solution containing 1% (w/v) FeCl3 and 1% (w/v) K3Fe(CN)6. The appearance of a high molecular weight achromic band resulting from catalase activity (decomposition of H2O2) was observed on a blue-green background (Prussian Blue). The reaction was stopped by washing in ultra-pure water to remove the ferric solution. Subsequently, the gel was scanned, and the intensity of the catalase activity band was measured using ImageJ 1.x software.

2.10. Superoxide Dismutase Assay

Total protein extracts (10 μg) were immediately mixed with a non-SDS/DTT protein dye and migrated on a non-denaturing 12% (w/v) acrylamide gel at 100 V until the protein dye reached the end of the gel. Then, the gel was incubated for 15 min at room T° in a Nitro Blue Tetrazolium chloride (NBT, ThermoFisher Scientific, Ottawa, ON, Canada) solution (50 mM Tris/HCl pH 7.6, 2.43 mM NBT in darkness). After the addition of 0.028 mM Riboflavin (Sigma Aldrich) and 28.48 μM TEMED (MP medicals, Illkirch France), the gel was incubated for 15 min under mild agitation. The Superoxide dismutase (SOD) reaction was then performed under white light (7000 lux) for 30 min at 30 °C. Riboflavin and light generate superoxide ions that are reduced by NBT, thereby coloring the gel purple (formazan production), with the exception of the band corresponding to the SOD protein, which remains colorless. Subsequently, the gel was scanned, and the intensity of the SOD activity bands was measured using ImageJ software.

2.11. Measurement of Glutathionyl–Hydroquinone Reductase Activity

The GHR activity was evaluated as described [42]. Briefly, an absorption spectrum (230 to 400 nm) of 10 µM p-benzoquinone (Sigma-Aldrich) in 50 mM Tris-HCl buffer pH 7.5, was first recorded as the baseline of the assay. After 2 min, 50 µM reduced glutathione (Sigma-Aldrich) was added to the reaction mixture, and a new absorption spectrum was recorded. Reduced glutathione reacts rapidly with p-benzoquinone, inducing an absorption peak shift from 247 nm to 300 nm (with the formation of S-Glutathionyl–p-hydrobenzoquinone). Finally, 1.7 µg of Slr0605-Strep-tagged purified protein was added to the reaction mixture, and an absorption spectrum was recorded every min for 8 min. A peak shift from 300 nm to 285 nm was observed over time, testifying the synthesis of the p-benzohydroquinone product by the enzyme.

2.12. Statistical Analyses

All experiments were carried out in at least triplicate (n = 3), and the results are expressed as the mean ± standard deviation (SD). Statistical analysis was conducted using one-way analysis of variance (ANOVA) or the Welch’s t-test. Statistical significance was determined at a level of p < 0.05 (symbolized by *), p < 0.005 (**), p < 0.0005 (***) or p < 0.00005 (****).
All statistical tests were performed using GraphPad Prism 10 software. The Welch’s t-test [43] was used to analyze the growth and pigment assay data from independent experiments and the significance of ROS assay results (comparison of only two independent groups). One-factor ANOVA and the Tukey test were used to analyze the significance of (i) the comparison of catalase and superoxide dismutase activities in two strains incubated under various conditions, and (ii) the effect of iron supplementation observed for the same experiment (for the same batch of culture medium, same precultures, etc.). The Brown–Forsythe and Dunnett tests were used to analyze the results of western blots from different dilutions of protein extracts [44].

3. Results and Discussion

3.1. Synechocystis PCC 6803 Is Particularly Sensitive to Cobalt That Reduces Chlorophyll Content

In the frame of our interest in the resistance of cyanobacteria to environmental stresses [18], we tested the influence of various metals on the growth of the model strain Synechocystis PCC 6803 (hereafter Synechocystis). The data showed that both cell growth and their content in photosynthetic pigments were altered in response to metal excess, especially Co (Figure 1). This finding confirms and extends previous reports on cobalt toxicity in Synechocystis [18,31,45] in showing that it is more affected by Co than by other metals. The most significant Co effects on the content of photosynthetic pigments, evaluated using the absorption spectra of extracted pigments, was the decrease in both carotenoids (decrease in absorbance in the range 400–490 nm) and chlorophyll a (decrease in absorption peaks at 435 nm and 665 nm) (Figure 1). The latter finding is consistent with previous reports that Co reduces the chlorophyll content of the filamentous cyanobacterium Spirulina platensis [46], and the unicellular species Anacystis nidulans UTEX 625 [47] and Synechococcus PCC 7942 [48], which are closely related [49].

3.2. Iron Supplementation Protects Synechocystis Against Cobalt-Elicited Declines of Growth and Pigments

Cobalt toxicity has been well studied in E. coli, where it was found to impair iron (Fe) homeostasis and the iron–sulfur [Fe-S] cluster of numerous enzymes, thereby triggering oxidative stress [30,50]. In cyanobacteria, iron is especially important [51]. Indeed, the iron quota (atoms per cell) in Synechocystis is one order of magnitude higher than in E. coli [52]. For example, the photosynthetic apparatus employs twelve Fe atoms for photosystem I (PSI), and ten Fe atoms for PSII, cytochrome b6f and cytochrome c-553 [53]. Furthermore, PSI harbors three [4Fe-4S] clusters: the FA and FB clusters in the PsaC subunit and the FX cluster ligated to the PsaA and PsaB subunits [53]. Consequently, we have tested the influence of Fe supplementation on the growth and pigment content of Synechocystis exposed to Co. For an unclear reason, somehow related to Co, the pigment extraction data showing the Co-induced net decrease in chlorophyll a (absorption peak at 680–700 nm), a low decrease in carotenoids, and a small increase in phycocyanin (peak at 620 nm) (Figure 2) fit better with the whole-cell absorption spectra normalized at 569 nm (a valley of absorbance) than at 800 nm (a commonly-used value) (Figure 2). The discrepancy between the whole-cell spectra normalized at 569 nm or 800 nm was mainly observed for cells exposed to Co, not Fe. Collectively, the results showed that the Co-induced decline of cell growth and chlorophyll content (Figure 1) was attenuated by the presence of extra Fe (Figure 2).

3.3. Activation of Iron–Sulfur Cluster Repair Genes Alleviates Cobalt Toxicity

As it has been shown in E. coli that mutants lacking the Fe-S cluster assembling Suf machinery are hypersensitive to Co [54], we have tested the influence of the suf genes of Synechocystis on its tolerance to Co. In Synechocystis, the suf genes are grouped in the sufBCDS operon that is negatively regulated by the SufR repressor encoded by the sll0088 gene [55]. We reasoned that a sll0088 deletion mutant overexpressing the sufBCDS genes should be resistant to Co. Therefore, a ΔsufR::KmR deletion cassette was constructed (Materials and Methods) by replacing the sll0088 coding sequence (CS, from codon 8 to codon 192) by a transcription-terminator-less kanamycin resistance gene (KmR) for selection, while preserving the sll0088 flanking regions for homologous recombination mediating targeted gene replacement in Synechocystis [33]. The ΔsufR::KmR mutant, hereafter ΔsufR, grew as healthy as the wild-type (WT) strain under photoautotrophic conditions, showing that SufR is not essential to cell life in Synechocystis, as previously observed [53]. The ΔsufR mutant appeared to be more resistant to Co than the WT strain (Figure 3), unlike the previously described GST mutants that were used as controls: Δsll1545 [21], Δsll1147 [24], Δsll0067 [6], Δsll1902 (to be published elsewhere) and the presently constructed GST-less mutant Δslr0605 (see below).

3.4. Slr0605 GST Contributes to Cobalt Resistance in Synechocystis

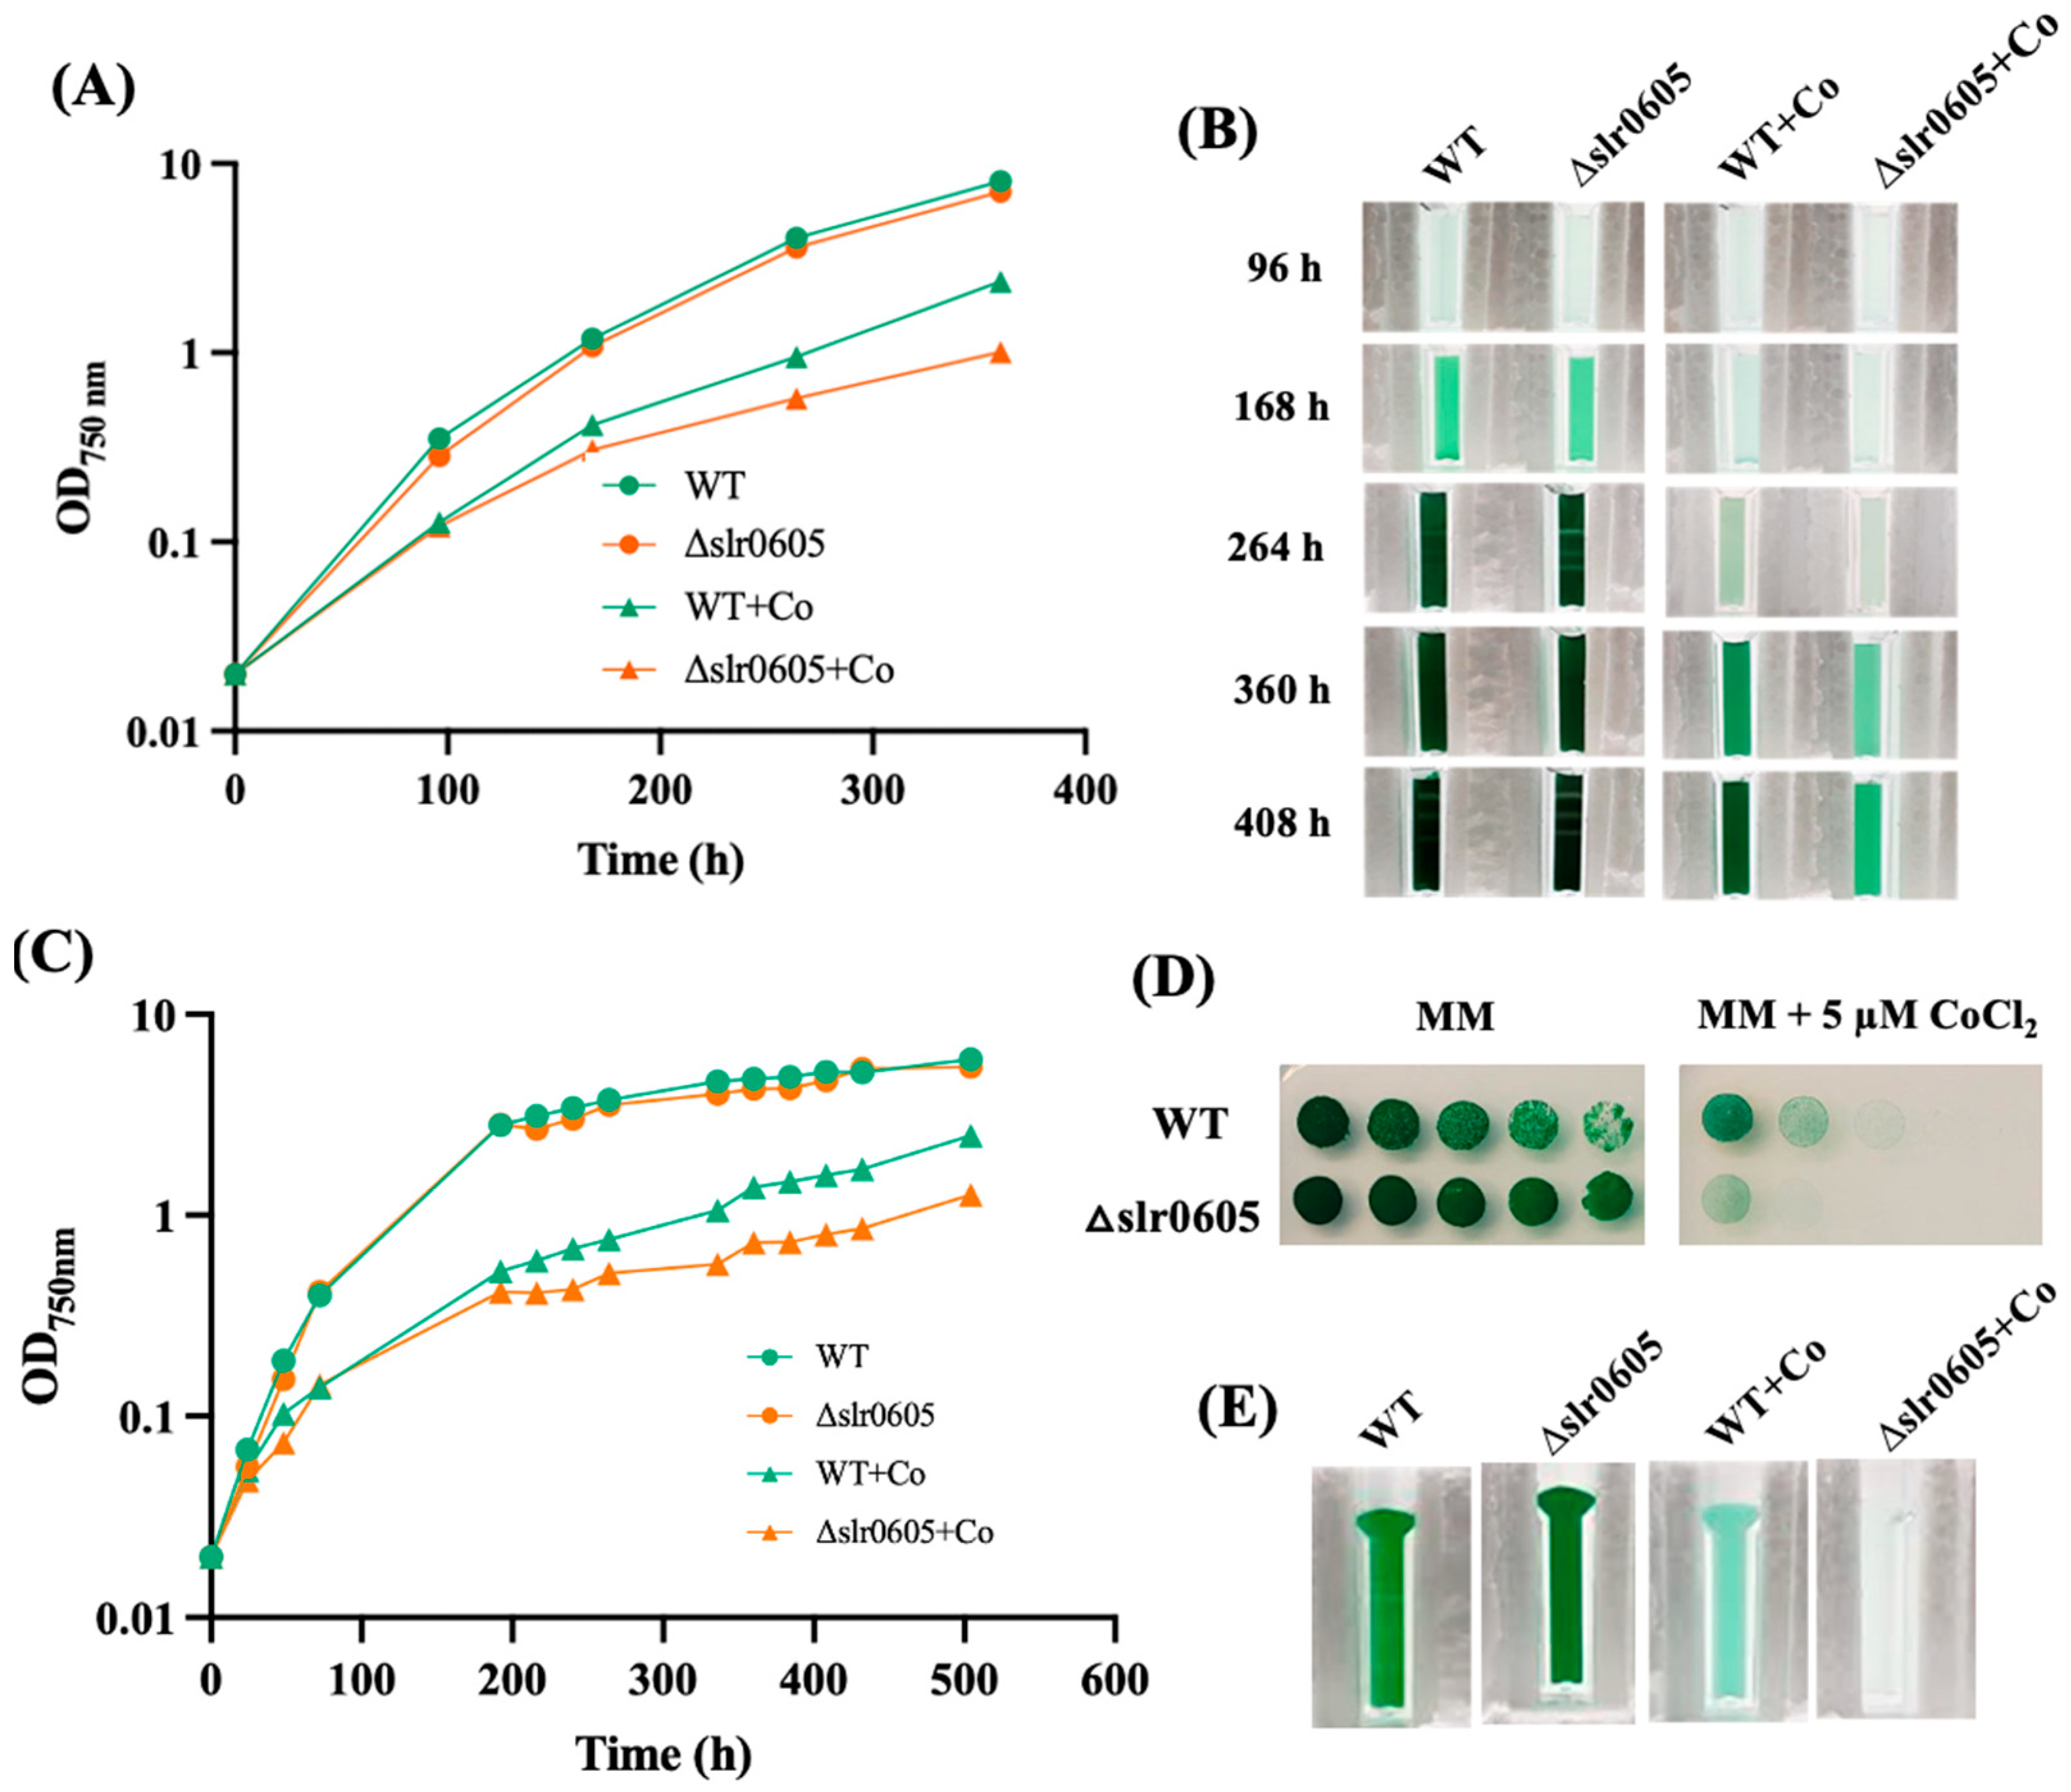
Because GST can act in the protection against metal [7], and the role of Xi GST is poorly known, we tested the possible influence of the Slr0605 GST on resistance to cobalt. For this purpose, a Δslr0605::SmR/SpR deletion mutant was constructed (Section 2) by replacing the slr0605 coding sequence with a transcription-terminator-less streptomycin and spectinomycin resistance gene (SmR/SpR) for selection. The Δslr0605::SmR/SpR mutant grew as fit as the wild-type (WT) strain under photoautotrophic conditions (Figure 4), demonstrating that Slr0605 is not essential to cell life, similar to other Synechocystis GSTs, such as Slr0236 [21], Sll1147 [24] and Sll0067 [6], unlike Sll1545, which is vital [21].
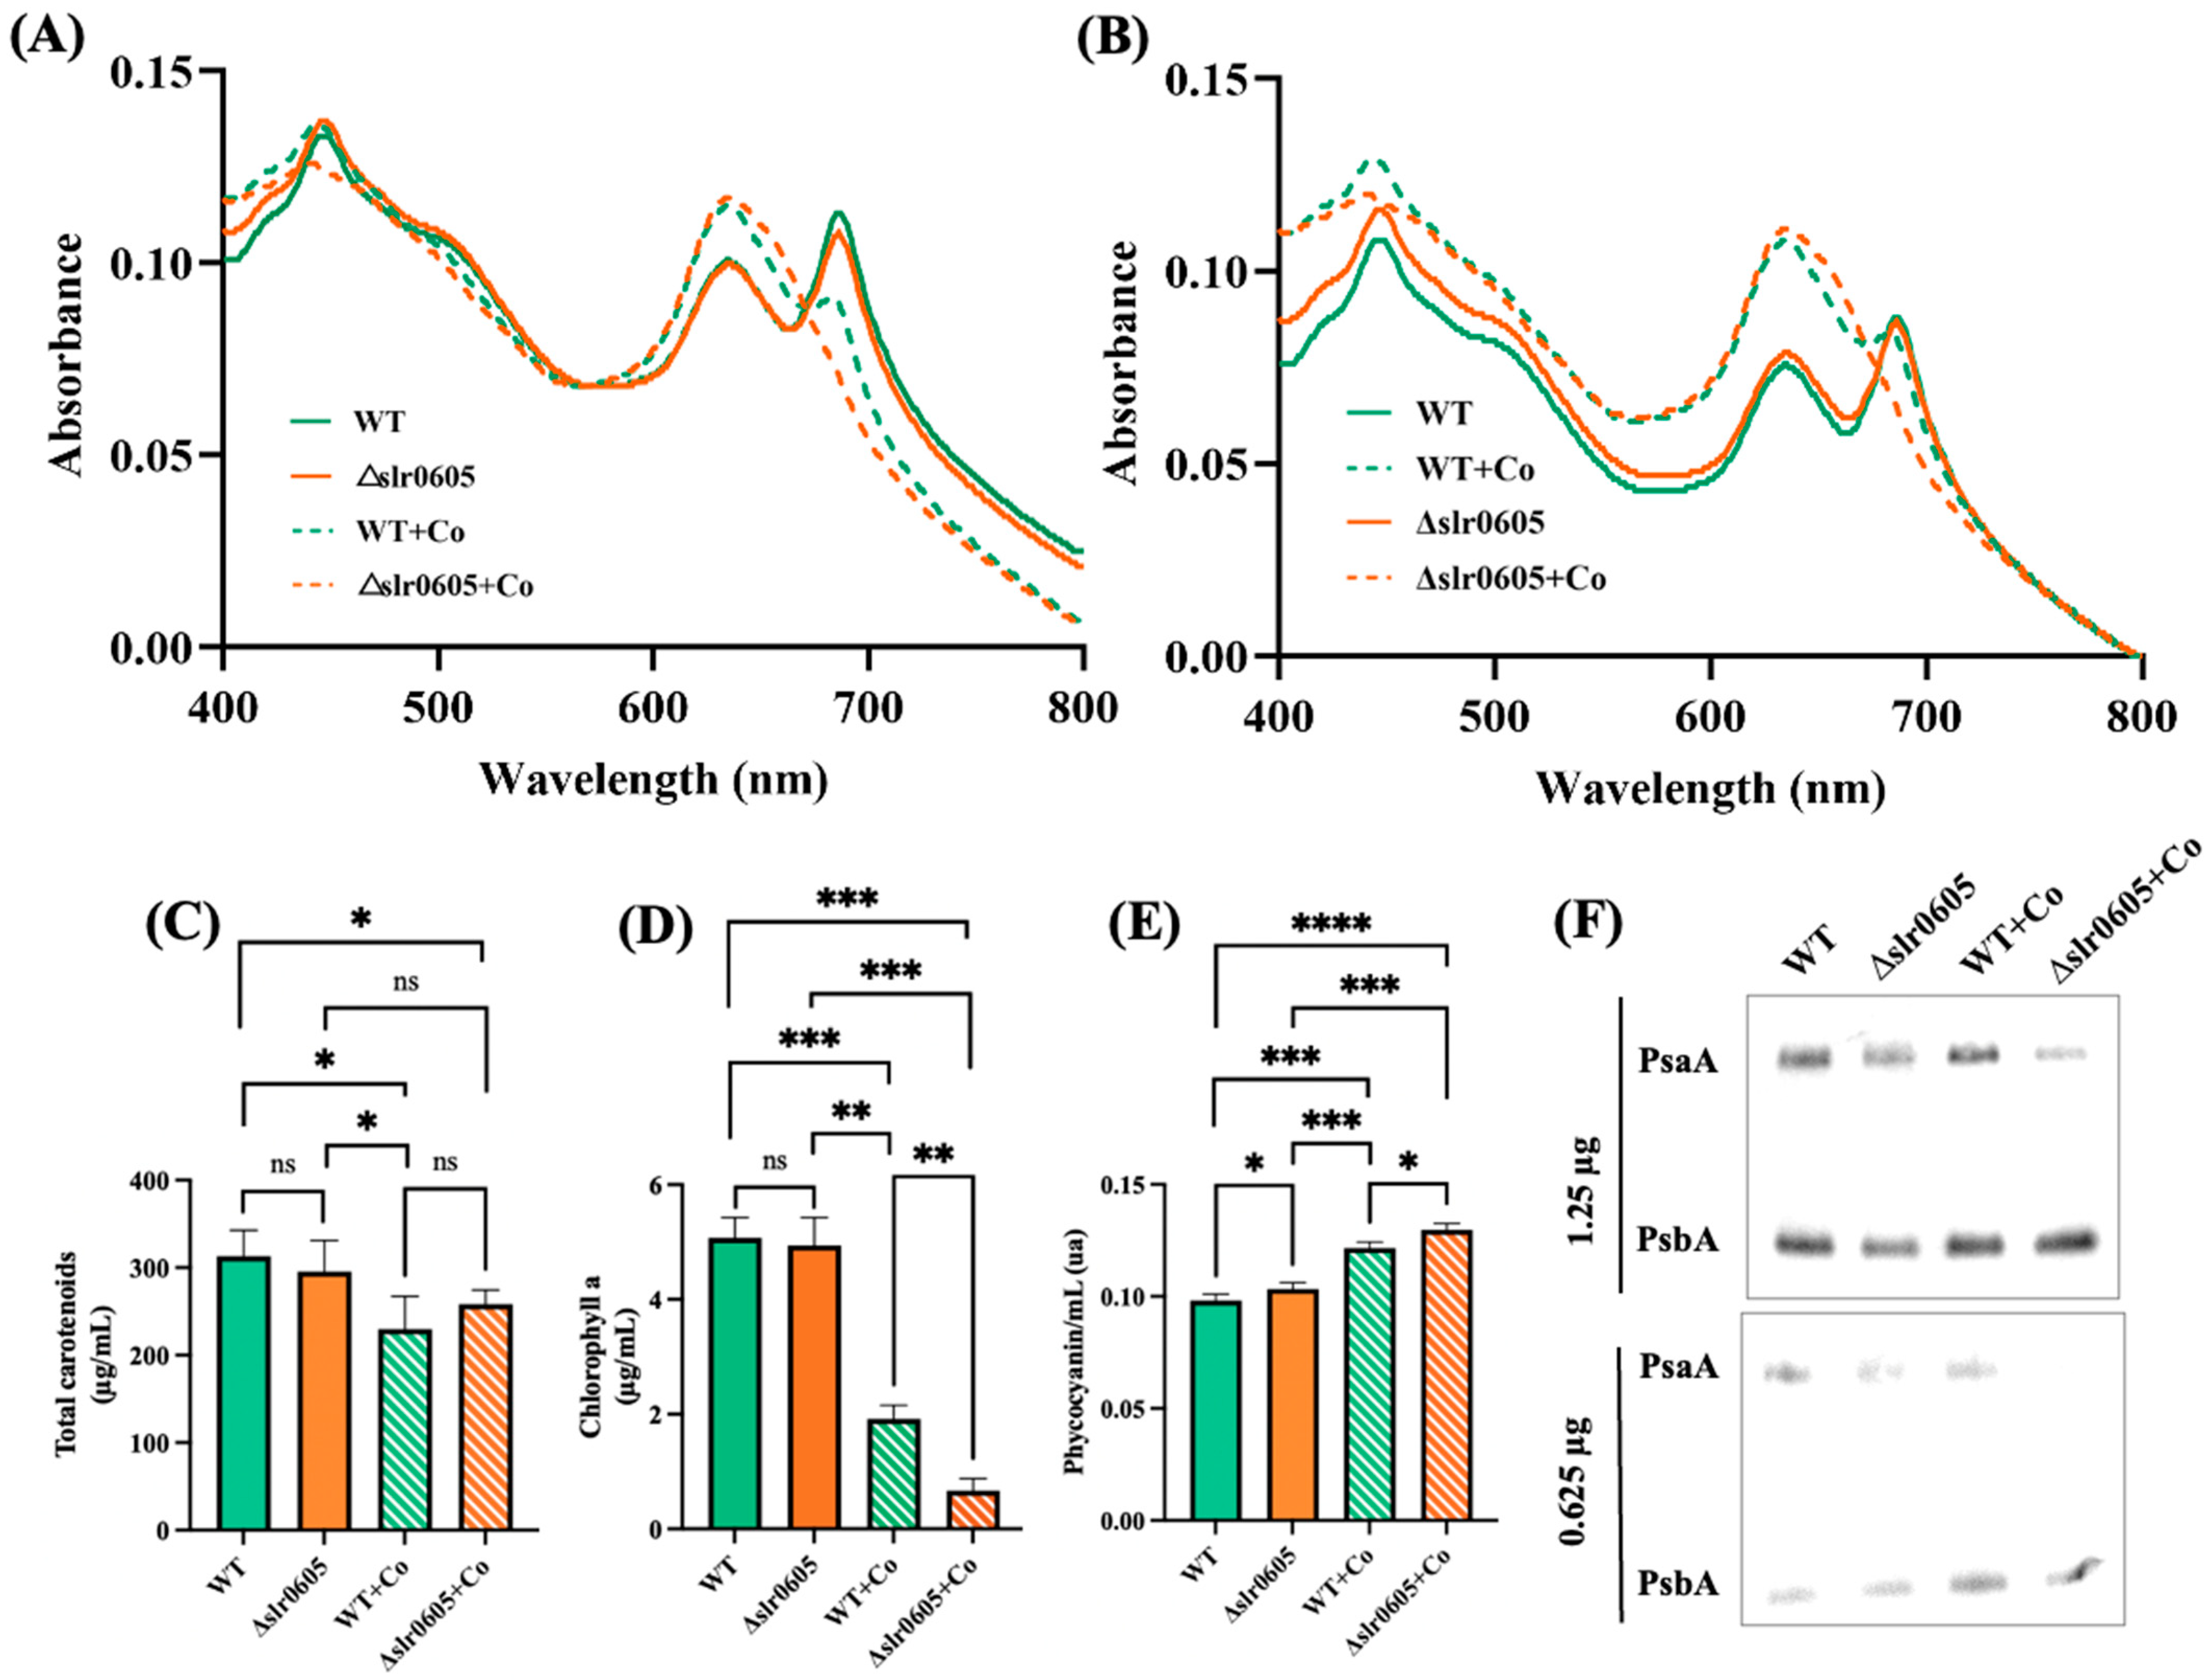
The possible influence of Slr0605 on tolerance to Co was tested by growing the WT and the Δslr0605::SmR/SpR mutant on liquid or solid medium with or without Co supplied as CoCl2 (Figure 4). The data showed that the Δslr0605::SmR/SpR mutant was more sensitive to Co than the WT strain. Pigment extraction analysis showed that the Co-elicited decrease in chlorophyll was exacerbated in the Δslr0605::SmR/SpR mutant compared to the WT strain (Figure 5). As observed above (Figure 2), the pigment extraction data showing the Co-induced (i) clear decrease in chlorophyll and (ii) (low) decrease in carotenoids and (iii) small increase in phycocyanin, fit better with the whole-cell absorption spectra normalized at 569 nm (a valley of absorbance) than at 800 nm (Figure 5). The Co-elicited strong decline of chlorophyll observed with pigment extraction and whole-cell absorption spectra normalized at 569 nm was confirmed by the Western blot evaluation of the content of the chlorophyll-binding photosystem I reaction center subunit PsaA, which harbors the [4Fe-4S] iron–sulfur cluster FX [56]. The abundance of PsaA was more reduced by Co in the Δslr0605::SmR/SpR mutant than in the WT strain (Figure 5). In contrast, the content of the PSII reaction center PsbA of both the Δslr0605::SmR/SpR mutant and the WT strain was not affected by Co (Figure 5).

3.5. Cobalt-Elicited Decline of Catalase Activity and Accumulation of ROS Are Exacerbated in the Δslr0605 Mutant as Compared to WT Strain

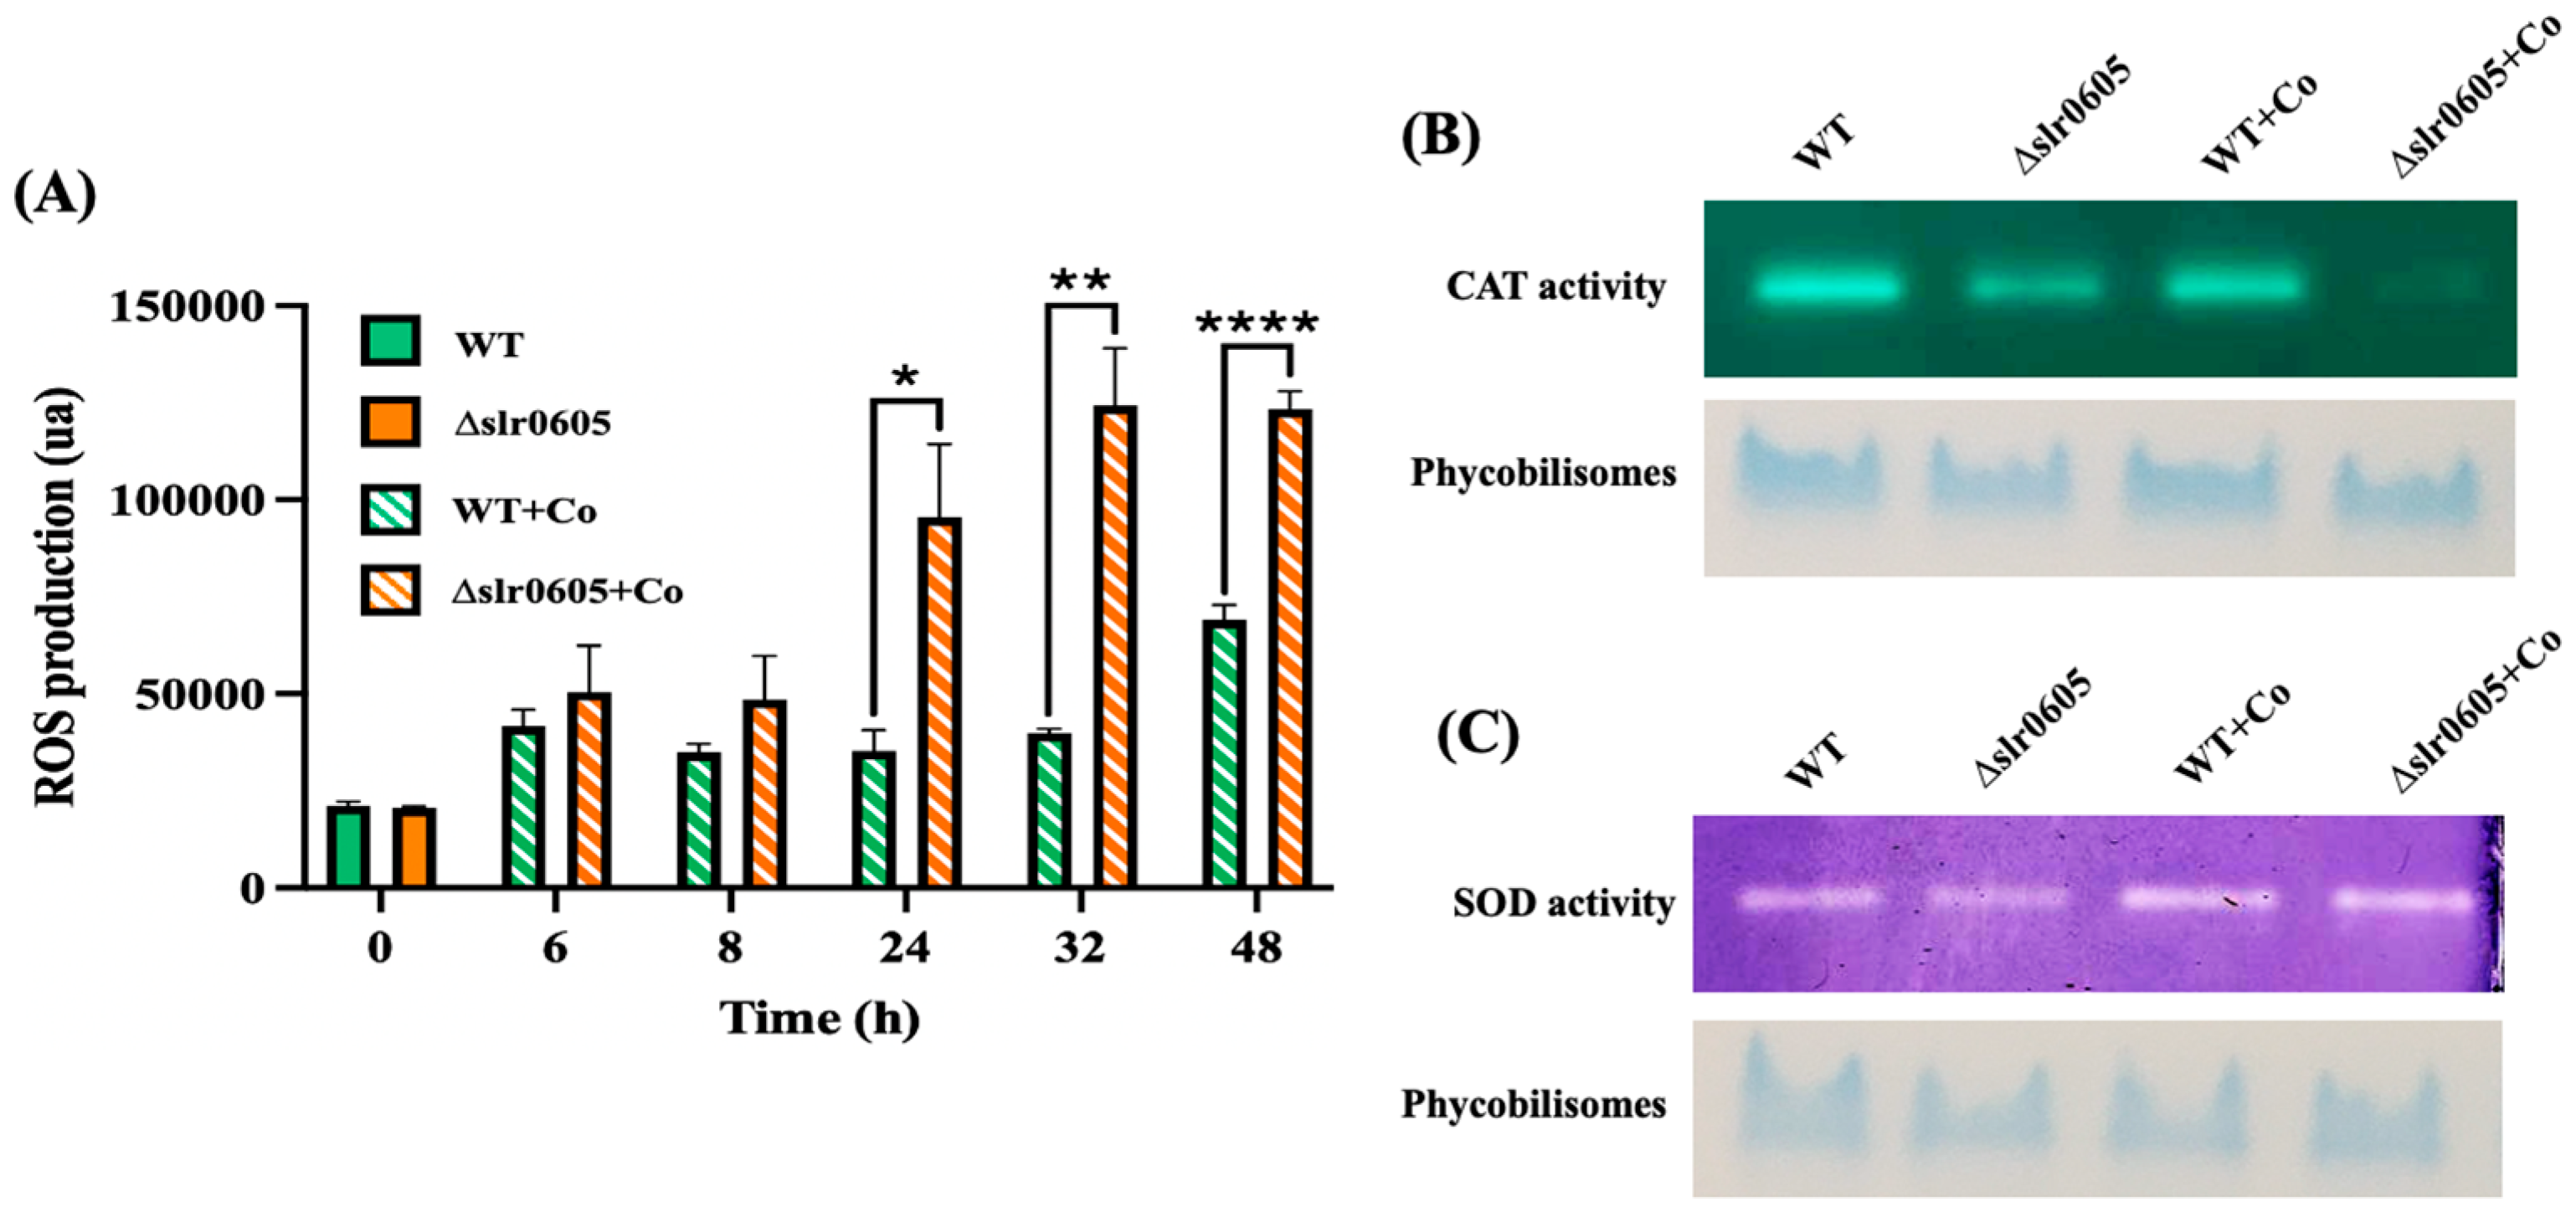
To study the influence of Slr0605 on the protection against Co, which was shown to trigger oxidative stress in E. coli [30], we measured the level of reactive oxygen species (ROS) in WT and Δslr0605 cells, before and after challenging them with Co. The data showed that Co increases the level of ROS more strongly in the Δslr0605 mutant than in the WT strain (Figure 6). Consistently, the activity of the antioxidant enzyme catalase was decreased by Co more significantly in the Δslr0605 mutant than in the WT strain. In contrast, the superoxide dismutase (SOD) activity of the Δslr0605 and WT cells were not affected by Co. Collectively, these results showed that the Co-sensitive Δslr0605 mutant exposed to Co undergoes a decrease in catalase activity and an increase in ROS (Figure 6).

3.6. Slr0605 Contributes to Iron Mitigation of Cobalt Toxicity

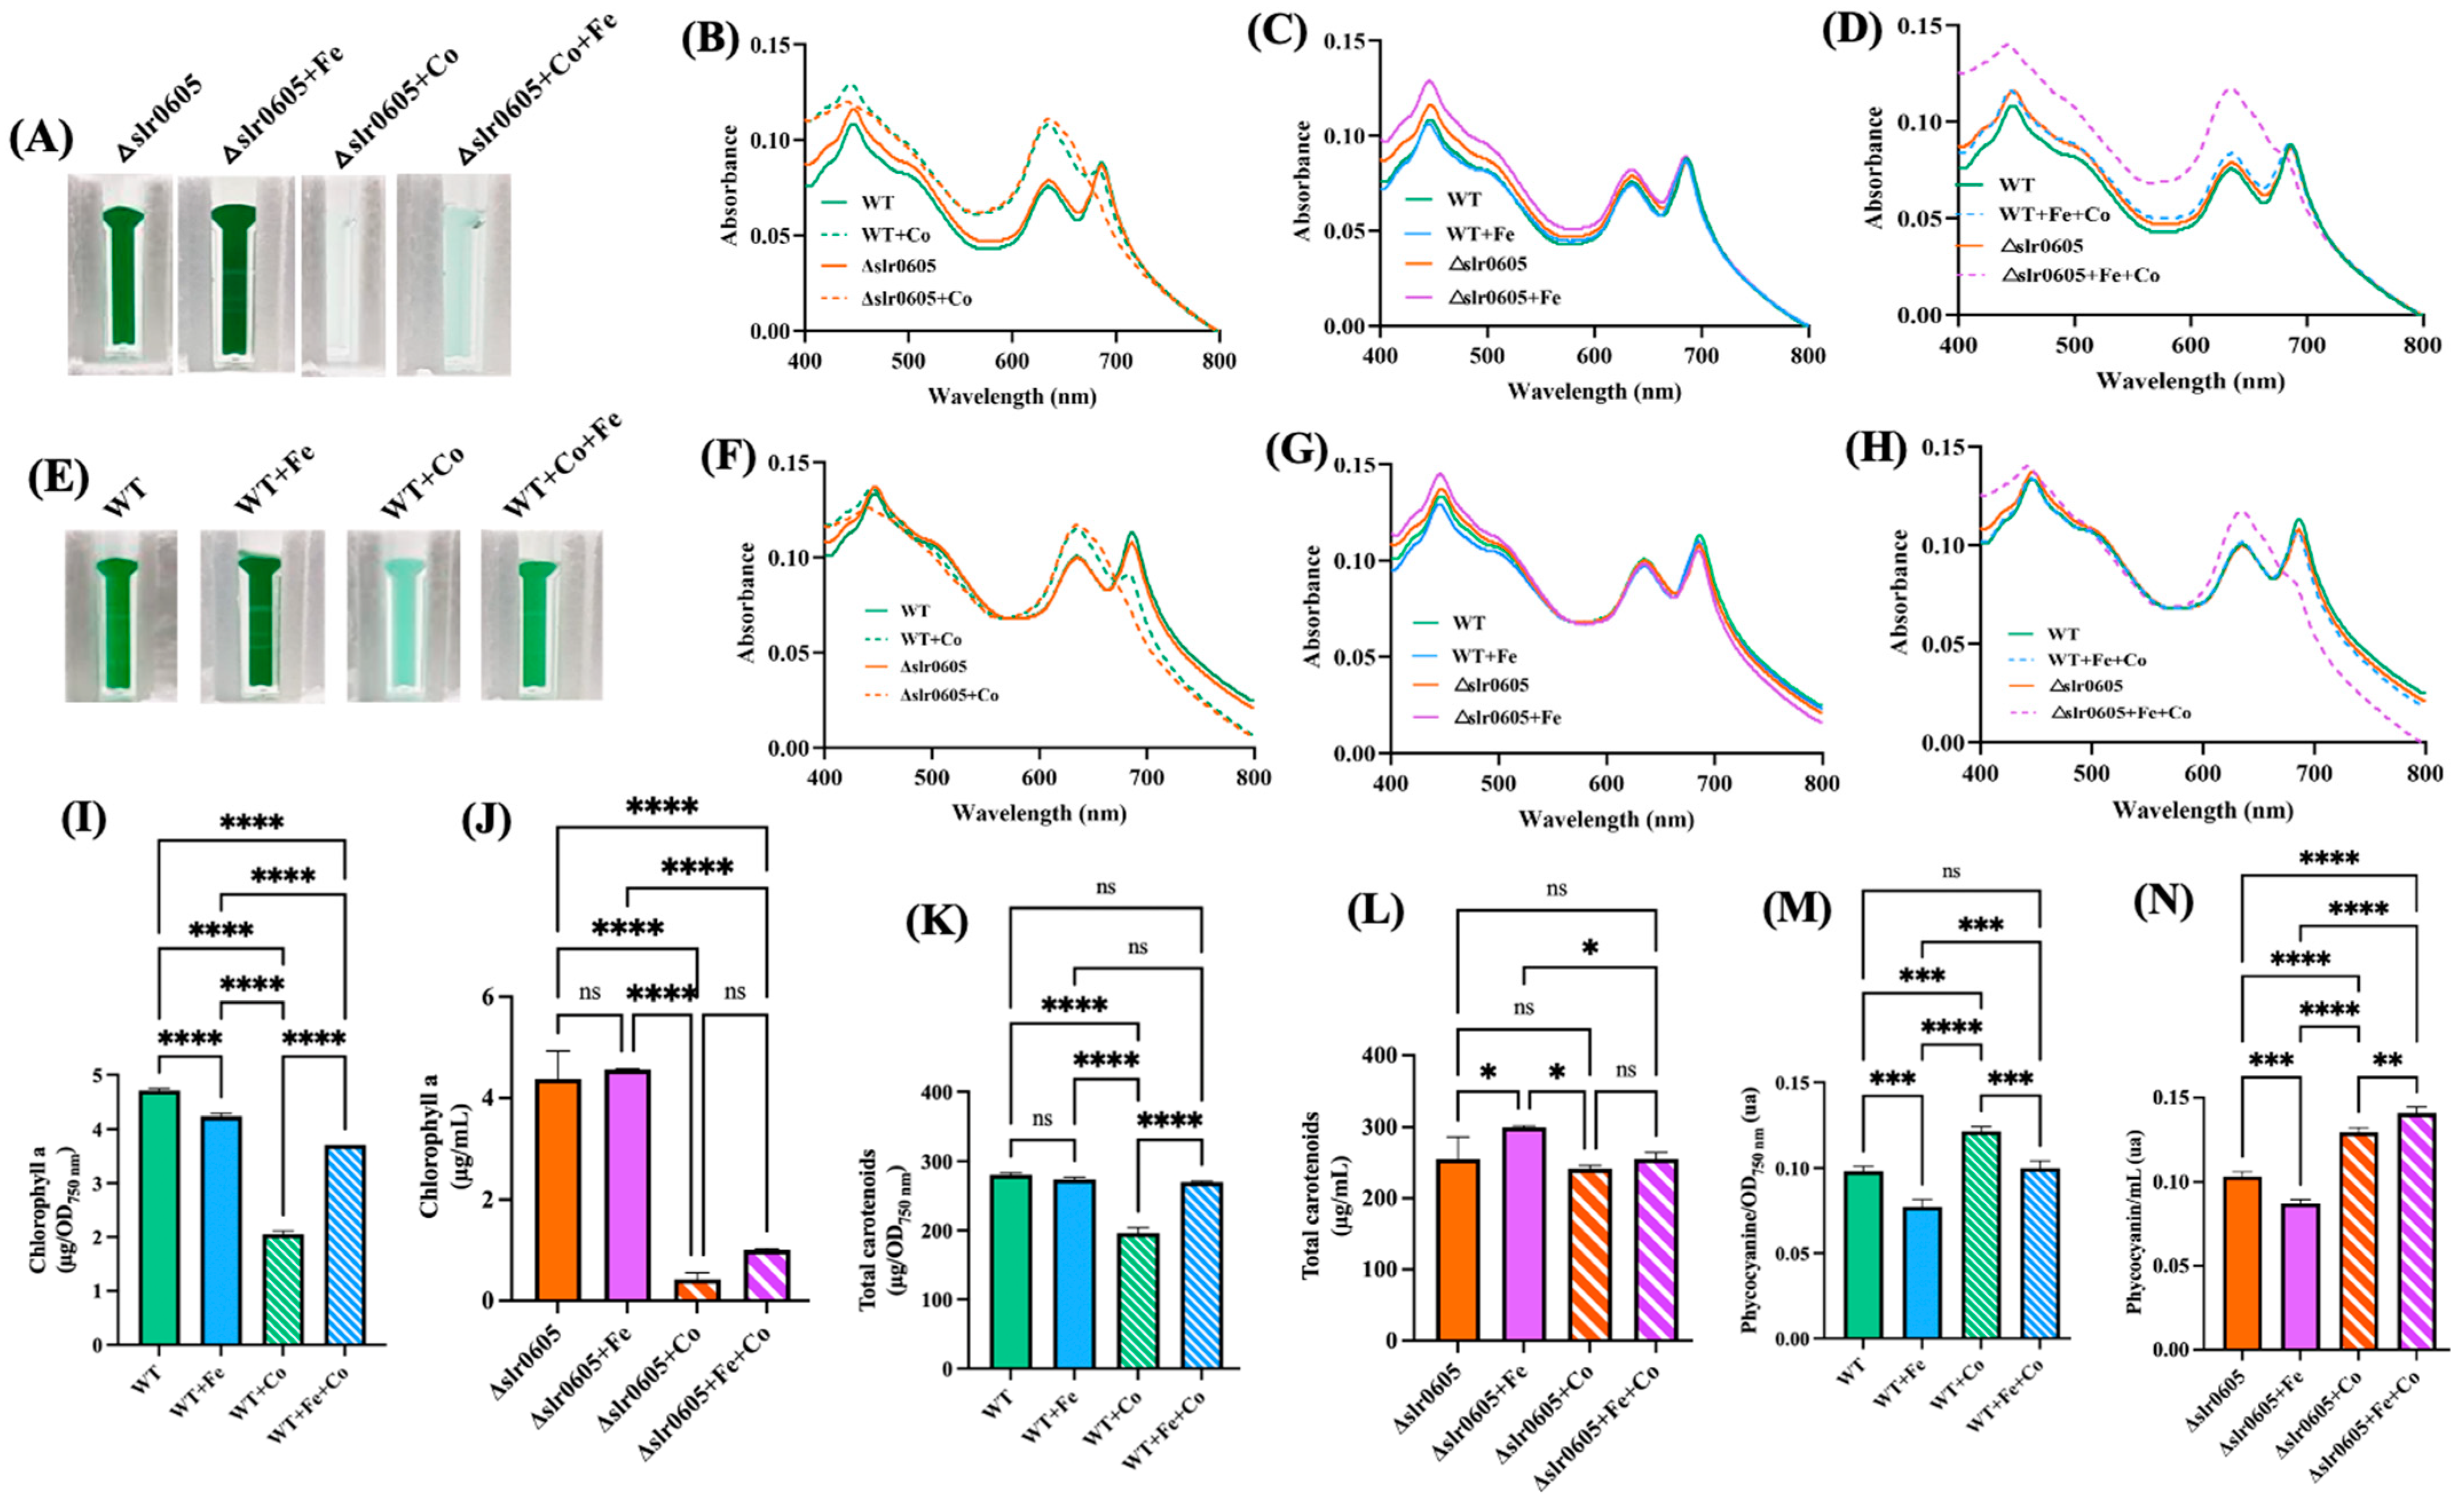
In WT cells, the Co-induced decline of cell growth and chlorophyll a content was shown above to be attenuated by the presence of extra Fe (Figure 1 and Figure 2). To test whether Slr0605 was involved in this process, we compared the influence of Co and/or Fe supplementation on cell growth and pigment content in the WT strain and the Δslr0605 mutant. The data showed that Fe supplementation did not alleviate the Co-elicited decrease in cell growth and chlorophyll content in the Δslr0605 mutant, unlike what occurred in WT cells (Figure 7).

3.7. The Restoration of Cobalt Tolerance in the Δslr0605 Mutant by Expressing the slr0605 Gene, or Its Strep-Tagged Derivative, from a Replicative Plasmid

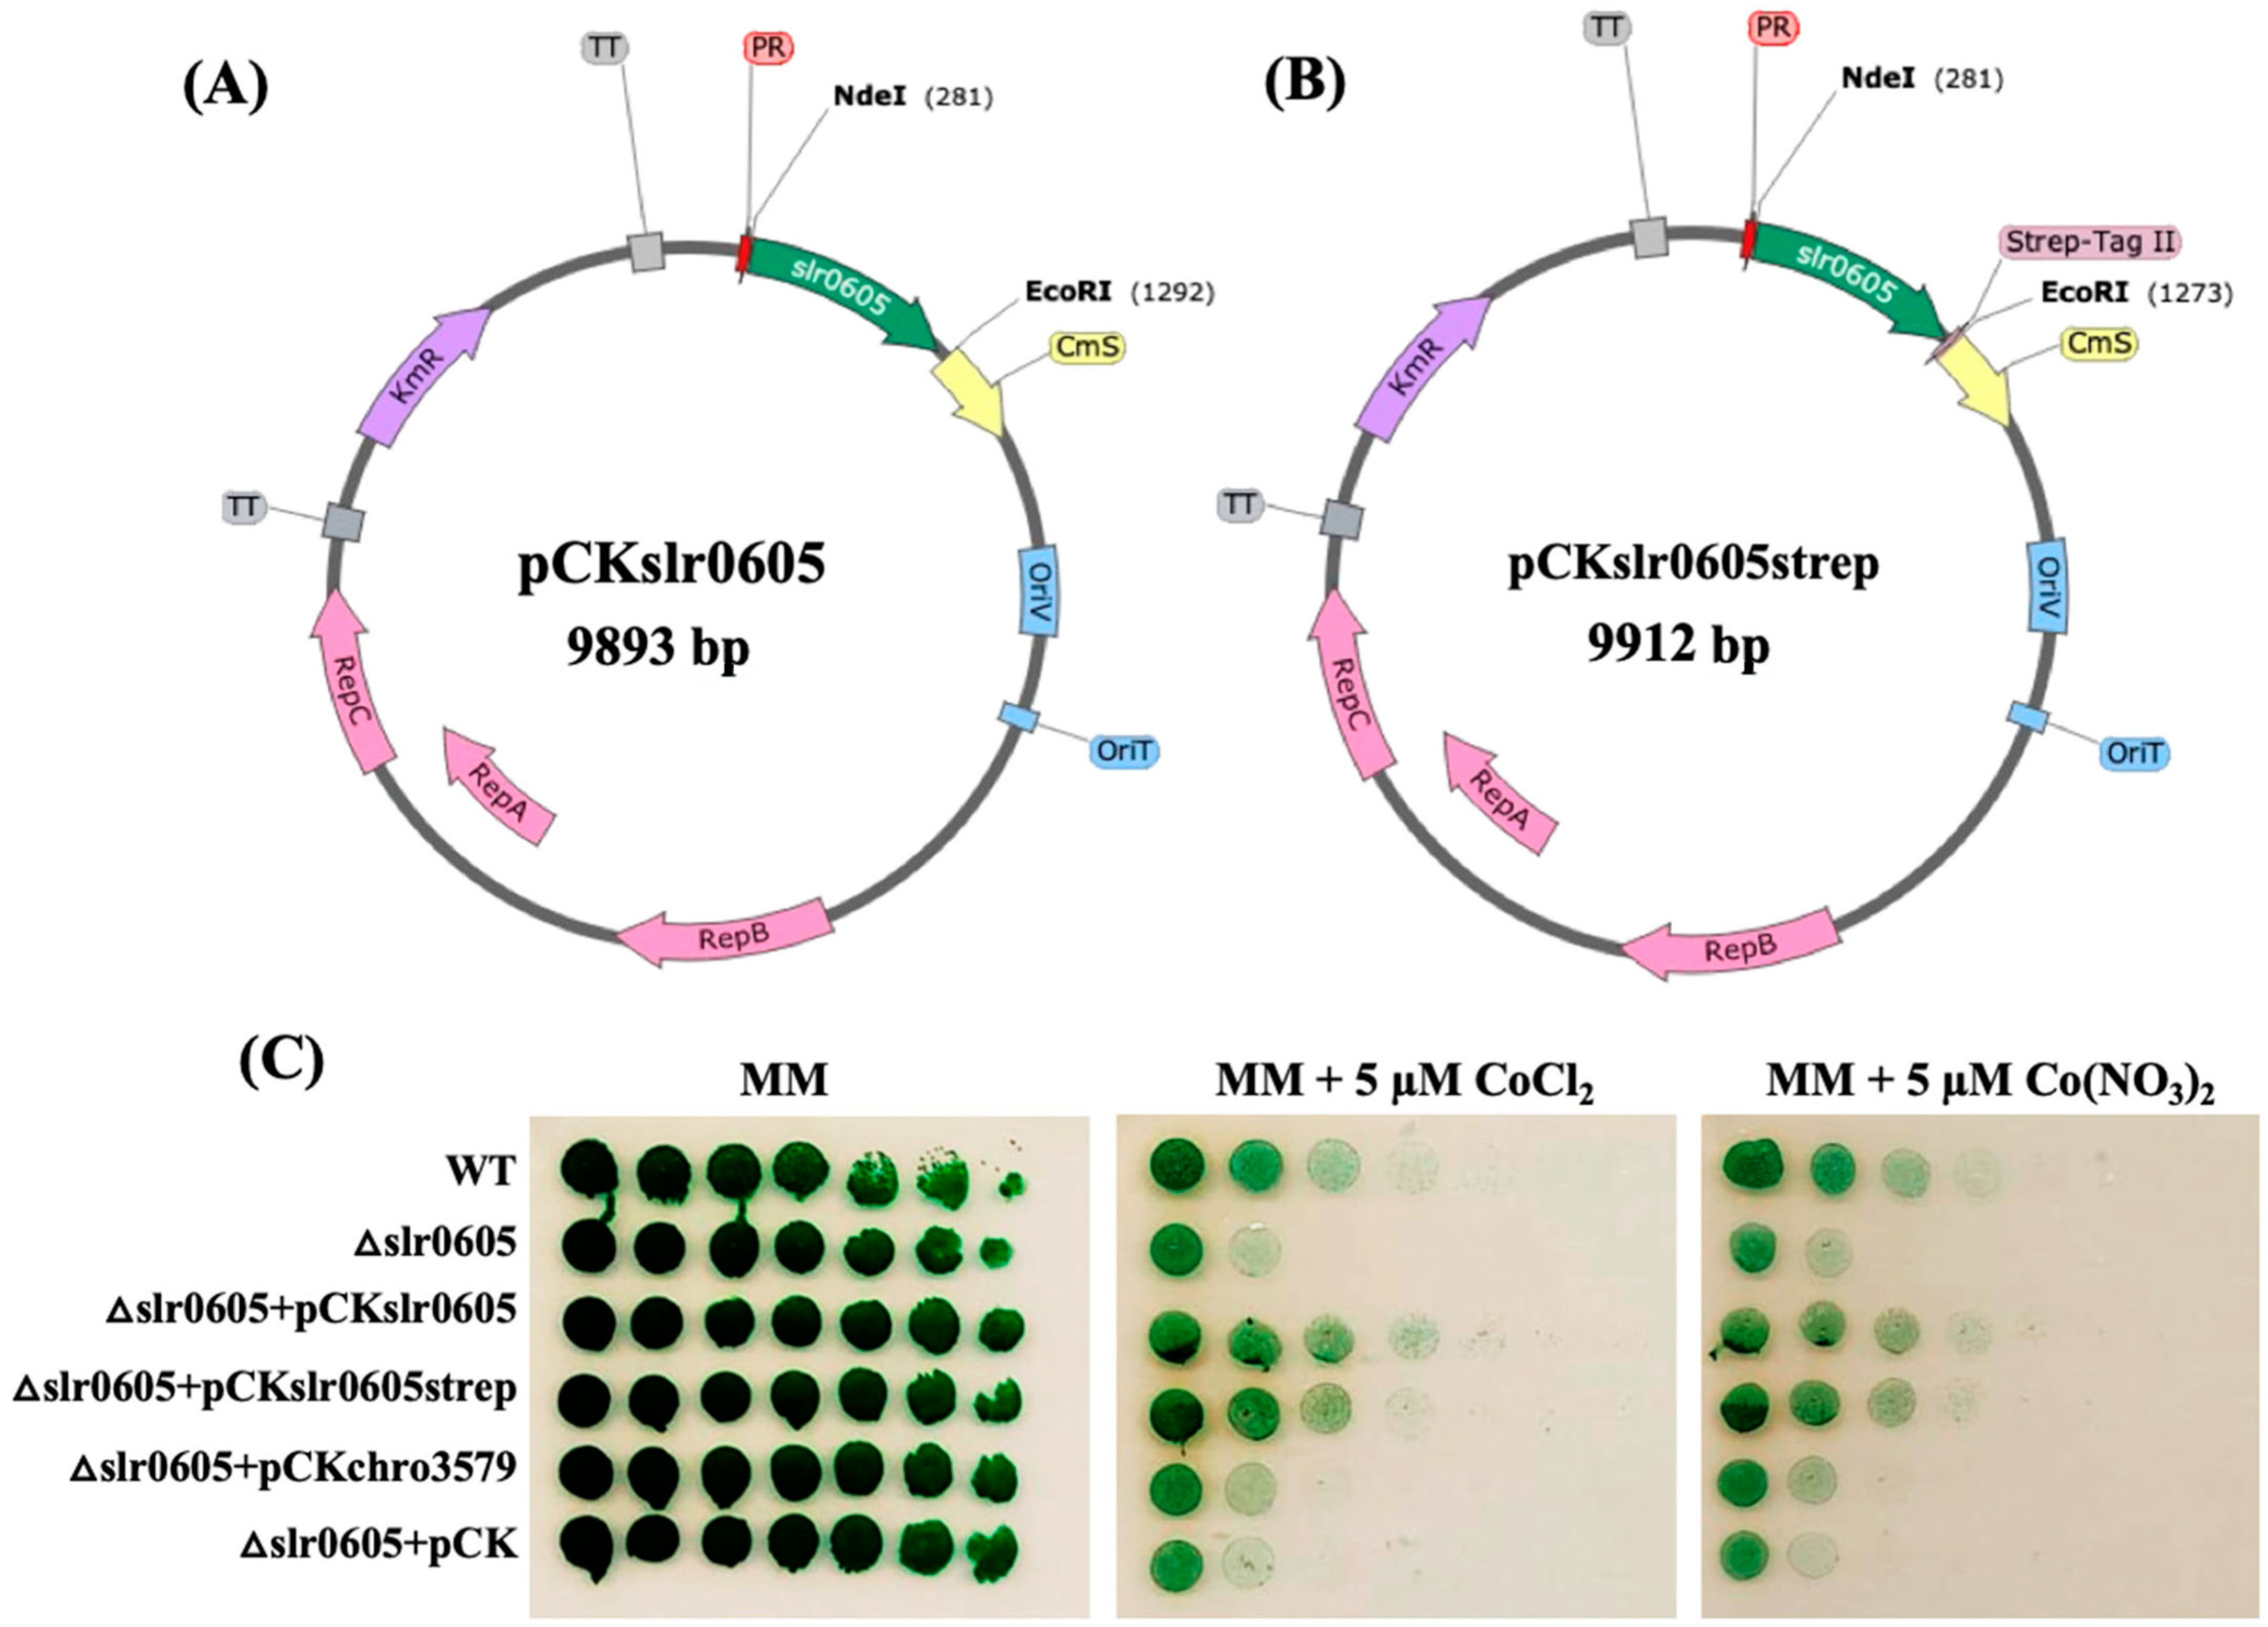
To prove that the Co sensitivity of Δslr0605 cells is due solely to the absence of slr0605, this gene was reintroduced in the Δslr0605 mutant. For this purpose, slr0605 was cloned (Section 2) in the pCK replicative plasmid, a KmR derivative of the pFC1 vector, for efficient gene expression from the strong lambda-phage pR-promoter [34]. Similarly, we also cloned, in pCK, a slr0605 gene, translationally fused at its 3′OH side to the Strep-tagII, for the facile purification of the Slr0605 protein and to test its activity. The resulting pCKslr0605 and pCKslr0605strep plasmids and the pCK control plasmid were introduced by conjugation [34] in Δslr0605::SmR/SpR cells, selecting for resistance to Km, Sm and Sp. In all three cases, two KmR,SmR/SpR clones were analyzed by PCR to show that both the pCKslr0605 and pCKslr0605strep plasmids replicate well in the Δslr0605 mutant, as does the control pCK vector. The resulting strains, and the WT and Δslr0605 control strains, were plated on a solid MM medium with or without 5 µM Co to test their Co tolerance (Figure 8). As expected, the pCKslr0605 and pCKslr0605strep plasmids increased the Co resistance of the Δslr0605 mutant up to the WT level. These data show that the reintroduction of the slr0605 gene, or its Strep-tagged derivative, in the Δslr0605 mutant restores its tolerance to cobalt. They also indicate that the strep tag has no negative influence on Slr0605 activity.

3.8. Slr0605 Is a Genuine Glutathionyl–Hydroquinone Reductase

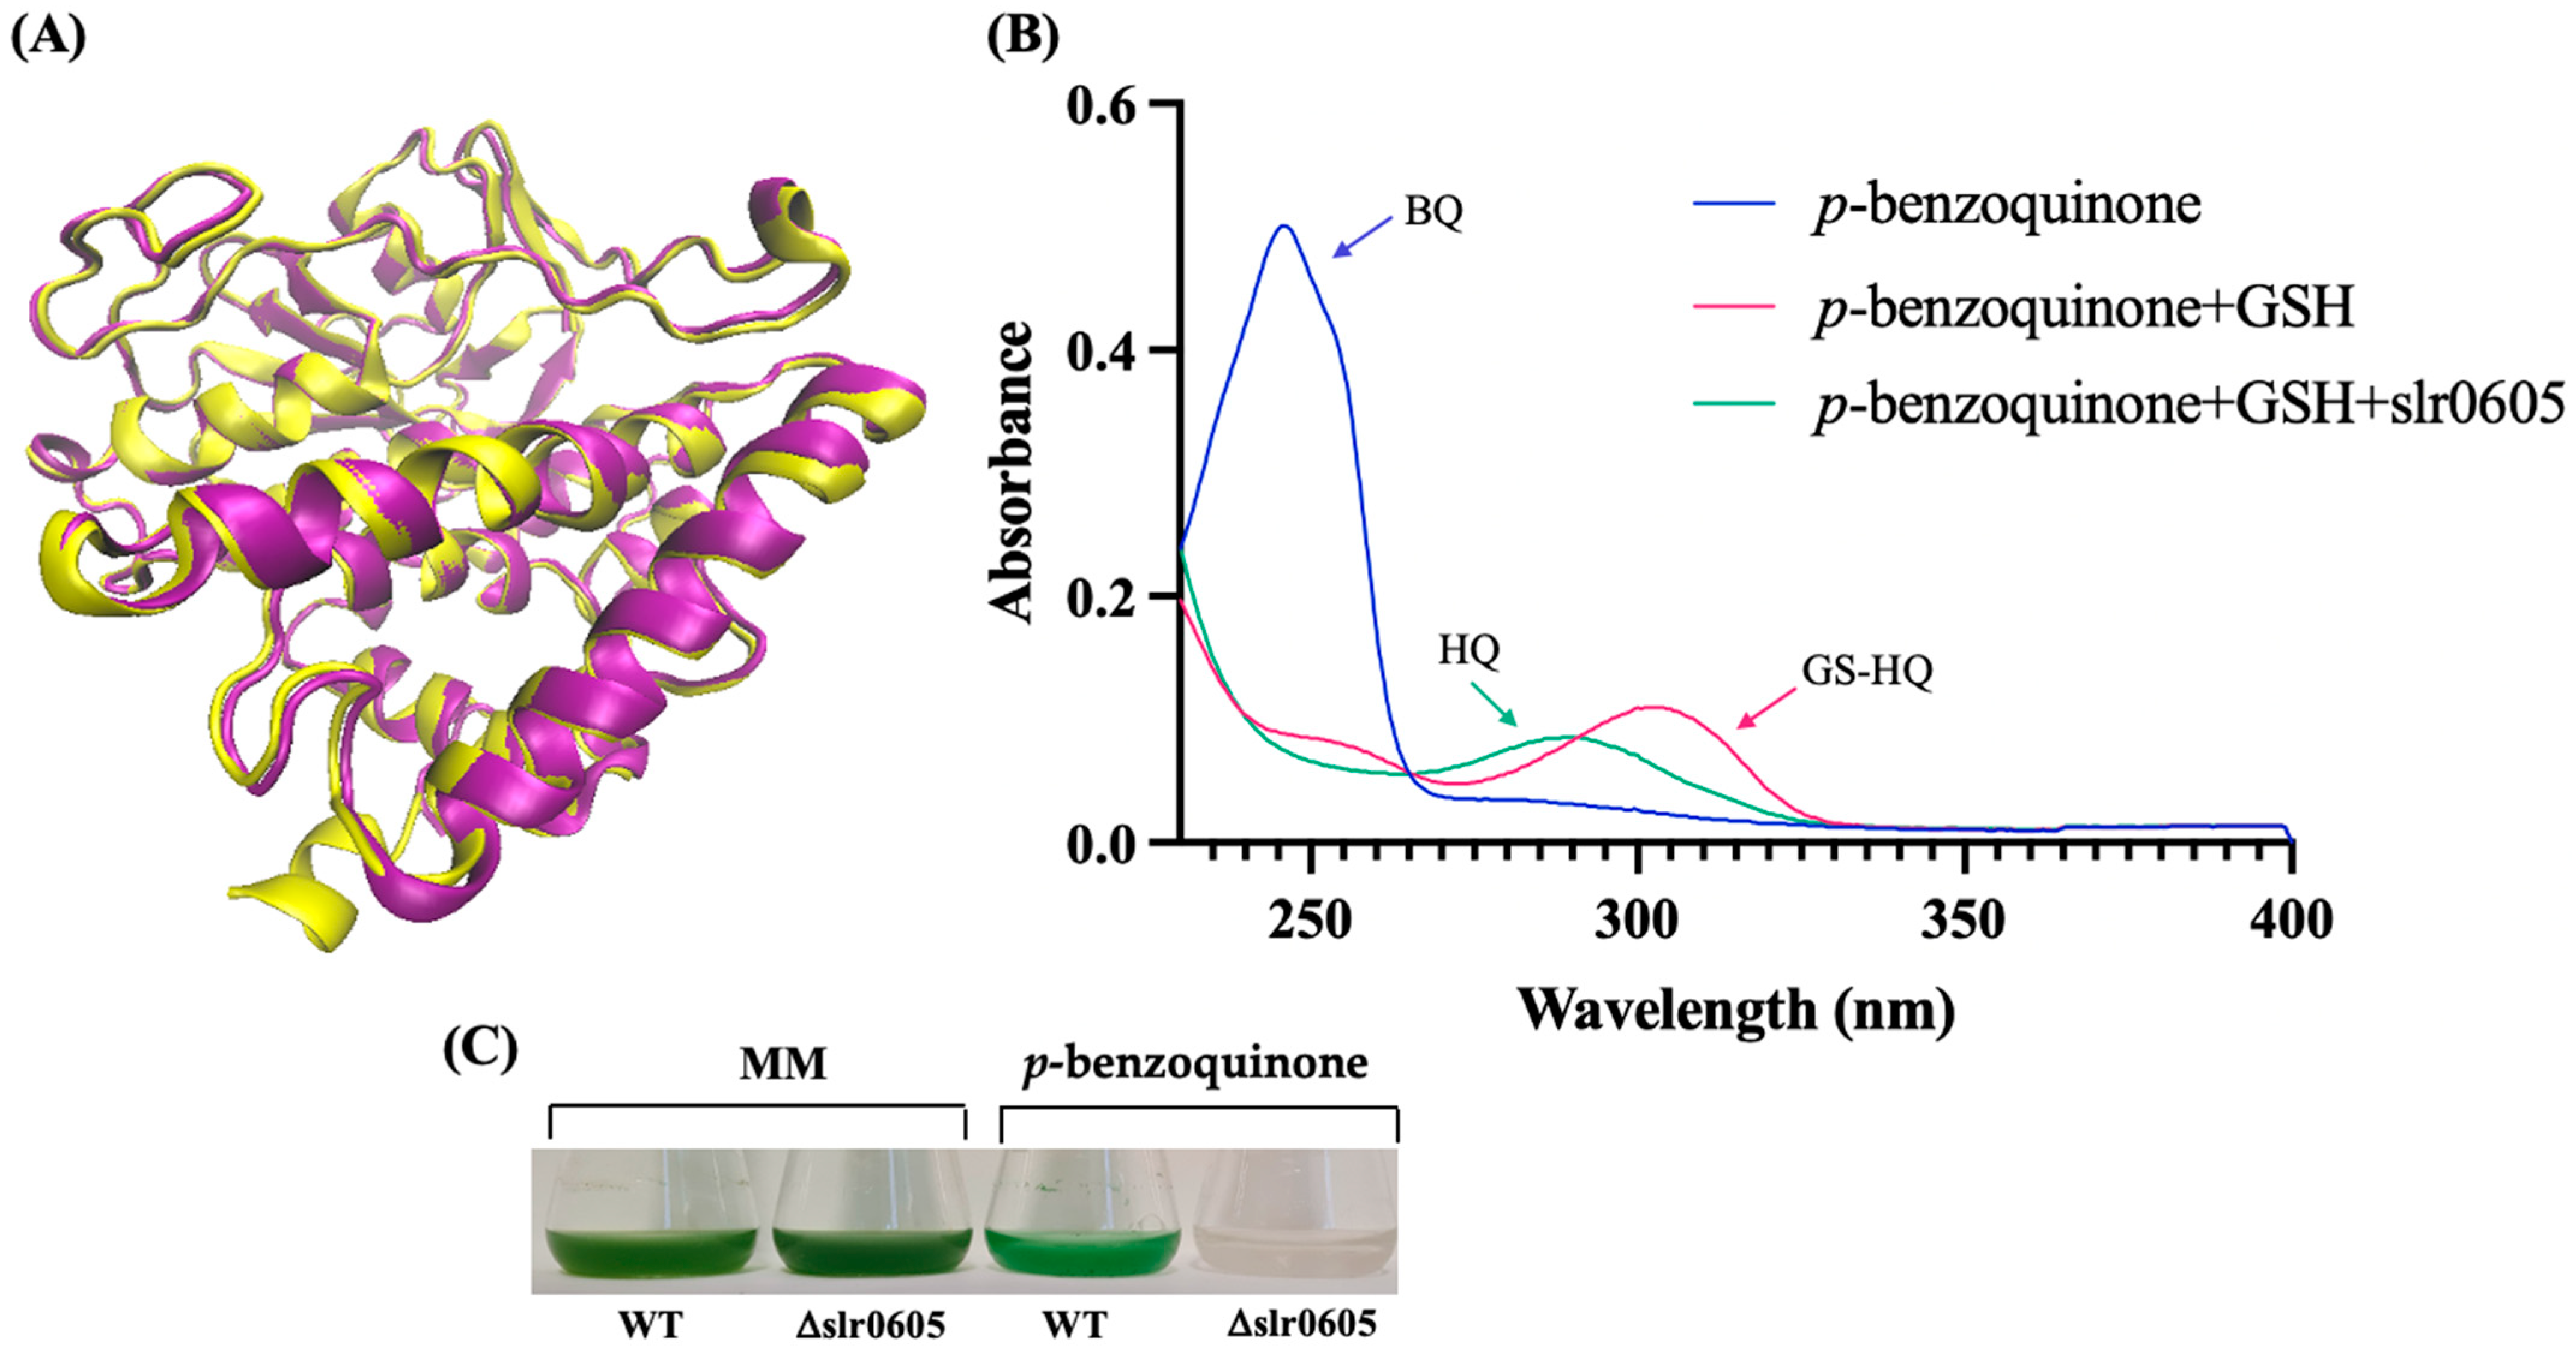
In accordance with the KEGG database, where Slr0605 is labeled as a glutathionyl–hydroquinone reductase protein [EC:1.8.5.7], sequence comparison analysis using BLAST [57] indicated that Slr0605 shares homology with Xi-class GSTs (Figure S5). These enzymes catalyze the glutathione (GSH)-dependent reduction in glutathionyl–hydroquinones (GS–hydroquinones) to hydroquinones to avoid the formation of toxic ROS [12,13,14]. Glutathionyl–hydroquinone reductases (GHRs) are widely distributed in bacteria, fungi and plants (not in animals), but have not yet been studied in cyanobacteria. To test the possible GS-HQRs activity of Slr0605, the Strep-tagged Slr0605 protein was extracted from cells propagating the pCKslr0605strep plasmid and affinity purified on Strep-Tactin XT Sepharose (Figure S6). As anticipated, Slr0605 appeared to be a dimeric protein, with a predicted structure similar to GHRs (Figure 9). Consistently, Slr0605 was found to have genuine GHR activity and to be required for tolerance to benzoquinone (Figure 9).

4. Conclusions

Glutathione transferases (GST) are widespread detoxication enzymes [1] of great importance for human health [3] and agriculture [5]. However, the analysis of the selectivity/redundancy of GSTs is complex in higher eukaryotes because they possess multiple GSTs as well as various cell types and tissues. In contrast, basic organisms, such as cyanobacteria, are attractive organisms for studying the selectivity/redundancy of GSTs. Indeed, cyanobacteria have fewer GSTs and a simple morphology, especially the unicellular strain Synechocystis PCC 6803 [1], which was presently used as a model. Cyanobacteria are also interesting because they are regarded as having evolved GSTs (and other glutathione-using enzymes) for their protection against stresses [1,16].
Among the superfamily of GSTs, the Xi-class enzymes found in prokaryotes, fungi and plants have been studied in a few articles, which reported that they have glutathionyl–hydroquinone reductase activity [12,13,14]. However, the physiological role of Xi GSTs had not yet been well studied, especially in cyanobacteria.
In this study, we report the first analysis of a putative cyanobacterial Xi GST, designated as Slr0605, in the model host Synechocystis PCC 6803. We show that Slr0605 is not crucial for standard photoautotrophic growth. However, Slr0605 is required for protection against excess cobalt, a metal crucial in trace amounts for the synthesis of vitamin B12 and other cobalamins [28,29,30], which can become toxic at high doses [31] and are released by industrial pollution [58]. We also show that Slr0605 has a protective effect against the Co-elicited disturbance of photosynthetic pigments, iron (Fe) homeostasis and the biogenesis/repair of enzymatic iron–sulfur [Fe-S] clusters, which trigger oxidative stress. These findings are welcome, since the protective role of GST on cobalt toxicity had not yet been firmly established through the construction and phenotypic analysis of GST-null mutants. We also report that Slr0605 has both the homodimeric form and the glutathionyl–hydroquinone reductase activity of genuine Xi GSTs. In agreement with these findings, Slr0605 appeared to be required for protection against benzoquinone.

Supplementary Materials

The following supporting information can be downloaded at: https://www.mdpi.com/article/10.3390/antiox13121577/s1; Figure S1: Construction of the ΔsufR deletion mutant of Synechocystis; Figure S2: PCR analysis of the ΔsufR deletion mutant; Figure S3: Construction of the Δslr0605::SmR/SpR deletion cassette; Figure S4: Construction of the pCKslr0605 and pCKslr0605strep plasmids; Figure S5: Sequence alignment of the Slr0605 protein with representative GHR class GSTs; Figure S6: Analysis of the Strep-tagged Slr0605 protein extracted from Synechocystis; Table S1: List of plasmids used in this study; Table S2: List of PCR primers used in this study.

Author Contributions

Conceptualization, F.C. and C.C.-C.; methodology, F.C., C.C.-C., F.M., S.F., M.L.-S. and S.O.; validation, F.M., S.F., M.L.-S. and S.O.; formal analysis, F.M., M.L.-S., S.F. and S.O.; investigation, F.M., S.F., M.L.-S., S.O., C.C.-C. and F.C.; resources, F.C. and C.C.-C.; writing—original draft preparation, F.C. and C.C.-C.; writing—review and editing, F.C., C.C.-C., F.M. and S.O.; supervision, F.C. and C.C.-C.; project administration, F.C. and C.C.-C.; funding acquisition, F.C. and C.C.-C. All authors have read and agreed to the published version of the manuscript.

Funding

This research was funded by the FocusDem program of CEA (A-BIOEN-04-AP-02), which also paid for the PhD fellowship of FM.

Institutional Review Board Statement

Not applicable.

Informed Consent Statement

Not applicable.

Data Availability Statement

Data are contained within the article and Supplementary Materials.

Acknowledgments

We thank Xavier Kammerscheit for his experimental help at the initial stage of this work and both Anne Durand and Anne-Soisig Steunou for her helpful discussion and critical reading of the manuscript.

Conflicts of Interest

The authors declare no conflicts of interest. The funders had no role in the design of the study; in the collection, analyses, or interpretation of data; in the writing of the manuscript; or in the decision to publish the results.

References

  1. Cassier-Chauvat, C.; Marceau, F.; Farci, S.; Ouchane, S.; Chauvat, F. The Glutathione System: A Journey from Cyanobacteria to Higher Eukaryotes. Antioxidants 2023, 12, 1199. [Google Scholar] [CrossRef] [PubMed]
  2. Josephy, P.D. Genetic Variations in Human Glutathione Transferase Enzymes: Significance for Pharmacology and Toxicology. Hum. Genom. Proteom. 2010, 2010, 876940. [Google Scholar] [CrossRef] [PubMed]
  3. Sing, R.R.; Reindi, K.M. Glutathione S-Transferases in Cancer. Antioxidants 2021, 10, 701. [Google Scholar] [CrossRef] [PubMed]
  4. Gullner, G.; Komives, T.; Kiraly, L.; Schröder, P. Glutathione S-Transferase Enzymes in Plant-Pathogen Interactions. Front. Plant Sci. 2018, 9, 1836. [Google Scholar] [CrossRef] [PubMed]
  5. Gallé, Á.; Czékus, Z.; Bela, K.; Horváth, E.; Ördög, A.; Csiszár, J.; Poór, P. Plant Glutathione Transferases and Light. Front. Plant Sci. 2019, 9, 1944. [Google Scholar] [CrossRef] [PubMed]
  6. Kammerscheit, X.; Hecker, A.; Rouhier, N.; Chauvat, F.; Cassier-Chauvat, C. Methylglyoxal Detoxification Revisited: Role of Glutathione Transferase in Model Cyanobacterium Synechocystis sp. Strain PCC 6803. mBio 2020, 11, e00882-20. [Google Scholar] [CrossRef] [PubMed]
  7. Shin, H.S.; Park, E.-H.; Fuchs, J.A.; Lim, C.-J. Characterization, Expression and Regulation of a Third Gene Encoding Glutathione S-Transferase from the Fission Yeast. Biochim. Biophys. Acta (BBA) Gene Struct. Expr. 2002, 1577, 164–170. [Google Scholar] [CrossRef]
  8. Kumar, S.; Trivedi, P.K. Glutathione S-Transferases: Role in Combating Abiotic Stresses Including Arsenic Detoxification in Plants. Front. Plant Sci. 2018, 9, 751. [Google Scholar] [CrossRef]
  9. Schwartz, M.; Perrot, T.; Aubert, E.; Dumarçay, S.; Favier, F.; Gérardin, P.; Morel-Rouhier, M.; Mulliert, G.; Saiag, F.; Didierjean, C.; et al. Molecular Recognition of Wood Polyphenols by Phase II Detoxification Enzymes of the White Rot Trametes versicolor. Sci. Rep. 2018, 8, 8472. [Google Scholar] [CrossRef]
  10. Kalinina, E.; Novichkova, M. Glutathione in Protein Redox Modulation through S-Glutathionylation and S-Nitrosylation. Molecules 2021, 26, 435. [Google Scholar] [CrossRef] [PubMed]
  11. Musaogullari, A.; Chai, Y.C. Redox Regulation by Protein S-Glutathionylation: From Molecular Mechanisms to Implications in Health and Disease. Int. J. Mol. Sci. 2020, 21, 8113. [Google Scholar] [CrossRef] [PubMed]
  12. Di Matteo, A.; Federici, L.; Masuli, M.; Carletti, E.; Santorelli, D.; Paradisi, P.; Di Ilio, C.; Allocati, N. Structural Characterization of the Xi Class Glutathione Transferase From the Haloalkaliphilic Archaeon Natrialba magadii. Front. Microbiol. 2019, 10, 9. [Google Scholar] [CrossRef]
  13. Green, A.R.; Hayes, R.P.; Xun, L.; Kang, C. Structural Understanding of the Glutathione-Dependent Reduction Mechanism of Glutathionyl-Hydroquinone Reductases. J. Biol. Chem. 2012, 287, 35838–35848. [Google Scholar] [CrossRef] [PubMed]
  14. Lallement, P.-A.; Meux, E.; Gualberto, J.M.; Dumarcay, S.; Favier, F.; Didierjean, C.; Saul, F.; Haouz, A.; Morel-Rouhier, M.; Gelhaye, E.; et al. Glutathionyl-Hydroquinone Reductases from Poplar Are Plastidial Proteins That Deglutathionylate Both Reduced and Oxidized Glutathionylated Quinones. FEBS Lett. 2015, 539, 37–44. [Google Scholar] [CrossRef]
  15. Fahey, R.C.; Buschbacher, R.M.; Newton, G.L. The Evolution of Glutathione Metabolism in Phototrophic Microorganisms. J. Mol. Evol. 1987, 25, 81–88. [Google Scholar] [CrossRef]
  16. ShylajaNaciyar, M.; Karthick, L.; Prakasam, P.A.; Deviram, G.; Uma, L.; Prabaharan, D.; Saha, S.K. Diversity of Glutathione S-Transferases (GSTs) in Cyanobacteria with Reference to Their Structures, Substrate Recognition and Catalytic Functions. Microorganisms 2020, 8, 712. [Google Scholar] [CrossRef] [PubMed]
  17. Partensky, F.; Hess, W.R.; Vaulot, D. Prochlorococcus, a Marine Photosynthetic Prokaryote of Global Significance. Microbiol. Mol. Biol. Rev. 1999, 63, 106–127. [Google Scholar] [CrossRef] [PubMed]
  18. Cassier-Chauvat, C.; Chauvat, F. Responses to Oxidative and Heavy Metal Stresses in Cyanobacteria: Recent Advances. Int. J. Mol. Sci. 2015, 16, 871–886. [Google Scholar] [CrossRef] [PubMed]
  19. Demay, J.; Bernard, C.; Reinhardt, A.; Marie, B. Natural Products from Cyanobacteria: Focus on Beneficial Activities. Mar. Drugs 2019, 17, 320. [Google Scholar] [CrossRef]
  20. Victoria, A.J.; Asrbury, M.J.; McCormick, A.J. Engineering Highly Productive Cyanobacteria towards Carbon Negative Emissions Technologies. Curr. Opin. Biotechnol. 2024, 87, 103141. [Google Scholar] [CrossRef] [PubMed]
  21. Kammerscheit, X.; Chauvat, F.; Cassier-Chauvat, C. First In Vivo Evidence That Glutathione-S-Transferase Operates in Photo-Oxidative Stress in Cyanobacteria. Front. Microbiol. 2019, 10, 1899. [Google Scholar] [CrossRef]
  22. Pandey, T.; Chhetri, G.; Chinta, R.; Kumar, B.; Singh, D.B.; Tripathi, T.; Singh, A.K. Functional Classification and Biochemical Characterization of a Novel Rho Class Glutathione S-Transferase in Synechocystis PCC 6803. FEBS Open Bio 2015, 5, 1–7. [Google Scholar] [CrossRef]
  23. Pandey, T.; Shukla, R.; Shukla, H.; Sonkar, A.; Tripathi, T.; Singh, A.K. A Combined Biochemical and Computational Studies of the Rho-Class Glutathione s-Transferase Sll1545 of Synechocystis PCC 6803. Int. J. Biol. Macromol. 2017, 94, 378–385. [Google Scholar] [CrossRef]
  24. Kammerscheit, X.; Chauvat, F.; Cassier-Chauvat, C. From Cyanobacteria to Human, MAPEG-Type Glutathione-S-Transferases Operate in Cell Tolerance to Heat, Cold, and Lipid Peroxidation. Front. Microbiol. 2019, 10, 2248. [Google Scholar] [CrossRef]
  25. Pandey, T.; Singh, S.K.; Chhetri, G.; Tripathi, T.; Singh, A.K. Characterization of a Highly pH Stable Chi-Class Glutathione S-Transferase from Synechocystis PCC 6803. PLoS ONE 2015, 10, e0126811. [Google Scholar] [CrossRef] [PubMed]
  26. Mocchetti, E.; Morette, L.; Mulliert, G.; Mathiot, S.; Guillot, B.; Dehez, F.; Chauvat, F.; Cassier-Chauvat, C.; Brochier-Armanet, C.; Didierjean, C.; et al. Biochemical and Structural Characterization of Chi-Class Glutathione Transferases: A Snapshot on the Glutathione Transferase Encoded by Sll0067 Gene in the Cyanobacterium Synechocystis sp. Strain PCC 6803. Biomolecules 2022, 12, 1466. [Google Scholar] [CrossRef]
  27. Thornalley, P.J. Protein and Nucleotide Damage by Glyoxal and Methylglyoxal in Physiological Systems-Role in Ageing and Disease. Drug Metab. Drug Interact. 2008, 23, 125–150. [Google Scholar] [CrossRef] [PubMed]
  28. Hawco, N.J.; Mcilvin, M.M.; Bundy, R.M.; TagliabueSaito, A.; Goepfert, T.J.; Moran, D.M.; Valentin-Alvarado, L.; DiTullio, G.R.; Saito, M.A. Minimal Cobalt Metabolism in the Marine Cyanobacterium Prochlorococcus. Proc. Natl. Acad. Sci. USA 2020, 117, 15740–15747. [Google Scholar] [CrossRef]
  29. Gleason, F.K.; Wood, J.M. Ribonucleotide Reductase in Blue-Green Algae: Dependence on Adenosylcobalamin. Science 1976, 192, 1343–1344. [Google Scholar] [CrossRef] [PubMed]
  30. Barras, F.; Fontecave, M. Cobalt Stress in Escherichia Coli and Salmonella Enterica: Molecular Bases for Toxicity and Resistance. Metallomics 2011, 3, 1130–1134. [Google Scholar] [CrossRef]
  31. García-Domínguez, M.; Lopez-Maury, L.; Florencio, F.J. A Gene Cluster Involved in Metal Homeostasis in the Cyanobacterium Synechocystis. J. Bacteriol. 2000, 182, 1507–1514. [Google Scholar] [CrossRef] [PubMed]
  32. Stanier, R.Y.; Kunisawa, R.; Mandel, M.; Cohen-Bazire, G. Purification and Properties of Unicellular Blue-Green Algae (Order Chroococcales). Bacteriol. Rev. 1971, 35, 171–205. [Google Scholar] [CrossRef] [PubMed]
  33. Labarre, J.; Chauvat, F.; Thuriaux, P. Insertional Mutagenesis by Random Cloning of Antibiotic Resistance Genes into the Genome of the Cyanobacterium Synechocystis Strain PCC 6803. J. Bacteriol. 1989, 171, 3449–3457. [Google Scholar] [CrossRef] [PubMed]
  34. Mermet-Bouvier, P.; Chauvat, F. A Conditional Expression Vector for the Cyanobacteria Synechocystis sp. Strains PCC6803 and PCC6714 or Synechococcus sp. Strains PCC7942 and PCC6301. Curr. Microbiol. 1994, 28, 145–148. [Google Scholar] [CrossRef] [PubMed]
  35. Ritchie, R.J. Consistent Sets of Spectrophotometric Chlorophyll Equations for Acetone, Methanol and Ethanol Solvents. Photosynth. Res. 2006, 89, 27–41. [Google Scholar] [CrossRef] [PubMed]
  36. Wellburn, A.R. The Spectral Determination of Chlorophylls a and b, as Well as Total Carotenoids, Using Various Solvents with Spectrophotometers of Different Resolution. J. Plant Physiol. 1994, 144, 307–313. [Google Scholar] [CrossRef]
  37. Collier, J.L.; Grossman, A.R. Chlorosis Induced by Nutrient Deprivation in Synechococcus sp. Strain PCC 7942: Not All Bleaching Is the Same. J. Bacteriol. 1992, 174, 4718–4726. [Google Scholar] [CrossRef] [PubMed]
  38. Gomes, A.; Fernandes, E.; Lima, J. Fluorescence Probes Used for Detection of Reactive Oxygen Species. J. Biochem. Biophys. Methods 2005, 65, 45–80. [Google Scholar] [CrossRef] [PubMed]
  39. Gasteiger, E.; Hoogland, C.; Gattiker, A.; Duvaud, S.; Wilkins, M.R.; Appel, R.D.; Bairoch, A. Protein Identification and Analysis Tools on the ExPASy Server. In The Proteomics Protocols Handbook; Springer Protocols Handbooks; Humana Press: Totowa, NJ, USA, 2005; Volume 112, pp. 571–607. ISBN 978-1-58829-343-5. [Google Scholar]
  40. Haan, C.; Behrmann, I. A Cost Effective Non-Commercial ECL-Solution for Western Blot Detections Yielding Strong Signals and Low Background. J. Immunol. Methods 2007, 118, 11–19. [Google Scholar] [CrossRef]
  41. Lorusso, C.; Calisi, A.; Sarà, G.; Dondero, F. In-Gel Assay to Evaluate Antioxidant Enzyme Response to Silver Nitrate and Silver Nanoparticles in Marine Bivalve Tissues. Appl. Sci. 2022, 12, 2760. [Google Scholar] [CrossRef]
  42. Meux, E.; Prosper, P.; Ngadin, A.; Didierjean, C.; Morel, M.; Dumarçay, S.; Lamant, T.; Jacquot, J.P.; Favier, F.; Gelhaye, E. Glutathione Transferases of Phanerochaete chrysosporium: S-Glutathionyl-p-Hydroquinone Reductase Belongs to a New Structural Class. J. Biol. Chem. 2011, 286, 9162–9173. [Google Scholar] [CrossRef] [PubMed]
  43. West, R.M. Best Practice in Statistics: Use the Welch t-Test When Testing the Difference between Two Groups. Ann. Clin. Biochem. 2021, 58, 267–269. [Google Scholar] [CrossRef] [PubMed]
  44. Ross, A.; Willson, V.L. One-Way Anova. In Basic and Advanced Statistical Tests; SensePublishers: Rotterdam, The Netherlands, 2017; pp. 21–24. ISBN 978-94-6351-086-8. [Google Scholar]
  45. Huertas, M.J.; López-Maury, L.; Giner-Lamia, J.; Sánchez-Riego, A.M.; Florencio, F.J. Metals in Cyanobacteria: Analysis of the Copper, Nickel, Cobalt and Arsenic Homeostasis Mechanisms. Life 2014, 9, 865–886. [Google Scholar] [CrossRef]
  46. Babu, T.S.; Sabat, S.C.; Mohanty, P. Alterations in Photosystem II Organization by Cobalt Treatment in the Cyanobacterium Spirulina platensis. J. Plant Biochem. Biotechnol. 1992, 1, 61–63. [Google Scholar] [CrossRef]
  47. Lee, L.H.; Lustigman, B.; Chu, I.-Y.; Hsu, S. Effect of Lead and Cobalt on the Growth of Anacystis nidulans. Bull. Environ. Contam. Toxicol. 1992, 48, 230–236. [Google Scholar] [CrossRef]
  48. Martín-Betancor, K.; Aguado, S.; Rodea-Palomares, I.; Tamayo-Belda, M.; Leganés, F.; Rosal, R.; Fernández-Piñas, F. Co, Zn and Ag-MOFs Evaluation as Biocidal Materials towards Photosynthetic Organisms. Sci. Total Environ. 2017, 595, 547–555. [Google Scholar] [CrossRef]
  49. Golden, S.S. The International Journeys and Aliases of Synechococcus elongatus. N. Z. J. Bot. 2018, 57, 70–75. [Google Scholar] [CrossRef]
  50. Mettert, E.; Kiley, P. How Is Fe-S Cluster Formation Regulated? Annu. Rev. Microbiol. 2015, 69, 505–526. [Google Scholar] [CrossRef] [PubMed]
  51. Gao, F. Iron–Sulfur Cluster Biogenesis and Iron Homeostasis in Cyanobacteria. Front. Microbiol. 2020, 11, 165. [Google Scholar] [CrossRef] [PubMed]
  52. Hernández-Prieto, M.A.; Schön, V.; Georg, J.; Barreira, L.; Varela, J.; Hess, W.R.; Futschik, M.E. Iron Deprivation in Synechocystis: Inference of Pathways, Non-Coding RNAs, and Regulatory Elements from Comprehensive Expression Profiling. G3 Genes Genomes Genet. 2012, 2, 1475–1495. [Google Scholar] [CrossRef] [PubMed]
  53. Vuorijoki, L.; Tiwari, A.; Kallio, P.; Aro, E.M. Inactivation of Iron-Sulfur Cluster Biogenesis Regulator SufR in Synechocystis sp. PCC 6803 Induces Unique Iron-Dependent Protein-Level Responses. Biochim. Biophys. Acta (BBA) Gen. Subj. 2017, 1861, 1085–1098. [Google Scholar] [CrossRef] [PubMed]
  54. Ranquet, C.; Ollagnier-de-Choudens, S.; Loiseau, L.; Barras, F.; Fontecave, M. Cobalt Stress in Escherichia coli. The Effect on the Iron-Sulfur Proteins. J. Biol. Chem. 2007, 282, 30442–30451. [Google Scholar] [CrossRef] [PubMed]
  55. Wang, T.; Shen, G.; Balasubramanian, R.; McIntosh, L.; Bryant, D.; Golbeck, J. The sufR Gene (Sll0088 in Synechocystis sp. Strain PCC 6803) Functions as a Repressor of the sufBCDS Operon in Iron-Sulfur Cluster Biogenesis in Cyanobacteria. J. Bacteriol. 2004, 186, 956–967. [Google Scholar] [CrossRef] [PubMed]
  56. Gong, X.-M.; Agalarov, R.; Brettel, K.; Carmeli, C. Control of Electron Transport in Photosystem I by the Iron-Sulfur Cluster FX in Response to Intra- and Intersubunit Interactions. J. Biol. Chem. 2003, 278, 19141–19150. [Google Scholar] [CrossRef] [PubMed]
  57. Altschul, S.F.; Madden, T.L.; Schäffer, A.A.; Zhang, J.; Miller, W.; Lipman, D.J. Gapped BLAST and PSI-BLAST: A New Generation of Protein Database Search Programs. Nucleic Acids Res. 1997, 25, 3389–3402. [Google Scholar] [CrossRef] [PubMed]
  58. Genchi, G.; Graziantonio, L.; Catalano, A.; Carocci, A.; Sinicropi, M.S. Prevalence of Cobalt in the Environment and Its Role in Biological Processes. Biology 2023, 12, 1335. [Google Scholar] [CrossRef] [PubMed]
Figure 1. Influence of metals on cell growth and photosynthetic pigments of Synechocystis. (A) Cells in mid-log phase cultures (OD750nm = 0.5) were spotted as 10 µL dots onto solid mineral medium (MM) with or without 5 µM of the indicated metals. Plates were incubated for 7 days at 30° under standard light C, prior to photography. (B) Typical absorption spectra (normalized to light scattering at 800 nm) of the photosynthetic pigments extracted from similar number (1 × 10⁷ cells) of these cells. All experiments were performed at least three times.
Antioxidants 13 01577 g001
Figure 2. Influence of iron supplementation on cobalt resistance in Synechocystis. (A) Typical growth curves of cells incubated for the indicated durations under standard light at 30 °C on solid MM with or without either or both CoCl2 (5 µM) and FeCl3 (153 µM), prior to resuspension in liquid MM and measurements of absorption (OD750nm). (B) Photographs of spectrophotometric cuvettes containing cells that were incubated for 13 days (312 h) on plates with or without CoCl2 (5 µM) and/or FeCl3 (153 µM). (C,D) Typical absorption spectra normalized to light scattering at 800 nm or 569 nm of cells shown in (B). (EG) Column diagram representation of the quantities of chlorophyll, phycocyanin and carotenoids, respectively, extracted from cells shown in (B). All experiments were performed at least three times. Hooks ⊏ indicate significant difference between the two compared experiments (one-way ANOVA test, p < 0.0005 or 0.00005, symbolized by *** or ****), while “ns” stands for no statistical difference.
Antioxidants 13 01577 g002
Figure 3. Influence of the deletion of sufR on cobalt resistance in Synechocystis. Serial five-fold dilution of cultures (OD750nm = 1.0) of the WT strain, the ΔsufR mutant and various GST-less mutants (Δslr0605, Δsll1545, Δsll1147, Δsll0067 and Δsll1902) were spotted as 10 µL dots onto solid MM medium without or with 5 µM CoCl2 and incubated for 13 days at 30 °C under standard light prior to photography. These experiments were repeated at least three times.
Antioxidants 13 01577 g003
Figure 4. The Δslr0605 mutant is hypersensitive to cobalt. (A) The typical growth of the WT strain and the Δslr0605::SmR/SpR deletion mutant in liquid MM with or without 5 µM CoCl2. (B) At the indicated times, cells were transferred to a spectrophotometric cuvette and photographed. (C) Typical growth of the WT strain and the Δslr0605::SmR/SpR deletion mutant in solid MM with or without 5 µM CoCl2. At the indicated times, cells were resuspended in liquid MM and transferred to a spectrophotometric cuvette to measure their absorbance at OD750nm and photographed. (D) The serial five-fold dilution of mid-log phase cultures (OD750nm = 0.5) of the WT strain and the Δslr0605:SmR/SpR mutant, which were spotted as 10 µL dots onto solid MM medium with or without 5 µM CoCl2 and incubated under otherwise standard conditions for 13 days. (E) These cells were resuspended in liquid MM, transferred to cuvettes and photographed. These experiments were performed at least three times.
Antioxidants 13 01577 g004
Figure 5. Effect of cobalt on pigment content of wild-type strain and Δslr0605::SmR/SpR mutant. (A,B) Whole-cell absorption spectra (normalized to light scattering at 569 nm and 800 nm, respectively) of WT strain and Δslr0605::SmR/SpR cells grown for 13 days on solid MM with or without 5 µM CoCl2. (CE) Column diagram representation of quantity of carotenoids, chlorophyll a and phycocyanin of these cells, respectively. (F) Western blot analysis of abundance of photosystem I protein PsaA and photosystem II protein PsbA in WT and Δslr0605 mutants cultivated in absence or presence of excess Co. Similar quantities of total proteins (either 0.625 or 1.25 μg) were analyzed by Western blots, using antibodies directed against either protein PsaA or PsbA. These experiments were performed three times. Hooks ⊏ indicate significant difference between the two compared experiments (ANOVA test, p < 0.05, p < 0.005, p < 0.0005 or p < 0.00005 symbolized by *, **, ***, or ****, respectively); “ns” stands for no statistical difference.
Antioxidants 13 01577 g005
Figure 6. Effect of cobalt on level of Reactive Oxygen Species (ROS) and both catalase (CAT) and superoxide dismutase (SOD) activities in WT and Δslr0605 cells. (A) Column diagram representation of ROS levels in WT and Δslr0605 cells before or after incubation with 25 µM Co for indicated durations (ua means arbitrary units). Hooks ⊏ indicate significant difference between the two compared experiments (Welch test, p < 0.005, p < 0.005 or p < 0.00005, are symbolized by *, ** or ****, respectively). (B) Catalase activity tested by native PAGE gel-based assay (upper panel) of 10 µg proteins extracted from WT or Δslr0605 cells incubated with or without 5 µM Co for 13 days. As loading control (lower panel), same samples were resolved on 12% polyacrylamide gel showing band corresponding to phycobilisomes, which are naturally colored in blue. (C) SOD activity tested by native PAGE gel assay (upper panel) of 10 µg proteins extracted from WT or Δslr0605 cells incubated with or without 5 µM Co for 13 days. As a loading control (lower panel), same samples were resolved on 12% polyacrylamide gel showing blue band corresponding to phycobilisomes. These experiments were performed three times.
Antioxidants 13 01577 g006
Figure 7. Fe supplementation does not attenuate Co-elicited decline of cell growth and chlorophyll content in Δslr0605 mutant. (A,E) Appearance of cells grown for 13 days (312 h) ± Co, which were transferred into spectrophotometric cuvettes prior to photography. Typical whole-cell absorption spectra, normalized to light scattering at 800 nm (BD) or 569 nm (FH) of WT and Δslr0605 cells incubated on solid media with or without extra Co and/or Fe. Column diagram representation of the quantity of the carotenoids (I,J), chlorophyll a (K,L) and phycocyanin pigments (M,N) extracted from these cells. All experiments were performed at least three times. Hooks ⊏ indicate significant difference between the two compared experiments (ANOVA test, p < 0.05, p < 0.005, p < 0.0005 or p < 0.00005, symbolized by *, **, *** or ****); ns stands for no statistical difference.
Antioxidants 13 01577 g007
Figure 8. A schematic representation of the pCKslr0605 and pCKslr0605strep plasmids producing Slr0605 with or without a strep tag, and analysis of their influence on Co tolerance of the Δslr0605 mutant. (A,B) Schematic representation of the pCKslr0605 plasmid and its derivative pCKslr0605-strep for the facile purification of the Slr0605-strep protein. Slr0605 is shown in green, while the antibiotic resistance genes are shown in purple (KmR), yellow (CmR, CmS) or dark purple (AmpR). The pTwist replicon is shown in grey, while the RSF1010 genes for conjugative transfer and autonomous replication of the plasmids in both E. coli and Synechocystis are represented in blue rectangles and pink arrows, respectively. The lambda-phage pR-promoter (PR) is shown as the small red triangle. (C) The influence of pCKslr0605 and pCKslr0605strep on the Co tolerance of the Δslr0605 mutant. The serial five-fold dilution of cultures (OD750nm = 1.0) of the WT strain or the Δslr0605 mutant and its derivatives, producing Slr0605 with or without a strep tag. All cultures were spotted as 10 µL dots onto a solid MM medium without or with 5 µM Co and incubated for 13 days at 30 °C under standard light, prior to photography. These experiments were repeated at least three times.
Antioxidants 13 01577 g008
Figure 9. A representation of the structure of Slr0605 and verification of its glutathionyl–hydroquinone reductase activity. (A) A superposition of the ribbon diagrams representing the crystal structures of the EcYqjG glutathionyl–hydroquinone reductase (yellow, PDB: 4G0I) and Slr0605 (purple, AlphaFold). The root mean square deviation (RMSD) value pf 2.9 Å indicates that these two proteins share a certain degree of similarity. (B) A superposition of the absorption spectra of p-benzoquinone (BQ, blue), S-Glutathionyl–p-hydrobenzoquinone (GS-HQ, red) and HQ (p-benzohydroquinone, green). The addition of glutathione (GSH) to BQ produces GS-HQ, a stable compound that is converted into HQ by Slr0605 within a few minutes. (C) Typical growth of the WT strain and the Δslr0605::SmR/SpR deletion mutant in liquid MM with or without 14 µM p-benzoquinone.
Antioxidants 13 01577 g009
Disclaimer/Publisher’s Note: The statements, opinions and data contained in all publications are solely those of the individual author(s) and contributor(s) and not of MDPI and/or the editor(s). MDPI and/or the editor(s) disclaim responsibility for any injury to people or property resulting from any ideas, methods, instructions or products referred to in the content.