
Alterations in Glutathione Redox Homeostasis in Metabolic Dysfunction-Associated Fatty Liver Disease: A Systematic Review


Abstract
1. Introduction
2. Materials and Methods
2.1. Search Strategy
2.2. Article Screening and Selection
2.3. Data Extraction
3. Results
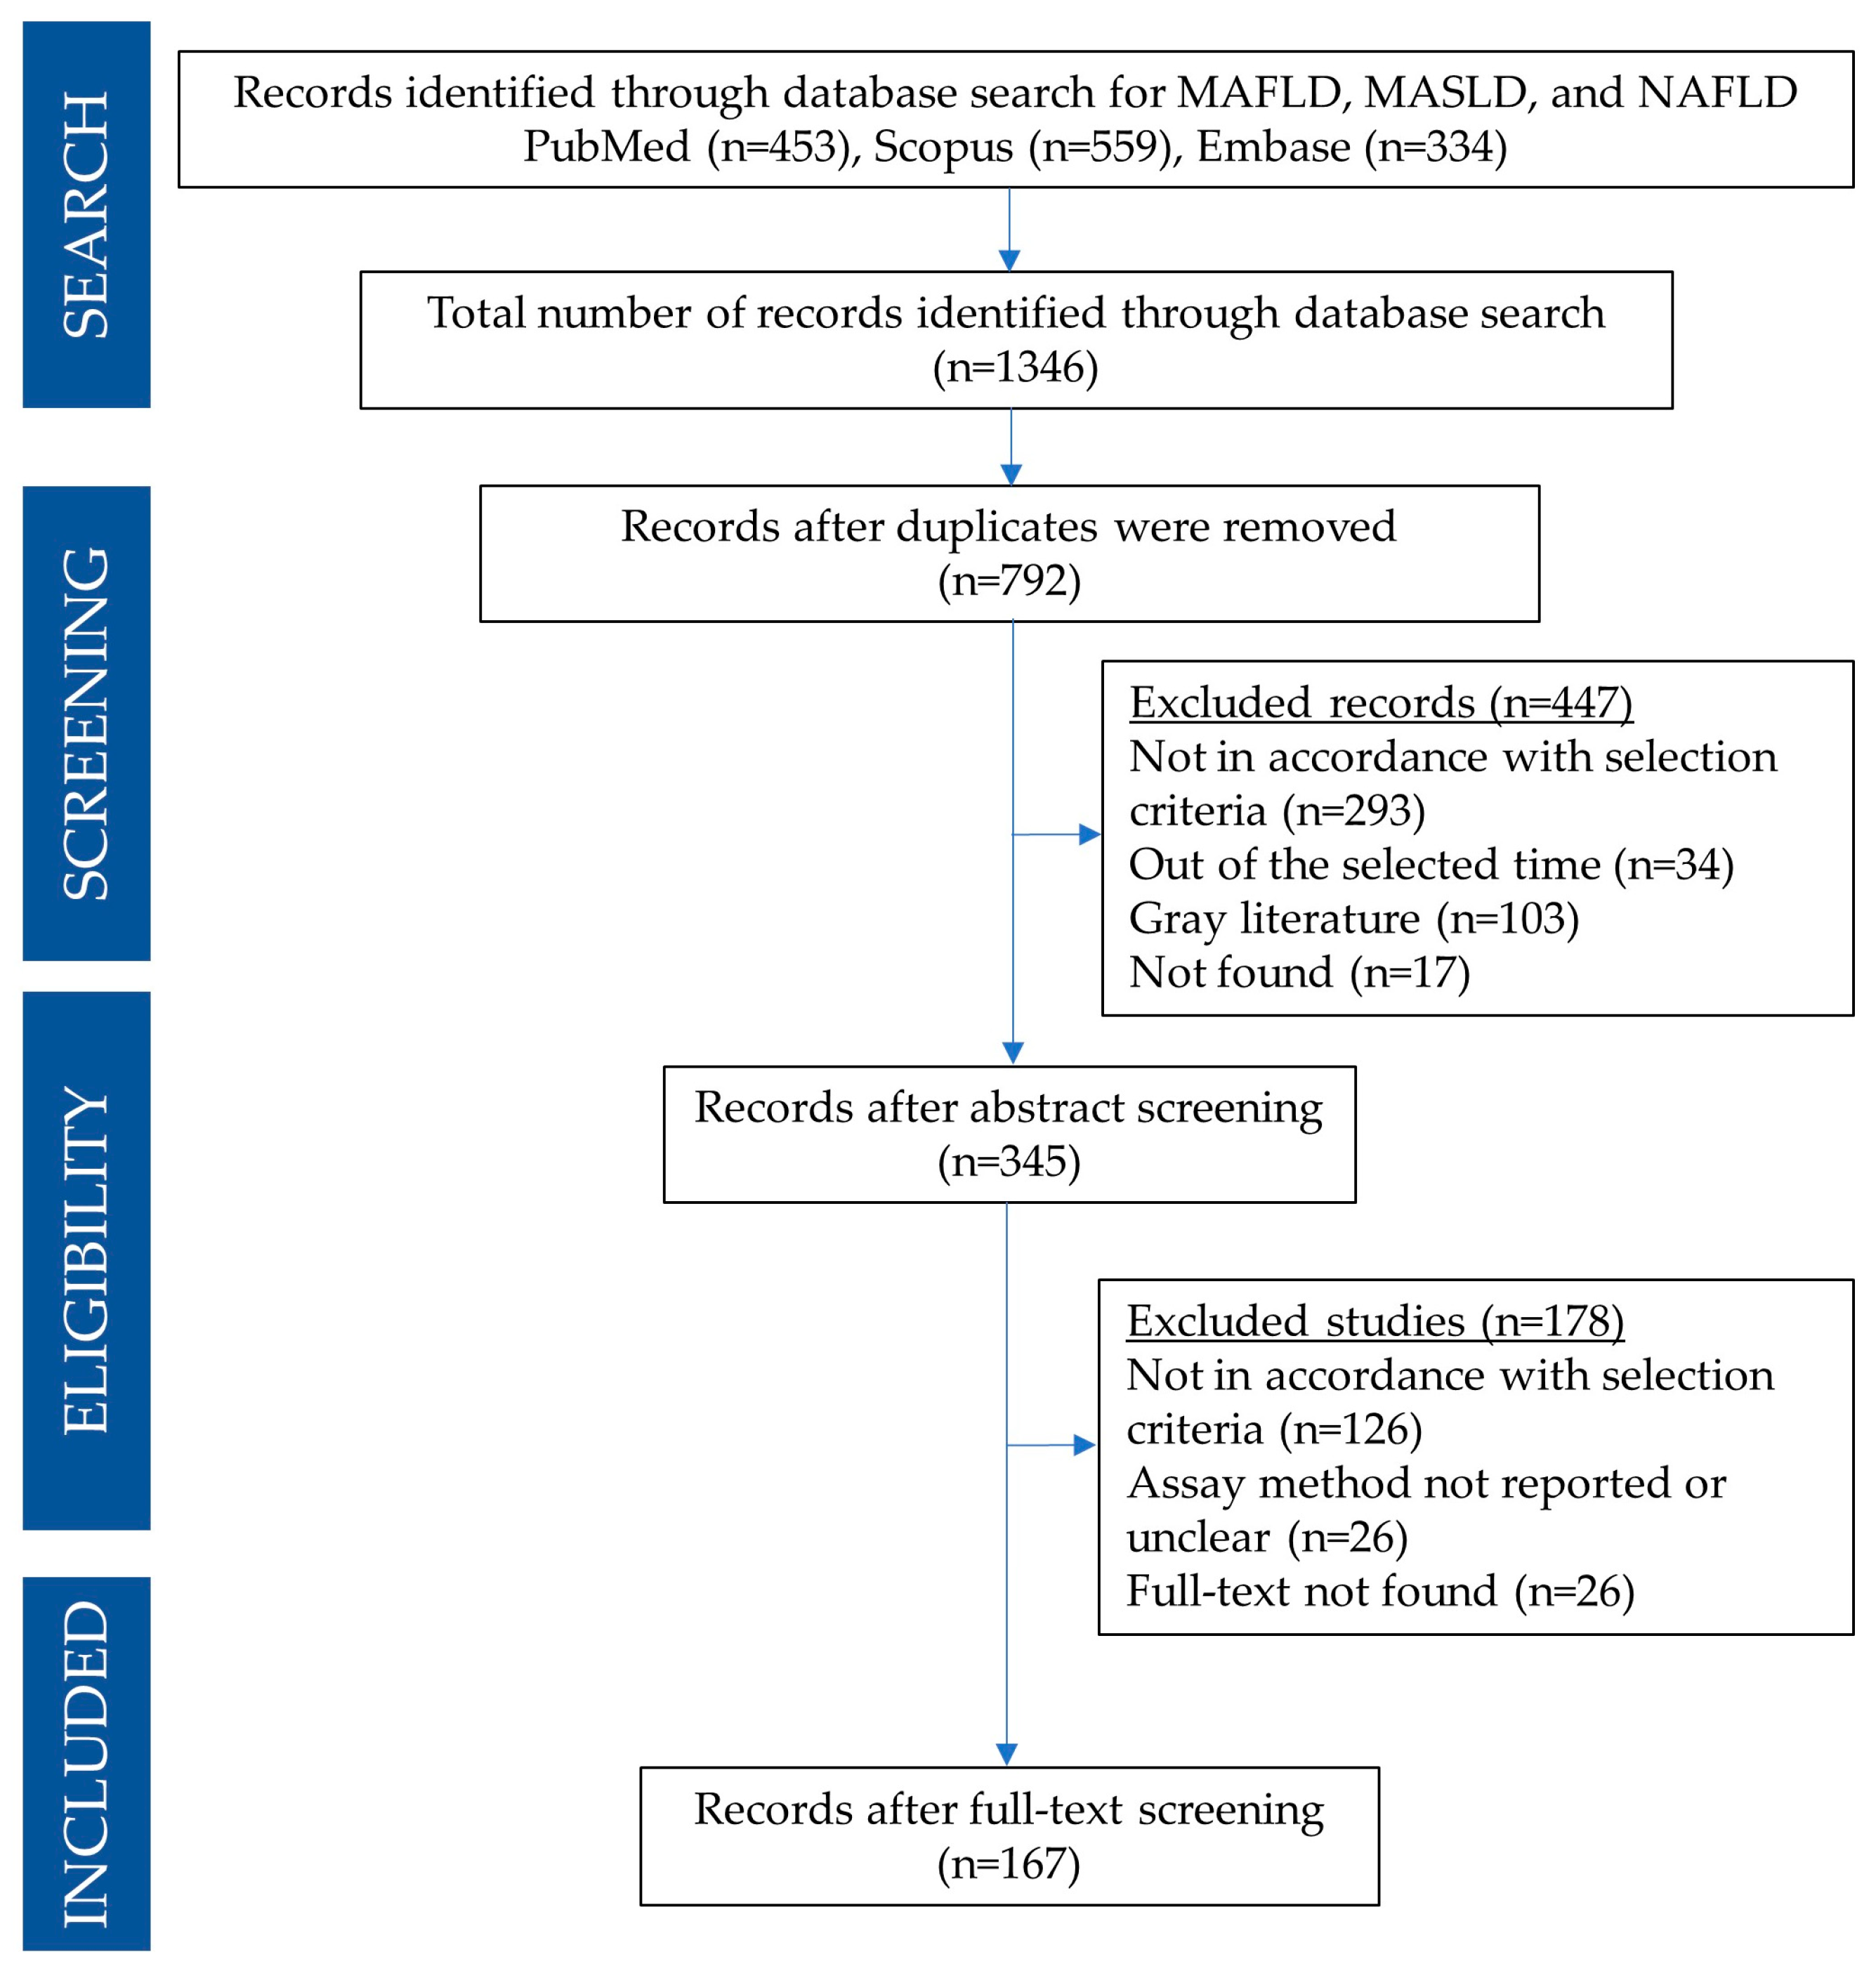
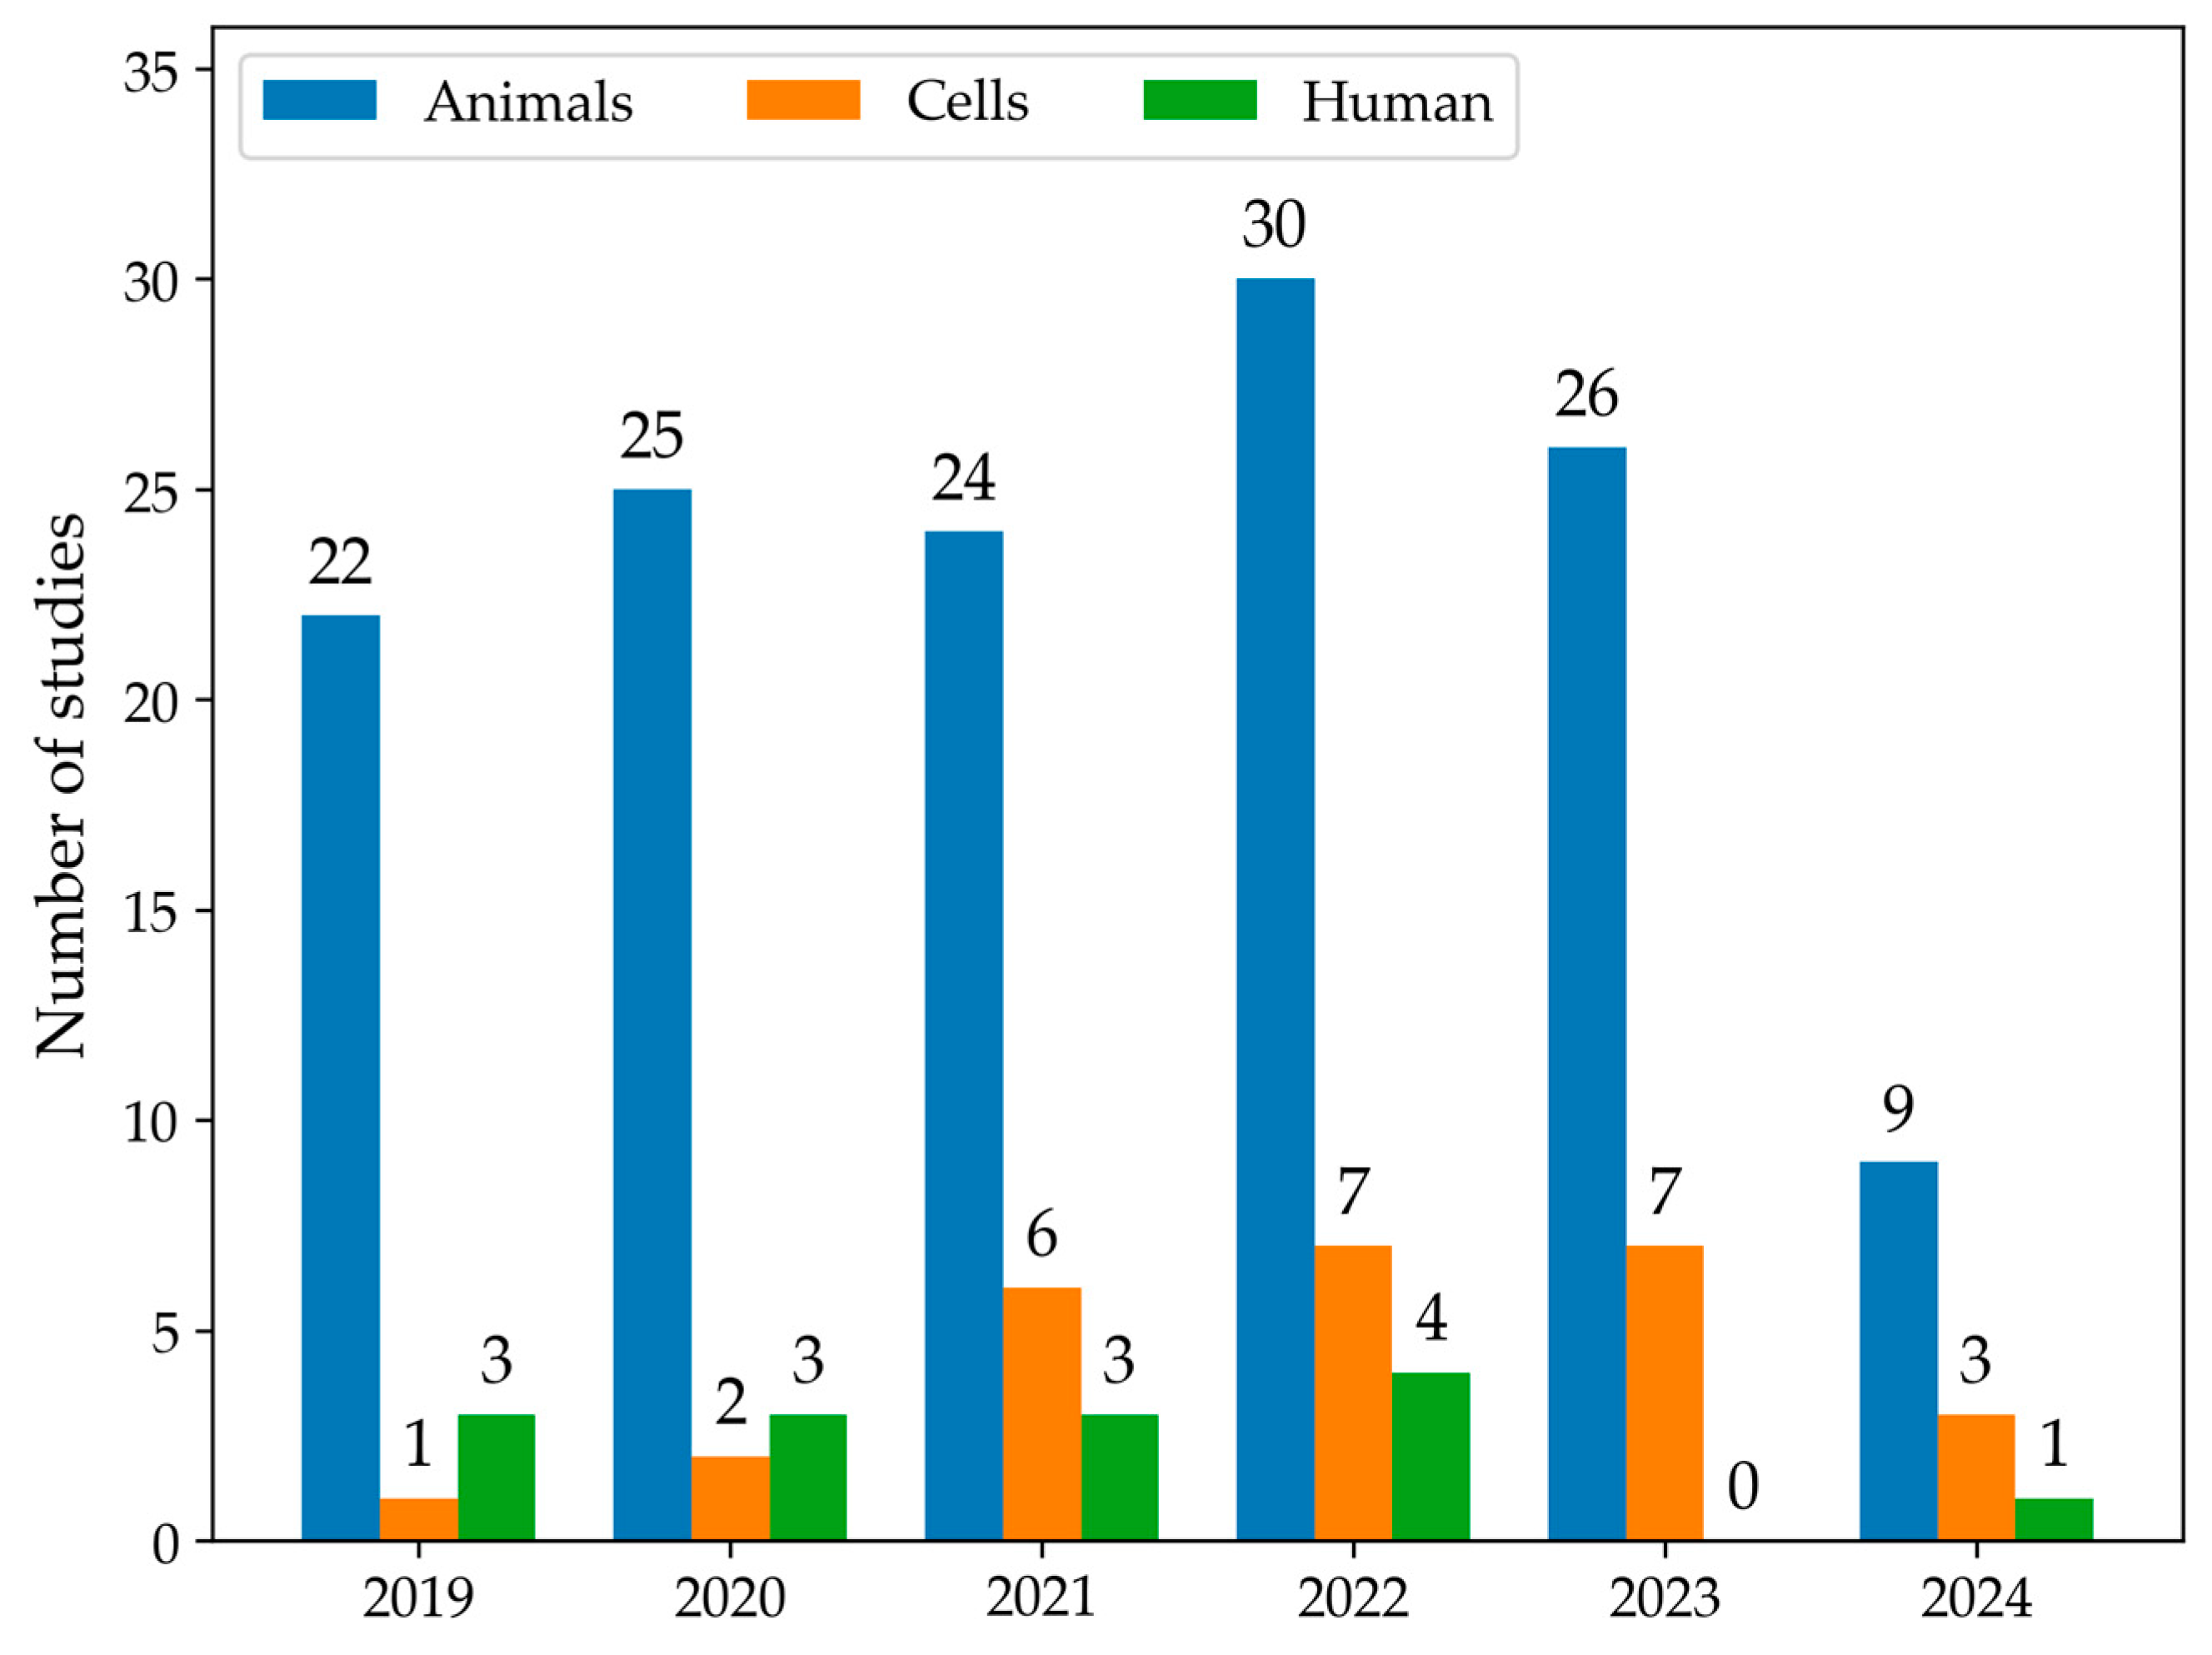
3.1. Search Results
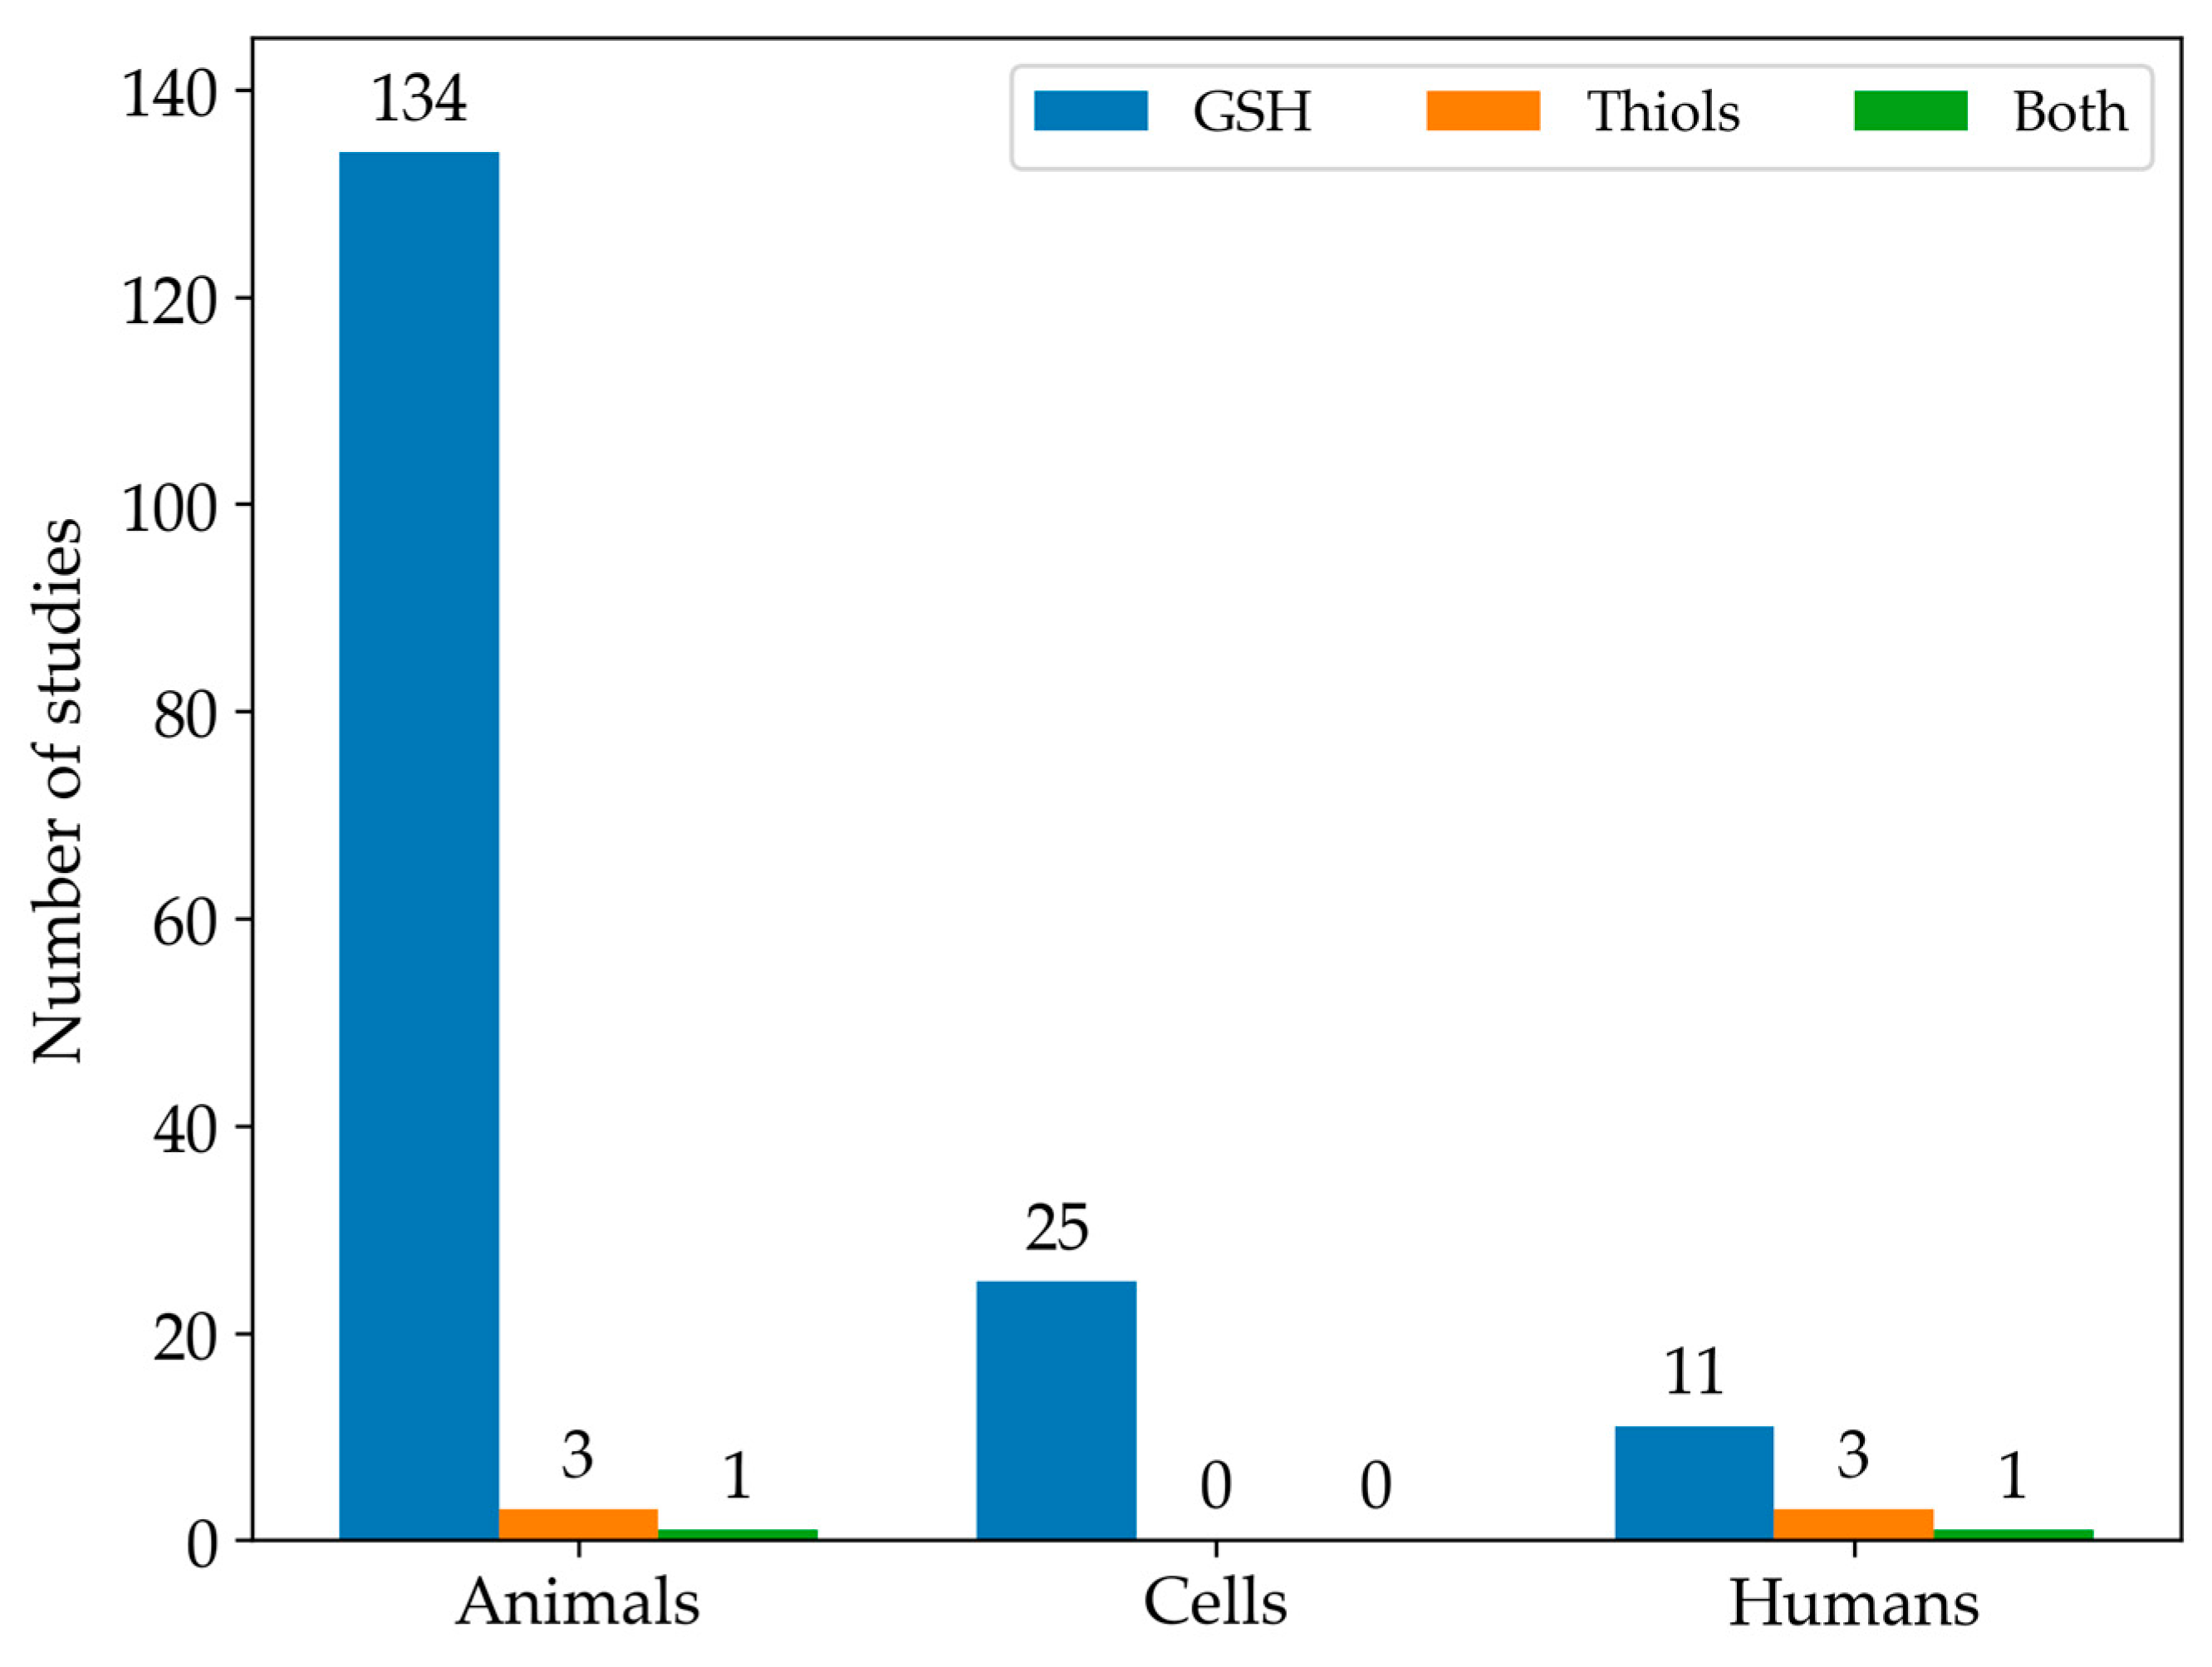
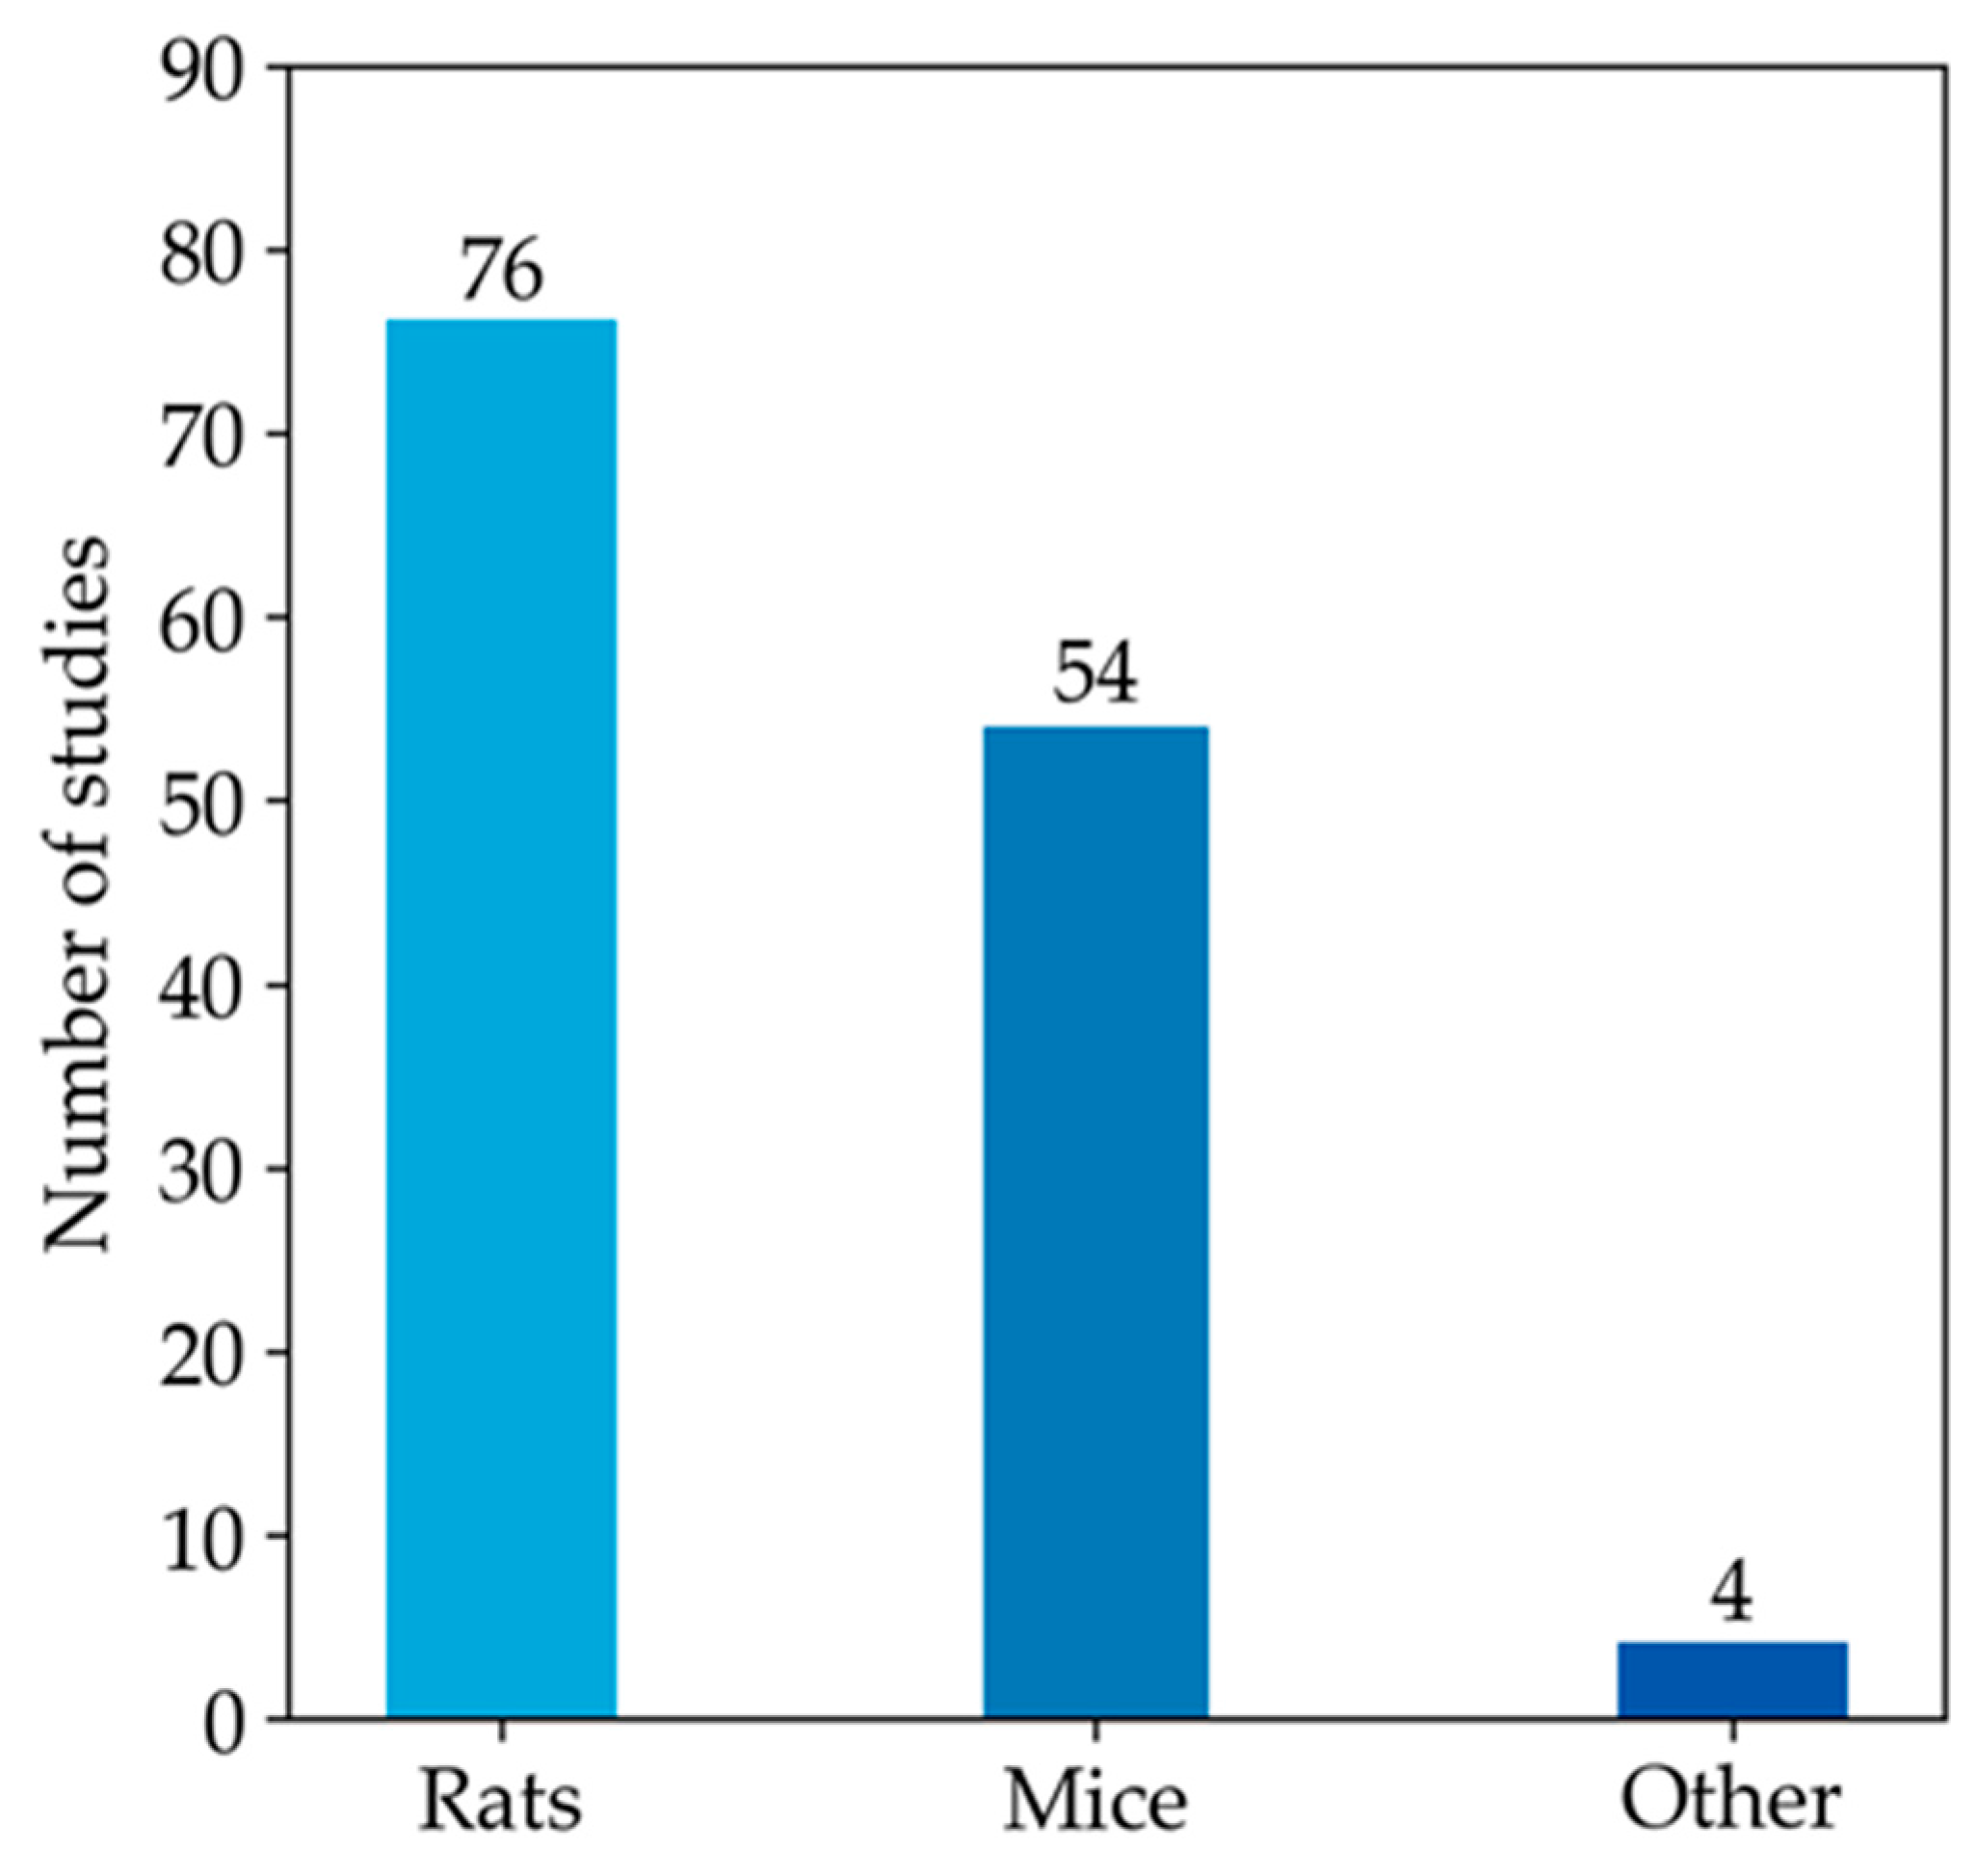
3.2. Results Organization
3.3. Studies Evaluating GSH Levels in Animal Models of MASLD
3.3.1. Studies on Rat Models
3.3.2. Studies on Mice Models
3.4. Studies Evaluating GSH Levels in Cell Models of MASLD
3.5. Studies Evaluating Cys, CysGly, Hcy, and Total Thiols in In Vivo and In Vitro Models of MASLD
3.6. Studies Evaluating LMW Thiols in Humans
3.6.1. Observational Studies
3.6.2. Clinical Trials
4. Discussion
4.1. Qualitative Analysis
4.2. Limitations of the Study
5. Conclusions
Supplementary Materials
Author Contributions
Funding
Data Availability Statement
Conflicts of Interest
References
- Poole, L.B. The basics of thiols and cysteines in redox biology and chemistry. Free Radic. Biol. Med. 2015, 80, 148–157. [Google Scholar] [CrossRef] [PubMed]
- Ulrich, K.; Jakob, U. The role of thiols in antioxidant systems. Free Radic. Biol. Med. 2019, 140, 14–27. [Google Scholar] [CrossRef]
- Vázquez-Meza, H.; Vilchis-Landeros, M.M.; Vázquez-Carrada, M.; Uribe-Ramírez, D.; Matuz-Mares, D. Cellular Compartmentalization, Glutathione Transport and Its Relevance in Some Pathologies. Antioxidants 2023, 12, 834. [Google Scholar] [CrossRef]
- Giustarini, D.; Colombo, G.; Garavaglia, M.L.; Astori, E.; Portinaro, N.M.; Reggiani, F.; Badalamenti, S.; Aloisi, A.M.; Santucci, A.; Rossi, R.; et al. Assessment of glutathione/glutathione disulphide ratio and S-glutathionylated proteins in human blood, solid tissues, and cultured cells. Free Radic. Biol. Med. 2017, 112, 360–375. [Google Scholar] [CrossRef] [PubMed]
- Shimizu, H.; Kiyohara, Y.; Kato, I.; Kitazono, T.; Tanizaki, Y.; Kubo, M.; Ueno, H.; Ibayashi, S.; Fujishima, M.; Iida, M. Relationship between plasma glutathione levels and cardiovascular disease in a defined population: The Hisayama study. Stroke 2004, 35, 2072–2077. [Google Scholar] [CrossRef] [PubMed]
- Vairetti, M.; Di Pasqua, L.G.; Cagna, M.; Richelmi, P.; Ferrigno, A.; Berardo, C. Changes in Glutathione Content in Liver Diseases: An Update. Antioxidants 2021, 10, 364. [Google Scholar] [CrossRef] [PubMed]
- Aoyama, K. Glutathione in the Brain. Int. J. Mol. Sci. 2021, 22, 5010. [Google Scholar] [CrossRef]
- Dludla, P.V.; Ziqubu, K.; Mabhida, S.E.; Mazibuko-Mbeje, S.E.; Hanser, S.; Nkambule, B.B.; Basson, A.K.; Pheiffer, C.; Tiano, L.; Kengne, A.P. Dietary Supplements Potentially Target Plasma Glutathione Levels to Improve Cardiometabolic Health in Patients with Diabetes Mellitus: A Systematic Review of Randomized Clinical Trials. Nutrients 2023, 15, 944. [Google Scholar] [CrossRef]
- Giustarini, D.; Tsikas, D.; Colombo, G.; Milzani, A.; Dalle-Donne, I.; Fanti, P.; Rossi, R. Pitfalls in the analysis of the physiological antioxidant glutathione (GSH) and its disulfide (GSSG) in biological samples: An elephant in the room. J. Chromatogr. B 2016, 1019, 21–28. [Google Scholar] [CrossRef] [PubMed]
- Ellman, G.L. Tissue sulfhydryl groups. Arch. Biochem. Biophys. 1959, 82, 70–77. [Google Scholar] [CrossRef]
- Tietze, F. Enzymic method for quantitative determination of nanogram amounts of total and oxidized glutathione: Applications to mammalian blood and other tissues. Anal. Biochem. 1969, 27, 502–522. [Google Scholar] [CrossRef] [PubMed]
- Pastore, A.; Federici, G.; Bertini, E.; Piemonte, F. Analysis of glutathione: Implication in redox and detoxification. Clin. Chim. Acta 2003, 333, 19–39. [Google Scholar] [CrossRef] [PubMed]
- Nuhu, F.; Gordon, A.; Sturmey, R.; Seymour, A.M.; Bhandari, S. Measurement of Glutathione as a Tool for Oxidative Stress Studies by High Performance Liquid Chromatography. Molecules 2020, 25, 4196. [Google Scholar] [CrossRef]
- Lu, S.C. Dysregulation of glutathione synthesis in liver disease. Liver Res. 2020, 4, 64–73. [Google Scholar] [CrossRef]
- Yu, X.; Long, Y.C. Crosstalk between cystine and glutathione is critical for the regulation of amino acid signaling pathways and ferroptosis. Sci. Rep. 2016, 6, 30033. [Google Scholar] [CrossRef]
- Bonifácio, V.D.B.; Pereira, S.A.; Serpa, J.; Vicente, J.B. Cysteine metabolic circuitries: Druggable targets in cancer. Br. J. Cancer 2021, 124, 862–879. [Google Scholar] [CrossRef] [PubMed]
- Seshadri, S.; Beiser, A.; Selhub, J.; Jacques, P.F.; Rosenberg, I.H.; D’Agostino, R.B.; Wilson, P.W.; Wolf, P.A. Plasma homocysteine as a risk factor for dementia and Alzheimer’s disease. N. Engl. J. Med. 2002, 346, 476–483. [Google Scholar] [CrossRef]
- Nolin, T.D.; McMenamin, M.E.; Himmelfarb, J. Simultaneous determination of total homocysteine, cysteine, cysteinylglycine, and glutathione in human plasma by high-performance liquid chromatography: Application to studies of oxidative stress. J. Chromatogr. B 2007, 852, 554–561. [Google Scholar] [CrossRef]
- Krag, A.; Rinella, M.E. Steatotic liver disease: A new name to reflect the combined role of alcohol and metabolic dysfunction. Nat. Med. 2024, 30, 933–936. [Google Scholar] [CrossRef]
- Zhang, L.; El-Shabrawi, M.; Baur, L.A.; Byrne, C.D.; Targher, G.; Kehar, M.; Porta, G.; Lee, W.S.; Lefere, S.; Turan, S.; et al. An international multidisciplinary consensus on pediatric metabolic dysfunction-associated fatty liver disease. Med 2024, 5, 797–815.e2. [Google Scholar] [CrossRef]
- Miao, L.; Targher, G.; Byrne, C.D.; Cao, Y.Y.; Zheng, M.H. Current status and future trends of the global burden of MASLD. Trends Endocrinol. Metab. 2024, 35, 697–707. [Google Scholar] [CrossRef] [PubMed]
- Li, Y.; Yang, P.; Ye, J.; Xu, Q.; Wu, J.; Wang, Y. Updated mechanisms of MASLD pathogenesis. Lipids Health Dis. 2024, 23, 117. [Google Scholar] [CrossRef] [PubMed]
- Ha, S.; Wong, V.W.; Zhang, X.; Yu, J. Interplay between gut microbiome, host genetic and epigenetic modifications in MASLD and MASLD-related hepatocellular carcinoma. Gut 2024. online ahead of print. [Google Scholar] [CrossRef] [PubMed]
- Alisi, A.; McCaughan, G.; Grønbæk, H. Role of gut microbiota and immune cells in metabolic-associated fatty liver disease: Clinical impact. Hepatol. Int. 2024, 18, 861–872. [Google Scholar] [CrossRef] [PubMed]
- Zhang, R.; Yan, Z.; Zhong, H.; Luo, R.; Liu, W.; Xiong, S.; Liu, Q.; Liu, M. Gut microbial metabolites in MASLD: Implications of mitochondrial dysfunction in the pathogenesis and treatment. Hepatol. Commun. 2024, 8, e0484. [Google Scholar] [CrossRef]
- Page, M.J.; McKenzie, J.E.; Bossuyt, P.M.; Boutron, I.; Hoffmann, T.C.; Mulrow, C.D.; Shamseer, L.; Tetzlaff, J.M.; Akl, E.A.; Brennan, S.E.; et al. The PRISMA 2020 statement: An updated guideline for reporting systematic reviews. BMJ 2021, 372, n71. [Google Scholar] [CrossRef]
- Kopp, O.; Snethlage, C.C.; Schwentker, C. JabRef: BibTeX-based literature management software. TUGboat 2023, 44, 441–447. [Google Scholar] [CrossRef]
- Khalaf, H.M.; Ibrahim, M.A.; Amin, E.F.; Abdel-Tawab Ibrahim, S.; Abdel-Wahab, S.; Fouad, Y.M. Allopurinol potentiates the hepatoprotective effect of metformin and vitamin E in fructose-induced fatty liver in rats. Clin. Exp. Hepatol. 2019, 5, 65–74. [Google Scholar] [CrossRef]
- Palladini, G.; Di Pasqua, L.G.; Berardo, C.; Siciliano, V.; Richelmi, P.; Mannucci, B.; Croce, A.C.; Rizzo, V.; Perlini, S.; Vairetti, M.; et al. Fatty Acid Desaturase Involvement in Non-Alcoholic Fatty Liver Disease Rat Models: Oxidative Stress Versus Metalloproteinases. Nutrients 2019, 11, 799. [Google Scholar] [CrossRef]
- Soliman, G.F.; Rashed, L.A.; Morsi, H.; Ibrahim, W.; Abdallah, H.; Bastawy, N.; Abdel Maksoud, O.M. Interrelation of liver vascularity to non-alcoholic fatty liver through a comparative study of the vasodilator effect of carvedilol or nicorandil in rats. Life Sci. 2019, 222, 175–182. [Google Scholar] [CrossRef]
- Park, S.; Zhang, T.; Qiu, J.Y.; Wu, X. The Combination of Mulberry Extracts and Silk Amino Acids Alleviated HFD-Induced Nonalcoholic Hepatic Steatosis by Improving Hepatic Insulin Signaling and Normalizing Gut Microbiome Dysbiosis in Rats. Evid. Based Complement. Alternat. Med. 2019, 2019, 8063121. [Google Scholar] [CrossRef] [PubMed]
- Pai, S.A.; Munshi, R.P.; Panchal, F.H.; Gaur, I.S.; Juvekar, A.R. Chrysin ameliorates nonalcoholic fatty liver disease in rats. Naunyn Schmiedebergs Arch. Pharmacol. 2019, 392, 1617–1628. [Google Scholar] [CrossRef] [PubMed]
- Meng, Y.; Liu, Y.; Fang, N.; Guo, Y. Hepatoprotective effects of Cassia semen ethanol extract on non-alcoholic fatty liver disease in experimental rat. Pharm. Biol. 2019, 57, 98–104. [Google Scholar] [CrossRef] [PubMed]
- Souza Cruz, E.M.; Bitencourt de Morais, J.M.; Dalto da Rosa, C.V.; da Silva Simões, M.; Comar, J.F.; de Almeida Chuffa, L.G.; Seiva, F.R.F. Long-term sucrose solution consumption causes metabolic alterations and affects hepatic oxidative stress in Wistar rats. Biol. Open 2020, 9, bio047282. [Google Scholar] [CrossRef] [PubMed]
- Faheem, S.A.; Saeed, N.M.; El-Naga, R.N.; Ayoub, I.M.; Azab, S.S. Hepatoprotective Effect of Cranberry Nutraceutical Extract in Non-alcoholic Fatty Liver Model in Rats: Impact on Insulin Resistance and Nrf-2 Expression. Front. Pharmacol. 2020, 11, 218. [Google Scholar] [CrossRef]
- Witayavanitkul, N.; Werawatganon, D.; Chayanupatkul, M.; Klaikeaw, N.; Sanguanrungsirikul, S.; Siriviriyakul, P. Genistein and exercise modulated lipid peroxidation and improved steatohepatitis in ovariectomized rats. BMC Complement. Med. Ther. 2020, 20, 162. [Google Scholar] [CrossRef] [PubMed]
- Ibrahim, I.A.; Shalaby, A.A.; Abdallah, H.M.L.; El-Zohairy, N.F.; Bahr, H.I. Ameliorative Effect of Garden Cress (Lepidium sativum L.) Seeds Ethanolic Extract on HFD-prompted Non-alcoholic Fatty Liver Disease in the Rat Model: Impact on 3-Hydroxy-3-methylglutaryl-Coenzyme A Reductase and Vascular Endothelial Growth Factor. Adv. Anim. Vet. Sci. 2020, 8, 1–10. [Google Scholar] [CrossRef]
- Ogunlana, O.O.; Ogunlana, O.E.; Adekunbi, T.S.; Adetuyi, B.O.; Adegboye, B.E.; Iheagwam, F.N. Anti-inflammatory Mechanism of Ruzu Bitters on Diet-Induced Nonalcoholic Fatty Liver Disease in Male Wistar Rats. Evid. Based Complement. Alternat. Med. 2020, 2020, 5246725. [Google Scholar] [CrossRef]
- Heeba, G.H.; El-Deen, R.M.; Abdel-Latif, R.G.; Khalifa, M.M.A. Combined treatments with metformin and phosphodiesterase inhibitors alleviate nonalcoholic fatty liver disease in HFD fed rats: A comparative study. Can. J. Physiol. Pharmacol. 2020, 98, 498–505. [Google Scholar] [CrossRef]
- Saeed, N.M.; Mansour, A.M.; Allam, S. Lycopene induces insulin signaling and alleviates fibrosis in experimental model of non-alcoholic fatty liver disease in rats. PharmaNutrition 2020, 14, 100225. [Google Scholar] [CrossRef]
- Konda, P.Y.; Poondla, V.; Jaiswal, K.K.; Dasari, S.; Uyyala, R.; Surtineni, V.P.; Egi, J.Y.; Masilamani, A.J.A.; Bestha, L.; Konanki, S.; et al. Pathophysiology of HFD induced obesity: Impact of probiotic banana juice on obesity associated complications and hepatosteatosis. Sci. Rep. 2020, 10, 16894. [Google Scholar] [CrossRef] [PubMed]
- Abdel Jaleel, G.A.; Al-Awdan, S.A.; Ahmed, R.F.; Ahmed-Farid, O.A.H.; Saleh, D.O. Melatonin regulates neurodegenerative complications associated with NAFLD via enhanced neurotransmission and cellular integrity: A correlational study. Metab. Brain Dis. 2020, 35, 1251–1261. [Google Scholar] [CrossRef] [PubMed]
- Bingül, İ.; Aydın, A.F.; Küçükgergin, C.; Doğan-Ekici, I.; Doğru-Abbasoğlu, S.; Uysal, M. The effect of 1,25-dihydroxyvitamin D3 on liver damage, oxidative stress, and advanced glycation end products in experimental nonalcoholic- and alcoholic- fatty liver disease. Turk. J. Med. Sci. 2021, 51, 1500–1511. [Google Scholar] [CrossRef] [PubMed]
- Fawzy, M.H.; Saeed, N.M.; El-Sherbiny, D.A.; El-Demerdash, E. Eugenol modulates insulin sensitivity by upregulating insulin receptor substrate-2 in non-alcoholic fatty liver disease in rats. J. Pharm. Pharmacol. 2021, 73, 846–854. [Google Scholar] [CrossRef] [PubMed]
- Mengesha, T.; Gnanasekaran, N.; Mehare, T. Hepatoprotective effect of silymarin on fructose induced nonalcoholic fatty liver disease in male albino wistar rats. BMC Complement. Med. Ther. 2021, 21, 140. [Google Scholar] [CrossRef]
- Gopinath, V.; Shamsitha, M.K.A.; Penarveettil Nair, V.; Seena, P.; Uppu, R.M.C.; Raghavamenon, A. Thermally Oxidized Coconut Oil as Fat Source in HFD Induces Hepatic Fibrosis in Diabetic Rat Model. Cell Biochem. Biophys. 2021, 79, 629–639. [Google Scholar] [CrossRef]
- Carvalho, L.C.F.; Dias, B.V.; Gomes, S.V.; Carneiro, C.M.; Costa, D.C. Temporal effect of fructose supplementation at different concentrations on hepatic metabolism of Wistar rats. Nutr. Hosp. 2021, 38, 1089–1100. [Google Scholar] [CrossRef]
- Abd-Elrazek, A.M.; Ibrahim, S.R.; El-dash, H.A. The ameliorative effect of Apium graveolens & curcumin against Non-alcoholic fatty liver disease induced by high fructose-high fat diet in rats. Future J. Pharm. Sci. 2022, 8, 26. [Google Scholar] [CrossRef]
- Zakaria, Z.; Othman, Z.A.; Bagi Suleiman, J.; Jalil, N.A.C.; Ghazali, W.S.W.; Mohamed, M. Protective and Therapeutic Effects of Orlistat on Metabolic Syndrome and Oxidative Stress in HFD-Induced Metabolic Dysfunction-Associated Fatty Liver Disease (MAFLD) in Rats: Role on Nrf2 Activation. Vet. Sci. 2021, 8, 274. [Google Scholar] [CrossRef]
- Palladini, G.; Di Pasqua, L.G.; Cagna, M.; Croce, A.C.; Perlini, S.; Mannucci, B.; Profumo, A.; Ferrigno, A.; Vairetti, M. MCD Diet Rat Model Induces Alterations in Zinc and Iron during NAFLD Progression from Steatosis to Steatohepatitis. Int. J. Mol. Sci. 2022, 23, 6817. [Google Scholar] [CrossRef]
- Attia, H.; Albekairi, N.; Albdeirat, L.; Soliman, A.; Rajab, R.; Alotaibi, H.; Ali, R.; Badr, A. Chrysin Attenuates Fructose-Induced Nonalcoholic Fatty Liver in Rats via Antioxidant and Anti-Inflammatory Effects: The Role of Angiotensin-Converting Enzyme 2/Angiotensin (1-7)/Mas Receptor Axis. Oxid. Med. Cell. Longev. 2022, 2022, 9479456. [Google Scholar] [CrossRef] [PubMed]
- Oriquat, G.; Masoud, I.M.; Kamel, M.A.; Aboudeya, H.M.; Bakir, M.B.; Shaker, S.A. The Anti-Obesity and Anti-Steatotic Effects of Chrysin in a Rat Model of Obesity Mediated through Modulating the Hepatic AMPK/mTOR/lipogenesis Pathways. Molecules 2023, 28, 1734. [Google Scholar] [CrossRef] [PubMed]
- Reda, D.; Elshopakey, G.E.; Albukhari, T.A.; Almehmadi, S.J.; Refaat, B.; Risha, E.F.; Mahgoub, H.A.; El-Boshy, M.E.; Abdelhamid, F.M. Vitamin D3 alleviates nonalcoholic fatty liver disease in rats by inhibiting hepatic oxidative stress and inflammation via the SREBP-1-c/ PPARα-NF-κB/IR-S2 signaling pathway. Front. Pharmacol. 2023, 14, 1164512. [Google Scholar] [CrossRef] [PubMed]
- Chenna, H.; Khelef, Y.; Halimi, I.; Yilmaz, M.A.; Çakir, O.; Djouder, C.; Tarhan, A.; Idoughi, K.; Boumendjel, M.; Boumendjel, A.; et al. Potential Hepatoprotective Effect of Matricaria Pubescens on High-Fat Diet-Induced Non-Alcoholic Fatty Liver Disease in Rats. Chem. Biodivers. 2024, 21, e202302005. [Google Scholar] [CrossRef]
- Deng, Y.; Tang, K.; Chen, R.; Nie, H.; Liang, S.; Zhang, J.; Zhang, Y.; Yang, Q. Berberine attenuates hepatic oxidative stress in rats with non-alcoholic fatty liver disease via the Nrf2/ARE signalling pathway. Exp. Ther. Med. 2019, 17, 2091–2098. [Google Scholar] [CrossRef] [PubMed]
- Bakir, M.B.; Salama, M.A.; Refaat, R.; Ali, M.A.; Khalifa, E.A.; Kamel, M.A. Evaluating the therapeutic potential of one-carbon donors in nonalcoholic fatty liver disease. Eur. J. Pharmacol. 2019, 847, 72–82. [Google Scholar] [CrossRef]
- Abu-Elsaad, N.; El-Karef, A. Protection against nonalcoholic steatohepatitis through targeting IL-18 and IL-1alpha by luteolin. Pharmacol. Rep. 2019, 71, 688–694. [Google Scholar] [CrossRef]
- Zhang, B.; Li, M.; Zou, Y.; Guo, H.; Zhang, B.; Xia, C.; Zhang, H.; Yang, W.; Xu, C. NFκB/Orai1 Facilitates Endoplasmic Reticulum Stress by Oxidative Stress in the Pathogenesis of Non-alcoholic Fatty Liver Disease. Front. Cell. Dev. Biol. 2019, 7, 202. [Google Scholar] [CrossRef]
- Huang, L.; Ding, W.; Wang, M.Q.; Wang, Z.G.; Chen, H.H.; Chen, W.; Yang, Q.; Lu, T.N.; Yang, Q.; He, J.M. Tanshinone IIA ameliorates non-alcoholic fatty liver disease through targeting peroxisome proliferator-activated receptor gamma and toll-like receptor 4. J. Int. Med. Res. 2019, 47, 5239–5255. [Google Scholar] [CrossRef]
- Kumar, D.; Dwivedi, D.K.; Lahkar, M.; Jangra, A. Hepatoprotective potential of 7,8-Dihydroxyflavone against alcohol and high-fat diet induced liver toxicity via attenuation of oxido-nitrosative stress and NF-κB activation. Pharmacol. Rep. 2019, 71, 1235–1243. [Google Scholar] [CrossRef]
- Loza-Medrano, S.S.; Baiza-Gutman, L.A.; Manuel-Apolinar, L.; García-Macedo, R.; Damasio-Santana, L.; Martínez-Mar, O.A.; Sánchez-Becerra, M.C.; Cruz-López, M.; Ibáñez-Hernández, M.A.; Díaz-Flores, M. High fructose-containing drinking water-induced steatohepatitis in rats is prevented by the nicotinamide-mediated modulation of redox homeostasis and NADPH-producing enzymes. Mol. Biol. Rep. 2020, 47, 337–351. [Google Scholar] [CrossRef]
- El-Derany, M.O.; El-Demerdash, E. Pyrvinium pamoate attenuates non-alcoholic steatohepatitis: Insight on hedgehog/Gli and Wnt/β-catenin signaling crosstalk. Biochem. Pharmacol. 2020, 177, 113942. [Google Scholar] [CrossRef]
- Olaniyi, K.S.; Amusa, O.A. Sodium acetate-mediated inhibition of histone deacetylase alleviates hepatic lipid dysregulation and its accompanied injury in streptozotocin-nicotinamide-induced diabetic rats. Biomed. Pharmacother. 2020, 128, 110226. [Google Scholar] [CrossRef]
- AlFaris, N.A.; Alshammari, G.M.; AlTamimi, J.Z.; AlMousa, L.A.; AlKehayez, N.M.; Aljabryn, D.H.; Alagal, R.I.; Yahya, M.A. The protective effect of shrimp cooked in different methods on high-cholesterol- induced fatty liver in rats. Saudi. J. Biol. Sci. 2021, 28, 170–182. [Google Scholar] [CrossRef]
- Açıkel Elmas, M.; Atay, N.; Bingöl Özakpınar, Ö.; Arbak, S.; Kolgazi, M.; Şener, G.; Ercan, F. Morphological evaluation of the effects of exercise on high-fat-diet-induced liver damage in rats. Turk. J. Gastroenterol. 2020, 31, 626–632. [Google Scholar] [CrossRef]
- Li, J.; Wang, T.; Liu, P.; Yang, F.; Wang, X.; Zheng, W.; Sun, W. Hesperetin ameliorates hepatic oxidative stress and inflammation via the PI3K/AKT-Nrf2-ARE pathway in oleic acid-induced HepG2 cells and a rat model of high-fat diet-induced NAFLD. Food Funct. 2021, 12, 3898–3918. [Google Scholar] [CrossRef]
- Kravchenko, L.V.; Aksenov, I.V.; Nikitin, N.S.; Guseva, G.V.; Avrenyeva, L.I.; Trusov, N.V.; Balakina, A.S.; Tutelyan, V.A. Lipoic Acid Exacerbates Oxidative Stress and Lipid Accumulation in the Liver of Wistar Rats Fed a Hypercaloric Choline-Deficient Diet. Nutrients 2021, 13, 1999. [Google Scholar] [CrossRef]
- Mu, J.K.; Zi, L.; Li, Y.Q.; Yu, L.P.; Cui, Z.G.; Shi, T.T.; Zhang, F.; Gu, W.; Hao, J.J.; Yu, J.; et al. Jiuzhuan Huangjing Pills relieve mitochondrial dysfunction and attenuate high-fat diet-induced metabolic dysfunction-associated fatty liver disease. Biomed. Pharmacother. 2021, 142, 112092. [Google Scholar] [CrossRef]
- Miah, P.; Mohona, S.B.S.; Rahman, M.M.; Subhan, N.; Khan, F.; Hossain, H.; Sharker, S.M.; Alam, M.A. Supplementation of cumin seed powder prevents oxidative stress, hyperlipidemia and non-alcoholic fatty liver in high fat diet fed rats. Biomed. Pharmacother. 2021, 141, 111908. [Google Scholar] [CrossRef]
- Yu, Y.; Ye, S.M.; Liu, D.Y.; Yang, L.Q. AP39 ameliorates high fat diet-induced liver injury in young rats via alleviation of oxidative stress and mitochondrial impairment. Exp. Anim. 2021, 70, 553–562. [Google Scholar] [CrossRef]
- Al-Harbi, L.N.; Alshammari, G.M.; Al-Dossari, A.M.; Subash-Babu, P.; Binobead, M.A.; Alhussain, M.H.; AlSedairy, S.A.; Al-Nouri, D.M.; Shamlan, G. Beta vulgaris L. (Beetroot) Methanolic Extract Prevents Hepatic Steatosis and Liver Damage in T2DM Rats by Hypoglycemic, Insulin-Sensitizing, Antioxidant Effects, and Upregulation of PPARα. Biology 2021, 10, 1306. [Google Scholar] [CrossRef] [PubMed]
- Arora, M.K.; Pandey, S.; Tomar, R.; Sahoo, J.; Kumar, D.; Jangra, A. Therapeutic potential of policosanol in the concurrent management of dyslipidemia and non-alcoholic fatty liver disease. Future J. Pharm. Sci. 2022, 8, 11. [Google Scholar] [CrossRef]
- Sivaraj, R.; Jaikumar, S.; Sengottuvelu, S. Zingiberene attenuates high fat diet–induced non-alcoholic fatty liver disease through suppression of lipogenesis and oxidative stress in rats. Comp. Clin. Pathol. 2022, 31, 201–209. [Google Scholar] [CrossRef]
- Sabir, U.; Irfan, H.M.; Alamgeer; Ullah, A.; Althobaiti, Y.S.; Asim, M.H. Reduction of Hepatic Steatosis, Oxidative Stress, Inflammation, Ballooning and Insulin Resistance After Therapy with Safranal in NAFLD Animal Model: A New Approach. J. Inflamm. Res. 2022, 15, 1293–1316. [Google Scholar] [CrossRef]
- Shatoor, A.S.; Al Humayed, S.; Almohiy, H.M. Astaxanthin attenuates hepatic steatosis in high-fat diet-fed rats by suppressing microRNA-21 via transactivation of nuclear factor erythroid 2-related factor 2. J. Physiol. Biochem. 2022, 78, 151–168. [Google Scholar] [CrossRef]
- Ommati, M.M.; Li, H.; Jamshidzadeh, A.; Khoshghadam, F.; Retana-Márquez, S.; Lu, Y.; Farshad, O.; Nategh Ahmadi, M.H.; Gholami, A.; Heidari, R. The crucial role of oxidative stress in non-alcoholic fatty liver disease-induced male reproductive toxicity: The ameliorative effects of Iranian indigenous probiotics. Naunyn Schmiedebergs Arch. Pharmacol. 2022, 395, 247–265. [Google Scholar] [CrossRef]
- Hazem, R.M.; Ibrahim, A.Z.; Ali, D.A.; Moustafa, Y.M. Dapagliflozin improves steatohepatitis in diabetic rats via inhibition of oxidative stress and inflammation. Int. Immunopharmacol. 2022, 104, 108503. [Google Scholar] [CrossRef]
- Zhang, J.K.; Zhou, X.L.; Wang, X.Q.; Zhang, J.X.; Yang, M.L.; Liu, Y.P.; Cao, J.X.; Cheng, G.G. Que Zui tea ameliorates hepatic lipid accumulation and oxidative stress in high fat diet induced nonalcoholic fatty liver disease. Food Res. Int. 2022, 156, 111196. [Google Scholar] [CrossRef]
- Biao, Y.; Chen, J.; Liu, C.; Wang, R.; Han, X.; Li, L.; Zhang, Y. Protective Effect of Danshen Zexie Decoction Against Non-Alcoholic Fatty Liver Disease Through Inhibition of ROS/NLRP3/IL-1β Pathway by Nrf2 Signaling Activation. Front. Pharmacol. 2022, 13, 877924. [Google Scholar] [CrossRef]
- Qin, Y.; Zhao, B.; Deng, H.; Zhang, M.; Qiao, Y.; Liu, Q.; Shi, C.; Li, Y. Isolation and Quantification of the Hepatoprotective Flavonoids From Scleromitron diffusum (Willd.) R. J. Wang With Bio-Enzymatic Method Against NAFLD by UPLC-MS/MS. Front. Pharmacol. 2022, 13, 890148. [Google Scholar] [CrossRef] [PubMed]
- Alharbi, S. Exogenous administration of unacylated ghrelin attenuates hepatic steatosis in high-fat diet-fed rats by modulating glucose homeostasis, lipogenesis, oxidative stress, and endoplasmic reticulum stress. Biomed. Pharmacother. 2022, 151, 113095. [Google Scholar] [CrossRef] [PubMed]
- Mohammed, H.M. Zingerone ameliorates non-alcoholic fatty liver disease in rats by activating AMPK. J. Food Biochem. 2022, 46, e14149. [Google Scholar] [CrossRef]
- Elseweidy, M.M.; Elesawy, A.E.; Sobh, M.S.; Elnagar, G.M. Ellagic acid ameliorates high fructose-induced hyperuricemia and non-alcoholic fatty liver in Wistar rats: Focusing on the role of C1q/tumor necrosis factor-related protein-3 and ATP citrate lyase. Life Sci. 2022, 305, 120751. [Google Scholar] [CrossRef]
- Jiayao, Y.; Dongqing, T.; Wei, M.A.; Song, L.; Yan, L.; Lei, S.; Shu, Z.; Chenyu, L.I.; Nianlong, D.U. Protective effects and mechanisms of Lizhong decoction against non-alcoholic fatty liver disease in a rat model. J. Tradit. Chin. Med. 2022, 42, 773–780. [Google Scholar] [CrossRef] [PubMed]
- Shaaban, H.H.; Alzaim, I.; El-Mallah, A.; Aly, R.G.; El-Yazbi, A.F.; Wahid, A. Metformin, pioglitazone, dapagliflozin and their combinations ameliorate manifestations associated with NAFLD in rats via anti-inflammatory, anti-fibrotic, anti-oxidant and anti-apoptotic mechanisms. Life Sci. 2022, 308, 120956. [Google Scholar] [CrossRef] [PubMed]
- Vornoli, A.; Vizzarri, F.; Della Croce, C.M.; Grande, T.; Palazzo, M.; Árvay, J.; Pucci, L.; Gabriele, M.; Matteucci, M.; Paolini, M.; et al. The hypolipidemic, anti-inflammatory and antioxidant effect of Kavolì® aqueous extract, a mixture of Brassica oleracea leaves, in a rat model of NAFLD. Food Chem. Toxicol. 2022, 167, 113261. [Google Scholar] [CrossRef]
- Ruan, L.; Wang, G.; Qing Lv, Z.; Li, S.; Liu, Q.; Ren, Y.; Zhang, Q.; Lu, X.; Wu, R.; Jin, Z. The effect of varied exercise intensity on antioxidant function, aortic endothelial function, and serum lipids in rats with non-alcoholic fatty liver disease. Investig. Clin. 2022, 63, 327–343. [Google Scholar] [CrossRef]
- Deng, A.; Liu, F.; Tang, X.; Wang, Y.; Xie, P.; Yang, Q.; Xiao, B. Water extract from artichoke ameliorates high-fat diet-induced non-alcoholic fatty liver disease in rats. BMC Complement. Med. Ther. 2022, 22, 308. [Google Scholar] [CrossRef]
- Alwadani, A.H.; Almasri, S.A.; Aloud, A.A.; Albadr, N.A.; Alshammari, G.M.; Yahya, M.A. The Synergistic Protective Effect of γ-Oryzanol (OZ) and N-Acetylcysteine (NAC) against Experimentally Induced NAFLD in Rats Entails Hypoglycemic, Antioxidant, and PPARα Stimulatory Effects. Nutrients 2022, 15, 106. [Google Scholar] [CrossRef] [PubMed]
- Marschner, R.A.; Roginski, A.C.; Ribeiro, R.T.; Longo, L.; Álvares-da-Silva, M.R.; Wajner, S.M. Uncovering Actions of Type 3 Deiodinase in the Metabolic Dysfunction-Associated Fatty Liver Disease (MAFLD). Cells 2023, 12, 1022. [Google Scholar] [CrossRef]
- Felemban, A.H.; Alshammari, G.M.; Yagoub, A.E.A.; Al-Harbi, L.N.; Alhussain, M.H.; Yahya, M.A. Activation of AMPK Entails the Protective Effect of Royal Jelly against High-Fat-Diet-Induced Hyperglycemia, Hyperlipidemia, and Non-Alcoholic Fatty Liver Disease in Rats. Nutrients 2023, 15, 1471. [Google Scholar] [CrossRef] [PubMed]
- Zhong, L.; Lyu, W.; Lin, Z.; Lu, J.; Geng, Y.; Song, L.; Zhang, H. Quinoa Ameliorates Hepatic Steatosis, Oxidative Stress, Inflammation and Regulates the Gut Microbiota in Nonalcoholic Fatty Liver Disease Rats. Foods 2023, 12, 1780. [Google Scholar] [CrossRef] [PubMed]
- Becerril-Campos, A.A.; Ramos-Gómez, M.; De Los Ríos-Arellano, E.A.; Ocampo-Anguiano, P.V.; González-Gallardo, A.; Macotela, Y.; García-Gasca, T.; Ahumada-Solórzano, S.M. Bean Leaves Ameliorate Lipotoxicity in Fatty Liver Disease. Nutrients 2023, 15, 2928. [Google Scholar] [CrossRef] [PubMed]
- Fotschki, B.; Sójka, M.; Kosmala, M.; Juśkiewicz, J. Prebiotics Together with Raspberry Polyphenolic Extract Mitigate the Development of Nonalcoholic Fatty Liver Diseases in Zucker Rats. Nutrients 2023, 15, 3115. [Google Scholar] [CrossRef] [PubMed]
- Al Jadani, J.M.; Albadr, N.A.; Alshammari, G.M.; Almasri, S.A.; Alfayez, F.F.; Yahya, M.A. Esculeogenin A, a Glycan from Tomato, Alleviates Nonalcoholic Fatty Liver Disease in Rats through Hypolipidemic, Antioxidant, and Anti-Inflammatory Effects. Nutrients 2023, 15, 4755. [Google Scholar] [CrossRef]
- Song, J.; Ren, L.; Ren, Z.; Ren, X.; Qi, Y.; Qin, Y.; Zhang, X.; Ren, Y.; Li, Y. SIRT1-dependent mitochondrial biogenesis supports therapeutic effects of 4-butyl-polyhydroxybenzophenone compounds against NAFLD. Eur. J. Med. Chem. 2023, 260, 115728. [Google Scholar] [CrossRef] [PubMed]
- Atteia, H.H.; AlFaris, N.A.; Alshammari, G.M.; Alamri, E.; Ahmed, S.F.; Albalwi, R.; Abdel-Sattar, S.A. The Hepatic Antisteatosis Effect of Xanthohumol in High-Fat Diet-Fed Rats Entails Activation of AMPK as a Possible Protective Mechanism. Foods 2023, 12, 4214. [Google Scholar] [CrossRef] [PubMed]
- Kılınç, S.; Şahin, P.; Yığman, Z.; Sevgili, A.M. Topiramate’s effects on normal and fatty liver. Drug Chem. Toxicol. 2024, 47, 729–738. [Google Scholar] [CrossRef]
- Fang, C.; Zhang, J.; Han, J.; Lei, Y.; Cao, Z.; Pan, J.; Pan, Z.; Zhang, Z.; Qu, N.; Luo, H.; et al. Tiaogan Jiejiu Tongluo Formula attenuated alcohol-induced chronic liver injury by regulating lipid metabolism in rats. J. Ethnopharmacol. 2023, 317, 116838. [Google Scholar] [CrossRef]
- Sedik, A.A.; Elgohary, R.; Khalifa, E.; Khalil, W.K.B.; Shafey, H.I.; Shalaby, M.B.; Gouida, M.S.O.; Tag, Y.M. Lauric acid attenuates hepato-metabolic complications and molecular alterations in high-fat diet-induced nonalcoholic fatty liver disease in rats. Toxicol. Mech. Methods. 2024, 34, 454–467. [Google Scholar] [CrossRef]
- Sharma, S.; Gali, S.; Kundu, A.; Park, J.H.; Kim, J.S.; Kim, H.S. Tenovin-1, a Selective SIRT1/2 Inhibitor, Attenuates High-fat Diet-induced Hepatic Fibrosis via Inhibition of HSC Activation in ZDF Rats. Int. J. Biol. Sci. 2024, 20, 3334–3352. [Google Scholar] [CrossRef] [PubMed]
- Longo, L.; Marschner, R.A.; de Freitas, L.B.R.; de Bona, L.R.; Behrens, L.; Pereira, M.H.M.; de Souza, V.E.G.; Leonhard, L.C.; Zanettini, G.; Pinzon, C.E.; et al. Redefining the Role of Ornithine Aspartate and Vitamin E in Metabolic-Dysfunction-Associated Steatotic Liver Disease through Its Biochemical Properties. Int. J. Mol. Sci. 2024, 25, 6839. [Google Scholar] [CrossRef] [PubMed]
- Liu, Y.T.; Chen, H.W.; Lii, C.K.; Jhuang, J.H.; Huang, C.S.; Li, M.L.; Yao, H.T. A Diterpenoid, 14-Deoxy-11, 12-Didehydroandrographolide, in Andrographis paniculata Reduces Steatohepatitis and Liver Injury in Mice Fed a High-Fat and High-Cholesterol Diet. Nutrients 2020, 12, 523. [Google Scholar] [CrossRef] [PubMed]
- Mao, Q.Q.; Li, B.Y.; Meng, J.M.; Gan, R.Y.; Xu, X.Y.; Gu, Y.Y.; Wang, X.H.; Li, H.B. Effects of several tea extracts on nonalcoholic fatty liver disease in mice fed with a high-fat diet. Food Sci. Nutr. 2021, 9, 2954–2967. [Google Scholar] [CrossRef]
- Sukkasem, N.; Chatuphonprasert, W.; Jarukamjorn, K. Hesperidin, a novel candidate for the successful treatment of HFD plus ethanol-induced fatty liver disease in mice. J. Physiol. Pharmacol. 2021, 72, 217–224. [Google Scholar] [CrossRef]
- Kang, H.G.; Bashir, K.M.I.; Kim, K.Y.; Shin, S.; Choi, M.W.; Hong, E.J.; Choi, S.H.; Kim, J.W.; Choi, J.S.; Ku, S.K. Evaluation of Dose-Dependent Obesity and Diabetes-Related Complications of Water Chestnut (Fruit of Trapa japonica) Extracts in Type II Obese Diabetic Mice Induced by 45% Kcal HFD. Medicina 2022, 58, 189. [Google Scholar] [CrossRef]
- Mak, K.K.; Zhang, S.; Chellian, J.; Mohd, Z.; Epemolu, O.; Dinkova-Kostova, A.T.; Balijepalli, M.K.; Pichika, M.R. Swietenine Alleviates Nonalcoholic Fatty Liver Disease in Diabetic Mice via Lipogenesis Inhibition and Antioxidant Mechanisms. Antioxidants 2023, 12, 595. [Google Scholar] [CrossRef]
- Krishnan, U.A.; Viswanathan, P.; Venkataraman, A.C. AMPK activation by AICAR reduces diet induced fatty liver in C57BL/6 mice. Tissue Cell. 2023, 82, 102054. [Google Scholar] [CrossRef]
- Zhang, L.; Li, H.X.; Pan, W.S.; Khan, F.U.; Qian, C.; Qi-Li, F.R.; Xu, X. Novel hepatoprotective role of Leonurine hydrochloride against experimental non-alcoholic steatohepatitis mediated via AMPK/SREBP1 signaling pathway. Biomed. Pharmacother. 2019, 110, 571–581. [Google Scholar] [CrossRef]
- Deng, P.; Barney, J.; Petriello, M.C.; Morris, A.J.; Wahlang, B.; Hennig, B. Hepatic metabolomics reveals that liver injury increases PCB 126-induced oxidative stress and metabolic dysfunction. Chemosphere 2019, 217, 140–149. [Google Scholar] [CrossRef]
- Veskovic, M.; Mladenovic, D.; Milenkovic, M.; Tosic, J.; Borozan, S.; Gopcevic, K.; Labudovic-Borovic, M.; Dragutinovic, V.; Vucevic, D.; Jorgacevic, B.; et al. Betaine modulates oxidative stress, inflammation, apoptosis, autophagy, and Akt/mTOR signaling in methionine-choline deficiency-induced fatty liver disease. Eur. J. Pharmacol. 2019, 848, 39–48. [Google Scholar] [CrossRef] [PubMed]
- Gong, F.; Gao, L.; Ding, T. IDH2 protects against nonalcoholic steatohepatitis by alleviating dyslipidemia regulated by oxidative stress. Biochem. Biophys. Res. Commun. 2019, 514, 593–600. [Google Scholar] [CrossRef] [PubMed]
- de Freitas Carvalho, M.M.; Lage, N.N.; de Souza Paulino, A.H.; Pereira, R.R.; de Almeida, L.T.; da Silva, T.F.; de Brito Magalhães, C.L.; de Lima, W.G.; Silva, M.E.; Pedrosa, M.L.; et al. Effects of açai on oxidative stress, ER stress, and inflammation-related parameters in mice with high fat diet-fed induced NAFLD. Sci. Rep. 2019, 9, 8107. [Google Scholar] [CrossRef]
- Lee, D.H.; Jung, Y.Y.; Park, M.H.; Jo, M.R.; Han, S.B.; Yoon, D.Y.; Roh, Y.S.; Hong, J.T. Peroxiredoxin 6 Confers Protection Against Nonalcoholic Fatty Liver Disease Through Maintaining Mitochondrial Function. Antioxid. Redox. Signal. 2019, 31, 387–402. [Google Scholar] [CrossRef]
- Ji, Y.; Gao, Y.; Chen, H.; Yin, Y.; Zhang, W. Indole-3-Acetic Acid Alleviates Nonalcoholic Fatty Liver Disease in Mice via Attenuation of Hepatic Lipogenesis, and Oxidative and Inflammatory Stress. Nutrients 2019, 11, 2062. [Google Scholar] [CrossRef]
- Cui, Y.; Chang, R.; Zhang, T.; Zhou, X.; Wang, Q.; Gao, H.; Hou, L.; Loor, J.J.; Xu, C. Chinese Herbal Formula (CHF03) Attenuates Non-Alcoholic Fatty Liver Disease (NAFLD) Through Inhibiting Lipogenesis and Anti-Oxidation Mechanisms. Front. Pharmacol. 2019, 10, 1190. [Google Scholar] [CrossRef]
- Yang, H.; Yang, T.; Heng, C.; Zhou, Y.; Jiang, Z.; Qian, X.; Du, L.; Mao, S.; Yin, X.; Lu, Q. Quercetin improves nonalcoholic fatty liver by ameliorating inflammation, oxidative stress, and lipid metabolism in db/db mice. Phytother. Res. 2019, 33, 3140–3152. [Google Scholar] [CrossRef]
- Qi, J.; Kim, J.W.; Zhou, Z.; Lim, C.W.; Kim, B. Ferroptosis Affects the Progression of Nonalcoholic Steatohepatitis via the Modulation of Lipid Peroxidation-Mediated Cell Death in Mice. Am. J. Pathol. 2020, 190, 723. [Google Scholar] [CrossRef]
- Zhang, Y.; Wang, H.; Zhang, L.; Yuan, Y.; Yu, D. Codonopsis lanceolata polysaccharide CLPS alleviates high fat/high sucrose diet-induced insulin resistance via anti-oxidative stress. Int. J. Biol. Macromol. 2020, 145, 944–949. [Google Scholar] [CrossRef]
- Ke, W.; Wang, P.; Wang, X.; Zhou, X.; Hu, X.; Chen, F. Dietary Platycodon grandiflorus Attenuates Hepatic Insulin Resistance and Oxidative Stress in High-Fat-Diet Induced Non-Alcoholic Fatty Liver Disease. Nutrients 2020, 12, 480. [Google Scholar] [CrossRef]
- Simon, J.; Nuñez-García, M.; Fernández-Tussy, P.; Barbier-Torres, L.; Fernández-Ramos, D.; Gómez-Santos, B.; Buqué, X.; Lopitz-Otsoa, F.; Goikoetxea-Usandizaga, N.; Serrano-Macia, M.; et al. Targeting Hepatic Glutaminase 1 Ameliorates Non-alcoholic Steatohepatitis by Restoring Very-Low-Density Lipoprotein Triglyceride Assembly. Cell Metab. 2020, 31, 605–622.e10. [Google Scholar] [CrossRef] [PubMed]
- Wu, L.; Liu, Y.; Zhao, Y.; Li, M.; Guo, L. Targeting DUSP7 signaling alleviates hepatic steatosis, inflammation and oxidative stress in high fat diet (HFD)-fed mice via suppression of TAK1. Free Radic. Biol. Med. 2020, 153, 140–158. [Google Scholar] [CrossRef]
- Ore, A.; Ugbaja, R.N.; Adeogun, A.I.; Akinloye, O.A. An albino mouse model of nonalcoholic fatty liver disease induced using high-fat liquid “Lieber-DeCarli” diet: A preliminary investigation. Porto Biomed. J. 2020, 5, e071. [Google Scholar] [CrossRef]
- Majeed, M.; Majeed, S.; Nagabhushanam, K.; Lawrence, L.; Mundkur, L. Novel Combinatorial Regimen of Garcinol and Curcuminoids for Non-alcoholic Steatohepatitis (NASH) in Mice. Sci. Rep. 2020, 10, 7440. [Google Scholar] [CrossRef]
- Bucher, S.; Begriche, K.; Catheline, D.; Trak-Smayra, V.; Tiaho, F.; Coulouarn, C.; Pinon, G.; Lagadic-Gossmann, D.; Rioux, V.; Fromenty, B. Moderate chronic ethanol consumption exerts beneficial effects on nonalcoholic fatty liver in mice fed a high-fat diet: Possible role of higher formation of triglycerides enriched in monounsaturated fatty acids. Eur. J. Nutr. 2020, 59, 1619–1632. [Google Scholar] [CrossRef] [PubMed]
- Wang, S.W.; Sheng, H.; Bai, Y.F.; Weng, Y.Y.; Fan, X.Y.; Lou, L.J.; Zhang, F. Neohesperidin enhances PGC-1α-mediated mitochondrial biogenesis and alleviates hepatic steatosis in high fat diet fed mice. Nutr. Diabetes 2020, 10, 27. [Google Scholar] [CrossRef]
- Yang, F.; Huang, P.; Shi, L.; Liu, F.; Tang, A.; Xu, S. Phoenixin 14 Inhibits High-Fat Diet-Induced Non-Alcoholic Fatty Liver Disease in Experimental Mice. Drug Des. Dev. Ther. 2020, 14, 3865–3874. [Google Scholar] [CrossRef]
- Hu, D.; Yang, W.; Mao, P.; Cheng, M. Combined Amelioration of Prebiotic Resveratrol and Probiotic Bifidobacteria on Obesity and Nonalcoholic Fatty Liver Disease. Nutr. Cancer 2021, 73, 652–661. [Google Scholar] [CrossRef] [PubMed]
- An, M.Y.; Lee, S.R.; Hwang, H.J.; Yoon, J.G.; Lee, H.J.; Cho, J.A. Antioxidant and Anti-Inflammatory Effects of Korean Black Ginseng Extract through ER Stress Pathway. Antioxidants 2021, 10, 62. [Google Scholar] [CrossRef] [PubMed]
- Xu, Q.; Fan, Y.; Loor, J.J.; Liang, Y.; Lv, H.; Sun, X.; Jia, H.; Xu, C. Aloin protects mice from diet-induced non-alcoholic steatohepatitis via activation of Nrf2/HO-1 signaling. Food Funct. 2021, 12, 696–705. [Google Scholar] [CrossRef] [PubMed]
- Du, F.; Huang, R.; Lin, D.; Wang, Y.; Yang, X.; Huang, X.; Zheng, B.; Chen, Z.; Huang, Y.; Wang, X.; et al. Resveratrol Improves Liver Steatosis and Insulin Resistance in Non-alcoholic Fatty Liver Disease in Association with the Gut Microbiota. Front. Microbiol. 2021, 12, 611323. [Google Scholar] [CrossRef] [PubMed]
- Wang, G.; Wu, B.; Zhang, L.; Jin, X.; Wang, K.; Xu, W.; Zhang, B.; Wang, H. The protective effects of trelagliptin on high-fat diet-induced nonalcoholic fatty liver disease in mice. J. Biochem. Mol. Toxicol. 2021, 35, e22696. [Google Scholar] [CrossRef] [PubMed]
- Gao, G.; Xie, Z.; Li, E.W.; Yuan, Y.; Fu, Y.; Wang, P.; Zhang, X.; Qiao, Y.; Xu, J.; Hölscher, C.; et al. Dehydroabietic acid improves nonalcoholic fatty liver disease through activating the Keap1/Nrf2-ARE signaling pathway to reduce ferroptosis. J. Nat. Med. 2021, 75, 540–552. [Google Scholar] [CrossRef] [PubMed]
- Chen, Y.; Jiang, Z.; Xu, J.; Zhang, J.; Sun, R.; Zhou, J.; Lu, Y.; Gong, Z.; Huang, J.; Shen, X.; et al. Improving the ameliorative effects of berberine and curcumin combination via dextran-coated bilosomes on non-alcohol fatty liver disease in mice. J. Nanobiotechnology 2021, 19, 230. [Google Scholar] [CrossRef]
- Chen, S.; Che, S.; Li, S.; Ruan, Z. The combined impact of decabromodiphenyl ether and high fat exposure on non-alcoholic fatty liver disease in vivo and in vitro. Toxicology 2021, 464, 153015. [Google Scholar] [CrossRef] [PubMed]
- Santini, S.J.; Tarantino, G.; Iezzi, A.; Alisi, A.; Balsano, C. Copper-catalyzed dicarbonyl stress in NAFLD mice: Protective effects of Oleuropein treatment on liver damage. Nutr. Metab. 2022, 19, 9. [Google Scholar] [CrossRef] [PubMed]
- Saha, M.; Manna, K.; Das Saha, K. Melatonin Suppresses NLRP3 Inflammasome Activation via TLR4/NF-κB and P2X7R Signaling in High-Fat Diet-Induced Murine NASH Model. J. Inflamm. Res. 2022, 15, 3235–3258. [Google Scholar] [CrossRef]
- Chen, Y.M.; Lian, C.F.; Sun, Q.W.; Wang, T.T.; Liu, Y.Y.; Ye, J.; Gao, L.L.; Yang, Y.F.; Liu, S.N.; Shen, Z.F.; et al. Ramulus Mori (Sangzhi) Alkaloids Alleviate High-Fat Diet-Induced Obesity and Nonalcoholic Fatty Liver Disease in Mice. Antioxidants 2022, 11, 905. [Google Scholar] [CrossRef]
- Arai, N.; Miura, K.; Aizawa, K.; Sekiya, M.; Nagayama, M.; Sakamoto, H.; Maeda, H.; Morimoto, N.; Iwamoto, S.; Yamamoto, H. Probiotics suppress nonalcoholic steatohepatitis and carcinogenesis progression in hepatocyte-specific PTEN knockout mice. Sci. Rep. 2022, 12, 16206. [Google Scholar] [CrossRef]
- Ye, H.; Ma, S.; Qiu, Z.; Huang, S.; Deng, G.; Li, Y.; Xu, S.; Yang, M.; Shi, H.; Wu, C.; et al. Poria cocos polysaccharides rescue pyroptosis-driven gut vascular barrier disruption in order to alleviates non-alcoholic steatohepatitis. J. Ethnopharmacol. 2022, 296, 115457. [Google Scholar] [CrossRef] [PubMed]
- Kang, Y.; Song, Y.; Luo, Y.; Song, J.; Li, C.; Yang, S.; Guo, J.; Yu, J.; Zhang, X. Exosomes derived from human umbilical cord mesenchymal stem cells ameliorate experimental non-alcoholic steatohepatitis via Nrf2/NQO-1 pathway. Free Radic. Biol. Med. 2022, 192, 25–36. [Google Scholar] [CrossRef] [PubMed]
- Li, S.; Zhuge, A.; Wang, K.; Xia, J.; Wang, Q.; Han, S.; Shen, J.; Li, L. Obeticholic acid and ferrostatin-1 differentially ameliorate non-alcoholic steatohepatitis in AMLN diet-fed ob/ob mice. Front. Pharmacol. 2022, 13, 1081553. [Google Scholar] [CrossRef] [PubMed]
- Jiang, Z.; Sun, H.; Miao, J.; Sheng, Q.; Xu, J.; Gao, Z.; Zhang, X.; Song, Y.; Chen, K. The natural flavone acacetin protects against high-fat diet-induced lipid accumulation in the liver via the endoplasmic reticulum stress/ferroptosis pathway. Biochem. Biophys. Res. Commun. 2023, 640, 183–191. [Google Scholar] [CrossRef]
- Ghrayeb, A.; Agranovich, B.; Peled, D.; Finney, A.C.; Abramovich, I.; Garcia, J.F.; Traylor, J.; Drucker, S.; Fernandes, S.I.; Weissman, N.; et al. Fatty liver-mediated glycine restriction impairs glutathione synthesis and causes hypersensitization to acetaminophen. bioRxiv 2023. [Google Scholar] [CrossRef]
- Abulikemu, A.; Zhao, X.; Xu, H.; Li, Y.; Ma, R.; Yao, Q.; Wang, J.; Sun, Z.; Li, Y.; Guo, C. Silica nanoparticles aggravated the metabolic associated fatty liver disease through disturbed amino acid and lipid metabolisms-mediated oxidative stress. Redox. Biol. 2023, 59, 102569. [Google Scholar] [CrossRef] [PubMed]
- Ye, Q.; Jiang, Y.; Wu, D.; Cai, J.; Jiang, Z.; Zhou, Z.; Liu, L.; Ling, Q.; Wang, Q.; Zhao, G. Atractylodin alleviates nonalcoholic fatty liver disease by regulating Nrf2-mediated ferroptosis. Heliyon 2023, 9, e18321. [Google Scholar] [CrossRef]
- Yuan, X.; Li, L.; Zhang, Y.; Ai, R.; Li, D.; Dou, Y.; Hou, M.; Zhao, D.; Zhao, S.; Nan, Y. Heme oxygenase 1 alleviates nonalcoholic steatohepatitis by suppressing hepatic ferroptosis. Lipids Health Dis. 2023, 22, 99. [Google Scholar] [CrossRef]
- Saha, M.; Das, S.; Manna, K.; Saha, K.D. Melatonin targets ferroptosis through bimodal alteration of redox environment and cellular pathways in NAFLD model. Biosci. Rep. 2023, 43, BSR20230128. [Google Scholar] [CrossRef]
- Spooner, M.H.; Garcia-Jaramillo, M.; Apperson, K.D.; Löhr, C.V.; Jump, D.B. Time course of western diet (WD) induced nonalcoholic steatohepatitis (NASH) in female and male Ldlr-/- mice. PLoS ONE 2023, 18, e0292432. [Google Scholar] [CrossRef]
- You, T.; Li, Y.; Li, B.; Wu, S.; Jiang, X.; Fu, D.; Xin, J.; Huang, Y.; Jin, L.; Hu, C. Caveolin-1 protects against liver damage exacerbated by acetaminophen in non-alcoholic fatty liver disease by inhibiting the ERK/HIF-1α pathway. Mol. Immunol. 2023, 163, 104–115. [Google Scholar] [CrossRef]
- Jiang, T.; Xiao, Y.; Zhou, J.; Luo, Z.; Yu, L.; Liao, Q.; Liu, S.; Qi, X.; Zhang, H.; Hou, M.; et al. Arbutin alleviates fatty liver by inhibiting ferroptosis via FTO/SLC7A11 pathway. Redox. Biol. 2023, 69, 102974. [Google Scholar] [CrossRef] [PubMed]
- Cao, P.; Yue, M.; Cheng, Y.; Sullivan, M.A.; Chen, W.; Yu, H.; Li, F.; Wu, S.; Lv, Y.; Zhai, X.; et al. Naringenin prevents non-alcoholic steatohepatitis by modulating the host metabolome and intestinal microbiome in MCD diet-fed mice. Food Sci. Nutr. 2023, 11, 7826–7840. [Google Scholar] [CrossRef] [PubMed]
- Yin, X.; Dong, L.; Wang, X.; Qin, Z.; Ma, Y.; Ke, X.; Li, Y.; Wang, Q.; Mi, Y.; Lyu, Q.; et al. Perilipin 5 regulates hepatic stellate cell activation and high-fat diet-induced non-alcoholic fatty liver disease. Anim. Model Exp. Med. 2024, 7, 166–178. [Google Scholar] [CrossRef] [PubMed]
- Yang, A.Y.; Kim, K.; Kwon, H.H.; Leem, J.; Song, J.E. 6-Shogaol Ameliorates Liver Inflammation and Fibrosis in Mice on a Methionine- and Choline-Deficient Diet by Inhibiting Oxidative Stress, Cell Death, and Endoplasmic Reticulum Stress. Molecules 2024, 29, 419. [Google Scholar] [CrossRef] [PubMed]
- Zhang, T.; Wang, M.Y.; Wang, G.D.; Lv, Q.Y.; Huang, Y.Q.; Zhang, P.; Wang, W.; Zhang, Y.; Bai, Y.P.; Guo, L.Q. Metformin improves nonalcoholic fatty liver disease in db/db mice by inhibiting ferroptosis. Eur. J. Pharmacol. 2024, 966, 176341. [Google Scholar] [CrossRef]
- Xie, Y.; Jin, Y.; Wen, J.; Li, G.; Huai, X.; Duan, Y.; Ni, F.; Fu, J.; Li, M.; Li, L.; et al. A novel Alisma orientale extract alleviates non-alcoholic steatohepatitis in mice via modulation of PPARα signaling pathway. Biomed. Pharmacother. 2024, 176, 116908. [Google Scholar] [CrossRef]
- Chen, B.; Zheng, Y.M.; Zhang, M.Q.; Han, Y.; Zhang, J.P.; Hu, C.Q. Microarray Expression Profiling and Raman Spectroscopy Reveal Anti-Fatty Liver Action of Berberine in a Diet-Induced Larval Zebrafish Model. Front. Pharmacol. 2020, 10, 1504. [Google Scholar] [CrossRef] [PubMed]
- Li, Y.; Yang, M.; Lin, H.; Yan, W.; Deng, G.; Ye, H.; Shi, H.; Wu, C.; Ma, G.; Xu, S.; et al. Limonin Alleviates Non-alcoholic Fatty Liver Disease by Reducing Lipid Accumulation, Suppressing Inflammation and Oxidative Stress. Front. Pharmacol. 2022, 12, 801730. [Google Scholar] [CrossRef]
- Hajinezhad, M.R.; Mokhtarpour, A.; Mirheidari, A. Hypolipidemic and antioxidant effects of aqueous ethanolic extract from Moringa peregrina leaves on high-fat diet-induced fatty liver disease in rabbits. Comp. Clin. Path. 2023, 32, 617–628. [Google Scholar] [CrossRef]
- Qu, P.; Rom, O.; Li, K.; Jia, L.; Gao, X.; Liu, Z.; Ding, S.; Zhao, M.; Wang, H.; Chen, S.; et al. DT-109 ameliorates nonalcoholic steatohepatitis in nonhuman primates. Cell Metab. 2023, 35, 742–757.e10. [Google Scholar] [CrossRef]
- Critical Appraisal Skills Programme. CASP (Qualitative Studies) Checklist. [Online]. 2023. Available online: https://casp-uk.net/casp-tools-checklists/ (accessed on 1 July 2024).
- Sharma, A.; Anand, S.K.; Singh, N.; Dwivedi, U.N.; Kakkar, P.; Kakkar, P. Berbamine Induced AMPK Activation Regulates mTOR/SREBP-1c Axis and Nrf2/ARE Pathway to Allay Lipid Accumulation and Oxidative Stress in Steatotic HepG2 Cells. Eur. J. Pharmacol. 2020, 882, 173244. [Google Scholar] [CrossRef] [PubMed]
- Choi, E.S.; Choi, J.O.; Park, C.; Kim, S.-H.; Kim, D.Y. Water Extract of Artemisia Annua L. Exhibits Hepatoprotective Effects Through Improvement of Lipid Accumulation and Oxidative Stress-Induced Cytotoxicity. J. Med. Food 2020, 23, 1312–1322. [Google Scholar] [CrossRef]
- Drygalski, K.; Siewko, K.; Chomentowski, A.; Odrzygóźdź, C.; Zalewska, A.; Kretowski, A.; Maciejczyk, M. Phloroglucinol Strengthens the Antioxidant Barrier and Reduces Oxidative/Nitrosative Stress in Nonalcoholic Fatty Liver Disease (NAFLD). Oxid. Med. Cell. Longev. 2021, 2021, 8872702. [Google Scholar] [CrossRef] [PubMed]
- Zhang, F.; Zhang, X.; Gu, Y.; Wang, M.; Guo, S.; Liu, J.; Zhang, X.; Zhao, Z.; Qian, B.; Yan, Y.; et al. Hepatoprotection of Lycii Fructus Polysaccharide against Oxidative Stress in Hepatocytes and Larval Zebrafish. Oxid. Med. Cell. Longev. 2021, 2021, 3923625. [Google Scholar] [CrossRef]
- Xu, Y.; Ke, H.; Li, Y.; Xie, L.; Su, H.; Xie, J.; Mo, J.; Chen, W.; Chen, W. Malvidin-3-O-Glucoside from Blueberry Ameliorates Nonalcoholic Fatty Liver Disease by Regulating Transcription Factor EB-Mediated Lysosomal Function and Activating the Nrf2/ARE Signaling Pathway. J. Agric. Food Chem. 2021, 69, 4663–4673. [Google Scholar] [CrossRef]
- Dhami-Shah, H.; Vaidya, R.; Talwadekar, M.; Shaw, E.; Udipi, S.; Kolthur-Seetharam, U.; Vaidya, A.D.B. Intervention by Picroside II on FFAs Induced Lipid Accumulation and Lipotoxicity in HepG2 Cells. J. Ayurveda Integr. Med. 2021, 12, 465–473. [Google Scholar] [CrossRef] [PubMed]
- Li, L.; Fang, B.; Zhang, Y.; Yan, L.; He, Y.; Hu, L.; Xu, Q.; Li, Q.; Dai, X.; Kuang, Q.; et al. Carminic acid mitigates fructose-triggered hepatic steatosis by inhibition of oxidative stress and inflammatory reaction. Biomed. Pharmacother. 2022, 145, 112404. [Google Scholar] [CrossRef]
- Cheng, X.R.; Tu, P.H.; Dong, W.L.; Yu, B.T.; Xia, S.F.; Muskat, M.N.; Guan, B. Electrophilic thymol isobutyrate from Inula nervosa Wall. (Xiaoheiyao) ameliorates steatosis in HepG2 cells via Nrf2 activation. J. Funct. Foods 2022, 88, 11. [Google Scholar] [CrossRef]
- Gao, W.; Xu, B.; Zhang, Y.; Liu, S.; Duan, Z.; Chen, Y.; Zhang, X. Baicalin Attenuates Oxidative Stress in a Tissue-Engineered Liver Model of NAFLD by Scavenging Reactive Oxygen Species. Nutrients 2022, 14, 541. [Google Scholar] [CrossRef]
- Lan, T.; Hu, Y.; Hu, F.; Li, H.; Chen, Y.; Zhang, J.; Yu, Y.; Jiang, S.; Weng, Q.; Tian, S.; et al. Hepatocyte glutathione S-transferase mu 2 prevents non-alcoholic steatohepatitis by suppressing ASK1 signaling. J. Hepatol. 2022, 76, 407–419. [Google Scholar] [CrossRef]
- Balkrishna, A.; Gohel, V.; Kumari, P.; Manik, M.; Bhattacharya, K.; Dev, R.; Varshney, A. Livogrit Prevents Methionine-Cystine Deficiency Induced Nonalcoholic Steatohepatitis by Modulation of Steatosis and Oxidative Stress in Human Hepatocyte-Derived Spheroid and in Primary Rat Hepatocytes. Bioengineered 2022, 13, 10811–10826. [Google Scholar] [CrossRef] [PubMed]
- Feng, L.; Chen, Y.; Xu, K.; Li, Y.; Riaz, F.; Lu, K.; Chen, Q.; Du, X.; Wu, L.; Cao, D.; et al. Cholesterol-induced leucine aminopeptidase 3 (LAP3) upregulation inhibits cell autophagy in pathogenesis of NAFLD. Aging 2022, 14, 3259–3275. [Google Scholar] [CrossRef] [PubMed]
- Sharma, P.; Nair, J.; Sinh, A.; Shivangi; Velpandian, T.; Tripathi, R.; Mathur, R. Guava Leaf Extract Suppresses Fructose Mediated Non-Alcoholic Fatty Liver Disease in Growing Rats. Diabetes Metab. Syndr. Obes. 2022, 15, 2827–2845. [Google Scholar] [CrossRef] [PubMed]
- Hao, R.; Shan, S.; Yang, D.; Zhang, H.; Sun, Y.; Li, Z. Peonidin-3-O-Glucoside from Purple Corncob Ameliorates Nonalcoholic Fatty Liver Disease by Regulating Mitochondrial and Lysosome Functions to Reduce Oxidative Stress and Inflammation. Nutrients 2023, 15, 372. [Google Scholar] [CrossRef]
- Liu, H.; Yan, J.; Guan, F.; Jin, Z.; Xie, J.; Wang, C.; Liu, M.; Liu, J. Zeaxanthin prevents ferroptosis by promoting mitochondrial function and inhibiting the p53 pathway in free fatty acid-induced HepG2 cells. Biochim. Biophys. Acta Mol. Cell Biol. Lipids 2023, 1868, 159287. [Google Scholar] [CrossRef]
- Longhitano, L.; Distefano, A.; Musso, N.; Bonacci, P.; Orlando, L.; Giallongo, S.; Tibullo, D.; Denaro, S.; Lazzarino, G.; Ferrigno, J.; et al. (+)-Lipoic Acid Reduces Mitochondrial Unfolded Protein Response and Attenuates Oxidative Stress and Aging in an in Vitro Model of Non-Alcoholic Fatty Liver Disease. J. Transl. Med. 2024, 22, 82. [Google Scholar] [CrossRef]
- Salomone, F.; Pipitone, R.M.; Longo, M.; Malvestiti, F.; Amorini, A.M.; Distefano, A.; Casirati, E.; Ciociola, E.; Iraci, N.; Leggio, L.; et al. SIRT5 rs12216101 T>G variant is associated with liver damage and mitochondrial dysfunction in patients with non-alcoholic fatty liver disease. J. Hepatol. 2024, 80, 378. [Google Scholar] [CrossRef]
- Luciano-Mateo, F.; Cabré, N.; Fernández-Arroyo, S.; Baiges-Gaya, G.; Hernández-Aguilera, A.; Rodríguez-Tomàs, E.; Mercado-Gómez, M.; Menendez, J.A.; Camps, J.; Joven, J. Chemokine (C-C motif) ligand 2 gene ablation protects low-density lipoprotein and paraoxonase-1 double deficient mice from liver injury, oxidative stress and inflammation. Biochim. Biophys. Acta. Mol. Basis Dis. 2019, 1865, 1555–1566. [Google Scholar] [CrossRef]
- Malekinejad, H.; Zeynali-Moghaddam, S.; Rezaei-Golmisheh, A.; Alenabi, A.; Malekinejad, F.; Alizadeh, A.; Shafie-Irannejad, V. Lupeol attenuated the NAFLD and PCOS-induced metabolic, oxidative, hormonal, histopathological, and molecular injuries in mice. Res. Pharm. Sci. 2023, 18, 551–565. [Google Scholar] [CrossRef]
- Yuan, S.; Chen, J.; Dan, L.; Xie, Y.; Sun, Y.; Li, X.; Larsson, S.C. Homocysteine, folate, and nonalcoholic fatty liver disease: A systematic review with meta-analysis and Mendelian randomization investigation. Am. J. Clin. Nutr. 2022, 116, 1595–1609. [Google Scholar] [CrossRef]
- Świderska, M.; Maciejczyk, M.; Zalewska, A.; Pogorzelska, J.; Flisiak, R.; Chabowski, A. Oxidative stress biomarkers in the serum and plasma of patients with non-alcoholic fatty liver disease (NAFLD). Can plasma AGE be a marker of NAFLD? Oxidative stress biomarkers in NAFLD patients. Free Radic. Res. 2019, 53, 841–850. [Google Scholar] [CrossRef] [PubMed]
- Damba, T.; Bourgonje, A.R.; Abdulle, A.E.; Pasch, A.; Sydor, S.; van den Berg, E.H.; Gansevoort, R.T.; Bakker, S.J.L.; Blokzijl, H.; Dullaart, R.P.F.; et al. Oxidative stress is associated with suspected non-alcoholic fatty liver disease and all-cause mortality in the general population. Liver Int. 2020, 40, 2148–2159. [Google Scholar] [CrossRef]
- Masarone, M.; Troisi, J.; Aglitti, A.; Torre, P.; Colucci, A.; Dallio, M.; Federico, A.; Balsano, C.; Persico, M. Untargeted metabolomics as a diagnostic tool in NAFLD: Discrimination of steatosis, steatohepatitis and cirrhosis. Metabolomics 2021, 17, 12. [Google Scholar] [CrossRef] [PubMed]
- Arya, A.; Azarmehr, N.; Mansourian, M.; Doustimotlagh, A.H. Inactivation of the superoxide dismutase by malondial-dehyde in the nonalcoholic fatty liver disease: A combined molecular docking approach to clinical studies. Arch. Physiol. Biochem. 2021, 127, 557–564. [Google Scholar] [CrossRef] [PubMed]
- Pastore, A.; Panera, N.; Mosca, A.; Caccamo, R.; Camanni, D.; Crudele, A.; De Stefanis, C.; Alterio, A.; Di Giovamberardino, G.; De Vito, R.; et al. Changes in Total Homocysteine and Glutathione Levels After Laparoscopic Sleeve Gastrectomy in Children with Metabolic-Associated Fatty Liver Disease. Obes. Surg. 2022, 32, 82–89. [Google Scholar] [CrossRef]
- Garcia, C.C.; Piotrkowski, B.; Baz, P.; Poncino, D.; Benavides, J.; Colombato, L.; Toso, M.L.R.; Yantorno, S.; Descalzi, V.; Gondolesi, G.E.; et al. A Decreased Response to Resistin in Mononuclear Leukocytes Contributes to Oxi-dative Stress in Nonalcoholic Fatty Liver Disease. Dig. Dis. Sci. 2022, 67, 3006–3016. [Google Scholar] [CrossRef]
- Nobili, V.; Alisi, A.; Mosca, A.; Crudele, A.; Zaffina, S.; Denaro, M.; Smeriglio, A.; Trombetta, D. The Antioxidant Effects of Hydroxytyrosol and Vitamin E on Pediatric Nonalcoholic Fatty Liver Disease, in a Clinical Trial: A New Treatment? Antioxid. Redox Signal. 2019, 31, 127–133. [Google Scholar] [CrossRef]
- Lee, E.; Lim, Y.; Kwon, S.W.; Kwon, O. Pinitol consumption improves liver health status by reducing oxidative stress and fatty acid accumulation in subjects with non-alcoholic fatty liver disease: A randomized, double-blind, placebo-controlled trial. J. Nutr. Biochem. 2019, 68, 33–41. [Google Scholar] [CrossRef]
- Maharshi, V.; Gupta, P.; Kumar, V.L.; Upadhyay, A.D.; Das, P.; Yadav, R.; Nayak, B.; Kumar, R.; Shalimar. Effect of Helicobacter pylori-eradication therapy on hepatic steatosis in patients with non-alcoholic fatty liver disease: A randomized-controlled pilot study. Gastroenterol. Rep. 2019, 8, 104–110. [Google Scholar] [CrossRef]
- Negri, R.; Trinchese, G.; Carbone, F.; Caprio, M.G.; Stanzione, G.; di Scala, C.; Micillo, T.; Perna, F.; Tarotto, L.; Gelzo, M.; et al. Randomised Clinical Trial: Calorie Restriction Regimen with Tomato Juice Supplementation Ameliorates Oxidative Stress and Preserves a Proper Immune Surveillance Modulating Mitochondrial Bioenergetics of T-Lymphocytes in Obese Children Affected by Non-Alcoholic Fatty Liver Disease (NAFLD). J. Clin. Med. 2020, 9, 141. [Google Scholar] [CrossRef]
- Chong, P.L.; Laight, D.; Aspinall, R.J.; Higginson, A.; Cummings, M.H. A randomised placebo-controlled trial of VSL#3® probiotic on biomarkers of cardiovascular risk and liver injury in non-alcoholic fatty liver disease. BMC Gastroenterol. 2021, 21, 144. [Google Scholar] [CrossRef]
- Yurtdaş, G.; Akbulut, G.; Baran, M.; Yılmaz, C. The effects of Mediterranean diet on hepatic steatosis, oxidative stress, and inflammation in adolescents with non-alcoholic fatty liver disease: A randomized controlled trial. Pediatr. Obes. 2022, 17, e12872. [Google Scholar] [CrossRef] [PubMed]
- Tavakoli, T.; Zarban, A.; Hooshyar, R.; Salmani, F.; Tajik, H. Improvement of thiol groups and total antioxidant capacity in patients with non-alcoholic fatty liver after treatment with pioglitazone. Arch. Physiol. Biochem. 2022, 128, 1591–1595. [Google Scholar] [CrossRef] [PubMed]
- Quetglas-Llabrés, M.M.; Monserrat-Mesquida, M.; Bouzas, C.; García, S.; Argelich, E.; Casares, M.; Ugarriza, L.; Llompart, I.; Tur, J.A.; Sureda, A. Impact of Adherence to the Mediterranean Diet on Antioxidant Status and Metabolic Parameters in NAFLD Patients: A 24-Month Lifestyle Intervention Study. Antioxidants 2024, 13, 480. [Google Scholar] [CrossRef]
- Li, L.; Fu, J.; Liu, D.; Sun, J.; Hou, Y.; Chen, C.; Shao, J.; Wang, L.; Wang, X.; Zhao, R.; et al. Hepatocyte-specific Nrf2 deficiency mitigates high-fat diet-induced hepatic steatosis: Involvement of reduced PPARγ expression. Redox Biol. 2020, 30, 101412. [Google Scholar] [CrossRef]
- Hunter, H.; de Gracia Hahn, D.; Duret, A.; Im, Y.R.; Cheah, Q.; Dong, J.; Fairey, M.; Hjalmarsson, C.; Li, A.; Lim, H.K.; et al. Weight Loss, Insulin Resistance, and Study Design Confound Results in a Meta-Analysis of Animal Models of Fatty Liver. eLife 2020, 9, e56573. [Google Scholar] [CrossRef]
- Monostori, P.; Wittmann, G.; Karg, E.; Túri, S. Determination of glutathione and glutathione disulfide in biological samples: An in-depth review. J. Chromatogr. B 2009, 877, 3331–3346. [Google Scholar] [CrossRef]
- Camera, E.; Picardo, M. Analytical methods to investigate glutathione and related compounds in biological and pathological processes. J. Chromatogr. B 2002, 781, 181–206. [Google Scholar] [CrossRef]
- Gusenbauer, M.; Haddaway, N.R. Which academic search systems are suitable for systematic reviews or meta-analyses? Evaluating retrieval qualities of Google Scholar, PubMed, and 26 other resources. Res. Synth. Methods 2020, 11, 181–217. [Google Scholar] [CrossRef]

| Strain | Diet and/or Supplements | Study Length (Weeks) | GSH and GSSG Levels in Model(s) (Mean ± Standard Deviation) | GSH in Normal Diet (ND) (Mean ± Standard Deviation) | Method | p-Values | Ref. |
|---|---|---|---|---|---|---|---|
| Not reported (nr) | ND, high-fructose diet (HFruD), HFruD + allopurinol (A), HFruD + metformin (MET), HFruD + vitamin E (VitE), HFruD + MET + VitE, HFruD + A + MET + VitE | 4 | Hepatic GSH (mg/g tissue): HFruD: 107 ± 1.70 HFruD + A: 119.3 ± 2.77 HFruD + MET: 128.9 ±1.44 HFruD + VitE: 122.9 ± 1.76 HFruD + MET + VitE: 122.5 ± 1.67 HFruD + A + MET + VitE: 129.8 ± 1.30 | Hepatic GSH (mg/g tissue): 129.7 ± 1.14 mg/g tissue | Ellman | Lower in HFruD vs ND and vs. all groups of treatments (p < 0.05) | [28] |
| Wistar and Zucker | ND, methionine and choline-deficient (MCD) diet on Wistar | 3 | Hepatic tGSH (nmol/mg protein): MCD: 16.1 ± 0.9 Lean Zucker: 35.7 ± 2.0 Obese Zucker: 31.2 ± 2.7 | Hepatic tGSH (nmol/mg protein): 37.5 ± 1.6 | Enzymatic recycling | Lower in MCD vs. ND (p < 0.05) | [29] |
| Sprague–Dawley | ND, cholesterol and fat-enriched (HCHF) diet, HCHF + carvedilol (CARV), HCHF + nicorandil (NICO) | 4 (HCHF) + 4 (ND + No drug/HCHF + CARV/NICO) | Hepatic GSH (mmol/mg protein): HCHF: 28.38 + 2.120 HCHF + CARV: 43.08 + 5.301 HCHF + NICO: 33.13 + 2.446 | Hepatic GSH (mmol/mg protein): 52.67 + 0.835 | Ellman | Lower in HCHF vs. ND and vs. HCHF + CARV and HCHF + NICO (p < 0.05) | [30] |
| Sprague–Dawley | ND, high-fat diet (HFD), HFD + mulberry extract (MB), and silk amino acids (SA) mixtures | 12 | Hepatic GSH (μmol/g protein): HFD: 22.8 ± 2.1 HFD + MB/SA 1:3 low dosage: 25.1 ± 2.2 HFD + MB/SA 1:3 high dosage: 27.7 ± 2.1 HFD + MB/SA 1:5 low dosage: 23.5 ± 2.5 HFD + MB/SA 1:5 high dosage: 24.8 ± 2.2 | Hepatic GSH (μmol/g protein): 24.9 ± 2.3 | Ellman | - Lower in HFD vs. ND (p < 0.05) - Recovery with all treatments (mainly with SA 1:3) (p < 0.05) | [31] |
| Wistar | ND, HFruD, HFruD + chrysin (chry) | 16 | Hepatic GSH (μg/mg tissue protein): HFruD: 363.7 ± 71.67 HFruD + chry (25 mg/kg; 50 mg/kg; 100 mg/kg): 553.9 ± 32.35; 714.2 ± 39.75; 844.2 ± 89.6 | Hepatic GSH (μg/mg tissue protein): 901 ± 97.45 | Ellman | - Lower in HFD vs. ND (p < 0.001) - Recovery with treatments at higher doses (p < 0.05, p < 0.001) | [32] |
| Wistar | ND, HFD, HFD + MET, HFD + Cassia semens (Cs) | 12 | Hepatic GSH (mg/g protein): HFD: 4.55 ± 0.91 HFD + MET: 6.68 ± 1.26 Cs (0.5 g/kg; 1 g/kg; 2 g/kg): 5.88 ± 1.06; 6.79 ± 0.93; 7.79 ± 1.48 | Hepatic GSH (mg/g protein): 9.76 ± 1.32 | Ellman | - Lower in HFD vs. ND - Dose-dependent recovery with all treatments (p < 0.05, p < 0.01) | [33] |
| Wistar | ND, sucrose (S) | approximately 26 | Hepatic GSH (nmol/mg tissue): S: 7.05 ± 0.76 Hepatic GSSG (nmol/mg tissue): S: 1.28 ± 0.06 Hepatic GSH + 2× GSSG (nmol GSH units/mg tissue): S: 8.33 ± 0.75 Hepatic GSH/GSSG: S: 5.57 ± 0.67 | Hepatic GS (nmol/mg tissue): 18.54 ± 0.41 Hepatic GSSG (nmol/mg tissue): 2.38 ± 0.12 Hepatic GSH + 2× GSSG (nmol GSH units/mg tissue): 20.92 ± 0.50 Hepatic GSH/GSSG: 7.83 ± 0.28 | Fluorimetric | Lower GSH, GSSG and GSH + 2× GSSG in sucrose vs. ND (p < 0.05) | [34] |
| Wistar | ND, high-fat cholesterol diet (HFCD), ND + cranberry (cra), HFCD + cra | 8 | Hepatic GSH (pg/mg protein): HFCD: 9.66 ± 0.60 ND + cra (100 mg/kg): 69.8 ± 3.34 protein HFCD + cra (50 mg/kg; 100 mg/kg): 19.01 ± 1.33; 34.47 ± 0.74 | Hepatic GSH (pg/mg protein): 43.22 ± 1.42 | Ellman | - Lower in HFD vs. ND - Dose-dependent recovery with all treatments (p < 0.05) | [35] |
| Sprague-Dawley | ND, ovariectomized (OVX) + ND, OVX + high-fat and high-fructose diet (OVX + HFHF) | 4 | Hepatic GSH (nmol/mg protein): OVX + ND: 55.21 ± 1.40 OVX + HFHF: 46.01 ± 0.91 | Hepatic GSH (nmol/mg protein): 57.94 ± 0.32 | Ellman | - Lower in OVX + ND vs. ND (p < 0.01) - Lower in OVX + HFHF vs. OVX + ND (p < 0.01) | [36] |
| nr | ND, HFD, ND + ethanolic extract of garden cress seeds, HFD + Garden Cress (GC) | 12 | Hepatic GSH (pg/g tissue) HFD: 29.64 ± 0.91 GC: 42.59 ± 1.64 HFD + GC: 38.18 ± 1.77 | Hepatic GSH (pg/g tissue) 41.58 ± 2.48 | Immunosorbent | Hepatic GSH: Lower in HFD vs. ND and vs. treatment group (p < 0.05) | [37] |
| Wistar | ND, HFD, HFD + pioglitazone (PIO), HFD + Ruzu herbal bitters (RUZU), HFD + fenofibrate (FENO) | 12 | Hepatic GSH (nmol/mg protein): HFD: 72.24 ± 5.15 HFD + PIO: 112.10 ± 3.79 HFD + RUZU: 119.19 ± 9.21 HFD + FENO: 151.53 ± 19.69 | Hepatic GSH (nmol/mg protein): 112.18 ± 6.18 | Enzymatic recycling | - Lower in HFD vs. ND (p < 0.05) - Recovery with all treatments (p < 0.05) | [38] |
| Wistar | HFD, HFD + MET, HFD + pentoxifylline (PTX) + MET, HFD + cilostazol (CLS) + MET, HFD + sildenafil (SLD) + MET | 16 | Hepatic GSH (mmol/g tissue): HFD + MET: 45.9 ± 2.0 HFD + PTX + MET: 69.9 ± 2.8 HFD + CLS + MET: 42.3 ± 5.0 HFD + SLD + MET: 50.5 ± 3.18 | Hepatic GSH (mmol/g tissue): 74.4 ± 3.8 | Ellman | - Lower in HFD vs. ND (p < 0.05) - Recovery with all treatments (p < 0.05) | [39] |
| Sprague-Dawley | ND, HFD, ND + lycopene (lyc), HFD + lyc | 8 | Hepatic GSH (pg/mg protein): HFD: 2.5 ± 0.35 ND + lyc: 13.0 ± 1.7 HFD + lyc: 8.3 ± 0.7 | Hepatic GSH (pg/mg protein): 12.4 ± 1.2 | Ellman | - Lower in HFD vs. ND (p < 0.05) - Recovery with treatment (p < 0.05) | [40] |
| Wistar | ND, HFD, ND + pectinase treated probiotic banana juice (PPBJ), HFD + PPBJ | 20 | Hepatic GSH (µmol/µg protein): HFD: 0.4 ± 0.21 ND + PPBJ: nr HFD + PPBJ: 1.04 ± 0.04 | nr | Ellman | Lower in HFD vs. treatment control (p < 0.001) | [41] |
| Wistar | ND, HFHF, HFHF + MET, HFHF + melatonin (MEL) | 8 | Hepatic GSH (μmol/g tissue): HFHF: 78.32 ± 2.28 HFHF + MET: 99.31 ± 4.68 HFHF + MEL: 104.9 ± 4.24 | Hepatic GSH (μmol/g tissue): 122.2 ± 6.58 | High-performance liquid chromatography (HPLC)-UV | - Lower in HFHF vs. ND (p < 0.05) - Recovery with treatment groups (p < 0.05) | [42] |
| Wistar | ND, HFruD, ethanol, HFruD + 1,25-dihydroxyvitamin D3 (1,25(OH)2D3), ethanol + 1,25(OH)2D3 | 8 | Hepatic GSH (nmol/mg protein): HFruD: 19.4 ± 4.03 ethanol: 21.5 ± 5.17 HFruD + 1,25(OH)2D3: 19.5 ± 4.99 ethanol + 1,25(OH)2D3: 26.9 ± 5.70 | Hepatic GSH (nmol/mg protein): 23.9 ± 3.02 | Ellman | Not significant | [43] |
| Wistar | ND, HFD, ND + eugenol (EUG), HFD + EUG | 8 | Hepatic GSH (pg/mg protein): HFD: 11.1 ± 1.33 ND + EUG: 48.5 ± 3.24 HFD + EUG: 27.0 ± 2.03 | Hepatic GSH (pg/mg protein): 40.0 ± 5.69 pg/mg protein | Immunosorbent | - Lower in HFD vs. ND (p < 0.05) - Recovery with treatment (p < 0.05) | [44] |
| Wistar | ND, HFruD, ND + silymarin (sily), HFruD + sily | 8 | Hepatic GSH (μmol/g tissue): HFruD: 33.93 ± 0.91 ND + Sily (400 mg/kg): 36.53 ± 0.89 HFruD + sily (200 mg/kg; 400 mg/kg): 35.49 ± 0.98; 36.35 ± 0.93 | Hepatic GSH (μmol/g tissue): 37.98 ± 1.07 | Ellman | - Lower in HFruD vs. ND (p < 0.001) - Recovery with treatment groups (p < 0.05, p < 0.01) | [45] |
| Wistar | ND, HFD/coconut oil (CO) + streptozotocin (STZ), HFD/thermally oxidized CO (TCO) + STZ | 4 (ND/HFD) + 4 (ND + No drug/HFD + STZ) | Hepatic GSH in 2 different areas (µmol/mg protein): HFD/CO + STZ: 10.85 ± 1.88; 7.15 ± 1.04 HFD/TCO + STZ: 9.53 ± 0.67; 5.52 ± 1.86 | Hepatic GSH (µmol/mg protein): 4.73 ± 0.66 µmol/mg protein | Ellman | Higher in all groups vs. ND (p < 0.01) | [46] |
| Wistar | ND, HFruD | 8 12 | Hepatic GSH—8 weeks (µM/100 mg tissue): HFruD (10%; 30%; 60%): 51.58 ± 13.90; 56.61 ± 24.79; 83.95 ± 17.95 Hepatic GSH—12 weeks (µM/100 mg tissue): HFruD (10%; 30%; 60%): 98.33 ± 19.80; 86.11 ± 42.20; 177.67 ± 60.30 | Hepatic GSH (µM/100 mg tissue): 66.95 ± 4.83 (8 weeks) 126.58 ± 18.13 (12 weeks) | Enzymatic recycling | Decreased GSH with concentration and time (p < 0.0001) | [47] |
| Sprague-Dawley | ND, HFHF, HFHF + sily, HFHF + celery, HFHF + curcumin (cur) | 16 (ND/HFHF) + 4 (ND/HFHF + No drug/HFHF + sily/HFHF/HFHF + cur) | Hepatic GSH (μmol/g tissue): HFHF: 14.47 ± 0.1 HFHF + sily: 18.44 ± 0.09 HFHF + celery: 21.22 ± 0.12 HFHF + cur: 19.71 ± 0.08 | Hepatic GSH (μmol/g tissue): ND: 25.7 ± 0.24 | HPLC-UV | - Lower in HFHF vs. ND (p < 0.05) - Recovery in treatment groups (p < 0.05) | [48] |
| Sprague-Dawley | ND, HFD, HFD + orlistat (O), obese (ob)/HFD + O | 6 (ob/HFD + O), 12 (HFD + O) | Hepatic GSH (nmol/mg protein): HFD: 2.37 ± 0.10 HFD + O: 3.06 ± 0.06 ob/HFD + O: 2.91 ± 0.19 | Hepatic GSH (nmol/mg protein): 3.29 ± 0.08 | Ellman | - Lower in HFD vs. ND (p < 0.05) - Recovery in protective and therapeutic treatment groups (p < 0.05) | [49] |
| Wistar | ND, MCD | 2, 4, 8 | Hepatic GSH (nmol/mg protein): MCD 2 wk: 19.33 ± 1.34 MCD 4 wk: 16.18 ± 1.15 MCD 8 wk: 17.99 ± 1.74 | Hepatic GSH (nmol/mg protein): 2 wk: 37.31 ± 1.49 4 wk: 37.66 ± 2.53 8 wk: 36.92 ± 2.51 | Enzymatic recycling | Lower in MCD vs. ND (p < 0.05) | [50] |
| Wistar | ND, HFruD, HFruD + chry | 8 | Hepatic GSH (mg/g tissue): HFruD: 9.6 ± 0.64 HFruD + chry (25 mg/kg; 50 mg/kg): 12.18 ± 0.35; 13.06 ± 0.24 | Hepatic GSH (mg/g tissue): 13.9 ± 0.34 | Ellman | - Lower in HFruD vs. ND (p < 0.001) - Recovery in protective and therapeutic treatment groups (p < 0.001) | [51] |
| Wistar | ND, obesogenic diet (ObD), ObD + chry | 12 (ND/ObD) + 4 (ND + No drug/ObD/ObD + chry) | Hepatic tGSH (nmol/mg protein): ObD: 21.4 ± 1.8 ObD + chry (25 mg/kg; 50 mg/kg; 75 mg/kg): 23.7 ± 1.9; 24.7 ± 1.9; 25.0 ± 1.7 Hepatic GSH (nmol/mg protein): ObD: 17.5 ± 1.5 Ob/D + chry (25 mg/kg; 50 mg/kg; 75 mg/kg): 20.8 ± 1.7; 22.3 ± 1.8; 22.7 ± 1.6 Hepatic GSSG: ObD: 2.0 ± 0.2 nmol/mg protein; ObD + chry (25 mg/kg; 50 mg/kg; 75 mg/kg): 1.5 ± 0.2; 1.2 ± 0.2; 1.2 ± 0.1 Hepatic GSH/GSSG: ObD: 8.9 ± 0.6 ObD + chry (25 mg/kg; 50 mg/kg; 75 mg/kg): 14.1 ± 1.2; 19.0 ± 2.5; 19.7 ± 1.6 | Hepatic tGSH (nmol/mg protein): 27.7 ± 1.7 Hepatic GSH: 25.6 ± 1.6 Hepatic GSSG: 1.1 ± 0.1 Hepatic GSH/GSSG: 23.6 ± 2.0 | Enzymatic recycling | tGSH and GSH/GSSG: - Lower in ObD vs. ND (p < 0.05) - Recovery in all treatments (p < 0.05) GSH: - Higher in ObD vs. ND (p < 0.05) - Recovery in all treatments (p < 0.05) | [52] |
| nr | ND, HFHF, vitamin D (VitD), HFHF + VitD | 10 | Hepatic GSH (mg/g.tissue): HFHF: 3.30 ± 0.20 VitD: 5.57 ± 0.15 HFHF + VitD: 4.61 ± 0.16 | Hepatic GSH (mg/g tissue): 5.56 ± 0.29 mg/g tissue | Ellman | Lower in HFD vs. ND and treatment control (p < 0.05) | [53] |
| Wistar | ND, HFD, ND + M. pubescens powder (MP), HFD + MP | 16 | Hepatic GSH (nmol/mg protein): HFD: 48.95 ± 3.64 ND + MP: 78.68 ± 2.31 HFD + MP: 76.19 ± 4.44 | Hepatic GSH (nmol/mg protein): 82.07 ± 4.09 | Ellman | - Lower in HFD vs. ND (p < 0.001) - Recovery in the treatment group (p < 0.01) | [54] |
| Strain | Diet and/or Supplements | Study Length (Weeks) | GSH and GSSG Levels in Model(s) (Mean ± Standard Deviation) | GSH in Normal Diet (ND) (Mean ± Standard Deviation) | Method | p-Values | Ref. |
|---|---|---|---|---|---|---|---|
| C57BL/6J | ND, high-fat and high-fructose diet (HFHF), HFHF + 14-deoxy-11,12-didehydroandrographolide (deAND) | 7 | Hepatic GSH (nmol/mg protein): HFHC: 0.26 ± 0.03 HFHC + 0.05% deAND: 0.24 ± 0.05 HFHC + 0.1% deAND: 0.32 ± 0.04 | Hepatic GSH (nmol/mg protein): 2.81 ± 0.99 | High-performance liquid chromatography-mass spectrometry (HPLC-MS) | Lower in HFHF vs. ND, and vs. HFHF + deAnd at the higher dose (p < 0.05) | [103] |
| C57BL/6J | High-fat diet (HFD) + Gongmei White Tea (T1), White Peony Tea (T2), Enshi Yulu Tea (T3), Fried Green Tea (T4), Yihong Tea (T5), Lapsang Souchong Tea (T6), Wuyi Narcissus Tea (T7), Fenghuang Narcissus Tea (T8), Qing Brick Tea (T9), Pu-erh Tea (T10), Yuan’an Luyuan Tea (T11), Mengding Huangya Tea (T12) | 15 | Hepatic GSH (μmol/g protein): HFD: 3.94 ± 1.14 HFD + T1: 3.46 ± 0.79 HFD + T2: 3.76 ± 0.92 HFD + T3: 3.82 ± 0.40 HFD + T4: 2.58 ± 0.65 HFD + T5: 2.16 ± 0.37 HFD + T6: 4.63 ± 1.90 HFD + T7: 4.91 ± 1.62 HFD + T8 5.30 ± 0.98 HFD + T9: 3.80 ± 1.07 HFD + T10: 4.23 ± 0.76 HFD + T11: 4.53 ± 1.36 HFD + T12: 4.37 ± 1.38 | Hepatic GSH (μmol/g protein): 5.26 ± 2.10 | Ellman | Lower in the HFD group vs. ND and ND, and vs. T4, T5, and T8 (p < 0.05) | [104] |
| ICR | ND, HFD/ethanol, HFD/ethanol + fenofibrate (F), HFD/ethanol + hesperidin (H), HFD/ethanol + myricetin (M) | Approximately 8 | Hepatic tGSH (nmol/mg protein): HFD/ethanol: 133.91 ± 23.82 HFD/ethanol + F: 92.69 ± 11.56 HFD/ethanol + H (50 mg/kg; 200 mg/kg): 98.83 ± 24.95; 73.71 ± 16.56 HFD/ethanol + M (50 mg/kg; 200 mg/kg): 83.52 ± 11.58; 82.43 ± 17.53 Hepatic GSH (nmol/mg protein): HFD/ethanol: 41.42 ± 9.20 HFD/ethanol + F: 63.58 ± 3.87 HFD/ethanol + H (50 mg/kg; 200 mg/kg): 69.03 ± 9.10; 35.63 ± 4.51 HFD/ethanol + M (50 mg/kg; 200 mg/kg): 48.07 ± 9.19; 48.87 ± 7.35 Hepatic GSSG (nmol/mg protein): HFD/ethanol: 42.11 ± 11.22 HFD/ethanol: + F: 29.11 ± 8.67 HFD/ethanol + H (50 mg/kg; 200 mg/kg): 29.80 ± 8.67; 38.08 ± 6.82 HFD/ethanol + M (50 mg/kg; 200 mg/kg): 35.45 ± 5.76; 33.56 ± 6.18 Hepatic GSH/GSSG: HFD/ethanol: 0.98 ± 0.11 HFD/ethanol: + F: 2.18 ± 0.57 HFD/ethanol + H (50 mg/kg; 200 mg/kg): 2.32 ± 0.31; 0.94 ± 0.48 HFD/ethanol + M (50 mg/kg; 200 mg/kg): 1.35 ± 0.44; 1.45 ± 0.53 | Hepatic tGSH (nmol/mg protein) 133.91 ± 13.74 Hepatic GSH (nmol/mg protein) 104.86 ± 13.01 Hepatic GSSG (nmol/mg protein) 29.05 ± 5.00 Hepatic GSH/GSSG 3.61 ± 1.16 | Enzymatic recycling | GSH, GSH/GSSG: Lower in HFD/ethanol vs. ND and vs. low dose H and vs. F (p < 0.05) | [105] |
| CD1 (ICR) | ND, HFD, HFD + metformin (MET), HFD + water chestnut (WC) | 13 | Hepatic GSH (µM/mg tissue): HFD: 10.45 ± 1.80 HFD + MET: 32.31 ± 10.11 HFD + WC (50 mg/kg, 100 mg/kg, 200 mg/kg): 10.74 ± 3.21; 32.31 ± 13.52; 45.49 ± 13.68 | Hepatic GSH (µM/mg tissue): 69.63 ± 10.20 | Ellman | Lowers in HFD vs. ND and vs. treatments at higher doses | [106] |
| C57BL/6J | ND, HFD/streptozotocin (STZ), HFD/STZ + swietenine (SW) | 3 (HFD/STZ) + 8 (HFD + STZ/HFD + STZ + SW) | Serum GSH (nmol/µL): HFD/STZ: 0.71 ± 0.18 HFD/STZ + SW: 2.02 ± 0.08 | Serum GSH (nmol/µL): 2.41 ± 0.21 | Ellman | Lower in HFD/STZ vs. ND and vs. treatment (p < 0.0001) | [107] |
| C57BL/6 | ND, ND + 5-aminoimidazole-4-carboxamide-1-β-D-ribofuranoside (AICAR) HFHF, HFHF + AICAR | 10 | Plasma GSH (μg/mg protein): AICAR: 9.80 ± 0.22 HFHF: 5.72 ± 0.17 HFHF + AICAR: 7.63 ± 0.19 | Plasma GSH (μg/mg protein): 9.78 ± 0.20 | Ellman | Lower in HFHF vs. ND and vs. treatment (p < 0.05) | [108] |
| Model | Supplements | Study Length (Hours) | GSH and GSSG Levels in Model(s) | GSH in Control Group (Ctrl) | Method | p-Values | Ref. |
|---|---|---|---|---|---|---|---|
| BRL-3A cells | Ctrl, nonesterified fatty acids (NEFAs) | 12 | Not reported (nr) | nr | Ellman | GSH: Lower in NEFAs vs. Ctrl (p < 0.05) | [58] |
| HepG2 cells | Oleic acid (OA), OA + berbamine, OA + fenofibrate (FENO) | 48 | nr | nr | Fluorimetric | GSH: - Lower in OA vs. Ctrl (p < 0.05) - Recovery with treatments at higher dose (p < 0.05) | [162] |
| HepG2 cells | OA/tert-butylhydroperoxide (t-BHP), t-BHP + water extract of A. annua | 6 | nr | nr | Ellman | GSH: Lower in t-BHP vs. treatment groups (p < 0.001) | [163] |
| HepG2 cells | Ctrl, palmitic acid (PA), phloroglucinol (PHG), PA + PHG, PA + α-lipoic acid (ALA), PA + N-acetylcysteine (NAC) + H2O2 | 16 | nr | nr | Enzymatic recycling | tGSH: Lower in PHG vs. Ctrl (p < 0.05) GSH: - Lower in PA (p < 0.0001) and PHG (p < 0.01) - Recovery dose-dependently with treatments (p < 0.01) GSSG: - Higher in PA vs. Ctrl - Recovery dose-dependently with treatments (p < 0.01) GSH/GSSG: - Lower in PA and PHG vs. Ctrl - Recovery dose-dependently with treatments (p < 0.05) | [164] |
| L02 cells | Ctrl, H2O2, H2O2 + Lycii fructus polysaccharide (LFP) | 48 | nr | nr | Ellman | GSH: - Lower in H2O2 vs. Ctrl (p < 0.0001) - Recovery with all treatments (p < 0.01, p < 0.001) | [165] |
| L02 cells | Free fatty acids (FFAs), FFAs + malvidin-3-O-glucoside (M3G), FFAs + malvidin-3-O-galactoside (M3Ga), FFAs + buthionine sulfoximine (BSO), FFAs + NAC | 48 | nr | nr | Fluorimetric | GSH: - Lower in FFAs and FFAs + BSO vs. Ctrl (p < 0.05) - Recovery with M3G, M3Ga and NAC (p < 0.05) | [166] |
| HepG2 cells | Ctrl, OA, OA + hesperetin (H) | 24 | nr | nr | Ellman | GSH: Lower in OA vs. Ctrl and vs. OA + H (p < 0.05) | [66] |
| HepG2 cells | FFAs, FFAs + picroside II (PIC), FFAs + silibinin | 22 | nr | nr | Enzymatic recycling | tGSH: - Lower in FFAs vs. Ctrl (p < 0.01) - Recovery with treatments (p < 0.05) GSH/GSSG: - Lower in FFAs vs. Ctrl (ns) and vs. FFAs + PIC (p < 0.01) | [167] |
| L02 cells | Ctrl, 5% fat emulsion (FE), FE + Jiuzhuan Huangjing pills | 24 | nr | nr | Ellman | GSH: - Lower in FE vs. Ctrl (p < 0.05) - Recovery with treatment at higher doses (p < 0.01) | [68] |
| Primary mouse hepatocytes | Ctrl, fructose (Fru), Fru + carminic acid (CA) | nr | nr | nr | Ellman | GSH: Lower in Fru vs. Ctrl and Fru + CA groups (p < 0.05) | [168] |
| HepG2 cells | Ctrl, FFAs, FFAs + xiaoheiyao (XHY-1) | 24 | nr | nr | Enzymatic recycling | GSH/GSSG: - Lower in FFAs vs. Ctrl - Recovery with treatment at higher doses (0.05) | [169] |
| HepG2 cells subcultured on rat liver biological matrix scaffolds | Ctrl, FFAs, FFAs + baicalin | 192 | nr | nr | Ellman | GSH: - Lower in FFAs vs. Ctrl (p < 0.05) - Recovery with treatment (p < 0.01) | [170] |
| L02 cells | Ctrl, PA | nr | nr | nr | Enzymatic recycling | GSH/GSSG: Lower in PA vs. Ctrl (significance nr) | [171] |
| HepG2 spheroids | Ctrl, methionine and cystine deficient media (MCDM), MCDM + livogrit, MCDM + pioglitazone | 72 | GSH, mean ± standard deviation (µmol/L): MCDM: 3.05 ± 0.14 MCDM + livogrit: 4.82 ± 0.13 MCDM + pioglitazone: 3.73 ± 0.01 | GSH, mean ± standard deviation (µmol/L): 7.83 ± 1.26 | Fluorimetric | GSH: - Lower in MCDM vs. Ctrl (p < 0.01) -Recovery with livogrit at higher doses (p < 0.001) and pioglitazone (p < 0.05) | [172] |
| L02 cells | Ctrl, cholesterol (CHO) | 24 | nr | nr | Enzymatic recycling | GSSG/GSH Higher in CHO vs. respective Ctrl (p < 0.05) | [173] |
| HepG2 cells | Ctrl, 0.55 mM fructose (FC1), 1 mM fructose (FC2), 1 mM fructose + 0.1 µM insulin (FC3) | 48 | nr | nr | Ellman | GSH: Lower in FC1 and FC2 vs. Ctrl (p < 0.05) | [174] |
| AML12 cells | Ctrl, PA | 24 | nr | nr | High-performance liquid chromatography-mass spectrometry (HPLC-MS) | GSH: Lower in palmitate vs. Ctrl (p < 0.05) | [144] |
| L02 cells | Ctrl, FFAs, FFAs + peonidin 3-O-glucoside (P3G) | 24 | nr | nr | Fluorimetric | GSH: Lower in FFAs vs. Ctrl and vs. treatment at the higher dose (p < 0.01) | [175] |
| HepG2 cells | Ctrl, FFAs, FFAs + zeaxanthin (ZEA), FFAs + Fer-1 | 24 | nr | nr | Ellman | GSH: - Lower in FFAs vs. Ctrl (p < 0.05) and vs. FFAs + Fer-1 group - Recovery in all treatment groups | [176] |
| AML12 and HepG2 cells | Ctrl, FFAs, erastin (E), Fer-1 | 24 | nr | nr | Ellman | GSH: Lower in FFAs and E vs. Ctrl (p < 0.01) | [147] |
| HepG2 cells | Ctrl, FFAs, FFAs + sulphasalazine (SAS), FFAs + melatonin (MEL) | nr | nr | nr | Ellman | GSH: Lower in FFAs and SAS vs. Ctrl (p < 0.0001) Recovery with the higher dose of MEL (p < 0.0001) | [148] |
| HepG2 cells | 40% fetal bovine serum (FBS), FBS + FENO, FBS + S2 compound | 48 | nr | nr | Enzymatic recycling | GSH/GSSG and GSH: Lower in FBS vs. Ctrl and vs. treatments (p < 0.05) | [92] |
| HepG2 cells | Ctrl, FFAs, FFAs + arbutin (ARB) | 24 | nr | nr | Ellman | GSH: Lower in FFAs vs. FFAs + ARB (p < 0.05) | [151] |
| HepG2 cells | Ctrl, FFAs, FFAs + ALA | 24 | nr | nr | HPLC-UV | GSH: - Lower in FFAs vs. Ctrl (p < 0.01) - Recovery with all treatments (p < 0.05, p < 0.01) | [177] |
| HepG2 cells | Ctrl, FFAs, FFAs + MC3482 compound | nr | nr | HPLC-UV | GSH: Lower in FFAs vs. Ctrl and vs. FFAs + MC3482 (p < 0.0001) | [178] |
| Model | Diet/Supplements | Length of Study (Weeks) | Thiol Levels in MASLD Model | Thiol Levels in Normal Diet (ND) | Method | p-Values | Ref. |
|---|---|---|---|---|---|---|---|
| C57BL/6 mice | ND, methionine, and choline-deficient (MCD) diet, ND + PCB-126, MCD + PCB-126 | 14 | Not reported (nr) | nr | High-performance liquid chromatography-mass spectrometry (HPLC-MS) | Hepatic CysGly and Cys: - No significance between MCD vs. ND - Higher in MCD vs. MCD + PCB126 group (p < 0.05) | [110] |
| C57BL/6J mice | ND, high-fat diet (HFD) | 14 | Hepatic homocysteine (median, interquartile range): HFD: 2.3 (2.1–2.7) μM/100 mg; | Hepatic homocysteine (median and interquartile range): ND: 2.4 (2.1–2.9) μM/100 mg | HPLC-MS | No significance between HFD and ND | [179] |
| nr | ND, high-fat and high-fructose diet (HFHF), HFHF + lupeol (L), HFHF + MET | 8 | Hepatic free thiols, mean ± standard deviation (nmol/mg protein): HFHF: 0.28 ± 0.02 HFHF + L: 3.6 ± 0.10 HFHF + MET: 3.3 ± 0.20 | Hepatic thiols, mean ± standard deviation (nmol/mg protein): ND: 3.9 ± 0.30 | Ellman | - Lower in HFHF vs. ND (p < 0.05) - Recovery with treatments (p < 0.05) | [180] |
| Age | Study Type | Patient Number | LMW Thiols | Method | p-Value | Ref. |
|---|---|---|---|---|---|---|
| Adults | Prospective observational (case-control) | Controls: 40 Patients with early MASLD: 29 Patients with advanced MASLD: 38 | Plasma GSH, median, interquartile range (mg/mg protein): Control: 0.79 (0.67–1.28) Early MASLD: 1.37 (1.07–2.25) Advanced MASLD: 1.66 (1.08–2.02) | Ellman | Higher in early and advanced MASLD vs. controls (p < 0.001) | [182] |
| Adults | Retrospective, observational (population-based cohort) | FLI < 60: 3911 FLI ≥ 60: 1651 | Free thiols, mean ± standard deviation (µmol/L/g protein): FLI < 60: 5.05 ± 0.99 FLI ≥ 60: 4.91 ± 1.02 | Ellman | Significance between FLI > 60 and FLI < 60 estimated through multivariable logistic regression analyses (p < 0.001) | [183] |
| Adults | Prospective observational (case-control) | Controls: 69 MASLD: 144 | nr | Gas chromatography-mass spectrometry | Blood GSH: Lower in MASLD vs. controls (p < 0.001) | [184] |
| Adults | Prospective observational (cross-sectional) | Controls: 25 MASLD: 60 | Free thiols, mean ± standard deviation (µmol/L) Control: 11.70 ± 0.33 MASLD: 10.61 ± 0.13 | Ellman | Lower in MASLD vs. controls (p < 0.05) | [185] |
| Children | Retrospective observational (longitudinal: Baseline (T0) and 12-month follow-up (T1)) | MASLD: 24 | Plasma tGSH, median, interquartile range (μmol/L): T0: 26.0 (20.5–38.5) T1: 31.5 (25.5–38.5) Plasma Hcy, mean, standard deviation (μmol/L): T0: 15.7 ± 4.1 T1: 21.1 ± 9.3 | High-performance liquid chromatography-fluorescence detector (HPLC-FD) | Plasma tGSH: ns Plasma Hcy: Lower in T0 vs. T1 (p < 0.05) | [186] |
| Adults | Prospective observational (case-control) | Controls: 8 MASLD: 6 | nr | Fluorimetric | Peripheral mononuclear cells GSH: Lower in MASLD vs. control (p < 0.05) | [187] |
| Age | Study Design | Patient Number | GSH Levels in the Placebo Group | GSH Levels in the Treatment Group | Method | p-Value | Ref. |
|---|---|---|---|---|---|---|---|
| Children | - Randomized, double-blind placebo-controlled trial. - Two arms: the arm of placebo (PLA); and the arm of treatment with hydroxytyrosol and vitamin E (HXTE). - Time: Baseline (T0) and 4-month follow-up (T1). | PLA: 40 HXTE: 40 | Plasma GSH, mean ± standard deviation (μM): T0: 29.6 ± 51.8 T1: 52.2 ± 85.0 Plasma GSSG, mean ± standard deviation (μM): T0: 1.5 ± 2.3 T1: 4.0 ± 4.9 Plasma GSH/GSSG, mean ± standard deviation: T0: 40.8 ± 61.1 T1: 132.9 ± 108.7 | Plasma GSH, mean ± standard deviation (μM): T0: 47.1 ± 13.0 T1: 101.8 ± 43.8 Plasma GSSG, mean ± standard deviation (μM): T0: 1.9 ± 0.9 T1: 4.9 ± 2.8 Plasma GSSG/GSH, mean ± standard deviation: T0: 77.7 ± 80 T1: 189.5 ± 121.0 | High-performance liquid chromatography (HPLC)-UV | GSH and GSH/GSSG: - Higher at T1 vs. T0 in PLA and in HXTE (p < 0.02) GSSG: Higher at T1 vs. T0 in HXTE (p < 0.001) | [188] |
| Adults | - Randomized, double-blind, placebo-controlled trial. - Three arms: the arm of PLA; the arm of treatment with a low dose of pinitol (P300 mg); and the arm with a high dose of pinitol (P500 mg). - Time: Baseline (T0) and 12-week follow-up (T1). | PLA: 30 P300: 30 P500: 30 | Serum GSH, mean ± standard deviation (μM): T0: 198.3 ± 37.8 T1: 217.6 ± 37.8 | Serum GSH, mean ± standard deviation (μM): P300 (T0): 248.9 ± 38.3 P300 (T1): 273.8 ± 39.8 P500 (T0): 158.0 ± 28.4 P500 (T1): 186.7 ± 28.8 | Ellman | Not significant (ns) | [189] |
| Adults | - Open-label, parallel-group, randomized–controlled trial. - Two arms: the arm of standard management therapy (SMT); and the arm of treatment with SMT plus H. pylori-eradication therapy (HPET). - Time: Baseline (T0) and 24-week follow-up (T1). | SMT: 28 HPET: 36 | – | Serum GSH, median, interquartile range (µg/mL): SMT (T0): 192.4 (151.4–213.1) SMT (T1): 196.7 (181.0–213.7) HPET (T0): 159.0 (143.2–183.1) HPET (T1): 188.5 (167.4–221.3) | Ellman | Higher at T1 vs. T0 in HPET (p < 0.05) | [190] |
| Children | - Randomized, crossover, one-side open trial. - Two arms: the arm of calorie-restricted regimen (RCR); and the arm of RCR plus supplement of lycopene-rich tomato juice (RCRT). - Time: Baseline (T0), 60-day crossover (T1), 60-day follow-up (T2). | RCR: 27 RCRT: 34 | Not reported (nr) | nr | Enzymatic recycling | Serum GSH/GSSG and GSH: Higher in RCR and RCRT at T2 vs. T0 (p < 0.01) Blood GSSG: Lower in RCRT at T1 and T2 vs. T0 (p < 0.01) | [191] |
| Adults | - Randomized, double-blinded, placebo-controlled trial. - Two arms: the arm of PLA; the arm of treatment with VSL#3® (VSL#3). - Time: Baseline (T0) and 10-week follow-up (T1). | PLA: 16 VSL#3: 19 | Blood GSH/GSSG: T0: 20 ± 12 T1: 21 ± 9 | Blood GSH/GSSG: T0: 22 ± 10 T1: 26 ± 13 | Enzymatic recycling | ns | [192] |
| Children | - Single-blind, randomized, controlled, parallel dietary intervention. - Two arms: the arm with low-fat diet (LFD); and the arm of treatment with Mediterranean diet (MD). - Time: Baseline (T0) and 12-week follow-up (T1). | LFD: 22 MD: 22 | – | Blood GSH, mean ± standard deviation (mg/L): LFD (T0): 82.0 ± 118.10 LFD (T1): 81.5 ± 100.68 MD (T0): 62.5 ± 97.53 MD (T1): 87.0 ± 39.29 | Ellman | Higher in the MD group compared to LFD at T1 (p < 0.05) | [193] |
| Adults | - Clinical study with a single arm. - The arm of treatment with pioglitazone. - Time: Baseline (T0) and 3-month follow-up (T1). | MASLD: 37 | – | Serum Thiols, mean ± standard deviation (µmol/L): T0: 181.26 ± 59.92 T1: 182.44 ± 54.06 | Ellman | Higher in T1 vs. T0 (p < 0.015) | [194] |
| Adults | - Clinical study with a single arm. - Retrospective analysis based on the adherence to MD: low adherence (LA) group; high adherence (HA) group. - Time: Baseline (T0) and 24-month follow-up (T1). | LA: 20 HA: 20 | – | GSH, mean ± standard deviation (mmol/109 erythrocytes) LA (T0): 5.8 ± 2.7 LA (T1): 6.8 ± 1.9 HA (T0): 6.0 ± 2.3 HA (T1): 8.5 ± 3.2 | Ellman | Higher in HA at T1 vs. T0 (p < 0.05); and HA at T1 vs. LA at T1 (p < 0.05) | [195] |
Disclaimer/Publisher’s Note: The statements, opinions and data contained in all publications are solely those of the individual author(s) and contributor(s) and not of MDPI and/or the editor(s). MDPI and/or the editor(s) disclaim responsibility for any injury to people or property resulting from any ideas, methods, instructions or products referred to in the content. |
© 2024 by the authors. Licensee MDPI, Basel, Switzerland. This article is an open access article distributed under the terms and conditions of the Creative Commons Attribution (CC BY) license (https://creativecommons.org/licenses/by/4.0/).
Share and Cite
Cesarini, L.; Grignaffini, F.; Alisi, A.; Pastore, A. Alterations in Glutathione Redox Homeostasis in Metabolic Dysfunction-Associated Fatty Liver Disease: A Systematic Review. Antioxidants 2024, 13, 1461. https://doi.org/10.3390/antiox13121461
Cesarini L, Grignaffini F, Alisi A, Pastore A. Alterations in Glutathione Redox Homeostasis in Metabolic Dysfunction-Associated Fatty Liver Disease: A Systematic Review. Antioxidants. 2024; 13(12):1461. https://doi.org/10.3390/antiox13121461
Chicago/Turabian StyleCesarini, Lucia, Flavia Grignaffini, Anna Alisi, and Anna Pastore. 2024. "Alterations in Glutathione Redox Homeostasis in Metabolic Dysfunction-Associated Fatty Liver Disease: A Systematic Review" Antioxidants 13, no. 12: 1461. https://doi.org/10.3390/antiox13121461
APA StyleCesarini, L., Grignaffini, F., Alisi, A., & Pastore, A. (2024). Alterations in Glutathione Redox Homeostasis in Metabolic Dysfunction-Associated Fatty Liver Disease: A Systematic Review. Antioxidants, 13(12), 1461. https://doi.org/10.3390/antiox13121461