Article

Sappanone A Alleviates the Severity of Carbon Tetrachloride-Induced Liver Fibrosis in Mice

1
Department of Biochemistry and Molecular Biology, The School of Basic Medical Sciences, Fujian Medical University, No. 1, Xuefu North Road, University Town, Fuzhou 350122, China
2
Department of Pathology and Institute of Oncology, The School of Basic Medical Sciences, Fujian Medical University, Fuzhou 350122, China
3
Diagnostic Pathology Center, Fujian Medical University, Fuzhou 350122, China
*
Authors to whom correspondence should be addressed.
These authors contributed equally to this work.
Antioxidants 2023, 12(9), 1718; https://doi.org/10.3390/antiox12091718
Submission received: 14 July 2023 / Revised: 28 August 2023 / Accepted: 1 September 2023 / Published: 4 September 2023
(This article belongs to the Special Issue Oxidative Stress in Liver Diseases - 2nd Edition)

Abstract

:
Liver fibrosis is a major challenge to global health because of its various complications, including cirrhosis and hepatocarcinoma, while no effective treatment is available for it. Sappanone A (SA) is a homoisoflavonoid extracted from the heartwood of Caesalpinia sappan Linn. with anti-inflammatory and antioxidant properties. However, the effects of SA on hepatic fibrosis remain unknown. This study aimed to investigate the protective effects of SA on carbon tetrachloride (CCl4)-induced liver fibrosis in mice. To establish a liver fibrosis model, mice were treated intraperitoneally (i.p.) with CCl4 for 4 weeks. SA (25, 50, and 100 mg/kg body weight) was i.p. injected every other day during the same period. Our data indicated that SA decreased liver injury, fibrotic responses, and inflammation due to CCl4 exposure. Consistently, SA reduced oxidative stress and its-mediated hepatocyte death in fibrotic livers. Of note, SA could not directly affect the activation of hepatic stellate cells. Mechanistically, SA treatment lessened oxidative stress-triggered cell death in hepatocytes after CCl4 exposure. SA down-regulated the expression of M1 macrophage polarization markers (CD86 and iNOS) and up-regulated the expression of M2 macrophage polarization markers (CD163, IL-10, and Arg1) in livers and macrophages. Meanwhile, SA induced the activation of peroxisome proliferator-activated receptor gamma (PPARγ). However, decreased inflammatory responses and the trend of M2 macrophage polarization provided by SA were substantially abolished by SR202 (a PPARγ inhibitor) treatment in macrophages. Additionally, SA treatment promoted fibrosis regression. Taken together, our findings revealed that treatment with SA alleviated CCl4-induced fibrotic liver in mice through suppression of oxidative stress-mediated hepatocyte death and promotion of M2 macrophage polarization via PPARγ. Thus, SA might pave the way for a new hepatoprotective agent to treat liver fibrosis.

1. Introduction

Liver fibrosis is the outcome of dysregulated wound-healing responses due to a variety of chronic liver diseases, such as viral hepatitis, nonalcoholic steatohepatitis (NASH), alcohol-induced liver injury, cholestasis, drug-induced liver injury, and autoimmune hepatitis [1]. One of the main features of liver fibrosis is the accumulation of an extracellular matrix (ECM), such as collagen, in the subendothelial space. This sustained hepatic injury can be transformed into liver dysfunction and cirrhosis (the late and irreversible stage of hepatic fibrosis). Furthermore, liver fibrosis has been recognized as a pre-cancerous circumstance in that 60–80% of hepatocellular carcinoma (HCC) patients might have arisen from cirrhosis [2]. Moreover, liver fibrotic reactions are deeply united with the onset of many kinds of life-threatening complications, including varix, ascites, hepatic encephalopathy, hepatopulmonary hypertension, and renal failure [3]. Despite tremendous advances in anti-fibrotic therapy and fibrosis reversal in experimental research that have been developed within the past decades, liver transplantation is the main curative approach for patients with advanced hepatic fibrosis or cirrhosis. Hence, it is of great clinical significance to explore effective treatments based on understanding the pathophysiologic mechanism of hepatic fibrosis at mild and moderate phases due to its reversibility.
Carbon tetrachloride (CCl4) is commonly used to establish experimental animal liver fibrosis models because this animal model is highly accessible, reproducible, and appropriately reflects the mechanisms of human liver fibrosis/cirrhosis. CCl4 causes hepatocyte damage, liver inflammation, and liver fibrosis after 4 weeks of the challenge, and over 8 weeks, it causes liver cirrhosis. Furthermore, the CCl4-evoked murine liver fibrosis model is combined with the scarcity of bone marrow hemopoiesis indicated by damaged maturation of hemopoietic cells and a significant reduction in erythroid precursors and granulocyte-macrophage. Additionally, the CCl4 challenge induces harsh anemia, neutrophilia, lymphocytopenia, leucopenia, eosinophilia, and haemoglobinaemia, along with changes in plasma globulin and albumin [4]. Therefore, it is important to evaluate the cytotoxicity of potential anti-fibrotic drugs on hematopoietic indices in CCl4-challenged mice because the number of blood cells is indispensable for the homeostasis of immune systems, which contributes to identifying the end-point toxicity.
The pathophysiologic process that characterizes hepatic fibrotic responses is complicated, involving hepatocyte necroptosis, Kupffer cell (KC) activation and recruitment, and hepatic stellate cell (HSC) activation. During the early stages, long-term hepatic insults induce hepatocyte death, which triggers KC activation and stimulates the secretion of pro-inflammatory cytokines and pro-fibrogenic cytokines, such as transforming growth factor beta (TGF-β), which subsequently activates HSC in a paracrine manner. Furthermore, the apoptotic bodies released from damaged hepatocytes can directly activate HSC in myofibroblasts [5]. These cellular communications lead to the accumulation of extracellular matrix components, including collagen, thus resulting in hepatic fibrosis. In addition, hepatic inflammation, generating reactive oxygen species (ROS), and ROS-triggered oxidative stress contribute to the pathogenesis of the initiation and progression of liver fibrosis.
Peroxisome proliferator-activated receptor-γ (PPARγ) is known to be a ligand-dependent transcriptional regulator, which belongs to a superfamily of hormone nuclear receptors. It is well accepted that PPARγ has a variety of biological functions, including regulating lipid metabolism, HSC activation, macrophage polarization, and inflammatory responses [6]. A previous study reported that PPARγ sumoylation mediated by ligand binding reduces inflammation via transrepression of nuclear factor kappa B (NF-κB) target genes in macrophages [7]. Furthermore, PPARγ phosphorylation by c-Src represses macrophage activation and its related inflammatory reactions in adipose tissues [8]. Moreover, our previous studies have demonstrated that PPARγ activation promotes M2 polarization of hepatic macrophages, thus decreasing NASH-related inflammation, lipid accumulation, and liver fibrosis in mice [9]. Therefore, PPARγ has become a candidate target for treating inflammatory-related diseases, including colitis, atherosclerosis, and asthma [10,11,12]. Following other inflammatory diseases, inhibiting PPARγ by interleukin 2 or interferon-gamma in intrahepatic biliary epithelium exacerbated the progression of chronic cholangitis in a primary biliary cirrhotic murine model [13]. Similarly, in the CCl4-induced liver fibrosis model, PPARγ deletion in KC reveals pro-inflammatory and pro-fibrotic responses, while such impacts are not found in hepatocyte-specific PPARγ knock-out mice [14]. Consistently, adenovirus-mediated overexpression of PPARγ or treatment with rosiglitazone, a PPARγ agonist, alleviates inflammatory responses and liver fibrosis in a NASH murine model [15,16].
Natural products are a great source of candidate drugs to treat liver diseases. Various active compounds extracted from natural products exert inhibitory effects on KC or HSC activation characterized by decreased ECM deposition, thus having potential values to treat or prevent liver fibrosis [17]. Among many other phytochemicals, silymarin, curcumin, and resveratrol are the most extensively studied natural products with potential anti-fibrotic activity [18]. However, these therapeutic candidates for liver fibrosis have hit a bottleneck in clinical trials. Low water solubility and limited oral bioavailability due to poor enteral absorption (23–47%) and high first-pass metabolism in the liver hamper the use of silymarin in clinical trials [19]. Similar to silymarin, curcumin is characterized by low oral bioavailability [20]. In a randomized and double-blinded clinical trial in nonalcoholic fatty liver disease (NAFLD) patients, treating resveratrol orally for 12 weeks compared to placebo showed significantly decreased hepatic steatosis and inflammation, but did not affect liver fibrosis [20]. Therefore, more therapeutic candidates for treating liver fibrosis need to be investigated. Sappanone A (SA) is an active component extracted from the dry heartwood of Caesalpinia sappan Linn. SA has been reported to have various pharmacological effects, including antioxidative effects, anti-inflammatory effects, and anti-apoptotic effects [21,22]. A previous study has demonstrated that SA treatment decreased Lipopolysaccharide (LPS)-induced inflammatory responses by inhibiting NF-κB signaling in macrophages [23]. Similarly, recent studies reported that SA has anti-inflammatory effects in multiple chronic inflammatory diseases [24,25]. Based on the association between chronic inflammatory diseases and liver fibrosis, we hypothesized that SA might ameliorate the severity of liver fibrosis.

2. Materials and Methods

2.1. Plant Material

SA (CAS#102067-84-5) was purchased (Yuanye Bio-Technology Co., Ltd., Shanghai, China). High-performance liquid chromatography analysis was used to analyze SA quantitatively, and data showed a purity of more than 98%.

2.2. Animals

Seven-week-old male C57BL/6N mice (Cyagen Biosciences Inc., Guangzhou, China) were housed under a specific pathogen-free condition (12 h (h) light/dark cycle, 50 ± 5% relative humidity, between 22 and 26 °C) with free access to safe drinking water and food. All animal protocols are approved by the Laboratory Animal Research Center of Fujian Medical University (ethical code: FJMU IACUC 2021-J-0556).
To induce hepatotoxin-mediated liver fibrosis, mice were treated intraperitoneally (i.p., 2 mL/kg body weight) with CCl4 (2:5 v/v in corn oil, Sigma-Aldrich, St. Louis, MO, USA) or the equal volume of corn oil (Sigma-Aldrich) three times per week, for consecutive 4 weeks.
As shown in Table 1, a total of 72 mice were randomly divided into 8 groups. To estimate the impacts of SA on CCl4-induced liver fibrosis, mice in each group were treated with SA (25, 50, and 100 mg/kg body weight, i.p.) or an equal volume of vehicle every two days during the experiment.
As previously mentioned, with a slight modification (the resolution) [26], mice discontinued the toxin within the first 2 weeks after the CCl4 injection to establish the model of fibrosis resolution. During discontinuation of the toxin, mice were administrated with SA (100 mg/kg body weight, i.p.) or an equal volume of vehicle every two days (n = 6 mice/group). Animals fasted for 8 h before the necropsy. Tissues were collected with standard necropsy techniques for further analysis.

2.3. Biochemical Assays

To measure the severity of liver injury induced by hepatotoxin, alanine aminotransferase (ALT) and aspartate aminotransferase (AST) levels in serum were determined with assay kits purchased from Nanjing Bioengineering Institute (Nanjing, China).
Hepatic hydroxyproline contents, the important diagnostic indicator of the severity of fibrosis, were quantified with the hydroxyproline assay kit purchased from Nanjing Bioengineering Institute (Nanjing, China) according to the manufacturer’s instructions. An Emax Precision Microplate Reader (ThermoFisher Scientific Oy Ratastie, Vantaa, Finland) was used to detect the absorbance at 560 nm. Malondialdehyde (MDA), glutathione (GSH), and superoxide dismutase (SOD) levels in mice liver were measured by using the MDA assay Kit (S0131S, Beyotime, Shanghai, China), the GSH and GSSG quantification kit (S0053, Dojindo, Kumamoto, Japan), and the SOD kit (S0101S, Beyotime, Shanghai, China). MDA, a common marker of lipid peroxidation, can condense with thiobarbituric acid (TBA) to form red MDA-TBA adduct in acidic environments at 95 °C; detailed procedures were reported by Qinglei Xu et al. [27]. For GSH assay, as we described before [28], the detection principle is that GSH can react with the substrate DTNB to produce stable yellow TNB and GSSG. Principle of SOD detection kit is as follows: superoxide anion, produced by xanthine and xanthine oxidase reaction system, can reduce nitrogen blue tetrazole to produce blue methylate, which is absorbed in 560 nm; SOD can clear O2, thus inhibiting the formation of formazan [29].

2.4. Staining of Liver Sections

As previously described [30], liver tissues were fixed in 10% neutral buffered formalin for 48 h at room temperature, processed and embedded in paraffin, and then manually sliced to obtain 4 μm-thick paraffin sections. Hematoxylin and eosin (H&E) staining was used for morphological studies.
The intensity of hepatic necrosis was scored according to the extent of the lesion. Grade 0, no pathological change; Grade 1, rare necrotic lesions with the existence of degenerated hepatocytes; Grade 2, scattered necrotic hepatocytes; Grade 3, confluent necrosis; and Grade 4, severe damage.
Masson’s trichrome kit (G1340, Beijing Solarbio Science & Technology Co., Ltd., Beijing, China) and Sirius Red staining kit (BP-DL029, Nanjing SenBeiJia Biological Technology Co., Ltd., Nanjing, China) were used to evaluate the severity of liver fibrosis. The images of the liver section were produced using a light microscope (BX-51, Olympus Corp., Tokyo, Japan). The analysis and evaluation of all images were processed using Image J software (V1.8.0.112).
To explore cell death, terminal deoxynucleotidyl transferase-mediated dUTP nick end labeling (TUNEL) staining (Biotin TUNEL Assay Apoptosis Detection Kit, Life-iLab, Shanghai, China) was employed following the manufacturer’s protocol. The percentage of the TUNEL-positive cell in the entire field for 3 different visual fields was calculated using Image J software (V1.8.0.112).
F4/80, CD86, and CD163 positive cells were stained by using immunohistochemistry (IHC) to investigate macrophage infiltration in the livers of mice. The protocols were described in detail in our study [31].

2.5. Quantitative Real-Time Polymerase Chain Reaction (qRT-PCR)

FastPure® Cell/Tissue Total RNA Isolation Kit (Vazyme, Nanjing, China) and Trizol reagent were used to extract total RNA from liver tissues or cells, followed by the measurement of RNA concentrations. The HRbio™ III 1st Strand cDNA Synthesis Kit (OneStep gDNA Removal) for qRT-PCR was used to convert RNA into cDNA (Fujian Herui Biotechnology Co., Ltd., Fuzhou, China). A PCR Master Mix was utilized to perform qRT-PCR and evaluate the gene expression levels (HRF0032, HRbioTM qPCR SYBR Green Master Mix, Herui, Oklahoma City, OK, USA). The primer sequences employed in this study are listed in Table 2. Glyceraldehyde-3-phosphate dehydrogenase was applied to normalize the relative gene expression. The comparative CT method was used to calculate the relative gene expression.

2.6. Enzyme-Linked Immunosorbent Assay (ELISA)

ELISA kits were used to evaluate the levels of tumor necrosis factor-alpha (TNFα), interleukin 6 (IL-6), and interleukin 1 beta (IL-1β) in livers of mice (Invitrogen, Carlsbad, CA, USA) following the direction of the manufacturer, which measures inflammatory responses in livers of mice.

2.7. Cell Culture and Treatments

AML12 cells obtained from Procell Life Science&Technology Co., Ltd. (Wuhan, China) were seeded in a 12-well plate (5.0 × 10⁵ cells/well) and maintained in Dulbecco’s modified Eagle’s medium (DMEM; Hyclone, Logan, UT, USA) containing 100 IU/mL penicillin, 100 μg/mL streptomycin, and 10% fetal bovine serum (FBS), in a humidified incubator at 37 °C in 5% CO2.
RAW 264.7 cells obtained from Procell were seeded in a 12-well plate (1.0 × 10⁶ cells/well) and cultured in RPMI-1640 containing 100 IU/mL penicillin, 100 μg/mL streptomycin, and 10% FBS.
Human HSC line (LX-2) obtained from Procell was routinely cultured in a 12-well plate (1.0 × 10⁶ cells/well).
To examine the impacts of SA on hepatocytes, AML12 cells were incubated with 0.3% CCl4 with or without SA for 24 h. To investigate the roles of SA in HSCs, LX-2 cells were incubated with 10 ng/mL human recombinant TGF-β with or without SA for 24 h. To explore the effects of SA on inflammation, RAW 264.7 cells were incubated with the indicated concentrations of SA or vehicle for 24 h. Then, LPS (1 μg/mL) was used to induce inflammation in RAW 264.7 cells. SR202 was used to inhibit PPARγ. RAW 264.7 cells were incubated with 2 μM SR202 and/or 100 μM SA at 30 min and 1 h after LPS (1 μg/mL) treatment. The samples, including cells and supernatants, were collected at 24 h after treatments.

2.8. Lactate Dehydrogenase (LDH) Assay

The LDH assay kit was purchased from Nanjing Bioengineering Institute (Nanjing, China) to detect LDH released in the cell supernatant. An Emax Precision Microplate Reader was utilized to measure the absorbance at a wavelength of 490 nm.

2.9. Cell Viability Assay

Cells were seeded into a 96-well plate and routinely incubated. Then, cells were treated with indicated concentrations of SA with or without CCl4 for 24 h. The cell viability was determined using an MTT assay (M1020, Solarbio Science & Technology Co., Ltd., Beijing, China). The detection principle is that the succinate dehydrogenase in the mitochondria of living cells can reduce the exogenous MTT to the water-insoluble blue–violet crystal formazan and deposit it in the cells, while the dead cells have no such function. Dimethyl sulfoxide (DMSO) can dissolve the formazan in cells, and the light absorption value can indirectly reflect the number of living cells. The absorbance at a wavelength of 570 nm was quantified using the Emax Precision Microplate Reader.

2.10. Statistical Analysis

Statistical significance was determined using GraphPad Prism software (version 9.3); all results are displayed as the mean ± standard deviation (SD). By applying a one-way analysis of variance (ANOVA) and using Tukey’s post hoc testing, the significance of differences between multiple groups was compared. Different letters were used to show significant differences between groups. By applying a two-tailed Student’s t-test, the significance of differences between the two groups was compared. p values of <0.05 were regarded to be statistically significant.

3. Results

3.1. Treatment with SA Alleviates Chronic Liver Injury in Mice

Mice were administered with CCl4 (2:5 v/v in corn oil, 2 mL/kg, i.p.) or an equal volume of corn oil three times a week for 4 weeks (Figure 1A). The daily water and food intake in each group were monitored, but there was no significant difference among them (Supplementary Figure S1A,B). Also, the body weight and liver weight of each mouse were monitored (Figure 1B,C). The body weight of all experimental groups was increased on the final day compared to the initial day. Compared to the corn oil-treated mice, CCl4-injection decreased mouse body weights but increased liver weights, while SA treatment substantially reversed these effects. The ratio of liver weight/body weight (liver index) was dose-dependently restored in CCl4-treated mice after SA administration (Figure 1D). The possible effect of SA on liver function was assessed by collecting serum samples from mice and measuring serum levels of ALT and AST. We observed that SA at a high dose of 100 mg/kg significantly alleviated CCl4 injection-induced liver damage in mice (Figure 1E). Therefore, we chose 100 mg/kg SA for further studies and analysis. Similarly, reduced hepatic damage in the livers of SA-treated mice subjected to CCl4 was further confirmed by histopathologic examinations. In the CCl4-injected group, the structure of hepatic lobules was destroyed, the arrangement of the hepatic cell cord was chaotic, and the infiltration of inflammatory cells was increased. However, SA treatment markedly improved these effects (Figure 1F,G and Supplementary Figure S2). Additionally, the hepatic level of hydroxyproline, a collagen-related amino acid, was significantly decreased by SA treatment in fibrotic livers (Figure 1H). Collectively, we found that SA treatment could ameliorate CCl4-mediated chronic liver injury in mice.

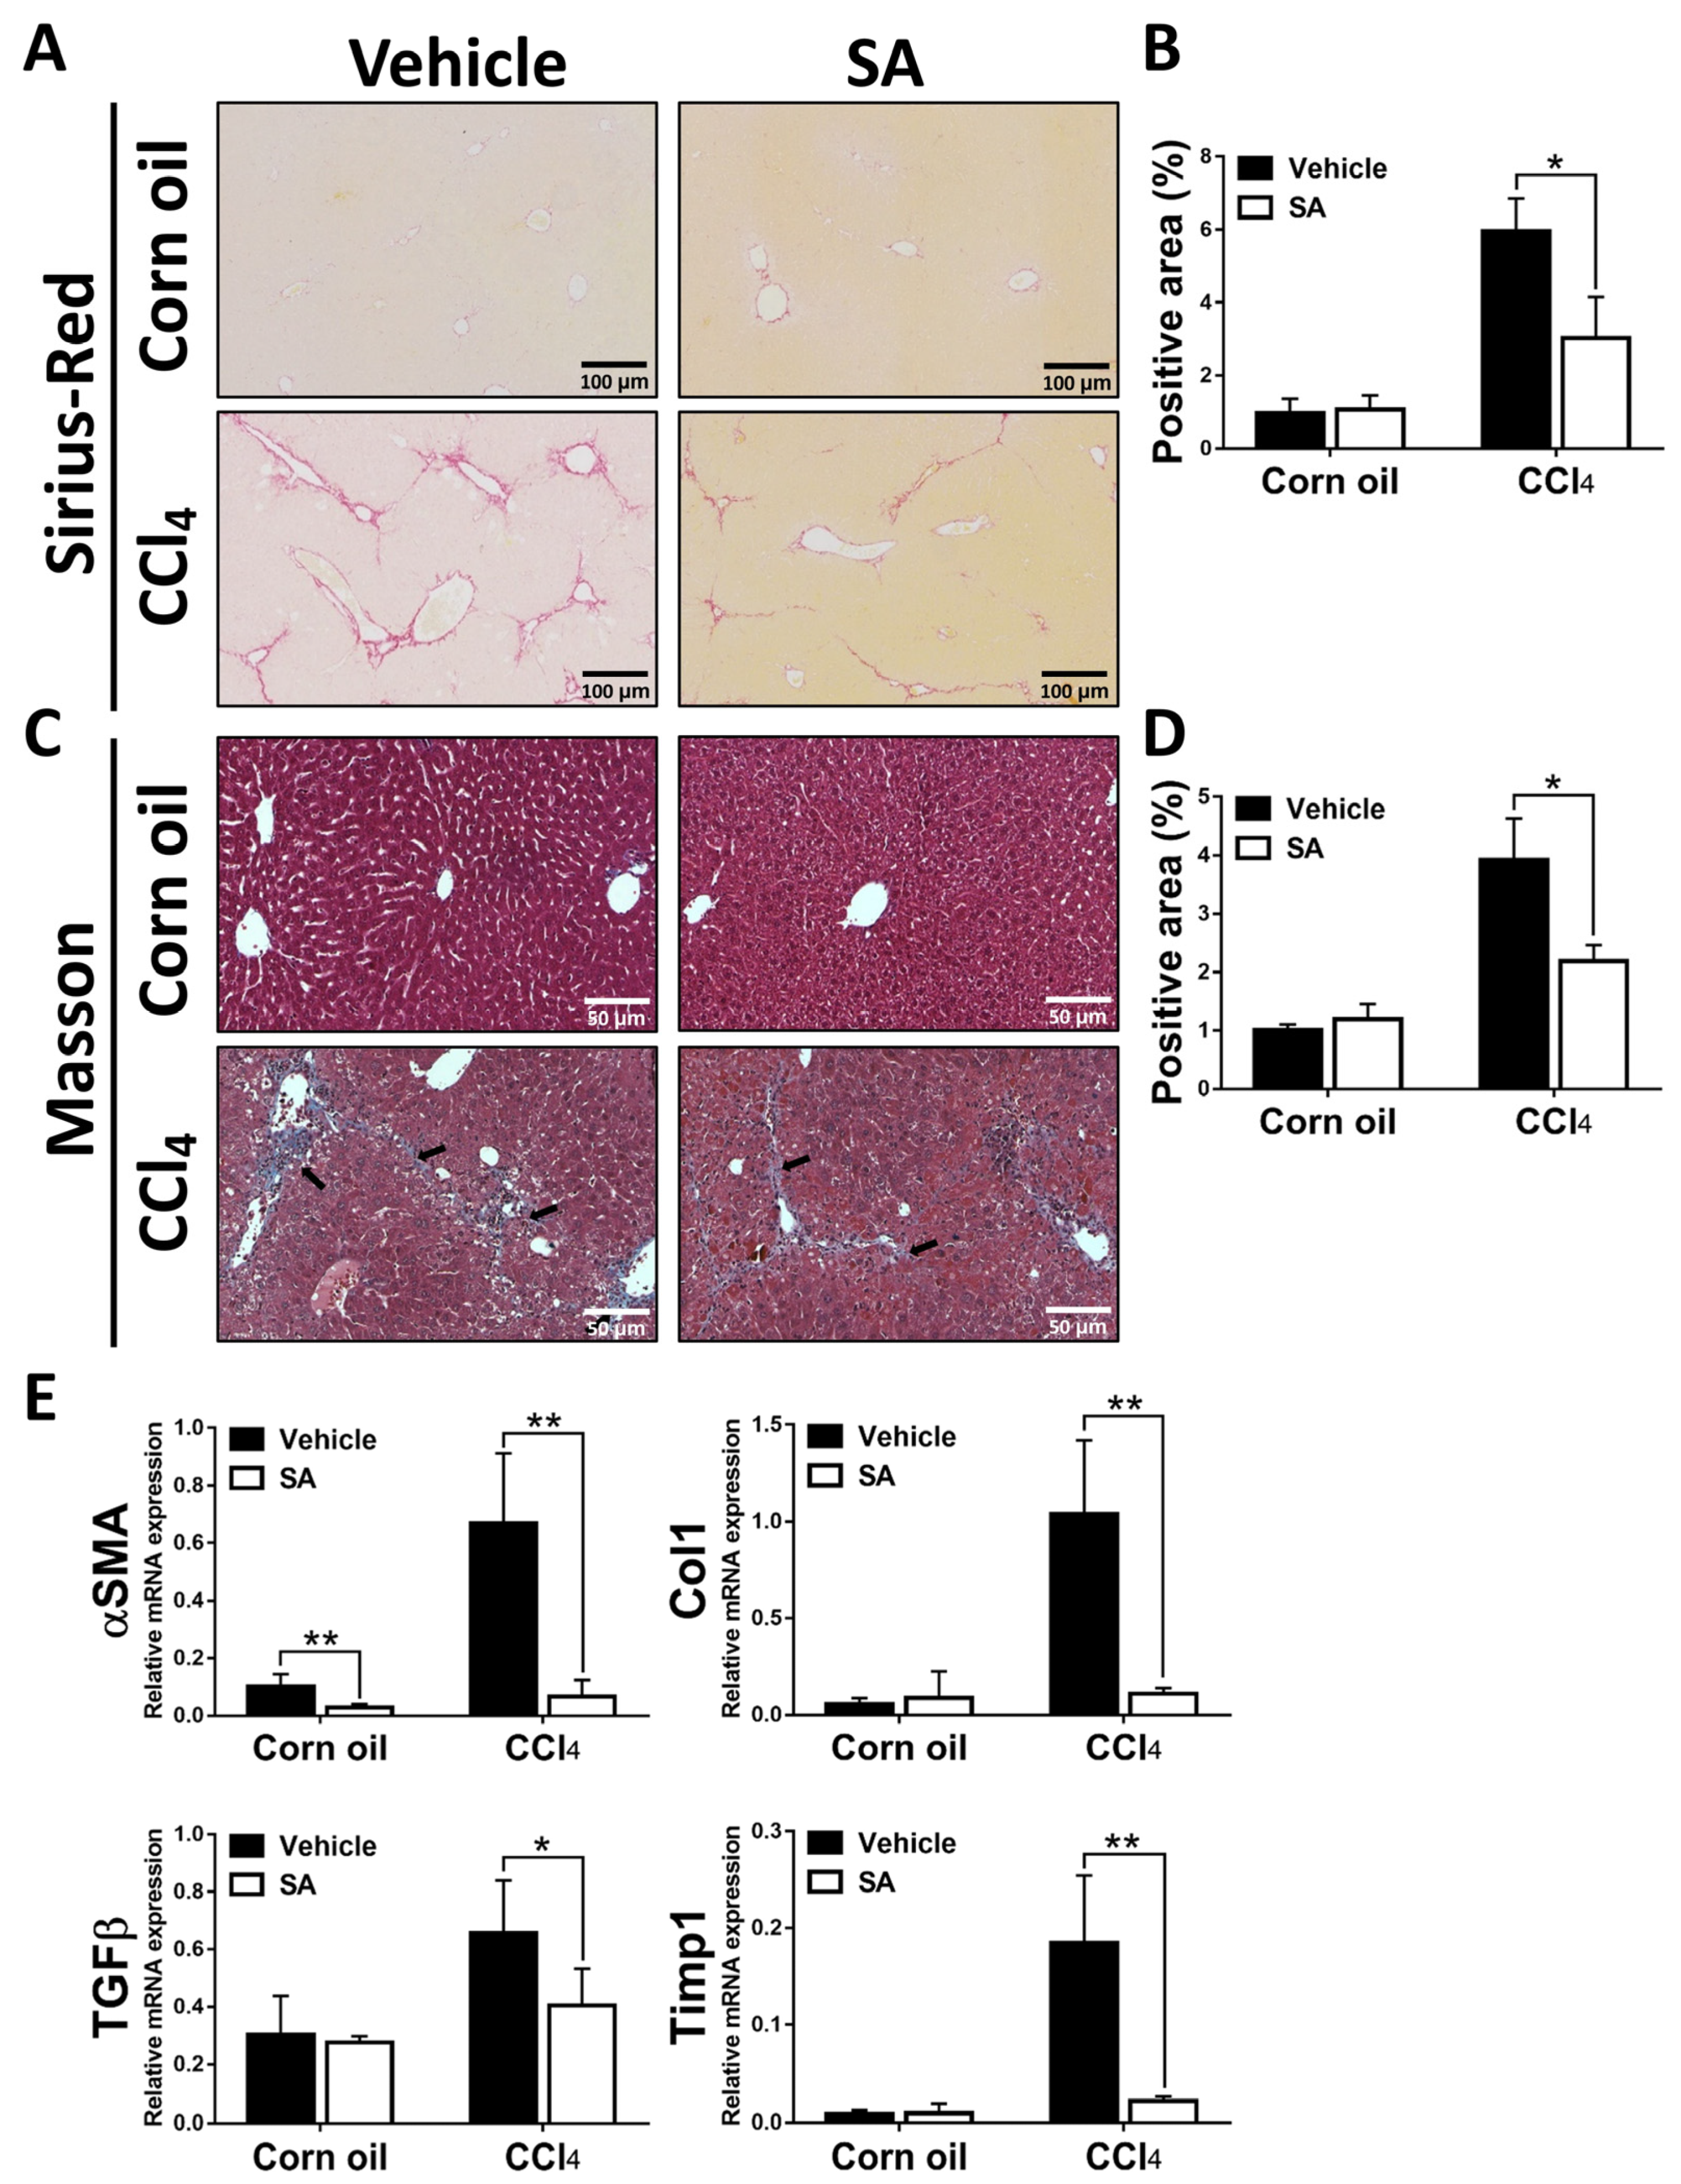
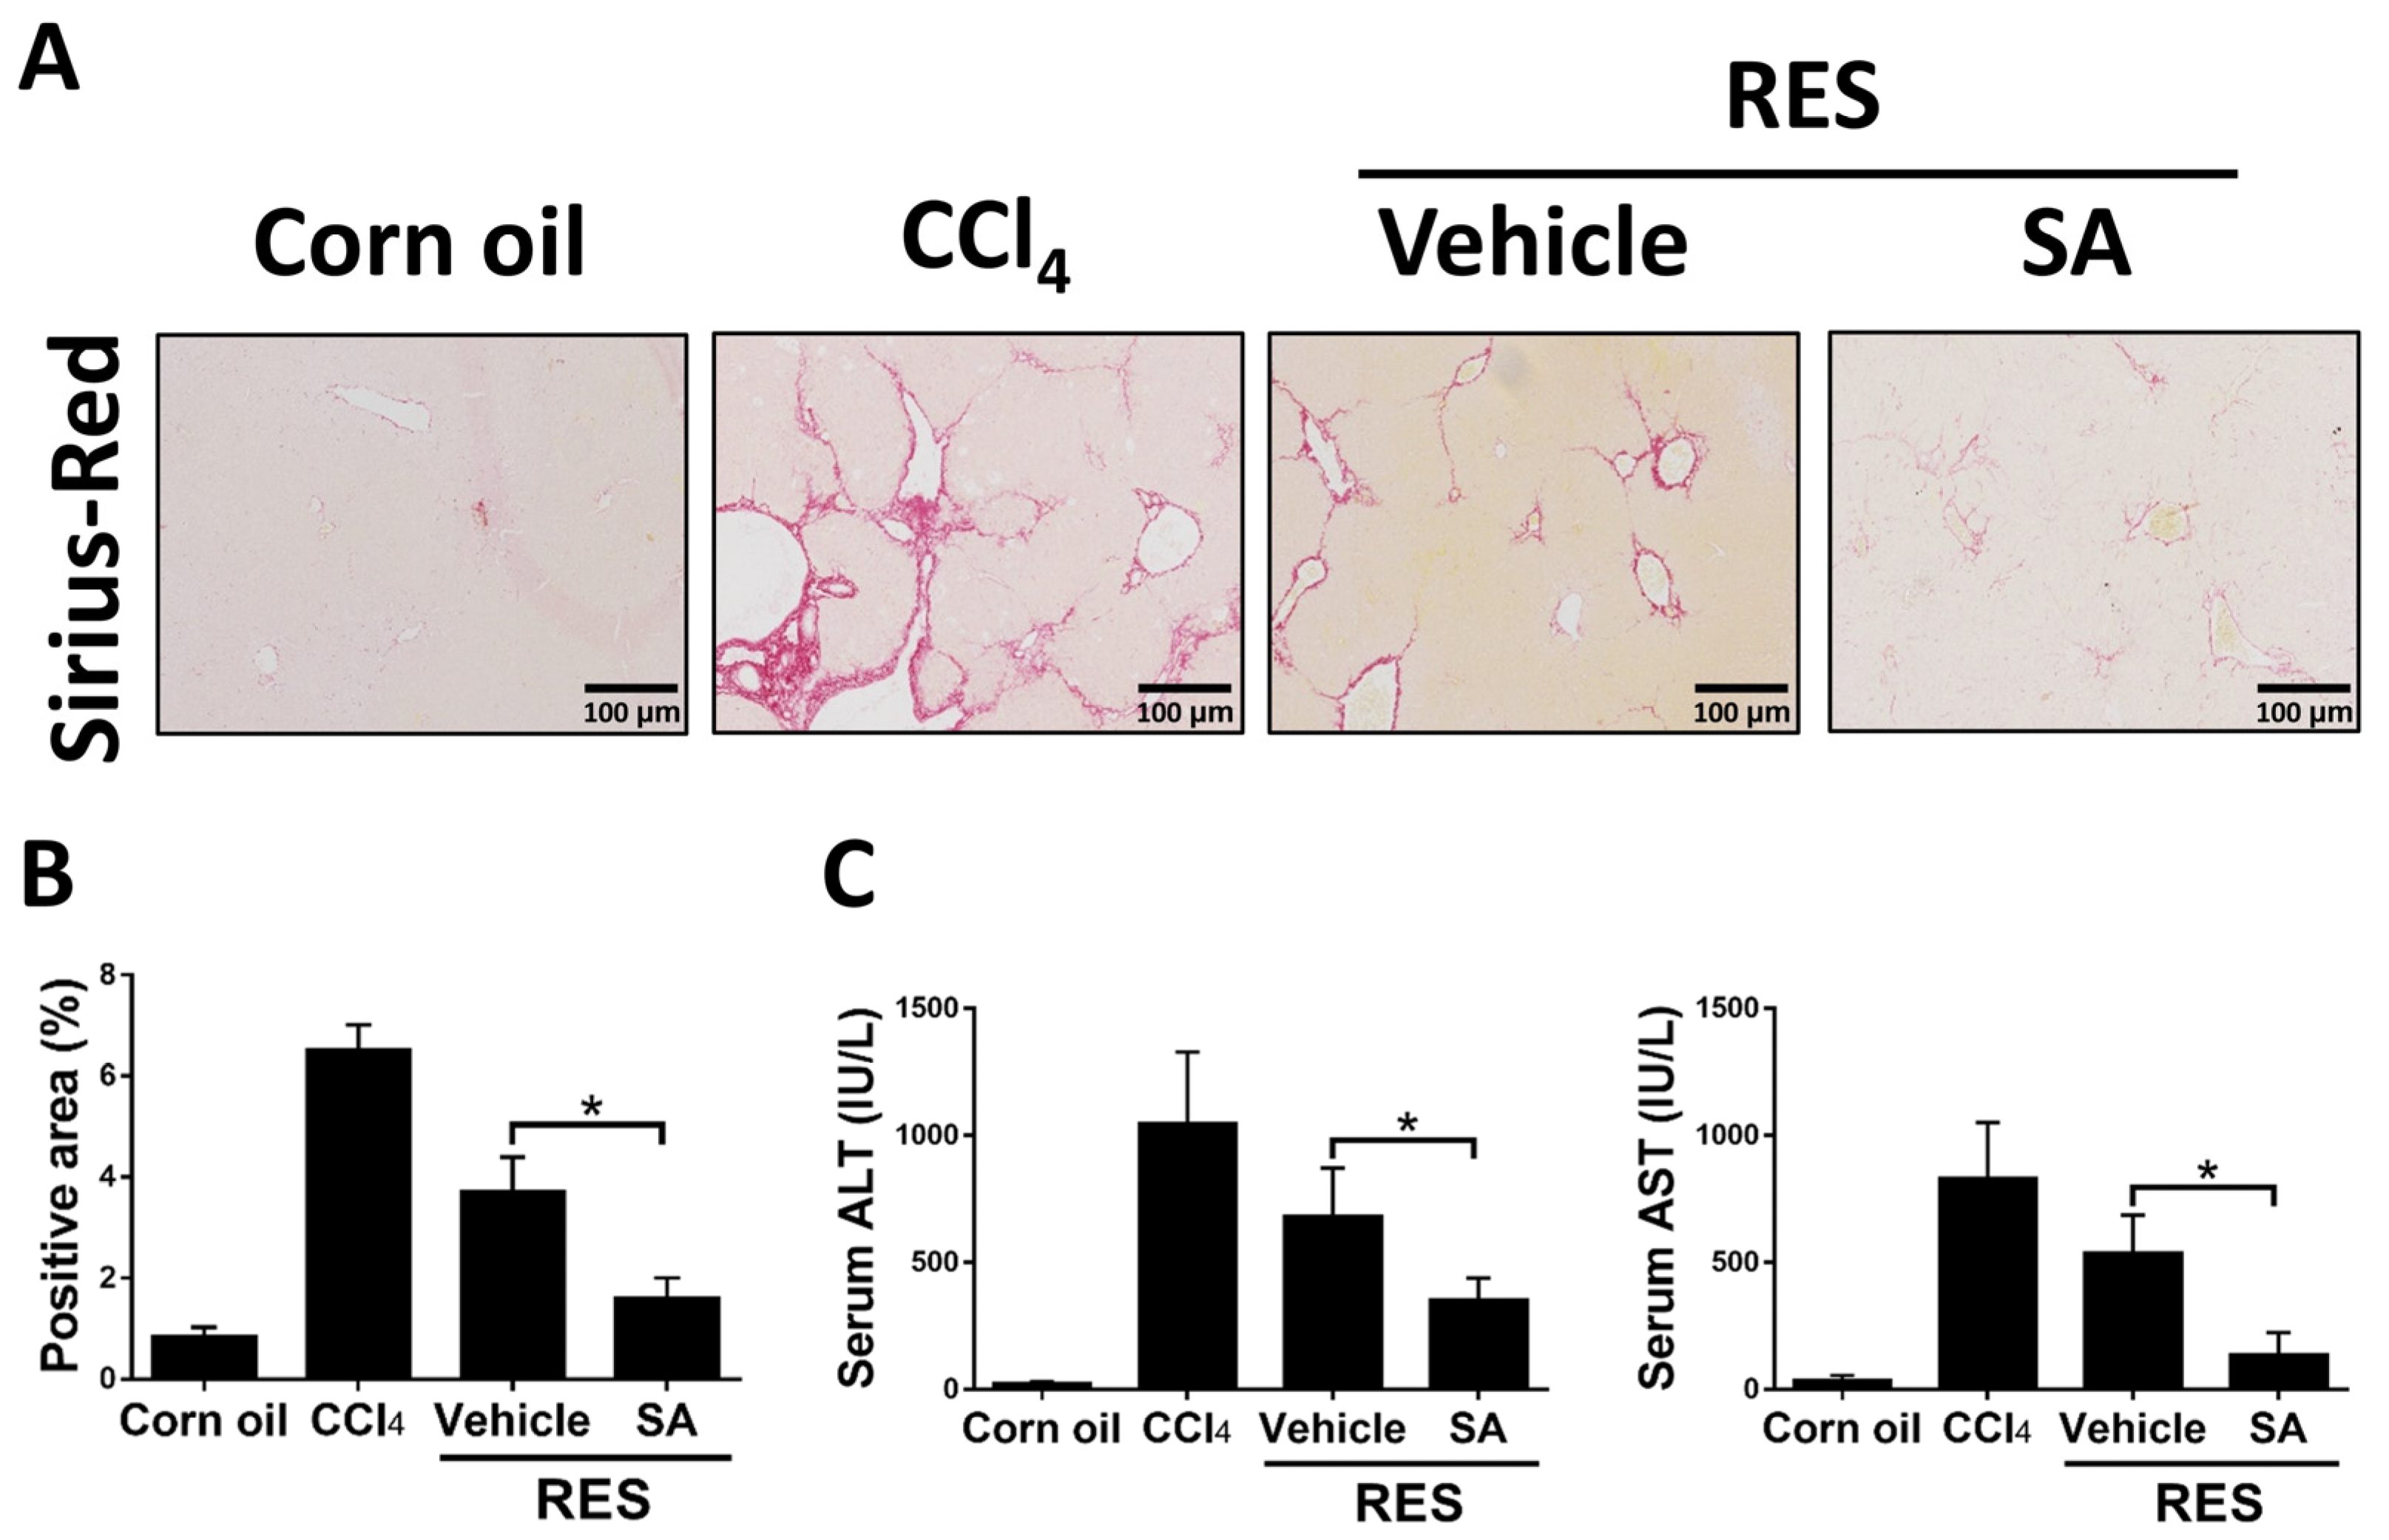
3.2. SA Treatment Ameliorates CCl4-Induced Liver Fibrosis in Mice

Next, we determined whether SA has anti-fibrotic effects on CCl4-induced liver fibrosis. As shown in Figure 2A–D, Sirius Red and Masson staining of liver sections showed that a significant improvement in liver fibrosis was found in SA-treated fibrotic mice compared with the vehicle-treated mice, leading to thinner and less pronounced fibrous septa with frequent perforation. Consistently, treatment of SA reduced the expression of profibrogenic genes in the livers of fibrotic mice, including Asma, TGFβ, Col1, and Timp1 (Figure 2E). Overall, SA has anti-fibrotic properties in CCl4-induced liver fibrosis.

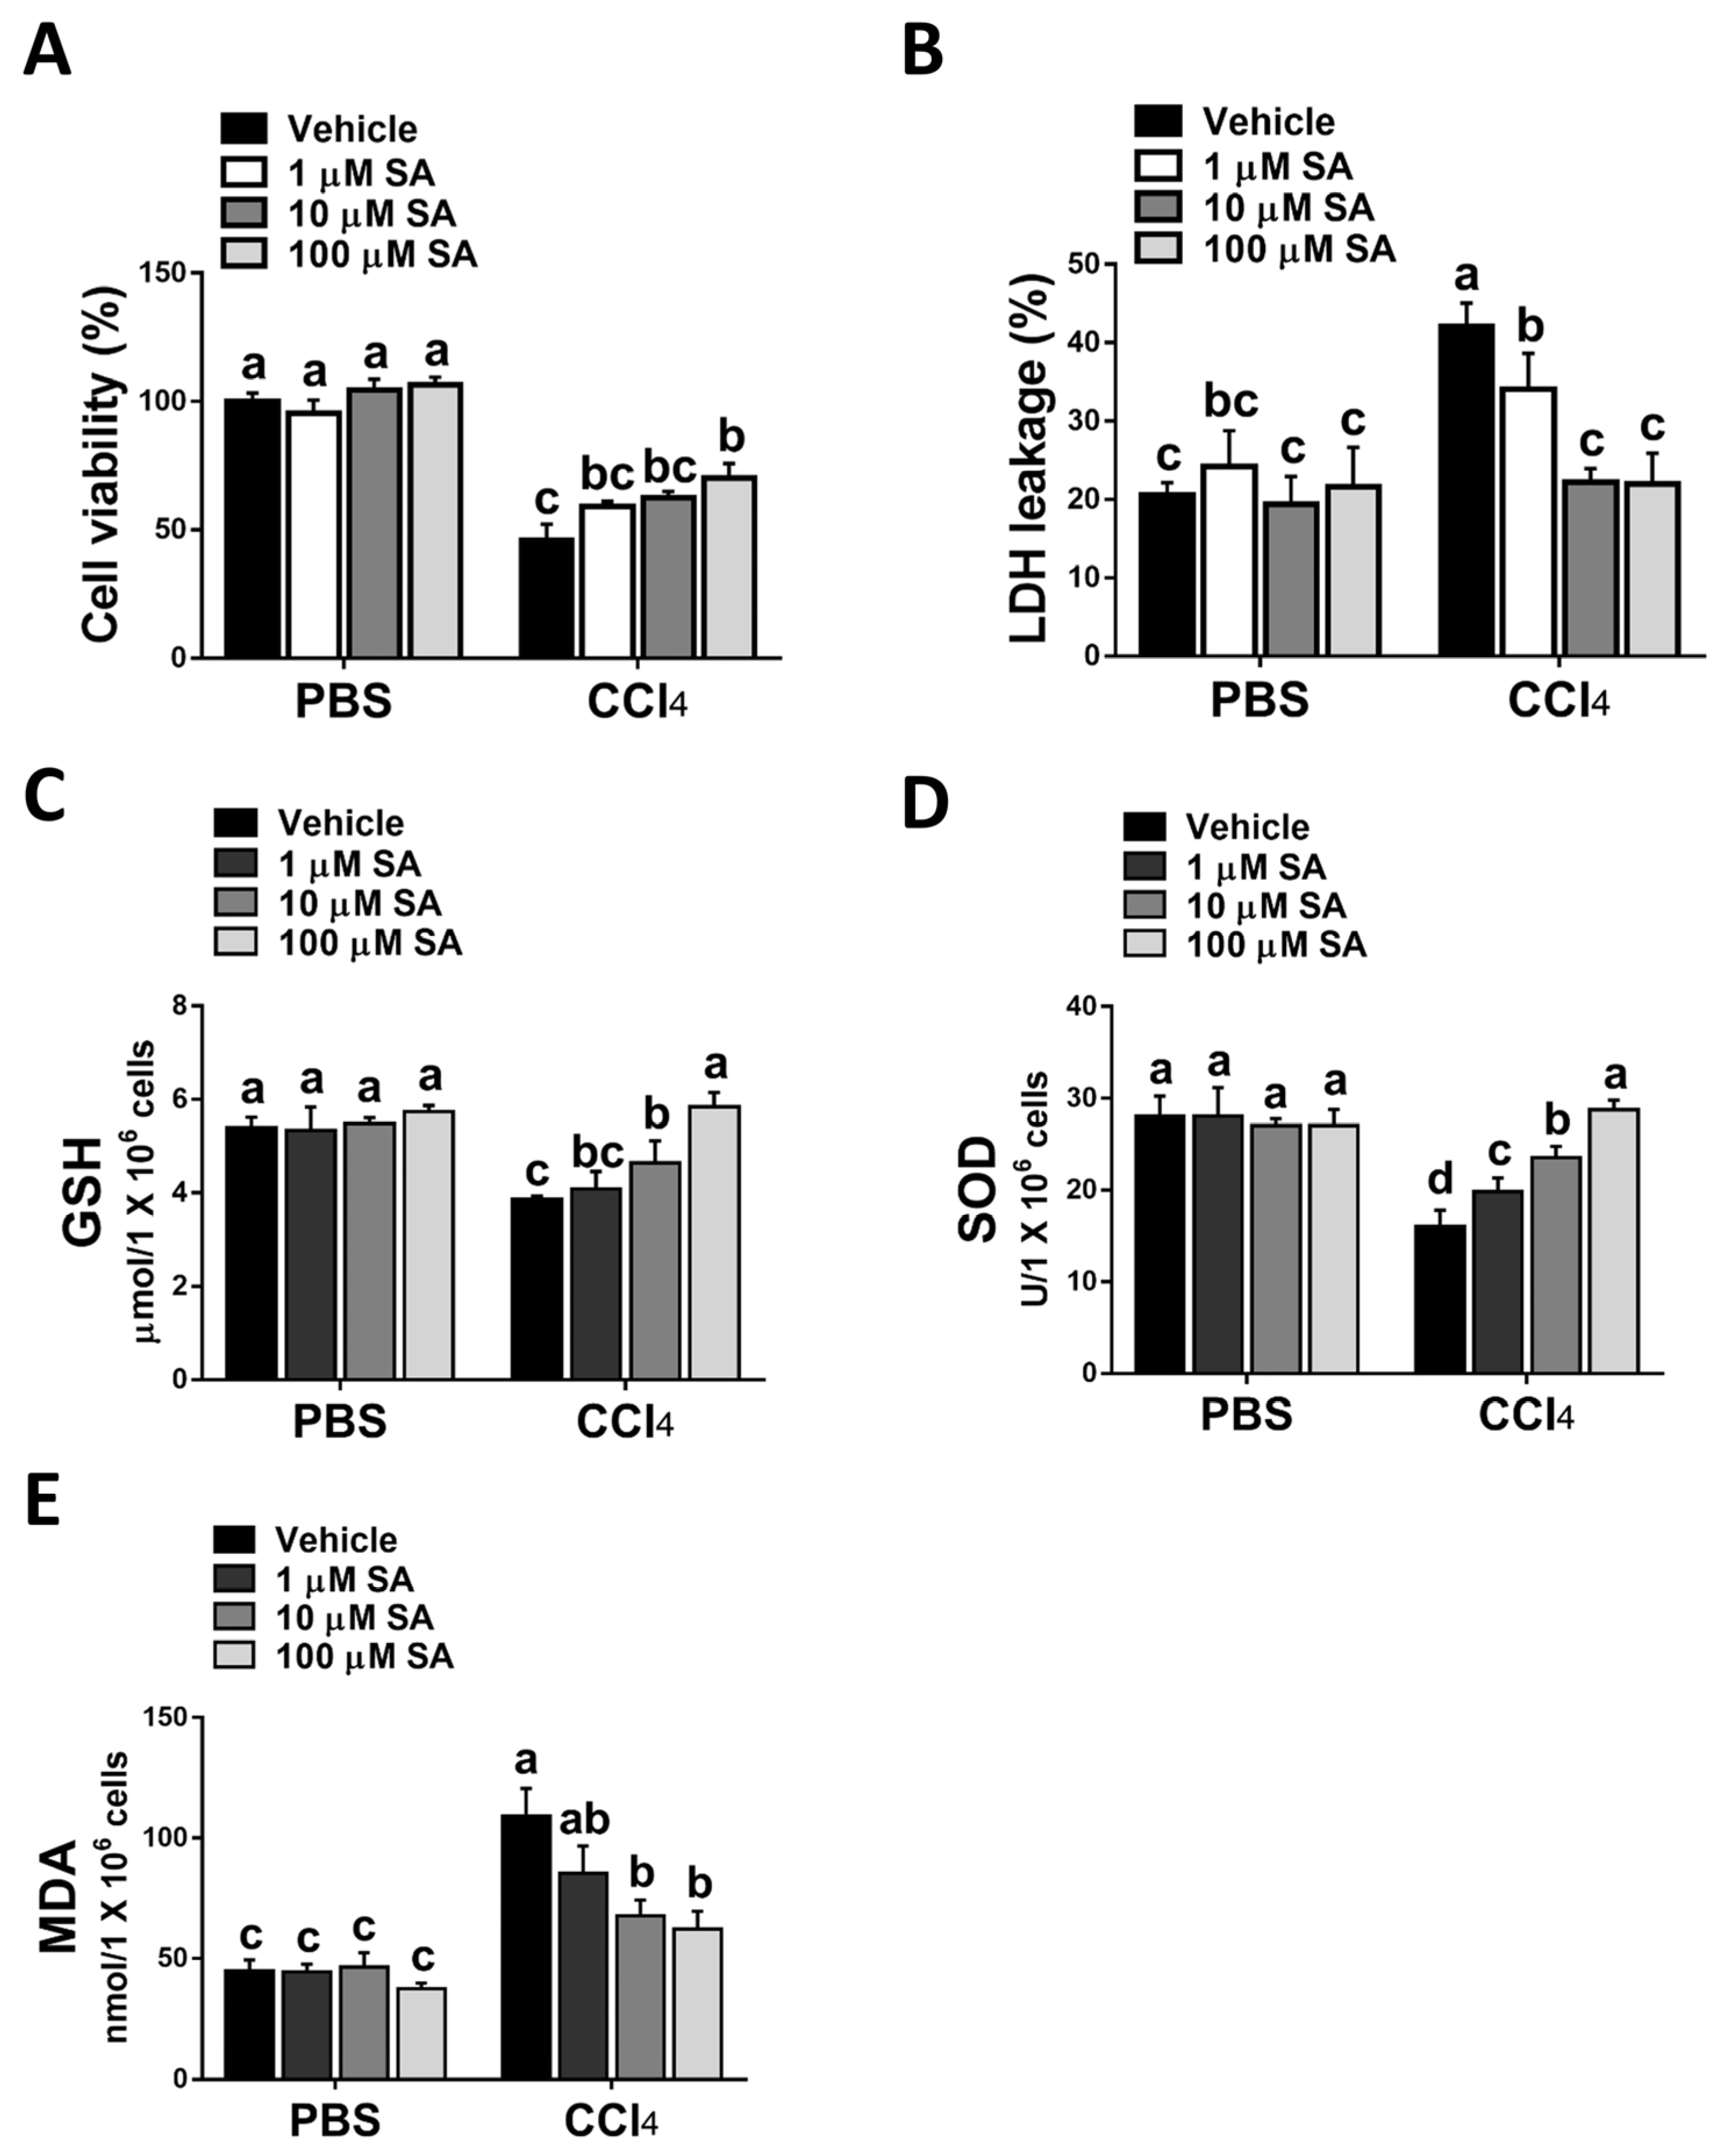
3.3. SA Protects Hepatocytes from Oxidative Stress Damage

The clinical and experimental data indicated that oxidative stress mediated the progression of liver fibrosis because continuous oxidative insults induce hepatocyte death, subsequently resulting in hepatic inflammation and fibrosis [32]. In this study, the data showed that SA treatment notably up-regulated hepatic levels of GSH and SOD and, in parallel, reduced MDA contents in fibrotic livers (Figure 3A–C). Consistently, the TUNEL assay and analysis of TUNEL-positive cells (Figure 3D,E) revealed that SA treatment significantly lessened CCl4-induced hepatocyte cell death. Also, SA down-regulated the expression level of Bax while SA up-regulated the expression level of Bcl2 in injured livers (Figure 3F).
Consistent with the in vivo study, SA treatment statistically attenuated CCl4 stimulation-mediated hepatocyte injury (Figure 4A,B). Parallelly, SA-treated hepatocytes revealed increased levels of GSH and SOD with a concurrent reduction in MDA level (Figure 4C–E).
Taken together, the data suggest that SA could protect hepatocytes from oxidative stress damage induced by CCl4.

3.4. SA Could Not Directly Affect HSC Activation

Since the activation of HSCs is a pivotal stage in the development of liver fibrosis, and our in vivo results showed that SA treatment reduces ECM accumulation in fibrotic livers, we next evaluated whether SA directly affects the activation of HSC. Unexpectedly, SA treatment could not affect the expression levels of fibrotic-related genes, including αSMA, Col1, and Timp1 in TGFβ-treated HSCs (Figure 5A). Furthermore, SA could not induce cell death of inactivated or activated HSCs (Figure 5B). Thus, our data indicated that SA could not directly affect HSC activation.

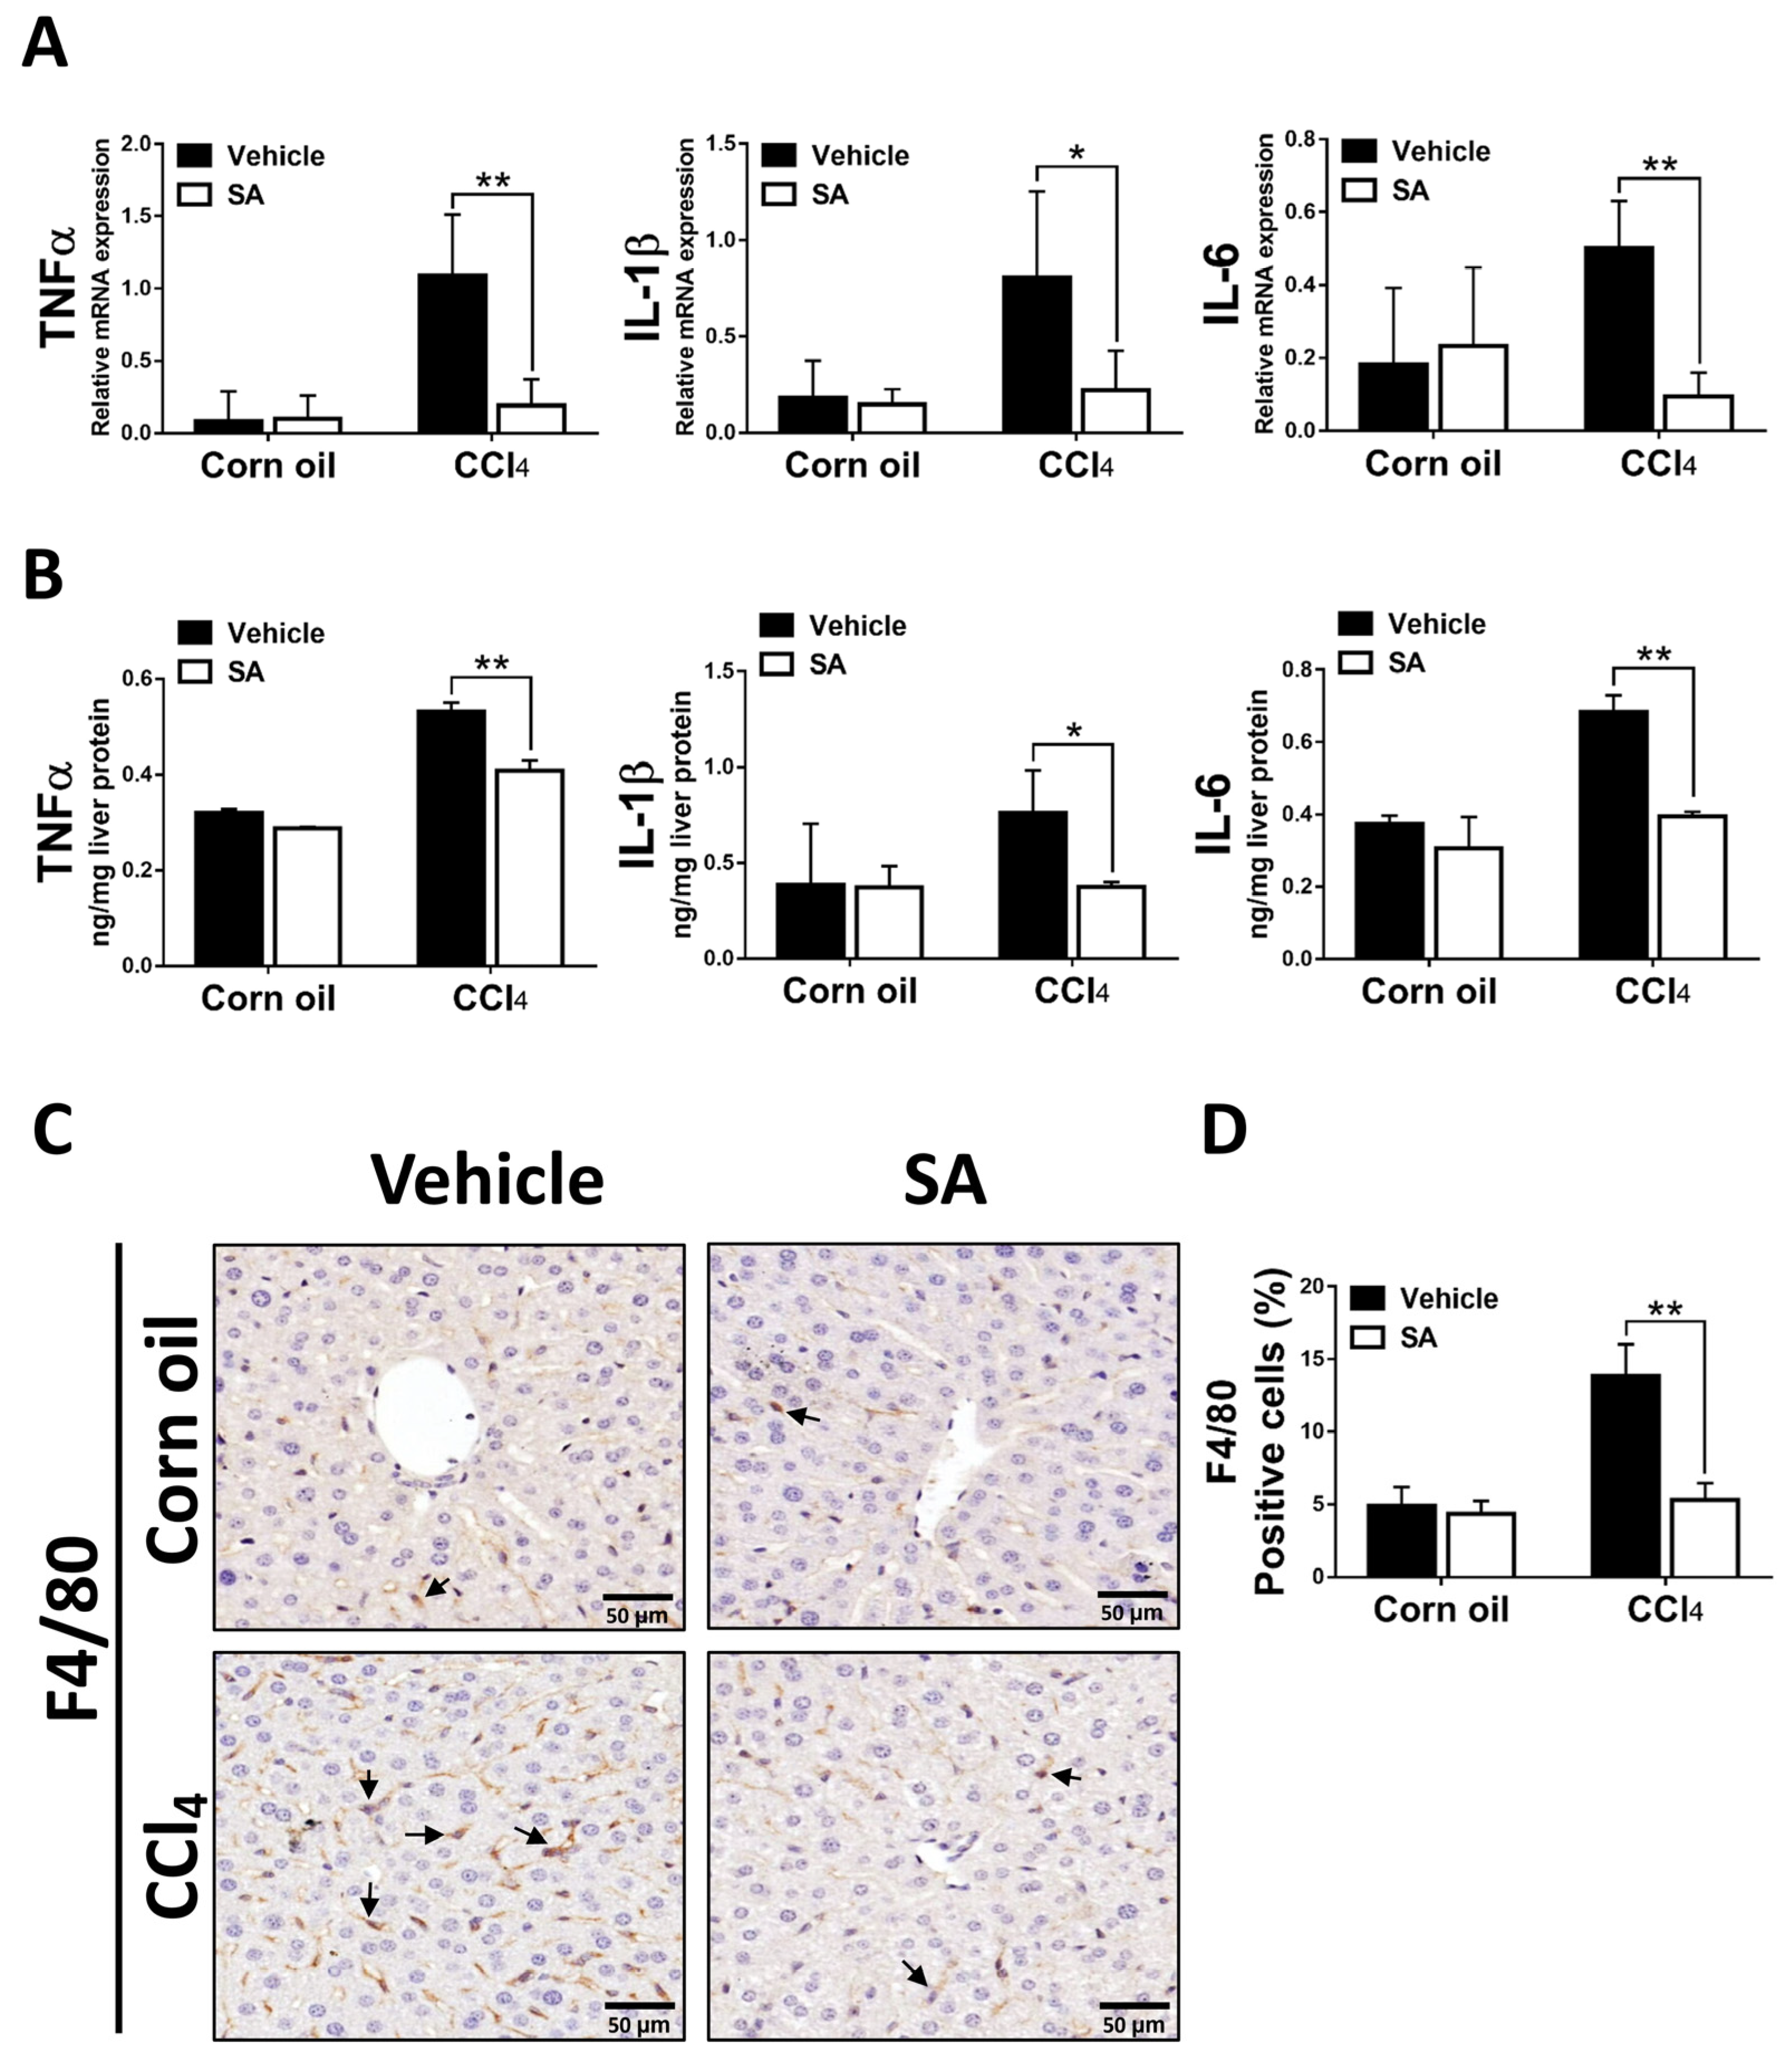
3.5. SA Decreases Hepatic Inflammatory Responses in Fibrotic Livers

Liver fibrosis is generally preceded by chronic inflammation, and continuous inflammatory responses drive the progression of liver fibrosis [33]. SA-provided effects on CCl4-evoked hepatic inflammation were evaluated as the expression of key pro-inflammatory cytokines and macrophage infiltration. As we expected, animals from the SA-treated group exhibited significantly decreased mRNA and protein levels of TNFα, as well as IL-1β and IL-6 (Figure 6A,B). In line with these results, treatment with SA reduced the infiltration of F4/80 positive macrophages in fibrotic livers. Altogether, the data suggest that SA treatment decreases the pro-inflammatory environment in the liver.

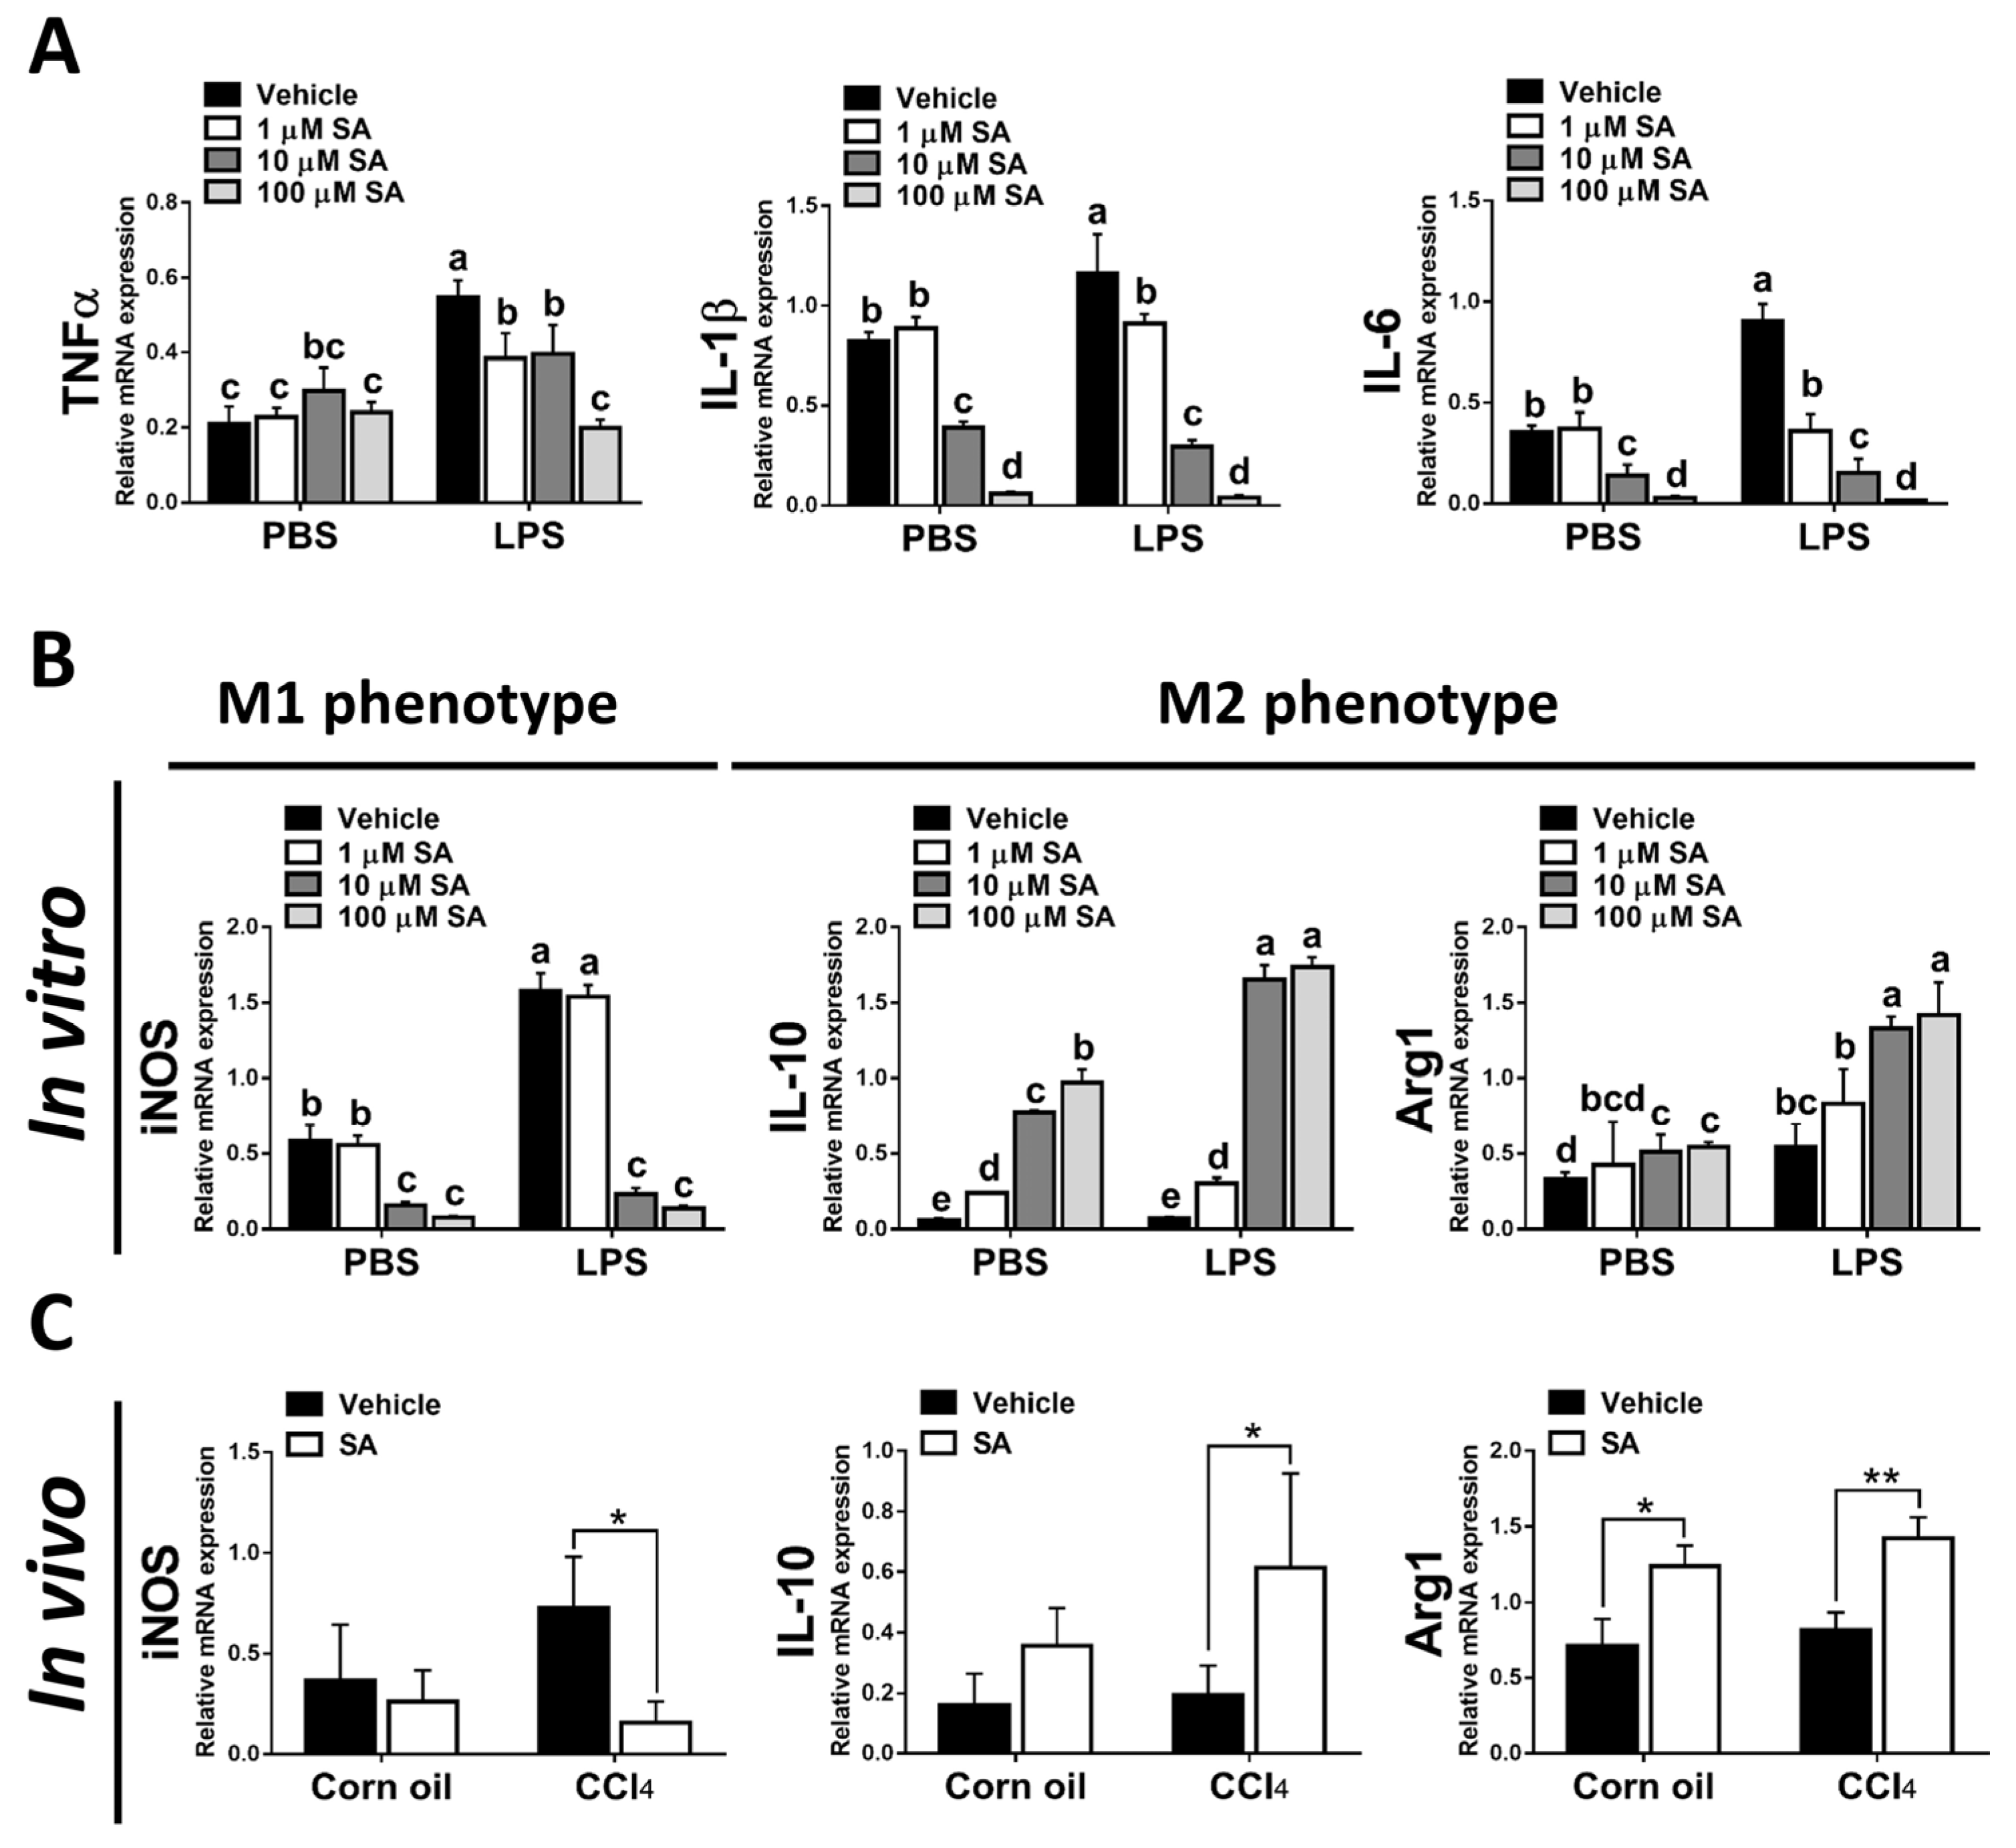
3.6. SA Could Inhibit Macrophage Activation and Promote Polarization of Macrophages towards the M2 Phenotype by Modulating PPARγ

It is well known that hepatic macrophages are activated in response to hepatocyte death, and M1 macrophage polarization plays a key role in the progression of liver fibrosis [34]. Therefore, we evaluated whether SA affects the activation of macrophages. Similar to in vivo results, treatment with SA markedly downregulated the mRNA expression of TNFα, IL-1β, and IL-6 in macrophages with or without LPS stimulation (Figure 7A), and the concentrations of SA used did not affect the cell viability (Supplementary Figure S3). It is well documented that macrophages stimulated with LPS undergo M1 polarization [35]. Consistently, LPS stimulation robustly increased the expression of nitric oxide synthase (iNOS, an M1 polarization marker) but diminished the mRNA expression of Interleukin 10 (IL-10) and arginase 1 (Arg1) (M2 polarization markers) in macrophages. After SA administration, reduced expression of iNOS and elevated expression of IL-10 were observed in macrophages with or without LPS stimulation, while increased expression of Arg1 was only found in LPS-treated macrophages (Figure 7B). Consistent with in vitro results, treatment with SA inhibited the M1 polarization marker and enhanced the M2 polarization markers in fibrotic livers (Figure 7C). Additionally, treatment with SA reduced the infiltration of CD86-positive macrophages (M1 macrophage polarization marker) and increased the infiltration of CD163-positive macrophages (M2 macrophage polarization marker) in fibrotic livers (Figure 7D–G).
Various transcription factors could control macrophage polarization. Accumulating studies have demonstrated that PPARγ, predominantly expressed in macrophages, is a marked feature of M2 macrophages [9]. Here, we found that SA treatment markedly up-regulated the expression of PPARγ in macrophages regardless of LPS stimulation (Figure 7H). A similar finding was found in the experiment in vivo; SA statistically enhanced the expression level of PPARγ in normal and fibrotic livers of mice (Figure 7I).
To confirm the PPARγ modulation by SA resulting in M2 polarization of macrophages, SR202, a selective PPARγ antagonist, was employed to inhibit the activity of PPARγ. Decreased expression of iNOS and increased expression of IL-10 and Arg1 by SA treatment were substantially abrogated by treatment with SR202 in macrophages, as displayed in Figure 8A. Similarly, decreased expression of pro-inflammatory cytokines by SA administration was reversed by SR202 treatment in macrophages (Figure 8B).
Taken together, our results indicated that SA inhibits macrophage activation and facilitates polarization of macrophages towards the M2 phenotype by modulating PPARγ.

3.7. Treatment with SA Promotes Fibrosis Regression

Since the above results showed that SA restrained the progression of hepatic fibrosis, we explored the effects of SA on fibrosis resolution by injecting with CCl4 for 4 weeks, followed by treating SA (100 mg/kg) for 2 weeks (RES group; total 6 weeks). Compared with the 4-week CCl4-injected group, Sirius Red staining showed that the RES group showed significantly decreased hepatic fibrosis and that such effects were further accelerated by treatment with SA (Figure 9A,B). Furthermore, treatment with SA markedly reduced serum ALT and AST levels in mice during fibrosis regression (Figure 9C). Collectively, the data indicate that SA can assist in the resolution of liver fibrosis in mice.

4. Discussion

In developed countries, the main causes of human death include cardiovascular disease, cancer, Alzheimer’s disease, chronic obstructive pulmonary disease, and diabetes [36,37], and 45% of these disease deaths recently are closely related to chronic fibroproliferative diseases [38]. In the liver, several chronic liver diseases are always indiscoverable without significant clinical symptoms until they progress to cirrhosis with portal hypertension and other complications, including ascites, bleeding varix, or even HCC [39,40]. During the progression of liver fibrosis, different hepatic cell types undergo impaired changes such as hepatocyte death, inflammatory cell recruitment and activation, and HSC activation [41]. Therefore, depressing or decelerating these pathological phenomena could be a potential therapeutic strategy for treating liver fibrosis. In the current study, we provided evidence that treatment with SA ameliorates CCl4-induced liver fibrosis, at least in part by modulating M1/M2 macrophage polarization via activating PPARγ and by inhibiting oxidative stress-induced hepatocyte cell death in mice.
Activated HSCs critically contribute to the pathogenesis of hepatic fibrosis. Stimulated by liver damage, HSCs differentiate into activated myofibroblasts and synthesize and deposit fibrillar collagen, ultimately leading to hepatic fibrosis. Therefore, restraining HSC activation has been considered a potential strategy for treating liver fibrosis. However, in the current study, data showed that treatment with SA did not directly affect the activation of HSCs (Figure 5). Of interest, inconsistent with our finding, a previous study has reported that the ethanol extract mixture of Caesalpinia sappan L. significantly increased fibroblast proliferation and collagen production in mouse fibroblast L929 cells [42]. Conversely, Brazilin, an extract of Caesalpinia sappan L., decreased collagen synthesis in a murine model of rheumatoid arthritis [43]. These studies and our findings suggest that several extracts from Caesalpinia sappan L. could regulate the activation of HSCs differently. Our data showed that SA reduced oxidative stress-mediated hepatocyte death and hepatic inflammation in CCl4-treated mice. Therefore, we suspected that SA treatment alleviated CCl4-induced fibrotic liver in mice through the regulation of macrophages and suppression of hepatocyte death.
During the development of liver fibrosis, macrophages are promptly activated in response to hepatocyte injury by recognizing dying cell-released damage-associated molecular patterns, subsequently secrete several inflammatory mediators, and finally recruit other immune cells into the damaged areas in the liver [44]. Hepatic macrophages with high functional plasticity have multiple roles in maintaining liver homeostasis, cytokine production, and tissue remodeling [45]. It is commonly accepted that resident hepatic macrophages are heterogeneous. Macrophages can undergo classically activated M1 polarization (pro-inflammatory) or alternatively activated M2 polarization (anti-inflammatory) in response to microenvironment cues. Recent studies suggest that macrophages switched to the M1 phenotype exert pro-inflammatory as well as pro-fibrogenic roles in the pathogenesis of liver fibrosis [46,47,48], while macrophages polarized to M2 phenotype responding to the stimulation of IL-4 or IL-13 attenuate the progression of liver fibrosis [49,50]. Hence, M1/M2 macrophage polarization provides an insight into the mechanisms regulating the resolution or progression of liver fibrosis. In general, M2 macrophage polarization is regulated by PPARγ, interferon-regulatory factor (IRF) 4, and signal transducer and activator of (IRF) 5 and transcription (STAT) 6, while STAT1 mediates M1 macrophage activation (Martinez and Gordon, 2014). PPARγ, mainly expressed by hepatic macrophages, interferes with liver fibrosis progression by regulating macrophage polarization [51]. Additionally, activated PPARγ inhibits liver fibrosis-related inflammatory responses by increasing M2 macrophage polarization [52,53]. In parallel, our results show that treatment with SA increased PPARγ activation in macrophages but not in hepatocytes and HSCs and enhanced M2 macrophage polarization that was substantially abolished by SR202 treatment. Therefore, SA-mediated PPARγ activation and M2 macrophage polarization could assist in the amelioration of CCl4-induced hepatic fibrosis.
In addition to macrophages, hepatocyte death could directly and indirectly activate HSCs. These cellular communications promote extracellular matrix component accumulation and induce hepatic fibrosis. In this study, the result showed that SA treatment reduced oxidative stress-induced hepatocyte cell death in CCl4-treated AML12 hepatocytes. This result suggests that SA ameliorates CCl4-induced liver fibrosis at least by inhibiting oxidative stress-induced hepatocyte cell death in mice. However, the mechanism of SA-provided protection in hepatocytes needs to be further explored in future studies. The current study also has other limitations. Firstly, CCl4 and SA were given intraperitoneally. Although the two chemicals were not injected on the same day, we are still not sure if the observed hepatoprotective effects of SA come from the pharmacological effects of SA itself or if the chemical reaction between CCl4 and SA diluted the liver damage caused by CCl4. Furthermore, although the hematological toxicity observed by peripheral cell counting is not competent in figuring out the alterations in quality and quantity of precursor cells in the bone marrow and reflecting toxicity to more mature hemopoietic tissue [54], it is important to investigate the short-term and long-term toxic effects of SA on the hematopoietic system, especially on erythropoiesis and leukopoiesis, complete blood counting, and renal function. Because the number of blood cells is indispensable to the complete functioning of the immune system, it facilitates deciding the end-point toxicity. However, we did not collect such data in the mice experiment. Thus, further study should solve these issues.

5. Conclusions

This study demonstrated that treated SA alleviates CCl4-induced hepatic fibrosis in mice. This result could be ascribed to the activation of PPARγ and the subsequent modulation of M1/M2 polarization. Inhibition of M1 macrophages blocks the hepatic inflammatory response, thereby reducing the activation of HSCs into myofibroblasts and diminishing collagen deposition. Also, suppression of oxidative stress-mediated hepatocyte death mediates SA-provided protective effects. Therefore, SA may be a novel therapeutic candidate for combating liver fibrosis.

Supplementary Materials

The following supporting information can be downloaded at https://www.mdpi.com/article/10.3390/antiox12091718/s1. Figure S1. The daily intake of food and water on the initial day and final day; Figure S2. The liver damage was assessed by H&E staining. Original magnification: ×200; Figure S3. The cell viability was examined by an MTT assay.

Author Contributions

Conceptualization, Z.Z. and J.Q.; investigation, J.Q. and L.L.; formal analysis, X.Y. and W.H.; writing—original draft, J.Q. and L.L.; writing—review and editing, J.Q. and Z.Z.; funding acquisition, J.Q. and Z.Z. All authors have read and agreed to the published version of the manuscript.

Funding

This work was supported by grants from the National Natural Science Foundation of China (82200663, 82200634) and by a grant from the Natural Science Foundation of Fujian Province (2022J01199, 2022J01200).

Institutional Review Board Statement

Not applicable.

Informed Consent Statement

Not applicable.

Data Availability Statement

All data are included in this manuscript.

Conflicts of Interest

The authors declare no conflict of interest.

References

  1. Kisseleva, T.; Brenner, D. Molecular and cellular mechanisms of liver fibrosis and its regression. Nature reviews. Gastroenterol. Hepatol. 2021, 18, 151–166. [Google Scholar] [CrossRef]
  2. Bosch, F.X.; Ribes, J.; Borràs, J. Epidemiology of primary liver cancer. Semin. Liver Dis. 1999, 19, 271–285. [Google Scholar] [CrossRef]
  3. Boyer-Diaz, Z.; Aristu-Zabalza, P.; Andrés-Rozas, M.; Robert, C.; Ortega-Ribera, M.; Fernández-Iglesias, A.; Broqua, P.; Junien, J.L.; Wettstein, G.; Bosch, J.; et al. Pan-PPAR agonist lanifibranor improves portal hypertension and hepatic fibrosis in experimental advanced chronic liver disease. J. Hepatol. 2021, 74, 1188–1199. [Google Scholar] [CrossRef]
  4. Shvarts, Y.S.; Zubakhin, A.A.; Dushkin, M.I. Suppression of hemopoiesis during CCl4-induced hepatic fibrosis: Role of systemic endotoxemia. Bull. Exp. Biol. Med. 2000, 130, 759–762. [Google Scholar] [CrossRef]
  5. Sirica, A.E.; Gores, G.J.; Groopman, J.D.; Selaru, F.M.; Strazzabosco, M.; Wang, X.W.; Zhu, A.X. Intrahepatic Cholangiocarcinoma: Continuing Challenges and Translational Advances. Hepatology 2019, 69, 1803–1815. [Google Scholar] [CrossRef]
  6. Wagner, K.D.; Wagner, N. Peroxisome proliferator-activated receptor beta/delta (PPARbeta/delta) acts as regulator of metabolism linked to multiple cellular functions. Pharmacol. Ther. 2010, 125, 423–435. [Google Scholar] [CrossRef]
  7. Pascual, G.; Fong, A.L.; Ogawa, S.; Gamliel, A.; Li, A.C.; Perissi, V.; Rose, D.W.; Willson, T.M.; Rosenfeld, M.G.; Glass, C.K. A SUMOylation-dependent pathway mediates transrepression of inflammatory response genes by PPAR-gamma. Nature 2005, 437, 759–763. [Google Scholar] [CrossRef]
  8. Choi, S.; Jung, J.E.; Yang, Y.R.; Kim, E.S.; Jang, H.J.; Kim, E.K.; Kim, I.S.; Lee, J.Y.; Kim, J.K.; Seo, J.K.; et al. Novel phosphorylation of PPARγ ameliorates obesity-induced adipose tissue inflammation and improves insulin sensitivity. Cell. Signal. 2015, 27, 2488–2495. [Google Scholar] [CrossRef]
  9. Kim, J.W.; Zhou, Z.; Yun, H.; Park, S.; Choi, S.J.; Lee, S.H.; Lim, C.W.; Lee, K.; Kim, B. Cigarette smoking differentially regulates inflammatory responses in a mouse model of nonalcoholic steatohepatitis depending on exposure time point. Food Chem. Toxicol. 2020, 135, 110930. [Google Scholar] [CrossRef]
  10. Li, M.; Pascual, G.; Glass, C.K. Peroxisome proliferator-activated receptor gamma-dependent repression of the inducible nitric oxide synthase gene. Mol. Cell. Biol. 2000, 20, 4699–4707. [Google Scholar] [CrossRef]
  11. Odegaard, J.I.; Ricardo-Gonzalez, R.R.; Goforth, M.H.; Morel, C.R.; Subramanian, V.; Mukundan, L.; Red Eagle, A.; Vats, D.; Brombacher, F.; Ferrante, A.W.; et al. Macrophage-specific PPARgamma controls alternative activation and improves insulin resistance. Nature 2007, 447, 1116–1120. [Google Scholar] [CrossRef]
  12. Norris, A.W.; Chen, L.; Fisher, S.J.; Szanto, I.; Ristow, M.; Jozsi, A.C.; Hirshman, M.F.; Rosen, E.D.; Goodyear, L.J.; Gonzalez, F.J.; et al. Muscle-specific PPARgamma-deficient mice develop increased adiposity and insulin resistance but respond to thiazolidinediones. J. Clin. Investig. 2003, 112, 608–618. [Google Scholar] [CrossRef]
  13. Harada, K.; Isse, K.; Kamihira, T.; Shimoda, S.; Nakanuma, Y. Th1 cytokine-induced downregulation of PPARgamma in human biliary cells relates to cholangitis in primary biliary cirrhosis. Hepatology 2005, 41, 1329–1338. [Google Scholar] [CrossRef]
  14. Ahmadian, M.; Suh, J.M.; Hah, N.; Liddle, C.; Atkins, A.R.; Downes, M.; Evans, R.M. PPARγ signaling and metabolism: The good, the bad and the future. Nat. Med. 2013, 19, 557–566. [Google Scholar] [CrossRef]
  15. Nan, Y.M.; Han, F.; Kong, L.B.; Zhao, S.X.; Wang, R.Q.; Wu, W.J.; Yu, J. Adenovirus-mediated peroxisome proliferator activated receptor gamma overexpression prevents nutritional fibrotic steatohepatitis in mice. Scand. J. Gastroenterol. 2011, 46, 358–369. [Google Scholar] [CrossRef]
  16. Gupte, A.A.; Liu, J.Z.; Ren, Y.; Minze, L.J.; Wiles, J.R.; Collins, A.R.; Lyon, C.J.; Pratico, D.; Finegold, M.J.; Wong, S.T.; et al. Rosiglitazone attenuates age- and diet-associated nonalcoholic steatohepatitis in male low-density lipoprotein receptor knockout mice. Hepatology 2010, 52, 2001–2011. [Google Scholar] [CrossRef]
  17. Kim, J.W.; Yang, D.; Jeong, H.; Park, I.S.; Lee, M.H.; Lim, C.W.; Kim, B. Dietary zerumbone, a sesquiterpene, ameliorates hepatotoxin-mediated acute and chronic liver injury in mice. Phytother. Res. PTR 2019, 33, 1538–1550. [Google Scholar] [CrossRef]
  18. Roehlen, N.; Crouchet, E.; Baumert, T.F. Liver Fibrosis: Mechanistic Concepts and Therapeutic Perspectives. Cells 2020, 9, 875. [Google Scholar] [CrossRef]
  19. Wu, J.W.; Lin, L.C.; Hung, S.C.; Chi, C.W.; Tsai, T.H. Analysis of silibinin in rat plasma and bile for hepatobiliary excretion and oral bioavailability application. J. Pharm. Biomed. Anal. 2007, 45, 635–641. [Google Scholar] [CrossRef]
  20. Faghihzadeh, F.; Adibi, P.; Rafiei, R.; Hekmatdoost, A. Resveratrol supplementation improves inflammatory biomarkers in patients with nonalcoholic fatty liver disease. Nutr. Res. 2014, 34, 837–843. [Google Scholar] [CrossRef]
  21. Wang, M.; Chen, Z.; Yang, L.; Ding, L. Sappanone A Protects Against Inflammation, Oxidative Stress and Apoptosis in Cerebral Ischemia-Reperfusion Injury by Alleviating Endoplasmic Reticulum Stress. Inflammation 2021, 44, 934–945. [Google Scholar] [CrossRef] [PubMed]
  22. Shi, X.; Li, Y.; Wang, Y.; Ding, T.; Zhang, X.; Wu, N. Pharmacological postconditioning with sappanone A ameliorates myocardial ischemia reperfusion injury and mitochondrial dysfunction via AMPK-mediated mitochondrial quality control. Toxicol. Appl. Pharmacol. 2021, 427, 115668. [Google Scholar] [CrossRef] [PubMed]
  23. Lee, S.; Choi, S.Y.; Choo, Y.Y.; Kim, O.; Tran, P.T.; Dao, C.T.; Min, B.S.; Lee, J.H. Sappanone A exhibits anti-inflammatory effects via modulation of Nrf2 and NF-κB. Int. Immunopharmacol. 2015, 28, 328–336. [Google Scholar] [CrossRef] [PubMed]
  24. Liu, X.; Yu, D.; Wang, T. Sappanone A Attenuates Allergic Airway Inflammation in Ovalbumin-Induced Asthma. Int. Arch. Allergy Immunol. 2016, 170, 180–186. [Google Scholar] [CrossRef]
  25. Choo, Y.Y.; Tran, P.T.; Min, B.S.; Kim, O.; Nguyen, H.D.; Kwon, S.H.; Lee, J.H. Sappanone A inhibits RANKL-induced osteoclastogenesis in BMMs and prevents inflammation-mediated bone loss. Int. Immunopharmacol. 2017, 52, 230–237. [Google Scholar] [CrossRef]
  26. Zhou, Z.; Qi, J.; Zhao, J.; Lim, C.W.; Kim, J.W.; Kim, B. Dual TBK1/IKKε inhibitor amlexanox attenuates the severity of hepatotoxin-induced liver fibrosis and biliary fibrosis in mice. J. Cell. Mol. Med. 2020, 24, 1383–1398. [Google Scholar] [CrossRef]
  27. Xu, Q.; Liu, M.; Chao, X.; Zhang, C.; Yang, H.; Chen, J.; Zhou, B. Stevioside Improves Antioxidant Capacity and Intestinal Barrier Function while Attenuating Inflammation and Apoptosis by Regulating the NF-κB/MAPK Pathways in Diquat-Induced Oxidative Stress of IPEC-J2 Cells. Antioxidants 2023, 12, 1070. [Google Scholar] [CrossRef]
  28. Zhou, Z.; Qi, J.; Wu, Y.; Li, C.; Bao, W.; Lin, X.; Zhu, A. Nuciferine Effectively Protects Mice against Acetaminophen-Induced Liver Injury. Antioxidants 2023, 12, 949. [Google Scholar] [CrossRef]
  29. Huang, Y.; Wu, H.; Hu, Y.; Zhou, C.; Wu, J.; Wu, Y.; Wang, H.; Lenahan, C.; Huang, L.; Nie, S.; et al. Puerarin Attenuates Oxidative Stress and Ferroptosis via AMPK/PGC1α/Nrf2 Pathway after Subarachnoid Hemorrhage in Rats. Antioxidants 2022, 11, 1259. [Google Scholar] [CrossRef]
  30. Zhou, Z.; Wu, Y.; Hua, W.; Yan, X.; Li, L.; Zhu, A.; Qi, J. Sappanone A ameliorates acetaminophen-induced acute liver injury in mice. Toxicology 2022, 480, 153336. [Google Scholar] [CrossRef]
  31. Qi, J.; Kim, J.W.; Zhou, Z.; Lim, C.W.; Kim, B. Ferroptosis Affects the Progression of Nonalcoholic Steatohepatitis via the Modulation of Lipid Peroxidation-Mediated Cell Death in Mice. Am. J. Pathol. 2020, 190, 68–81. [Google Scholar] [CrossRef] [PubMed]
  32. Ruart, M.; Chavarria, L.; Campreciós, G.; Suárez-Herrera, N.; Montironi, C.; Guixé-Muntet, S.; Bosch, J.; Friedman, S.L.; Garcia-Pagán, J.C.; Hernández-Gea, V. Impaired endothelial autophagy promotes liver fibrosis by aggravating the oxidative stress response during acute liver injury. J. Hepatol. 2019, 70, 458–469. [Google Scholar] [CrossRef] [PubMed]
  33. Zhou, Z.; Kim, J.W.; Qi, J.; Eo, S.K.; Lim, C.W.; Kim, B. Toll-Like Receptor 5 Signaling Ameliorates Liver Fibrosis by Inducing Interferon β-Modulated IL-1 Receptor Antagonist in Mice. Am. J. Pathol. 2020, 190, 614–629. [Google Scholar] [CrossRef] [PubMed]
  34. Cheng, D.; Chai, J.; Wang, H.; Fu, L.; Peng, S.; Ni, X. Hepatic macrophages: Key players in the development and progression of liver fibrosis. Liver Int. 2021, 41, 2279–2294. [Google Scholar] [CrossRef]
  35. Cheng, P.; Xie, J.; Liu, Z.; Wang, J. Aldose reductase deficiency inhibits LPS-induced M1 response in macrophages by activating autophagy. Cell Biosci. 2021, 11, 61. [Google Scholar] [CrossRef]
  36. Raghupathi, W.; Raghupathi, V. An Empirical Study of Chronic Diseases in the United States: A Visual Analytics Approach. Int. J. Environ. Res. Public Health 2018, 15, 431. [Google Scholar] [CrossRef]
  37. Rana, J.S.; Khan, S.S.; Lloyd-Jones, D.M.; Sidney, S. Changes in Mortality in Top 10 Causes of Death from 2011 to 2018. J. Gen. Intern. Med. 2021, 36, 2517–2518. [Google Scholar] [CrossRef]
  38. Wynn, T.A. Common and unique mechanisms regulate fibrosis in various fibroproliferative diseases. J. Clin. Investig. 2007, 117, 524–529. [Google Scholar] [CrossRef]
  39. Hillaire, S.; Cazals-Hatem, D.; Bruno, O.; de Miranda, S.; Grenet, D.; Poté, N.; Soubrane, O.; Erlinger, S.; Lacaille, F.; Mellot, F.; et al. Liver transplantation in adult cystic fibrosis: Clinical, imaging, and pathological evidence of obliterative portal venopathy. Liver Transplant. 2017, 23, 1342–1347. [Google Scholar] [CrossRef]
  40. Fang, C.; Jaffer, O.S.; Yusuf, G.T.; Konstantatou, E.; Quinlan, D.J.; Agarwal, K.; Quaglia, A.; Sidhu, P.S. Reducing the Number of Measurements in Liver Point Shear-Wave Elastography: Factors that Influence the Number and Reliability of Measurements in Assessment of Liver Fibrosis in Clinical Practice. Radiology 2018, 287, 844–852. [Google Scholar] [CrossRef]
  41. Seki, E.; Schwabe, R.F. Hepatic inflammation and fibrosis: Functional links and key pathways. Hepatology 2015, 61, 1066–1079. [Google Scholar] [CrossRef] [PubMed]
  42. Tewtrakul, S.; Tungcharoen, P.; Sudsai, T.; Karalai, C.; Ponglimanont, C.; Yodsaoue, O. Antiinflammatory and Wound Healing Effects of Caesalpinia sappan L. Phytother. Res. PTR 2015, 29, 850–856. [Google Scholar] [CrossRef] [PubMed]
  43. Wang, Y.Z.; Sun, S.Q.; Zhou, Y.B. Extract of the dried heartwood of Caesalpinia sappan L. attenuates collagen-induced arthritis. J. Ethnopharmacol. 2011, 136, 271–278. [Google Scholar] [CrossRef]
  44. Brempelis, K.J.; Crispe, I.N. Infiltrating monocytes in liver injury and repair. Clin. Transl. Immunol. 2016, 5, e113. [Google Scholar] [CrossRef] [PubMed]
  45. Krenkel, O.; Tacke, F. Liver macrophages in tissue homeostasis and disease. Nat. Rev. Immunol. 2017, 17, 306–321. [Google Scholar] [CrossRef]
  46. Zhang, J.; Liu, Y.; Chen, H.; Yuan, Q.; Wang, J.; Niu, M.; Hou, L.; Gu, J.; Zhang, J. MyD88 in hepatic stellate cells enhances liver fibrosis via promoting macrophage M1 polarization. Cell Death Dis. 2022, 13, 411. [Google Scholar] [CrossRef]
  47. Xie, C.; Wan, L.; Li, C.; Feng, Y.; Kang, Y.J. Selective suppression of M1 macrophages is involved in zinc inhibition of liver fibrosis in mice. J. Nutr. Biochem. 2021, 97, 108802. [Google Scholar] [CrossRef]
  48. Rao, J.; Wang, H.; Ni, M.; Wang, Z.; Wang, Z.; Wei, S.; Liu, M.; Wang, P.; Qiu, J.; Zhang, L.; et al. FSTL1 promotes liver fibrosis by reprogramming macrophage function through modulating the intracellular function of PKM2. Gut 2022, 71, 2539–2550. [Google Scholar] [CrossRef]
  49. Bai, L.; Liu, X.; Zheng, Q.; Kong, M.; Zhang, X.; Hu, R.; Lou, J.; Ren, F.; Chen, Y.; Zheng, S.; et al. M2-like macrophages in the fibrotic liver protect mice against lethal insults through conferring apoptosis resistance to hepatocytes. Sci. Rep. 2017, 7, 10518. [Google Scholar] [CrossRef]
  50. Ramachandran, P.; Pellicoro, A.; Vernon, M.A.; Boulter, L.; Aucott, R.L.; Ali, A.; Hartland, S.N.; Snowdon, V.K.; Cappon, A.; Gordon-Walker, T.T.; et al. Differential Ly-6C expression identifies the recruited macrophage phenotype, which orchestrates the regression of murine liver fibrosis. Proc. Natl. Acad. Sci. USA 2012, 109, E3186–E3195. [Google Scholar] [CrossRef]
  51. Wu, L.; Guo, C.; Wu, J. Therapeutic potential of PPARγ natural agonists in liver diseases. J. Cell. Mol. Med. 2020, 24, 2736–2748. [Google Scholar] [CrossRef]
  52. Ye, L.; Chen, T.; Cao, J.; Sun, L.; Li, W.; Zhang, C. Short hairpin RNA attenuates liver fibrosis by regulating the PPAR-γ and NF-κB pathways in HBV-induced liver fibrosis in mice. Int. J. Oncol. 2020, 57, 1116–1128. [Google Scholar] [CrossRef]
  53. Feng, X.; Weng, D.; Zhou, F.; Owen, Y.D.; Qin, H.; Zhao, J.; Yu, W.; Huang, Y.; Chen, J.; Fu, H.; et al. Activation of PPARγ by a Natural Flavonoid Modulator, Apigenin Ameliorates Obesity-Related Inflammation Via Regulation of Macrophage Polarization. EBioMedicine 2016, 9, 61–76. [Google Scholar] [CrossRef] [PubMed]
  54. Schofield, R. Assessment of cytotoxic injury to bone marrow. Br. J. Cancer Suppl. 1986, 7, 115–125. [Google Scholar] [PubMed]
Figure 1. Sappanone A (SA) treatment ameliorates the severity of CCl4-induced liver injury in mice. (A) Mice were administered with CCl4 (2:5 v/v in corn oil, 2 mL/kg, i.p.) or an equal volume of corn oil three times a week for 4 weeks. Meanwhile, mice in each group were treated with SA (25, 50, and 100 mg/kg body weight, i.p.) or an equal volume of vehicle every other day. (BD) The body weight and liver weight were monitored, and the liver index was calculated. (E) Serum ALT and AST levels were evaluated. (F) H&E staining. (G) The necrotic lesions in H&E-stained liver sections were scored. (H) Hepatic hydroxyproline levels were quantified. Data in each group are displayed as means ± SD. (BE) Differences among multiple groups were analyzed with ANOVA followed by Tukey’s post hoc analysis. If there is at least one identical letter in the symbols of compared groups, there is no statistically significant difference between these groups. If there is no common letter in the compared groups, then the means between these groups are statistically different. (G,H) Differences between the two groups were compared by two-tailed Student’s t-test, * p < 0.05 and ** p < 0.01. Corn oil-treated groups (n = 8); CCl4-treated group (n = 10). Original magnification: ×400. The arrows in the picture show areas of inflammation or necrosis.
Antioxidants 12 01718 g001
Figure 2. Sappanone A (SA) treatment alleviates the severity of hepatotoxin-induced liver fibrosis. Liver slides were stained with Sirius Red (A) or Masson (C) to explore hepatic fibrogenesis. Sirius Red positive area (B) and Masson positive area (D) were quantified. (E) The mRNA expression of αSMA, Col1, TGFβ, and Timp1 in liver tissues was measured by qRT-PCR. Data in each group are displayed as means ± SD. * p < 0.05 and ** p < 0.01. Corn oil-treated groups (n = 8); CCl4-treated group (n = 10). Original magnification: ×200 (Sirius Red); ×400 (Masson). The arrows in the picture indicate the collagen fibers.
Antioxidants 12 01718 g002
Figure 3. Treatment with sappanone A (SA) inhibits oxidative stress and apoptosis in damaged livers of mice. (A) GSH levels in the lives of mice were measured at 24 h. (B) The activity of SOD in the livers of mice was determined at 24 h. (C) MDA levels in the livers of mice at 24 h were evaluated to measure lipid peroxidation. (D) TUNEL assay was used to explore cell death in the livers of mice. (E) TUNEL-positive fields’ percentages were calculated. (F) The mRNA expression of Bax and Bcl2 in the livers of mice was investigated by qRT-PCR. Data in each group are shown as means ± SD. * p < 0.05 and ** p < 0.01. Corn oil-treated groups (n = 8); CCl4-treated group (n = 10). Original magnification: ×200. The arrows in the picture show the dead cells.
Antioxidants 12 01718 g003
Figure 4. Sappanone A (SA) treatment reduces CCl4-induced hepatotoxicity in vitro. AML12 cells were stimulated with 0.3% CCl4. Cells were treated with SA (1, 10, and 100 μM) for 30 min after CCl4 administration. At 24 h after CCl4 treatment, cell samples were collected. (A) The cell viability was evaluated by an MTT assay. (B) The cytotoxicity was determined by an LDH assay. GSH (C), SOD (D), and MDA (E) contents in mice livers were measured. Data in each group are shown as means ± SD (n = 8 wells/group). Differences among multiple groups were analyzed with ANOVA followed by Tukey’s post hoc analysis. If there is at least one identical letter in the symbols of compared groups, there is no statistically significant difference between these groups. If there is no common letter in the compared groups, then the means between these groups are statistically different.
Antioxidants 12 01718 g004
Figure 5. Sappanone A (SA) treatment has no significant impact on HSC activation. To activate LX-2 cells, 10 ng/mL human recombinant TGFβ was applied. Activated LX-2 cells were then treated with SA (1, 10, and 100 μM) or vehicle for 24 h. (A) The mRNA expression levels of αSMA, Col1, and Timp1 in LX-2 cells were measured by qRT-PCR. (B) The cytotoxicity was determined by an LDH assay. Data in each group are presented as means ± SD (n = 8 wells/group). Differences among multiple groups were analyzed with ANOVA followed by Tukey’s post hoc analysis. If there is at least one identical letter in the symbols of compared groups, there is no statistically significant difference between these groups. If there is no common letter in the compared groups, then the means between these groups are statistically different.
Antioxidants 12 01718 g005
Figure 6. Sappanone A (SA) treatment diminishes hepatic inflammatory responses in vivo. The mRNA expression (A) and protein levels (B) of TNFα, IL-1β, and IL-6 in mice liver were measured by using qRT-PCR and ELISA. (C) To observe macrophage infiltration in livers of mice, the F4/80 positive macrophages in liver slides were stained with IHC. (D) The F4/80 positive areas were quantified. Data in each group are presented as means ± SD. * p < 0.05 and ** p < 0.01. Corn oil-treated groups (n = 8); CCl4-treated group (n = 10). Original magnification: ×400. The arrows in the picture show the positive-cells.
Antioxidants 12 01718 g006
Figure 7. Sappanone A (SA) treatment could relieve inflammatory responses by PPARγ-mediated macrophage polarization. To demonstrate whether SA exerts anti-inflammatory properties, the RAW 264.7 cell line was treated with SA (1, 10, and 100 μM) at 30 min after LPS (1 μg/mL) stimulation (n = 8 wells/group). At 24 h after LPS treatment, cell samples and supernatants were collected. (A) The mRNA expression of TNFα, IL-1β, and IL-6 in cells was measured by qRT-PCR. The mRNA expression of iNOS (M1 phenotype maker) or IL-10 and Arg1 (M2 phenotype makers) in cells (B) and livers of mice (C) was evaluated by qRT-PCR. The CD86-positive macrophages (D,E) and CD163-positive macrophages (F,G) in liver slides were stained with IHC staining. PPARγ mRNA level was measured in cells (H) and livers of mice (I) by qRT-PCR. Data in each group are presented as means ± SD. (A,B,H) Differences among multiple groups were analyzed with ANOVA followed by Tukey’s post hoc analysis. If there is at least one identical letter in the symbols of compared groups, there is no statistically significant difference between these groups. If there is no common letter in the compared groups, then the means between these groups are statistically different. (C,E,G,I) Differences between the two groups were compared by two-tailed Student’s t-test, * p < 0.05 and ** p < 0.01. Corn oil-treated groups (n = 8); CCl4-treated group (n = 10). Original magnification: ×400. The arrows in the picture show the positive-cells.
Antioxidants 12 01718 g007aAntioxidants 12 01718 g007b
Figure 8. Modulation of PPARγ by sappanone A (SA) treatment affects macrophage polarization in RAW 264.7 cells. The RAW 264.7 cells were treated with 2 μM SR202 and/or 100 μM SA at 30 min and 1 h after LPS (1 μg/mL) treatment. SR202 was used to inhibit the activity of PPARγ. At 24 h after LPS stimulation, cells and supernatants were collected. (A) The mRNA level of iNOS (M1 phenotype maker) or IL-10 and Arg1 (M2 phenotype makers) in cells was evaluated by qRT-PCR. (B) The mRNA expression of TNFα, IL-1β, and IL-6 in cells was measured by qRT-PCR. Data in each group are expressed as means ± SD (n = 8 wells/group). * p < 0.05 and ** p < 0.01.
Antioxidants 12 01718 g008
Figure 9. Treatment with sappanone A (SA) promotes fibrosis resolution. Mice were injected with CCl4 for 4 weeks, followed by discontinuation plus SA (100 mg/kg, i.p.) or vehicle every 2 days for 2 weeks (RES group). (A) Sirius Red-stained liver slides were used to investigate liver fibrogenesis. (B) Sirius Red positive areas were quantified. (C) The levels of ALT and AST in serum were measured. Data in each group are presented as means ± SD (n = 6 mice/group). * p < 0.05. Original magnification: ×200.
Antioxidants 12 01718 g009
Table 1. Animal treatments.
GroupsVolume of Corn Oil (Body Weight)Volume of CCl4 (CCl4:Corn Oil = 2:5, v/v) (Body Weight)Dose of SA or Vehicle (Body Weight)Animal Number
12 mL/kg, i.p._PBS (200 μL, i.p.)n = 8
22 mL/kg, i.p._25 mg/kg SA (200 μL, i.p.)n = 8
32 mL/kg, i.p._50 mg/kg SA (200 μL, i.p.)n = 8
42mL/kg, i.p._100 mg/kg SA (200 μL, i.p.)n = 8
5_2 mL/kg, i.p.PBS (200 μL, i.p.)n = 10
6_2 mL/kg, i.p.25 mg/kg SA (200 μL, i.p.)n = 10
7_2 mL/kg, i.p.50 mg/kg SA (200 μL, i.p.)n = 10
8_2 mL/kg, i.p.100 mg/kg SA (200 μL, i.p.)n = 10
Table 2. The primer sequence of real-time PCR.
GeneGene Accession NumberForward (5′-3′)Reverse (5′-3′)
αSMANM_0073925′-TGCAGGTGATGCTGACAGAGG-3′5′-GGGATGAGCTAGTGCTGATCTGG-3′
Col1NM_0077425′-CAGCCAATCAGCGTTCGGTA-3′5′-CTTCATGGCGTAGTTGAATGATGTC-3′
TGFβNM_0010130255′-AGTTGGAGCAGCTGTATCAGTGG-3′5′-TTTAGCAAAGGCAGTCAAATCTGG-3′
Timp1NM_0010443845′-AATGACTGTTGCCAGGTGGATG-3′5′-GGTTGCACTTCCAAATGAGGCTA-3′
BaxNM_0075275′-AAGCGCTTCGGGCCAG-3′5′-TAGCCATGCAGGACCACGA-3′
Bcl2NM_1774105′-GGTCAGAAAGCCGTGGTTG-3′5′-GACATGGCCTAACGTGCAG-3′
TNFαNM_013693.35′-CGCCTCTCCTTGCTGTCACA-3′5′-CTTTGCCTTCTGCCTCAAGT-3′
IL-1βNM_008361.45′-GTCTACTCCCAGGTTTCTCTTCAAGG-3′5′-GCAAATCGGCTGACGGTGTG-3′
IL-6NM_001314054.15′-CTCGCAGCAGCACATCAACA-3′5′-CCACGGGAAAGACACAGGTA-3′
iNOSNM_0109275′-TGCACCCAAACCGAAGTC-3′5′-GTCAGAAGCCAGCGTTCACC-3′
Arg1NM_0074825′-GCCAAGGGTTGACTTCAAGAACA-3′5′-AGGCTCCTCCTTTCCAGGTCA-3′
IL-10NM_0105485′-AGCAGCAGGTGTCCCAAAGA-3′5′-GTGCTGAAGACCTTAGGGCAGA-3′
PPARγNM_1332495′-ACGGCAAATTCAACGGCACAG-3′5′-GAAGACTCCACGACATACTCAGCAC-3′
hαSMANM_0016135′-ATAGAACATGGCATCATCACCAAC-3′5′-GGGCAACACGAAGCTCATTGTA-3′
hCol1NM_0000885′-GCTTGGTCCACTTGCTTGAAGA-3′5′-GAGCATTGCCTTTGATTGCTG-3′
GAPDHNM_001411840.15′-ACGGCAAATTCAACGGCACAG-3′5′-AGACTCCACGACATACTCAGCAC-3′
hGAPDHNM_0012567995′-GCACCGTCAAGGCTGAGAAC-3′5′-TGGTGAAGACGCCAGTGGA-3′
αSMA, alpha smooth muscle actin; Col1, alpha-1 type I collagen; TGFβ, transforming growth factor β; Timp1, tissue inhibitors of metalloproteinase-1; Bax, Bcl-2-associated X-protein; Bcl2, B-cell CLL/lymphoma 2; TNFα, tumor necrosis factor; IL-1β, interleukin-1beita; IL-6, interleukin-6; iNOS, inducible nitric oxide synthase; Arg1, arginase; IL-10, interleukin-10; PPARγ, peroxisome proliferator-activated receptor gamma; hαSMA, human alpha smooth muscle actin; hCol1, human alpha-1 type I collagen; GAPDH, glyceraldehyde-3-phosphate dehydrogenase; and hGAPDH, human glyceraldehyde-3-phosphate dehydrogenase.
Disclaimer/Publisher’s Note: The statements, opinions and data contained in all publications are solely those of the individual author(s) and contributor(s) and not of MDPI and/or the editor(s). MDPI and/or the editor(s) disclaim responsibility for any injury to people or property resulting from any ideas, methods, instructions or products referred to in the content.

