Abstract
Methane (CH4), which is produced endogenously in animals and plants, was recently suggested to play a role in cellular physiology, potentially influencing the signaling pathways and regulatory mechanisms involved in nitrosative and oxidative stress responses. In addition, it was proposed that the supplementation of CH4 to organisms may be beneficial for the treatment of several diseases, including ischemia, reperfusion injury, and inflammation. However, it is still unclear whether and how CH4 is produced in mammalian cells without the help of microorganisms, and how CH4 might be involved in physiological processes in humans. In this study, we produced the first evidence of the principle that CH4 is formed non-microbially in the human body by applying isotopically labeled methylated sulfur compounds, such as dimethyl sulfoxide (DMSO) and methionine, as carbon precursors to confirm cellular CH4 formation. A volunteer applied isotopically labeled (2H and 13C) DMSO on the skin, orally, and to blood samples. The monitoring of stable isotope values of CH4 convincingly showed the conversion of the methyl groups, as isotopically labeled CH4 was formed during all experiments. Based on these results, we considered several hypotheses about endogenously formed CH4 in humans, including physiological aspects and stress responses involving reactive oxygen species (ROS). While further and broader validation studies are needed, the results may unambiguously serve as a proof of concept for the endogenous formation of CH4 in humans via a radical-driven process. Furthermore, these results might encourage follow-up studies to decipher the potential physiological role of CH4 and its bioactivity in humans in more detail. Of particular importance is the potential to monitor CH4 as an oxidative stress biomarker if the observed large variability of CH4 in breath air is an indicator of physiological stress responses and immune reactions. Finally, the potential role of DMSO as a radical scavenger to counteract oxidative stress caused by ROS might be considered in the health sciences. DMSO has already been investigated for many years, but its potential positive role in medical use remains highly uncertain.
1. Introduction
Methane (CH4) is an important and highly abundant carbon molecule in the Earth’s atmosphere that affects the Earth’s radiative balance. Around 600 to 700 million tons of CH4 are released into the atmosphere annually by natural and anthropogenic sources, mostly of biological origin [1]. For a long time, biological CH4 formation was considered to only occur from the metabolism of microorganisms—methanogens that belong to the domain Archaea—living under strictly anaerobic conditions in natural wetlands; landfills; rice fields; or in the alimentary tract of vertebrates, including ruminants and humans. However, in 2006, it was clearly demonstrated that plants—from the Eukarya domain—are able to produce CH4 per se [2]. This breakthrough finding fueled research to search for alternative biological CH4 sources other than those derived from archaeal methanogens. Since then, many studies unambiguously confirmed direct (endogenous) CH4 formation and release from eukaryotes, including plants [3,4,5,6,7,8], animals [9,10], fungi [11,12], and marine and freshwater algae [13,14,15]. In addition, cyanobacteria—belonging to the domain Bacteria—thriving in aquatic and terrestrial environments are also able to generate CH4 at substantial rates depending on the species and environmental conditions [16]. Finally, a universal formation mechanism for CH4 was recently proposed that might explain why all living organisms produce CH4 under aerobic conditions [17]. In conclusion, the recent findings have stimulated great interest in endogenous CH4 formation processes all over the three life domains, which are now often referred to as “aerobic”, “non-archaeal”, or “non-microbial” CH4 formation processes [18]. Therefore, in the following paragraphs, we first discuss the traditional view of CH4 formation before we deal with the recently identified alternative pathways.
1.1. Traditional View of Microbial Methane Formation in Humans
Traditionally, CH4 formation in humans was considered to exclusively arise from anaerobic microbial activity in the gastrointestinal tract [19,20,21]. The microbial species identified so far in the distal part of the colon (methylotrophic Methanospaera stadtmanae and hydrogenotrophic Methanobrevibacter smithii) were considered to contribute to the observed 25% to 70% of humans defined as CH4 producers. The terms “CH4 producer” (with breath CH4 emission > 1 part per million (ppmv) above background values) and “CH4 non-producer” (breath CH4 emission < 1 ppmv above background values) used in many previous publications have become somewhat misleading after Keppler et al. [22], as demonstrated through high-precision measurements that showed that every human produces at least 26 parts per billion by volume (ppbv) breath CH4 above background CH4 values. This value is around three orders of magnitude lower when compared with the average values from typical breath CH4 “producers”. Based on these results, the following preferred terminology was proposed: high (>4 ppmv), medium (1–4 ppmv), and low (<1 ppmv) breath CH4 producers instead of CH4 producers and non-producers.
Regarding the CH4-producing status, several studies suggested that factors such as age [23,24], ethnic background [25,26], gender [24,27], exercise status [28], and various gastrointestinal diseases [29,30,31,32,33,34] play roles in an increased level of breath CH4. Polag and Keppler [35] gave an overview of the variability of study parameters and calculated that 38% of humans globally are high producers of CH4, with an average CH4 content of around 17 ppmv in breath air. For further discussion regarding the microbial formation of CH4 in the human gut system and the physiological factors that might control these processes, see the review articles by de Lacy Castello et al. [36] and Levitt et al. [20].
Hereafter, based on the stable carbon isotope and CH4 emission patterns of various age groups, it was hypothesized that next to microbial sources in the gastrointestinal tracts, there might be other, yet unidentified, endogenous cellular processes involved in CH4 formation [18,22,37]. Indeed, long-term monitoring of CH4 in combination with the observation of physical conditions suggested a relationship between deviations in breath CH4 production from the base level and immune reactions and inflammatory processes [37,38]. Thus, there is increasing evidence that CH4 has a bioactive role in the cellular physiology of eukaryotes and could be considered a diagnostic marker of oxido-reductive stress [18,39].
1.2. Alternative Mechanism(s) of Non-Microbial Methane Formation in Eukaryotes
In plants, it was shown that CH4 production is influenced by environmental factors, such as visible light [4], ultraviolet-B radiation [5,6,40,41,42,43,44], and temperature [2,6,42,45]. Several precursors of non-microbial CH4 production, including methoxy groups of plant pectins [2,5,46], lignin, cellulose [45], ascorbic acid [47], L-methionine [8,48], and epicuticular wax [49], were suggested. In addition, for higher plants and microalgae, it was demonstrated that environmental stressors drastically enhance CH4 formation [14,50].
To understand non-microbial CH4 formation in eukaryotes and other organisms, it is important to consider the role of reactive oxygen species (ROS, e.g., hydroxyl radicals (•OH), superoxide radicals (O2−•), hydrogen peroxide (H2O2), or carbonate radicals (CO3−•)), iron species, and carbon precursor compounds. In highly oxidative environments generated in vitro by a chemical model system containing iron (II/III), H2O2, and the radical scavenger ascorbate, CH4 is readily formed from organosulfur and nitrogen compounds, with the highest conversion rates found for DMSO [51]. Under these Fenton-type conditions, in the presence of H2O2, nonheme oxo-iron(IV) ([FeIV=O]2+) oxidizes methyl sulfides to sulfoxides, which then results in the selective formation of methyl radicals via sulfoxide demethylation and ultimately leads to CH4 [51,52]. Alternatively, ROS can directly react with methyl sulfides to produce methyl radicals or peroxomethyl radicals in the presence of oxygen [53,54,55], subsequently resulting in CH4 formation or oxidized C1 species, such as methanol or formaldehyde.
The traditional homogenous Fenton reaction includes the interaction of free iron species and H2O2 (Equation (1)). This is a key reaction in biological systems and its major cause is oxidative stress. For detailed information regarding the various reaction steps of the Fenton process, we refer to the literature [56,57]. In living cells, Fenton chemistry takes place, as iron is an essential trace element [58] and H2O2 is produced during respiratory, and generally metabolic, activity [59]. Hydrogen peroxide and ferrous iron (Fe2+) either react to give ferric iron (Fe3+), OH−, and •OH (Equation (1)), or [FeIV=O]2+ and water [60]. This provides the basis for our understanding of CH4 formation in cells under oxic conditions. A wide spectrum of molecules that act as methyl donors for CH4 formation are conceivable. However, of particular interest are compounds with sulfur (S)- and nitrogen (N)-bonded methyl groups that arise during cellular metabolism or are externally provided. For methylated sulfur compounds, these include DMSO and methionine, which are ubiquitous in the environment [61]. In addition, methylated nitrogen compounds, such as betaine, choline, or trimethylamine, might also serve as CH4 precursors. This was recently shown for many organisms from the three domains of life using culture experiments, and a detailed reaction mechanism for CH4 formation was suggested, highlighting the interaction between ROS, iron, and S- and N-methylated compounds [17]. The authors also showed that oxidative stress led to increased CH4 formation in the studied organisms.
Fe(II) + H2O2 → Fe(III) + OH− + •OH
In summary, the reaction of methylated sulfur compounds, such as DMSO and methionine with Fenton-type chemistry involving ROS, carbonate radicals, or oxo-iron(IV) results in the formation of methyl radicals (•CH3), of which a portion reacts to CH4 through abstraction of a hydrogen atom from hydrocarbons, hydrogen peroxide, or hydrogen carbonate. Alternatively, the methyl radicals form oxidized C1 species, such as methanol, formaldehyde, or formic acid. Thus, it is conceivable that there is in vivo formation of C1 compounds as a result of ROS formation and interaction with methylated compounds. Therefore, we consider the administration of isotopically labeled DMSO and methionine as ideal model compounds to confirm the occurrence of ROS-driven CH4 formation in humans.
1.3. Application of DMSO to Humans
Dimethyl sulfoxide (DMSO) is an organic polar aprotic molecule that was first synthesized in 1866. It was used as an important solvent for many decades before being proposed for use as a pharmaceutical in the 1960s by Stanley Jacob. Because of its ability to rapidly penetrate through human skin and its properties as a free radical (•OH) scavenger, it was widely used as an anti-inflammatory, antipain, and neuroprotective agent. A wide range of biological and pharmacological effects of DMSO were described by Jacob and Herschler [62] for the interested reader. Since 1978, DMSO has been approved by the United States Food and Drug Administration (FDA) for the treatment of interstitial cystitis. Other medical applications, as well as potential physiological and pathological effects of DMSO, are highly controversially discussed. For example, Amemori et al. [63] found that the oral administration of DMSO is an effective treatment for amyloid A amyloidosis. On the other hand, experiments with rats found that DMSO might induce retinal apoptosis [64]. Despite the differing results of the various studies, it is generally assumed that DMSO is nontoxic below 10% (v/v) [65] with an oral medium lethal dose of 28,300 mg/kg (rat) and a dermal medium lethal dose of 40,000 mg/kg (rat).
1.4. Aims and Postulates
Recent results showed that CH4 might be formed in all organisms and that the formation of methyl radicals induced by ROS is a prerequisite for the generation of CH4. The experiments described in this paper were undertaken in order to unambiguously demonstrate (as a first proof of principle) that CH4 is endogenously formed in humans via a radical-driven process without the involvement of the well-known microbial sources (methanogens) living in the gastrointestinal tract. Therefore, a volunteer—the first author of this study—applied isotopically labeled (2H or 13C) DMSO on the skin (arm), consumed it via the mouth, and applied it to blood samples. In addition, the amino acid methionine (with an isotopically labeled 13C methyl group) was also applied to the blood samples. The released gases were analyzed for their isotopic composition to unambiguously identify the formation of CH4 from the precursor compounds DMSO and methionine. Based on the results and the formation patterns observed, we discuss several hypotheses concerning the origin of cell-based CH4 production and its potential physiological role in mammals. Finally, as DMSO has already been investigated for many years while its potential positive role for medical use is highly uncertain, we briefly discuss the potential application of DMSO to reveal and counteract oxidative stress.
2. Materials and Methods
2.1. Subject, Materials, Experiments, and Sampling of Air
2.1.1. Subject of the Study
All experiments and measurements were conducted by the principal investigator (PI) and first author of this study (F.K.) from June 2018 to October 2020. The subject was a healthy 55-year-old man without known disease, prescribed medications, or drug intake. The average breath CH4 production value of the subject was 9 ± 6.7 ppmv, measured over 72 weeks [38], and he was thus classified as a medium-to-high emitter (see the explanation above). Air and blood samples were provided by the PI, as shown in Section 2.1.3 below. A surrogate investigator (D.P.) was designated to obtain informed consent from the self-experimenter (F.K.), in agreement with the ethics relevant to solitary self-experimentation [66]. The work described was carried out in accordance with The Code of Ethics of the World Medical Association. The research was reviewed by the Medical Research Council of Hungary (ETT-TUKEB) and it was approved as part of the protocol “Mapping metabolic pathways of endogenous gas formation by isotopic analysis of the gas composition of human samples” (6420-8-2023/EUIG/768).
2.1.2. Materials: Position-Specific Isotopically Labeled DMSO and Methionine
The isotopically labeled sulfur-bonded methyl group(s) in DMSO (13C2-DMSO, 99%, Campro Scientific GmbH, Berlin, Germany and DMSO-d6, 99.9 atom %; Sigma Aldrich, Taufkirchen, Germany) and methionine (13CH3-MET, Sigma-Aldrich, Taufkirchen, Germany; Isotec 99% 13C atoms) were investigated as methyl precursors for CH4 (Figure 1). Please note that 2H-labeled methionine was not available for the experiments.
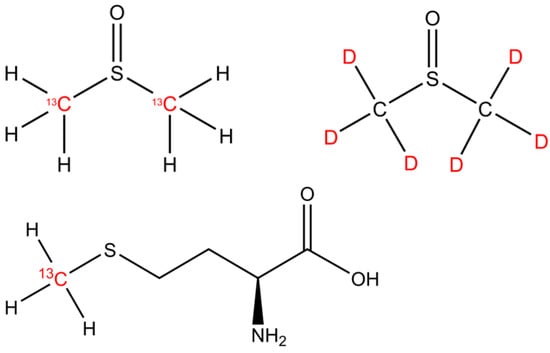
Figure 1.
The chemical structures of DMSO and methionine. The isotopically labeled carbon and hydrogen positions are indicated by the 13C and D (deuterium, 2H) highlighted in red font.
2.1.3. Experiments and Sampling of Air
A graphical representation of the set-up of the three individual experimental series (oral intake, arm exposure to sunlight, and blood experiments), including the collection of samples and the applied measurements, is outlined in Figure 2. Table S1 shows the timeline of the experiments.
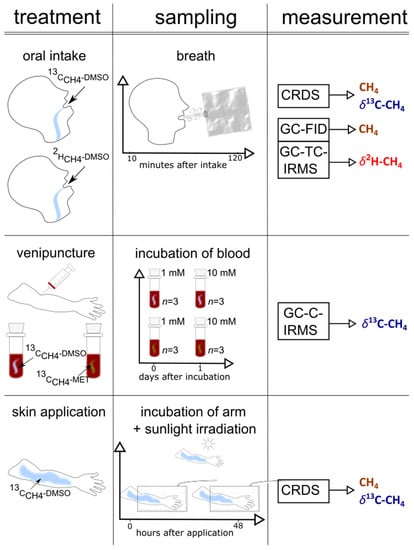
Figure 2.
A graphical representation of the set-up (treatment, sampling, measurement) of the three experiments (skin, blood, and oral administration) performed in this study.
2.1.4. Oral Intake of 13C- and 2H-Labeled DMSO
The volunteer of the study swallowed 100 µL 13C-CH4 DMSO (4% 13C-content, dissolved in 300 mL H2O) or 1 mL of 2H-CH4 DMSO (10% 2H-content, dissolved in 300 mL H2O), respectively. Subsequently, the breath CH4 concentration and isotope values of CH4 (δ13C or δ2H, respectively) were monitored for 130 min. The breath samples were collected using 1 L Tedlar bags. The breath CH4 sampling procedure was performed in a consistent manner. During the breath air collection, the volunteer breathed normally, stopped breathing for around 5 s, and then filled the Tedlar bag with expired air (range of 0.8 to 1 L). Depending on the study parameter, the gaseous sample was analyzed using cavity ringdown spectroscopy (CRDS), gas chromatography flame ionization detection (GC-FID), or gas chromatography temperature conversion isotope ratio mass spectrometry (GC-TC-IRMS) immediately after sampling (see analytical measurements below).
2.1.5. Arm Incubations and Exposure to Solar Light
For the CH4 skin emission analysis, the forearm of the subject was placed inside a cylindrical chamber (see photo documentation 1 in the Supplementary Materials) made of polytetrafluorethylene (PTFE) foil (transparent for UV light), with a diameter of 18.5 cm and a length of 42.5 cm (volume = 11.7 L). The round opening at the back was sealed with an elastic PTFE foil tied to the chamber and fixed along the upper arm. A gas inlet and outlet PTFE tube system was attached to the chamber. The pressure of the chamber was constant during the whole monitoring phase. Ventilation at the inside front of the chamber provided a homogeneous air mixture. The outlet tube was directly connected to the CRDS system (see analytical measurements below) for in situ online analysis of CH4 and CO2 concentrations and δ13C values. First, the empty chamber (filled with laboratory air) was measured as a control. Next, the volunteer thoroughly washed his arm with tap water and dried it with a paper towel before placing it in the chamber for 30 min to obtain a control value. Then, 13C-CH4-labeled DMSO (a mixture of 400 µL DMS0 + 100 µL 13C-labeled DMSO + 500 µL H2O) was thoroughly distributed on the skin of the left upper forearm (penetrated area of around 30 cm2) and the air in the chamber was connected to the CRDS measurement system for a monitoring period of 1 h. Afterward, the forearm was exposed to natural solar light in the field for a period of 1 h (from 10 to 11 am, in July in Heidelberg, Germany). After returning from the field to the laboratory (within 5 min) the left arm was again placed in the chamber and monitored for changes in the δ13C-CH4 values for 1 h. The same procedure was repeated the following two days and the untreated right arm served to record control values.
2.1.6. Blood Samples and Incubation with DMSO and Methionine
Approximately 20 mL of whole-blood samples were collected from the PI through venipuncture by using 4 × 7.5 mL S-Monovettes® containing Ethylenediaminetetraacetic acid (EDTA) to prevent coagulation. Samples were immediately processed for isotope label experiments. Therefore, 13C-labeled DMSO and methionine were added to 1 mL of blood in autoclaved 40 mL headspace vials (Supelco 27184) so that the final concentration of the added compound was 1 mM or 10 mM. Vials were sealed using a hole-type screw cap (Supelco) fitted with a PTFE/silicone septum (Supelco). The control samples were prepared in the same way, except that the added DMSO and methionine were isotopically not enriched in 13C. All samples were prepared in triplicates and incubated at 36 °C for 24 h before the gas phase in the vials was analyzed (first day). Afterward, the vials were opened to equilibrate with the air in a fume cupboard. After 30 min, the samples were again sealed with a PTFE/silicone septum and incubated at 36 °C for 24 h before the gas phase was analyzed (second day).
2.2. Analytical Measurements
The analytical laser technique applied in this study to obtain online stable carbon isotope measurements and concentrations of CH4 was almost identical to that described previously [22]. In addition, stable carbon and hydrogen isotope analyses were conducted by applying GC-IRMS, as described in Einzmann et al. [67]. However, we briefly describe the applied analytical techniques in the sections below. For more analytical details, and the application of stable isotope techniques, please refer to the studies by Keppler et al. [22] and Einzmann et al. [67] and to the Supplementary Materials.
2.2.1. Natural Abundance of 13C/12C and 2H/1H, Definition of δ Values, Isotopic Excess, and Keeling Method
Throughout this paper, the “delta” (δ) notation—which is the relative difference of the isotope ratio of a material to that of a standard V-PDB (Vienna Pee Dee Belemnite, 13C/12C ratio of 0.011108) or V-SMOW (Vienna Standard Mean Ocean Water, 2H/1H ratio of 0.00011576)—is used; values of δ13C and δ2H relative to those of V-PDB and V-SMOW, respectively, are defined by the following equations:
δ13C = ((13C/12C)sample/(13C/12C)standard) − 1.
δ2H = ((2H/1H)sample/(2H/1H)standard) − 1.
To comply with the guidelines of the International System of Units (SI), we followed the proposal of Brand and Coplen [68] and used the term urey, after H.C. Urey (symbol Ur), as the isotope delta value unit. In such a manner, an isotope-delta value expressed traditionally as −60‰ can be written as 60 mUr. For natural sources of CH4, typical δ13C-CH4 and δ2H-CH4 values are in the range of −20 to −100 mUr [12] and −100 to −400 mUr [44], respectively.
The isotopic difference (Δ) between the control and sample is defined as
Δ = δ13Csample − δ13Ccontrol
The 13C % and 2H % excesses were calculated as follows:
2.2.2. Laser Absorption Spectroscopy—Cavity Ringdown Spectroscopy
Measurements of CH4 Concentrations and Stable Carbon Isotope Values
Cavity ringdown spectroscopy is a highly sensitive optical spectroscopic technique for the measurements of both the stable carbon isotope value (δ13C-CH4) and the concentration of CH4. The Tedlar gas sample bag (from breath air) or the arm incubation Teflon chamber (see the Supplementary Materials) was connected to the CRDS, and the flow rate to the analyzer was 23 mL/min. Before entering the analytical system, the gas was passed through two chemical traps filled with AscariteII® (sodium hydroxide coated silica) and Drierite® (anhydrous CaSO4) to remove the carbon dioxide (CO2) and water, respectively. This was necessary due to the higher concentrations of CO2 and water (up to 6%) in the breath sample, which can cause interferences with the spectroscopic CH4 measurements.
Stable carbon isotope values and concentrations of CH4 were measured with a G2201-i cw-CRDS-Analyzer (Picarro, Inc., Santa Clara, CA, USA). This instrument enables simultaneous measurements of the CH4 concentration, δ13C-CH4 value, and water content in a gas sample. The concentration precision (1σ, 2 min average) specified by the manufacturer was 50 ppbv + 0.05% of reading (12C) and 10 ppbv + 0.05% of reading (13C) in the high dynamic range mode, and 5 ppbv + 0.05% of reading (12C) and 1 ppbv + 0.05% of reading (13C) in the high precision mode. The δ13C-CH4 precision provided by the manufacturer was <0.8 mUr. However, typical standard deviations (SD) of measurements of breath samples and standards (using filled Tedlar bags) were in the ranges of ±1.2 ppbv and ±0.3 mUr (1σ, 2 min average measurement interval) for the concentration and stable isotope measurements, respectively (see also [22]).
In order to quality assure the δ13C-CH4 values, some gas samples were measured using both CDRS and gas chromatography–combustion–isotope ratio mass spectrometry (GC-C-IRMS) (for details, see Section 2.2.4. below). Samples measured via IRMS were analyzed three times (n = 3) and the average standard deviations of the analytical measurements were in the range of 0.1 to 0.3 mUr. The measured difference between the two analytical systems was used to normalize the isotope data of the CRDS.
2.2.3. Measurements of CH4 Concentrations Using Gas Chromatography Flame Ionization Detection
An aliquot (5 mL) of headspace gas was taken from the incubation vials (40 mL) or gas bags (1 L) using a gastight syringe. Before entering the analytical system, the gas sample was passed through a chemical trap filled with Drierite® to remove water. The sample gas was separated via gas chromatography using a GC-14B (Shimadzu, Japan) equipped with a 2 m column (Ø = 3.175 mm inner diameter) packed with a Molecular Sieve 5A 60/80 mesh from Supelco. Methane was recorded using an FID, and its concentration was quantified by using two reference gases containing 9837 ppbv and 2192 ppbv CH4.
2.2.4. Continuous Flow Isotope Ratio Mass Spectrometry
Measurement of δ13C-CH4 Values
Gas from the Tedlar gas bags (from breath samples) or 40 mL glass vials (headspace of blood samples) was transferred to an evacuated sample loop (40 mL). Interfering compounds were separated via GC and CH4 was trapped on Hayesep D. Afterward, CH4 was separated from the interfering compounds via GC and transferred to a gas chromatography–combustion–isotope ratio mass spectrometer (Deltaplus XL mass spectrometer, ThermoQuest Finnigan, Bremen, Germany) via an open split. The working reference gas was CO2 of high purity (carbon dioxide 4.5, Messer Griesheim, Frankfurt, Germany) with a known δ13C value of −23.64 mUr (calibrated at MPI for Biogeochemistry in Jena, Germany). All δ13C-CH4 values were corrected using two CH4 working standards (isometric instruments, Victoria, BC, Canada) calibrated against the National Institute of Standards and Technology (NIST) and International Atomic Energy Agency (IAEA) reference substances. The calibrated δ13C-CH4 values of the two working standards in mUr vs. V-PDB were −23.9 ± 0.2 and −54.5 ± 0.2. All samples were normalized via two-scale anchor calibration according to Paul et al. (2007).
Measurement of δ2H-CH4 Values
δ2H-CH4 values were determined via GC-TC-IRMS. The same analytical set-up was applied as for stable carbon isotope measurements (see Section 2.2.2 above) with the following modifications: The flow rate was 0.6 mL min−1 and instead of combustion to CO2 and H2O, CH4 was thermolytically converted (at 1450 °C) to produce hydrogen (H2) and carbon. After IRMS measurements of the hydrogen, the obtained δ2H values were normalized using two reference standards of high-purity CH4 with δ2H values of—190.6 ± 0.2‰ (in-house) and—149.9 ± 0.2‰ (T-iso2, Isometric Instruments).
2.3. Statistics
Data analysis was performed using R 4.1.2 software. For data smoothing, the Loess method was used. For data analysis with CRDS (sampling rate = 1 s), mean values were taken for those periods in which the data variation was less than 5% (measurement periods of 20–30 min). The Δδ13C-CH4 values for both experiments are presented as the arithmetic means of the respective replicates, together with their standard deviations (SD). The arithmetic means and SDs were calculated using Microsoft Excel (Microsoft Excel for Office 365 MSO).
3. Results
3.1. Oral Intake of Isotopically Labeled DMSO and Measurements of Breath Air
Figure 3 shows the breath CH4 production and isotope differences as δ13C-CH4 values (Figure 3a) and δ2H-CH4 values (Figure 3b), relative to the control values, which were monitored using the breath air of the subject after an oral intake of isotopically labeled (with 13C and 2H, respectively; see the Materials and Methods section) DMSO over 130 min. Breath CH4 production (with laboratory background values subtracted) during the monitoring period showed mean values of 2.2 ± 0.06 ppmv (Figure 3a, top) and 12.4 ± 2.3 ppmv (Figure 3b, top), respectively.
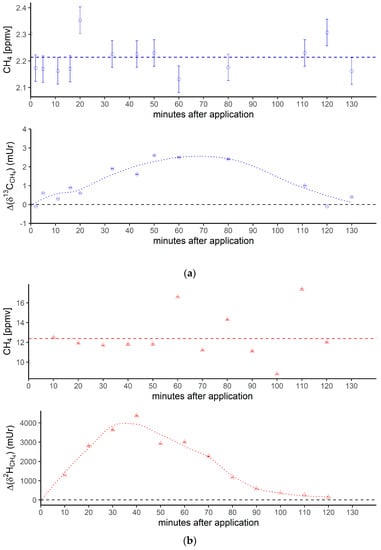
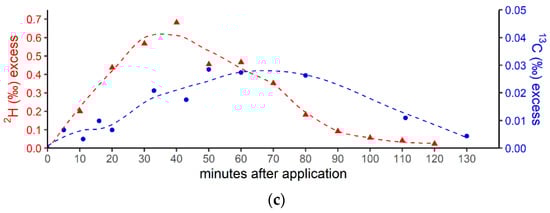
Figure 3.
(a) Breath CH4 production (top) and isotope difference as δ13C-CH4 values relative to control (bottom) after the oral intake of isotopically labeled 13C DMSO. The dashed line in the upper figure represents the CH4 mean value. Error bars represent a sum of the analytical uncertainties and statistical errors from triplicate measurements. (b) Breath CH4 production (top) and isotope difference of δ2H-CH4 values relative to the control (bottom) after the oral intake of isotopically labeled 2H DMSO. The dashed line in the upper figure represents the CH4 mean value. Error bars represent a sum of analytical uncertainties and statistical errors from triplicate measurements, and lie within the symbols. (c) 2H (red) and 13C (blue) isotopic excess after the oral administration of labeled 13C and 2H DMSO, respectively.
At the beginning and end of the experiment (after 130 min) the Δδ13C-CH4 and Δδ2H-CH4 values of around 0 mUr closely reflected the average isotopic signature of the volunteer’s breath δ13C-CH4 values and δ2H-CH4 values. For details regarding the determination of the volunteer’s isotope CH4 source signatures observed for several periods in 2018 and 2019 without any treatment of isotopically labeled compounds, see the Supplementary Materials. Within a few minutes of the oral intake of isotopic labeled DMSO, the Δδ13C-CH4 and Δδ2H-CH4 values substantially increased toward less negative relative δ13C/2H-CH4 values, resulting in positive Δ values and becoming clearly distinguishable from background values. Maximum increases in Δ values of around 2.5 mUr and 4000 mUr for carbon and hydrogen, respectively, were found between 60 and 40 min. Afterward, the Δδ13C-CH4 and Δδ2H-CH4 values steadily decreased, almost reaching the initial δ13C/2H-CH4 values after 130 min.
In addition, Figure 3c compares the excess of the isotopic labels in the released breath CH4 from the supplemented 13C- and 2H-DMSO. The excess in both 13C-CH4 and 2H-CH4 gradually increased, with maximum values observed at 40 min for 2H-CH4 (~0.68‰) and 50 min for 13C-CH4 (~0.028‰). The calculated time integral (area under the curve) values were 37 and 2.14 for 2H-CH4- and 13C-CH4-excess, respectively. Both isotope tracers evidently indicated partial conversion of the methyl group of DMSO to CH4 by processes within the human body. The calculated time integral found for 2H-CH4 was by a factor of around 17 higher when compared with 13C-CH4. In this context, it should be noted that the amount of applied isotope 13C-labeling of DMSO was much lower for the 13C experiments (see the Discussion section).
3.2. Blood Samples and Addition of Isotopically Labeled DMSO and Methionine
The supplementation of 13C-labeled DMSO and methionine at equimolar concentrations of 1 mM to the blood samples incubated for 24 h (first day) at 36 °C resulted in mean Δδ13C-CH4 values of 95 ± 36 mUr and 2.2 ± 0.5 mUr for DMSO and methionine, respectively (Figure 4). Repeated measurements of the same samples (after equilibration with laboratory air; see the Materials and Methods section) and another incubation period of 24 h (second day) exhibited lower mean Δδ13C-CH4 values, producing 70 ± 10 mUr and 0.24 ± 0.4 mUr for DMSO and methionine, respectively. The application of ten-fold higher concentrations of DMSO and methionine (10 mM) enhanced the formation of isotopically labeled CH4, with the Δδ13C-CH4 values producing 748 ± 362 mUr and 4.9 ± 3.5 mUr for DMSO and methionine, respectively. Again, repeated measurements of the same samples after another incubation period of 24 h (second day) exhibited lower mean Δδ13C-CH4 values, producing 588 ± 10 mUr and 1.4 ± 0.1 mUr for DMSO and methionine, respectively. Thus, the change in 10-fold concentrations was closely reflected by the change in Δδ13C-CH4 values (factor of ~8) for both days, whilst for methionine, the change in Δδ13C-CH4 values was lower (factors of 2.2 and 5.7 for day 1 and day 2, respectively). All control samples including blood without the addition of isotopically labeled compounds did not show any measurable difference in δ13C-CH4 values over the incubation time.
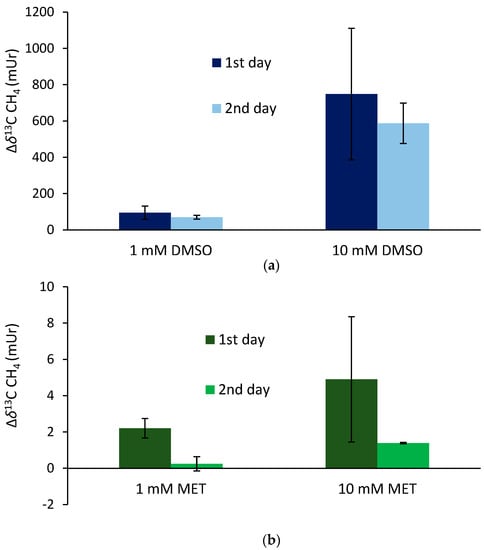
Figure 4.
Isotope difference (relative to the control values) of δ13C-CH4 values of headspace air after the treatment of blood samples with 13C-labeled DMSO (a) and methionine (b) incubated over two days at a temperature of 36 °C. Mean values of three replicated experiments (n = 3) are shown and error bars mark the SD. Control samples (blood without the addition of isotopically labeled compounds) did not show any measurable difference in δ13C-CH4 values over the incubation time, and thus, are not graphically illustrated.
3.3. Skin Application of Isotopically Labeled DMSO and Incubation of Arm with Exposure to Natural Sunlight
Figure 5 shows the isotope difference as δ13C-CH4 values relative to the control values after the application of 13C-labeled DMSO on the left forearm. Subsequent to the DMSO application, the δ13C-CH4 values increased by 30 mUr within 1 h. After the volunteer exposed his left forearm to natural sunlight in the field, a maximum Δδ13C-CH4 value of 50 mUr was observed. Please note that direct measurements during exposure to sunlight in the field were not possible. For experimental details, we refer the reader to the Materials and Methods section. After 24 h, δ13C-CH4 values measured for CH4 release from the skin of the left forearm were still enriched by 4 mUr, whilst the control values (the incubation of the untreated right forearm) did not show any measurable changes. Again, exposure to sunlight in the field and subsequent laboratory measurements of CH4 release from the skin of the forearm increased the Δδ13C-CH4 value to 6 mUr. After 48 h, the δ13C-CH4 values monitored from the release of the skin still showed a marginal but measurable 13C enrichment of 1 mUr. After sunlight irradiation, no measurable increase in δ13C-CH4 values was noted. The associated CH4 concentrations of the chamber measurement series showed changes in the range of 1.96 to 2.08 ppmv, which were close to the variations observed for the control measurements.
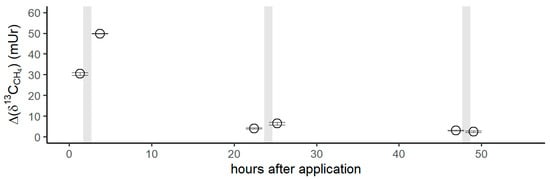
Figure 5.
Isotope difference of δ13C-CH4 values (Δδ13C-CH4) relative to the control values after the application of 13C DMSO on the left forearm of the volunteer. Grey vertical lines represent periods of exposure to sunlight.
4. Discussion
4.1. Conversion of Methylated Sulfur Compounds to Methane
The three sets of experiments—involving the application of two potential CH4 precursor compounds, DMSO and methionine, with isotopic labels—provided independent lines of evidence for partial conversion of the supplemented methyl group to CH4 in the human body. The combination of the three experiments (oral intake, blood incubations, and skin application) was undertaken to confirm that CH4 is endogenously formed in humans via a ROS-driven process without involvement of the well-known microbial sources (methanogens) occurring under anoxic conditions in the gastrointestinal tracts. However, we are aware that it is almost impossible to exclude the contribution of microbes during the screening of humans for CH4 emissions.
4.2. Oral Administration of 13C-Labeled DMSO
The measured isotopic changes for the two labeling experiments (Figure 3) unambiguously demonstrated that the methyl group of DMSO was converted to CH4. The 2H and 13C excess values indicated that only a marginal fraction (0.68‰ and 0.028‰) of the CH4 concentration measured in the subject’s breath air (~2 to 16 ppmv) was actually derived from the isotopically labeled precursor methyl groups of DMSO. The observed variabilities in concentrations during the individual experiments (Figure 3a,b, top panels) were in the range of the intraday fluctuations. The observed difference in CH4 base levels of approximately 10 ppmv between the experiments with 13C DMSO and 2H DMSO reflected usual changes in the individual’s breath CH4 state, as the two experiments were performed a few months apart. For details regarding the variabilities of CH4 base levels of the volunteer, see Polag and Keppler [37,38]. The small concentration changes indicated by the supplementation of 13C-labeled DMSO would be nondetectable when using conventional measurement techniques, and can only be traced using isotopic labeling techniques. To better compare the conversion of the two labeling approaches, it is necessary to consider the 2H/13C excess values, as shown in Figure 3c. The calculated time integrals of the 2H-CH4- and 13C-CH4 excesses were 37 and 2.14, respectively, and thus, the time integral found for the 2H-CH4 excess was higher by a factor of around 17 when compared with the 13C-CH4 excess. Please note that the 2H-CH4 excess time integral of 37 included three deuterium atoms from a 2H-labeled methyl group and a fourth, unlabeled hydrogen atom (see Figure 6). To correct for this effect, the time integral of 2H increased to 49, and the differences between the excess values of 2H-CH4 and 13C-CH4 changed to a factor of 23. This value closely reflected the relationship between orally administered 2H and 13C isotope tracers (factor of 34). The reason for applying different amounts of 2H/13C DMSO isotopic labels was due to financial issues, as 2H-labeled DMSO is considerably cheaper than 13C-labeled DMSO. Nevertheless, both isotope tracers independently and clearly indicated similar conversion rates of the methyl group of DMSO when normalized to the amount of applied isotopic tracer. We suggest that the observed CH4 formation is indicative of the formation of methyl radicals from DMSO induced by hydroxyl radicals or oxo-iron(IV) species, as recently proposed by Ernst et al. [17], Benzing et al. [52], and Althoff et al. [51] for biological and abiotic chemical systems. Once methyl radicals are formed, they can react with a hydrogen atom from hydrocarbons, hydrogen peroxide, or hydrogen carbonate to form CH4. The formation of 13C-enriched CH4 was already measurable a few minutes after the oral intake of the labeled substance for both isotope labeling experiments (2H and 13C). However, around 2 h after the oral administration, CH4 formation from DMSO was barely detectable in the breath air, potentially implying that most of the DMSO was converted in the human body within this timespan. A possible decay mechanism is the conversion of DMSO to dimethyl sulfide (DMS) by the molybdoenzyme DMSO reductase, which is widespread in all domains of life [69]. A recently proposed mechanism of DMSO reductase can be found in Le et al. [70].
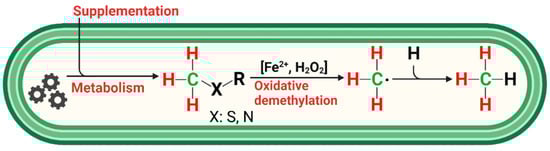
Figure 6.
Simplified reaction scheme for endogenous CH4 formation in humans. Methylated S-/N-compounds produced via metabolism or externally supplemented act as •OH scavengers or react with oxo-iron(IV) ([FeIV=O]2+) to produce methyl radicals. Activation of hydrogen peroxide by ferrous iron (Fenton systems) leads to several oxidizing agents, such as [FeIV=O]2+ or hydroxyl radicals, depending on the reaction conditions. Subsequently, CH4 is formed through the reaction of a methyl radical with a hydrogen atom derived from hydrocarbons, hydrogen peroxide, or hydrogen carbonate. Red and green indicate hydrogen and carbon atoms, respectively, of methylated sulfur compounds labeled with 2H and 13C, as applied in this study to subsequently trace the formation of CH4 in humans.
4.3. Supplementation of 13C-Labeled DMSO and Methionine to Blood Samples
The experiments with blood samples were conducted to further demonstrate the non-microbial formation of CH4 when different S-methylated compounds were supplemented. When equimolar amounts of DMSO and methionine were added to the blood samples, the conversion of S-methyl-bonded groups to CH4 was much higher for DMSO than for methionine, with factors ranging from 43 to 423. It is well known that DMSO is a potent hydroxyl radical scavenger [71] that forms CH4; ethane; and oxidized C1 compounds, such as formaldehyde and formate, depending on the experimental conditions [72,73,74]. The observed differences between the application of DMSO and methionine are in line with previous experiments conducted by Althoff et al. [51] and Ernst et al. [17], who showed the preferential formation of ROS-induced formation of CH4 from DMSO relative to methionine in chemical systems and living organisms, respectively. However, in our study, the difference between DMSO and methionine was even more pronounced and might be explained by the specific composition of the blood samples, i.e., amounts and availability of iron species and ROS. In addition, methionine needs to be oxidized to methionine sulfoxide before the methyl groups can be cleaved off [51]. Human blood and plasma contain high amounts of iron species, particularly in the form of hemoglobin, and the range of H2O2 might be in a normal concentration range of 1–5 µM but increases to 30–50 µM during chronic inflammation in certain disease states [75]. Thus, the interplay between iron species and ROS in blood might be highly supportive for the formation of CH4 given that the required methyl precursor compounds are also available. Interestingly, a ten-fold higher DMSO supplementation was well reflected by the amounts of formed labeled CH4 (factor of ~8), whilst a considerably lower increase was observed (mean factor of ~4) for the addition of methionine. It was also obvious that CH4 formation from DMSO was observable for much longer (at least for 48 h) in the blood samples when compared with the oral administration of DMSO (see section above), indicating that different degradation processes in the human body might have contributed to the observed pattern.
4.4. Dermal CH4 Emissions after Treatment of Isotopically Labeled DMSO
The application of 13C-labeled DMSO on the volunteer’s forearm clearly showed the release of isotopically labeled CH4 immediately after incubation of the penetrated skin section (Figure 5) under laboratory conditions. Based on our current understanding—including knowledge of ROS-driven CH4 formation, and that DMSO rapidly penetrates through human skin—this observation is highly indicative of methyl radical formation induced by ROS that occurs in the epidermis or dermis of the skin. There is frequent formation of ROS in the cells and it is well known that skin exposure to light—including wavelengths of visible, UVA/UVB, and IR light —induces and increases ROS levels [76,77]. After the volunteer exposed his left forearm to natural sunlight in the field for 1 h, a strong isotope change in δ13C-CH4 values (~70% higher relative to laboratory light exposure) was measured, even though these measurements were conducted after exposure to direct solar radiation. This implies that enhanced levels of ROS were caused by the irradiation of solar light, leading to the formation of CH4, which could only be made visible by the administration of 13C-labeled DMSO. After around 24 h, the release of 13C-labeled CH4 from the skin under laboratory incubation conditions was still measurable and increased again (by about 50%) after the exposure of the skin to natural sunlight. When repeating the same procedure after 48 h, a small but indicative change in δ13C-CH4 values was still observed for the laboratory exposure incubations of the forearm. No additional increase in δ13C-CH4 values could be measured for the effect of natural sunlight. However, it was remarkable to observe DMSO-related liberation of CH4 from the skin even 50 h after the application of 13C-labeled DMSO. There exist only a few studies that dealt in detail with the release of CH4 from human skin, and in general, these emissions are considered to be much smaller than those measured for breath release [35]. This was recently confirmed by Li et al. [78], who quantified dermal and exhaled CH4 of 20 volunteers using climate chambers and reported that the average estimated exhaled CH4 release rate was about 19 (max. range 13–37) times higher than the average dermal CH4 emission rate. For completeness, it should be noted that Mochalski et al. [79] measured emission rates of selected volatile organic compounds from the skin of healthy volunteers. However, the researchers did not detect CH4, as they screened for larger carbon compounds, including C4 to C10 substances, and found relatively large emissions for three volatiles: acetone, acetaldehyde, and 6-methyl-5-hepten-2-one.
4.5. ROS-Induced non-Microbial Formation of CH4 from Methylated S-/N-Compounds in Humans: A Hypothesis
The observed formation of CH4 from the S-bonded methyl groups of DMSO or methionine provides strong support for a radical-driven process of CH4 formation. Based on the three applied isotopic labeling experiments and a previous study demonstrating ROS-driven CH4 formation from in vitro experiments of many organisms [17], we propose a reaction scheme showing the interplay of methyl precursors, ROS, and iron species that eventually leads to the formation of CH4 in humans (Figure 6).
The three major players in this reaction scheme are ROS, iron, and methyl groups bonded to sulfur and nitrogen compounds. Below, we briefly summarize their role in humans with respect to non-microbial CH4 formation.
Initially considered principally toxic, today, ROS are well-known for having beneficial or deleterious effects in aerobic organisms [59,80,81,82]. The concentration of H2O2 in the normal cytoplasm, mitochondrial matrix, and endoplasmic reticulum (ER) lumen varies by several orders of magnitude (from 80 pM to 700 nM) [83] and is even higher in blood and plasma at normal concentrations of 1–5 µM, but increases to 30–50 µM during chronic inflammation in certain disease states [75]. On the one hand, ROS play various roles in the cellular functioning of aerobic organisms, are involved in many redox-governing activities of the cells for the preservation of cellular homeostasis, and are required for many important signaling reactions. On the other hand, elevated ROS levels can lead to severe damage in cells. In this context, it was suggested that frequently increased oxidative stress leads to an overproduction of ROS, causing many diseases and a variety of age-related disorders, such as Parkinson’s disease, Alzheimer’s dementia, chronic inflammatory diseases, atherosclerosis, heart attacks, cancer, ischaemia/reperfusion injury, and arteriosclerosis. Thus, it can be easily envisaged that CH4 might be formed at highly fluctuating levels in different organelles and might potentially serve to monitor enhanced ROS levels in humans. This hypothesis is supported by the results of several recent monitoring studies:
(I) The observation that breath CH4 levels increase with advanced age [24] might be an indication of the human age-related increase in systemic inflammation accompanied by enhanced ROS levels. (II) Long-term monitoring studies of breath CH4 from several volunteers provided evidence that abrupt deviations in breath CH4 levels from baseline were linked to inflammatory processes and immune reactions [37]. In this context, infectious diseases were mostly accompanied by temporarily elevated breath CH4 formation. Next, it was hypothesized that vaccinations as induced perturbations of the immune system might cause substantial fluctuations in the breath CH4 level of people, indicating individual immune responses and immune states. (III) This was recently shown by Polag and Keppler [38], who investigated the breath CH4 levels after COVID-19 vaccination. They clearly found large deviations from the average breath CH4 values after vaccination and concluded that these deviations were likely related to immune reactions and may have also originated from redox homeostasis in cells. A change in the breath CH4 levels from individual baseline values could be used to monitor changes in levels of ROS and oxidative stress, and could potentially be used to classify immune responses. (IV) Finally, Tuboly et al. [84] investigated the possibility of CH4 generation in low-CH4 emitters that consumed high doses of ethanol with the aim to increase oxidative stress. A transient, significant CH4 production was noted after an excessive ethanol intake. The researchers found similar results when they repeated the ethanol experiments with rats. They further investigated the hypothesis that L-alpha-glycerylphosphorylcholine (GPC) may influence CH4 formation through the modulation of alcohol-induced mitochondrial dysfunction.
This brings us to the next point: to counteract oxidative stress, aerobic cells possess many antioxidative systems that function to keep the ROS level in a non-toxic range. Methyl precursors—particularly those where the methyl group is bonded to sulfur and nitrogen compounds—can readily be cleaved off to produce CH4 or oxidized C1 species [17,51,52]. The various available S-/N-methylated compounds in biological systems will cause different efficiencies of CH4 production and consumption of ROS. DMSO is not produced in humans and is only consumed via the diet in relatively small quantities [85]. However, this effective radical scavenger was ideally suited to test the hypothesis of non-microbial CH4 formation in humans. It is non-toxic in the applied doses, penetrates rapidly through human skin, and is easily distributed in the body, as it dissolves in both polar and nonpolar compounds. On the other hand, the other applied S-methylated compound, namely, methionine, is an essential amino acid in humans that has an important role in metabolism and health. It is the precursor of other important compounds, such as cysteine, S-adenosyl methionine (SAM), and glutathione. It was also shown to produce CH4, albeit at much lower conversion rates when compared with DMSO.
Nitrogen-methylated substances, such as choline (2-Hydroxyethyl-trimethylammonium), are formed in humans but are also essential compounds for maintaining health. Therefore, they must be consumed by diet as choline or as choline phospholipids. Large amounts of choline are stored in the human cell membranes and organelles as phospholipids, and inside cells as phosphatidylcholines and GPC. Choline was shown to form CH4 in a chemical model system containing iron and hydrogen peroxide [51,86] but this was not confirmed in bacterial culture experiments [17]. Tuboly et al. [84] showed that exogenous GPC protected against ethanol-induced mitochondrial electron transport chain dysfunction in rat liver, which is the primary target of alcohol-induced oxido-reductive stress. Therefore, the exogenous addition of methylated compounds might strongly increase CH4 production and ROS consumption. In this context, it is of interest to further discuss the potential role of DMSO as an effective scavenger of radicals to counteract enhanced oxidative stress induced by ROS. DMSO has already been investigated for many years, but its beneficial role for medical use remains highly uncertain (see the Introduction section).
Finally, the concentration of free iron (in the form of iron(II)) is of importance for the enhanced production of hydroxyl radicals (Fenton-type reactions) in biological systems [59]. However, inappropriately low or high levels of iron are detrimental and contribute to a wide range of diseases [87]; therefore, understanding the dysregulation of iron metabolism is crucial in the search for therapeutics [88]. Harmful oxidative distress could be observed in states of both iron deficiency (anemia) and overload (ferroptosis) [89]. It is plausible that appropriate supplementation of iron is beneficial to health, which may be related to its role in contributing to the homeostasis of cellular ROS through the production of CH4.
A detailed understanding of the interplay between ROS, iron, and methylated substrates in humans is necessary to better understand radical-driven CH4 and to answer the question of whether the cellular formation of CH4 has a physiological role in humans. In this context, monitoring CH4 as an indicator for ROS-driven processes could be a promising approach in biochemical research, where breath CH4 could be used as a diagnostic tool in the fields of system biology and precision medicine. This could include the application of isotopic labeling experiments of methylated precursor substances (with a 13C or 2H label), as this approach could specifically visualize ROS-related CH4 generation, and thus, overcome the problem of higher breath CH4 background concentrations derived from microbial sources. These changes may be interesting for diagnostic purposes. Moreover, the possibility exists that such changes may affect the overall cellular response to intracellular hypoxia. Simple asphyxiants, such as CH4, act by physically limiting the utilization of oxygen and can modify the symbiosis with other gaseous compounds within the internal milieu of aerobic cells. Although CH4 is conventionally believed to be physiologically inert, a comprehensive view of its biological effects in various hypoxic and inflammatory scenarios was demonstrated [90]. Notably, it was shown that CH4 can modulate the pathways involved in key events of inflammation via master switches, such as Nrf2/Keap1 and NF-κB (for a review, see [18]). Several studies also demonstrated that exogenous CH4 modulates the intrinsic, mitochondrial pathway of pro-apoptotic activation in model experiments [91]. Furthermore, sequential in vitro studies with exogenous normoxic CH4 in simulated ischemia-reperfusion environments provided evidence that CH4 preserves the mitochondrial respiratory capacity in cells exposed to anoxia [92]. In a similar protocol, CH4 treatment restricted the forward electron transfer within complex I in control mitochondria while effectively restricting reverse electron transport (RET) in post-anoxic mitochondria. In parallel studies, CH4 influenced several components of the endoplasmic reticulum-mitochondria-related pro-apoptotic signaling pathways, the oxidative phosphorylation capacity was more preserved, and the relative mRNA expression for hypoxia- and ER stress-associated genes (including HIF-1α) was significantly reduced [93]. For a detailed discussion regarding the potential applications of monitoring CH4 in medical research and health sciences, see [18,38,94,95].
5. Conclusions
We are aware that the investigation of ROS-driven cellular CH4 formation in only one subject is too low of a sample size to draw broad and general conclusions. However, this study represents the first proof of concept that cellular CH4 formation occurs in the human body and is most likely a result of the interplay between ROS and methylated substrates. This process can currently only be made clearly visible by applying stable-isotope-tracing techniques to distinguish CH4 formation in humans from that of microbes living in the gastrointestinal tract. Together with other recently published studies [17,38,94], it is becoming obvious that ROS-driven CH4 formation might be a necessary phenomenon of aerobic life. Consequently, non-microbial aerobic CH4 formation should be highly variable in time and source strength, as it may be an integral part of the cellular responses toward changes in oxidative status present in humans. Large changes in human breath levels were observed by several recent monitoring studies [38,78,84], and some suggested that variations in CH4 breath levels are unlikely to be explained by microbial formation in the human digestive system. However, additional investigations are required to obtain unambiguous evidence of non-microbial CH4 formation in humans and the underlying processes of its generation. This will be a significant challenge because in the case of high emitters—where CH4 formation by methanogens is the dominant process—it is difficult to distinguish between the non-microbial and microbial pathways of CH4 production. Nevertheless, for low and medium CH4 emitters, who comprise about 70% of the global population, we suggest that substantially changed human breath CH4 levels from individual baseline values may be used to detect changes in oxidative stress and ROS levels, and could potentially be used to classify immune responses, as recently suggested by Polag and Keppler [38]. Therefore, future investigations should focus on deciphering the potential physiological role of CH4 formation in humans, as well as on the monitoring of CH4 as an indicator for individual immune states and a potential biomarker of oxidative stress. In addition, revisiting and studying in greater detail the potential role of DMSO as an effective hydroxyl radical scavenger and its use for human medical research might be worthwhile.
Supplementary Materials
The Supplementary Materials for this article can be downloaded from https://www.mdpi.com/article/10.3390/antiox12071381/s1. Figures S1 and S2: Determination of stable isotope source signatures of CH4 using keeling plots: Photo S1: Arm incubation chamber for online measurements using CRDS; Table S1: Overview and timeline of isotope labeling experiments.
Author Contributions
F.K. conceived the study, conducted the experiments, and analyzed the samples. F.K. and D.P. discussed and evaluated the data and prepared graphical illustrations of the data. M.B. provided critical discussion on the medical aspects of the experiments and results. The manuscript was written under the lead of F.K., with contributions from M.B. and D.P. All authors have read and agreed to the published version of the manuscript.
Funding
This research received no external funding.
Institutional Review Board Statement
The study was conducted in accordance with the Declaration of Helsinki, and it was approved by the Medical Research Council of Hungary (ETT-TUKEB) as part of the protocol “Mapping metabolic pathways of endogenous gas formation by isotopic analysis of the gas composition of human samples” (6420-8-2023/EUIG/768).
Informed Consent Statement
Informed consent was obtained from all subjects involved in the study.
Data Availability Statement
The data used in this publication are available to the community and can be accessed by request to the corresponding author.
Acknowledgments
We kindly thank the Biogeochemistry group of the Institute of Earth Sciences at Heidelberg University for their technical support in this study. We also thank Leonard Ernst for drawing Figure 6. We are grateful to John Hamilton for providing comments on an earlier version of the manuscript. This paper is dedicated to J.T.G Hamilton, who died in April 2022.
Conflicts of Interest
The authors declare no conflict of interest.
Abbreviations
| AscariteII® | sodium-hydroxide-coated silica |
| C | carbon |
| CH4 | methane |
| •CH3 | methyl radicals |
| CO3–• | carbonate radicals |
| CO2 | carbon dioxide |
| CRDS | cavity ringdown spectroscopy |
| D | deuterium |
| DMSO | dimethyl sulfoxide |
| Drierite® | anhydrous calcium sulfate |
| ER | endoplasmatic reticulum |
| EDTA | Ethylenediaminetetraacetic acid |
| FDA | Food and Drug Administration |
| [FeIV=O]2+ | nonheme oxo-iron(IV) |
| Fe2+ | ferrous iron |
| Fe3+ | ferric iron |
| FID | flame ionization detector |
| GC | gas chromatography |
| GPC | L-alpha-glycerylphosphorylcholine |
| H2 | hydrogen |
| H2O2 | hydrogen peroxide |
| IAEA | International Atomic Energy Agency |
| IRMS | isotopic ratio mass spectrometry |
| N | nitrogen |
| NIST | National Institute of Standards and Technology |
| •OH | hydroxyl radicals |
| O2–• | superoxide radicals |
| PI | principal investigator |
| ppvb | parts per billion by volume |
| ppmv | parts per million by volume |
| PTFE | polytetrafluorethylene |
| RET | reverse electron transport |
| ROS | reactive oxygen species |
| S | sulfur |
| SAM | S-adenosyl methionine |
| SD | standard deviation |
| SI | system of units |
| TC | thermal conversion |
| mUr | milliurey |
| V-PDB | Vienna Pee Dee Belemnite |
| V-SMOW | Vienna Standard Mean Ocean Water |
References
- Saunois, M.; Stavert, A.R.; Poulter, B.; Bousquet, P.; Canadell, J.G.; Jackson, R.B.; Raymond, P.A.; Dlugokencky, E.J.; Houweling, S.; Patra, P.K.; et al. The Global Methane Budget 2000–2017. Earth Syst. Sci. Data 2020, 12, 1561–1623. [Google Scholar] [CrossRef]
- Keppler, F.; Hamilton, J.T.G.; Brass, M.; Rockmann, T. Methane emissions from terrestrial plants under aerobic conditions. Nature 2006, 439, 187–191. [Google Scholar] [CrossRef] [PubMed]
- Liu, J.; Chen, H.; Zhu, Q.; Shen, Y.; Wang, X.; Wang, M.; Peng, C. A novel pathway of direct methane production and emission by eukaryotes including plants, animals and fungi: An overview. Atmos. Environ. 2015, 115, 26–35. [Google Scholar] [CrossRef]
- Martel, A.B.; Qaderi, M.M. Unravelling the effects of blue light on aerobic methane emissions from canola. J. Plant Physiol. 2019, 233, 12–19. [Google Scholar] [CrossRef] [PubMed]
- McLeod, A.R.; Fry, S.C.; Loake, G.J.; Messenger, D.J.; Reay, D.S.; Smith, K.A.; Yun, B.W. Ultraviolet radiation drives methane emissions from terrestrial plant pectins. New Phytol. 2008, 180, 124–132. [Google Scholar] [CrossRef] [PubMed]
- Qaderi, M.M.; Reid, D.M. Methane emissions from six crop species exposed to three components of global climate change: Temperature, ultraviolet-B radiation and water stress. Physiol. Plant. 2009, 137, 139–147. [Google Scholar] [CrossRef]
- Wang, Z.-P.; Chang, S.X.; Chen, H.; Han, X.-G. Widespread non-microbial methane production by organic compounds and the impact of environmental stresses. Earth-Sci. Rev. 2013, 127, 193–202. [Google Scholar] [CrossRef]
- Lenhart, K.; Althoff, F.; Greule, M.; Keppler, F. Technical Note: Methionine, a precursor of methane in living plants. Biogeosciences 2015, 12, 1907–1914. [Google Scholar] [CrossRef]
- Tuboly, E.; Szabo, A.; Garab, D.; Bartha, G.; Janovszky, A.; Eros, G.; Szabo, A.; Mohacsi, A.; Szabo, G.; Kaszaki, J.; et al. Methane biogenesis during sodium azide-induced chemical hypoxia in rats. Am. J. Physiol.-Cell Physiol. 2013, 304, C207–C214. [Google Scholar] [CrossRef]
- Ghyczy, M.; Torday, C.; Kaszaki, J.; Szabo, A.; Czobel, M.; Boros, M. Hypoxia-induced generation of methane in mitochondria and eukaryotic cells—An alternative approach to methanogenesis. Cell. Physiol. Biochem. 2008, 21, 251–258. [Google Scholar] [CrossRef]
- Lenhart, K.; Bunge, M.; Ratering, S.; Neu, T.R.; Schüttmann, I.; Greule, M.; Kammann, C.; Schnell, S.; Müller, C.; Zorn, H.; et al. Evidence for methane production by saprotrophic fungi. Nat. Commun. 2012, 3, 1046. [Google Scholar] [CrossRef] [PubMed]
- Schroll, M.; Keppler, F.; Greule, M.; Eckhardt, C.; Zorn, H.; Lenhart, K. The stable carbon isotope signature of methane produced by saprotrophic fungi. Biogeosciences 2020, 17, 3891–3901. [Google Scholar] [CrossRef]
- Hartmann, J.F.; Günthel, M.; Klintzsch, T.; Kirillin, G.; Grossart, H.-P.; Keppler, F.; Isenbeck-Schröter, M. High Spatiotemporal Dynamics of Methane Production and Emission in Oxic Surface Water. Environ. Sci. Technol. 2020, 54, 1451–1463. [Google Scholar] [CrossRef] [PubMed]
- Klintzsch, T.; Langer, G.; Wieland, A.; Geisinger, H.; Lenhart, K.; Nehrke, G.; Keppler, F. Effects of Temperature and Light on Methane Production of Widespread Marine Phytoplankton. J. Geophys. Res. Biogeosciences 2020, 125, e2020JG005793. [Google Scholar] [CrossRef]
- Lenhart, K.; Klintzsch, T.; Langer, G.; Nehrke, G.; Bunge, M.; Schnell, S.; Keppler, F. Evidence for methane production by the marine algae Emiliania huxleyi. Biogeosciences 2016, 13, 3163–3174. [Google Scholar] [CrossRef]
- Bižić, M.; Klintzsch, T.; Ionescu, D.; Hindiyeh, M.Y.; Günthel, M.; Muro-Pastor, A.M.; Eckert, W.; Urich, T.; Keppler, F.; Grossart, H.-P. Aquatic and terrestrial cyanobacteria produce methane. Sci. Adv. 2020, 6, eaax5343. [Google Scholar] [CrossRef]
- Ernst, L.; Steinfeld, B.; Barayeu, U.; Klintzsch, T.; Kurth, M.; Grimm, D.; Dick, T.P.; Rebelein, J.G.; Bischofs, I.B.; Keppler, F. Methane formation driven by reactive oxygen species across all living organisms. Nature 2022, 603, 482–487. [Google Scholar] [CrossRef]
- Boros, M.; Keppler, F. Methane Production and Bioactivity—A Link to Oxido-Reductive Stress. Front. Physiol. 2019, 10, 1244. [Google Scholar] [CrossRef]
- Bond, J.H., Jr.; Engel, R.R.; Levitt, M.D. Factors influencing pulmonary methane excretion in man. An indirect method of studying the in situ metabolism of the methane-producing colonic bacteria. J. Exp. Med. 1971, 133, 572–588. [Google Scholar] [CrossRef]
- Levitt, M.D.; Furne, J.K.; Kuskowski, M.; Ruddy, J. Stability of human methanogenic flora over 35 years and a review of insights obtained from breath methane measurements. Clin. Gastroenterol. Hepatol. 2006, 4, 123–129. [Google Scholar] [CrossRef]
- Peled, Y.; Weinberg, D.; Hallak, A.; Gilat, T. Factors affecting methane production in humans. Dig. Dis. Sci. 1987, 32, 267–271. [Google Scholar] [CrossRef] [PubMed]
- Keppler, F.; Schiller, A.; Ehehalt, R.; Greule, M.; Hartmann, J.; Polag, D. Stable isotope and high precision concentration measurements confirm that all humans produce and exhale methane. J. Breath Res. 2016, 10, 016003. [Google Scholar] [CrossRef] [PubMed]
- Hopkins, M.J.; Sharp, R.; Macfarlane, G.T. Age and disease related changes in intestinal bacterial populations assessed by cell culture, 16S rRNA abundance, and community cellular fatty acid profiles. Gut 2001, 48, 198–205. [Google Scholar] [CrossRef] [PubMed]
- Polag, D.; Leiß, O.; Keppler, F. Age dependent breath methane in the German population. Sci. Total Environ. 2014, 481, 582–587. [Google Scholar] [CrossRef]
- Mello, C.S.; Tahan, S.; Melli, L.C.; Rodrigues, M.S.; de Mello, R.M.; Scaletsky, I.C.; de Morais, M.B. Methane production and small intestinal bacterial overgrowth in children living in a slum. World J. Gastroenterol. 2012, 18, 5932–5939. [Google Scholar] [CrossRef]
- Pitt, P.; de Bruijn, K.M.; Beeching, M.F.; Goldberg, E.; Blendis, L.M. Studies on breath methane: The effect of ethnic origins and lactulose. Gut 1980, 21, 951–954. [Google Scholar] [CrossRef]
- Triantafyllou, K.; Chang, C.; Pimentel, M. Methanogens, methane and gastrointestinal motility. J. Neurogastroenterol. Motil. 2014, 20, 31–40. [Google Scholar] [CrossRef]
- Szabó, A.; Ruzsanyi, V.; Unterkofler, K.; Mohácsi, Á.; Tuboly, E.; Boros, M.; Szabó, G.; Hinterhuber, H.; Amann, A. Exhaled methane concentration profiles during exercise on an ergometer. J. Breath Res. 2015, 9, 016009. [Google Scholar] [CrossRef]
- Conway de Macario, E.; Macario, A.J. Methanogenic archaea in health and disease: A novel paradigm of microbial pathogenesis. Int. J. Med. Microbiol. 2009, 299, 99–108. [Google Scholar] [CrossRef]
- Furnari, M.; Savarino, E.; Bruzzone, L.; Moscatelli, A.; Gemignani, L.; Giannini, E.G.; Zentilin, P.; Dulbecco, P.; Savarino, V. Reassessment of the role of methane production between irritable bowel syndrome and functional constipation. J. Gastrointest. Liver Dis. 2012, 21, 157–163. [Google Scholar]
- Hwang, L.; Low, K.; Khoshini, R.; Melmed, G.; Sahakian, A.; Makhani, M.; Pokkunuri, V.; Pimentel, M. Evaluating breath methane as a diagnostic test for constipation-predominant IBS. Dig. Dis. Sci. 2010, 55, 398–403. [Google Scholar] [CrossRef] [PubMed]
- Kunkel, D.; Basseri, R.; Makhani, M.; Chong, K.; Chang, C.; Pimentel, M. Methane on Breath Testing Is Associated with Constipation: A Systematic Review and Meta-analysis. Dig. Dis. Sci. 2011, 56, 1612–1618. [Google Scholar] [CrossRef] [PubMed]
- Montes, R.G.; Saavedra, J.M.; Perman, J.A. Relationship between methane production and breath hydrogen excretion in lactose-malabsorbing individuals. Dig. Dis. Sci. 1993, 38, 445–448. [Google Scholar] [CrossRef]
- Roccarina, D.; Lauritano, E.C.; Gabrielli, M.; Franceschi, F.; Ojetti, V.; Gasbarrini, A. The Role of Methane in Intestinal Diseases. Am. J. Gastroenterol. 2010, 105, 1250–1256. [Google Scholar] [CrossRef] [PubMed]
- Polag, D.; Keppler, F. Global methane emissions from the human body: Past, present and future. Atmos. Environ. 2019, 214, 116823. [Google Scholar] [CrossRef]
- de Lacy Costello, B.P.; Ledochowski, M.; Ratcliffe, N.M. The importance of methane breath testing: A review. J. Breath Res. 2013, 7, 024001. [Google Scholar] [CrossRef]
- Polag, D.; Keppler, F. Long-term monitoring of breath methane. Sci. Total Environ. 2018, 624, 69–77. [Google Scholar] [CrossRef]
- Polag, D.; Keppler, F. COVID19-vaccination affects breath methane dynamics. bioRxiv 2022. [Google Scholar] [CrossRef]
- Boros, M.; Keppler, F. Production and Signaling of Methane. Gasotransmitters 2018, 12, 192. [Google Scholar]
- Abdulmajeed, A.M.; Derby, S.R.; Strickland, S.K.; Qaderi, M.M. Interactive effects of temperature and UVB radiation on methane emissions from different organs of pea plants grown in hydroponic system. J. Photochem. Photobiol. B Biol. 2017, 166, 193–201. [Google Scholar] [CrossRef]
- Abdulmajeed, A.M.; Qaderi, M.M. Intrashoot variation in aerobic methane emissions from pea plants exposed to multiple abiotic stresses. Acta Physiol. Plant. 2017, 39, 124. [Google Scholar] [CrossRef]
- Bruhn, D.; Mikkelsen, T.N.; Obro, J.; Willats, W.G.T.; Ambus, P. Effects of temperature, ultraviolet radiation and pectin methyl esterase on aerobic methane release from plant material. Plant Biol. 2009, 11, 43–48. [Google Scholar] [CrossRef] [PubMed]
- Fraser, W.T.; Blei, E.; Fry, S.C.; Newman, M.F.; Reay, D.S.; Smith, K.A.; McLeod, A.R. Emission of methane, carbon monoxide, carbon dioxide and short-chain hydrocarbons from vegetation foliage under ultraviolet irradiation. Plant Cell Environ. 2015, 38, 980–989. [Google Scholar] [CrossRef] [PubMed]
- Vigano, I.; Röckmann, T.; Holzinger, R.; van Dijk, A.; Keppler, F.; Greule, M.; Brand, W.A.; Geilmann, H.; van Weelden, H. The stable isotope signature of methane emitted from plant material under UV irradiation. Atmos. Environ. 2009, 43, 5637–5646. [Google Scholar] [CrossRef]
- Vigano, I.; van Weelden, H.; Holzinger, R.; Keppler, F.; McLeod, A.; Rockmann, T. Effect of UV radiation and temperature on the emission of methane from plant biomass and structural components. Biogeosciences 2008, 5, 937–947. [Google Scholar] [CrossRef]
- Messenger, D.J.; McLeod, A.R.; Fry, S.C. The role of ultraviolet radiation, photosensitizers, reactive oxygen species and ester groups in mechanisms of methane formation from pectin. Plant Cell Environ. 2009, 32, 1–9. [Google Scholar] [CrossRef]
- Althoff, F.; Jugold, A.; Keppler, F. Methane formation by oxidation of ascorbic acid using iron minerals and hydrogen peroxide. Chemosphere 2010, 80, 286–292. [Google Scholar] [CrossRef] [PubMed]
- Bruhn, D.; Moller, I.M.; Mikkelsen, T.N.; Ambus, P. Terrestrial plant methane production and emission. Physiol. Plant. 2012, 144, 201–209. [Google Scholar] [CrossRef]
- Bruhn, D.; Mikkelsen, T.N.; Rolsted, M.M.M.; Egsgaard, H.; Ambus, P. Leaf surface wax is a source of plant methane formation under UV radiation and in the presence of oxygen. Plant Biol. 2014, 16, 512–516. [Google Scholar] [CrossRef]
- Keppler, F.; Boros, M.; Frankenberg, C.; Lelieveld, J.; McLeod, A.; Pirttila, A.M.; Rockmann, T.; Schnitzler, J.P. Methane formation in aerobic environments. Environ. Chem. 2009, 6, 459–465. [Google Scholar] [CrossRef]
- Althoff, F.; Benzing, K.; Comba, P.; McRoberts, C.; Boyd, D.R.; Greiner, S.; Keppler, F. Abiotic methanogenesis from organosulphur compounds under ambient conditions. Nat. Commun. 2014, 5, 4205. [Google Scholar] [CrossRef]
- Benzing, K.; Comba, P.; Martin, B.; Pokrandt, B.; Keppler, F. Nonheme Iron-Oxo-Catalyzed Methane Formation from Methyl Thioethers: Scope, Mechanism, and Relevance for Natural Systems. Chem. Eur. J. 2017, 23, 10465–10472. [Google Scholar] [CrossRef] [PubMed]
- Baptista, L.; Clemente da Silva, E.; Arbilla, G. Oxidation mechanism of dimethyl sulfoxide (DMSO) by OH radical in liquid phase. Phys. Chem. Chem. Phys. 2008, 10, 6867–6879. [Google Scholar] [CrossRef] [PubMed]
- Herscu-Kluska, R.; Masarwa, A.; Saphier, M.; Cohen, H.; Meyerstein, D. Mechanism of the Reaction of Radicals with Peroxides and Dimethyl Sulfoxide in Aqueous Solution. Chem. Eur. J. 2008, 14, 5880–5889. [Google Scholar] [CrossRef] [PubMed]
- Illés, E.; Mizrahi, A.; Marks, V.; Meyerstein, D. Carbonate-radical-anions, and not hydroxyl radicals, are the products of the Fenton reaction in neutral solutions containing bicarbonate. Free Radic. Biol. Med. 2019, 131, 1–6. [Google Scholar] [CrossRef]
- Yu, G.-H.; Kuzyakov, Y. Fenton chemistry and reactive oxygen species in soil: Abiotic mechanisms of biotic processes, controls and consequences for carbon and nutrient cycling. Earth-Sci. Rev. 2021, 214, 103525. [Google Scholar] [CrossRef]
- Prousek, J. Fenton chemistry in biology and medicine. Pure Appl. Chem. 2007, 79, 2325–2338. [Google Scholar] [CrossRef]
- Kaplan, J.; Ward, D.M. The essential nature of iron usage and regulation. Curr. Biol. 2013, 23, R642–R646. [Google Scholar] [CrossRef]
- Mittler, R. ROS Are Good. Trends Plant Sci. 2017, 22, 11–19. [Google Scholar] [CrossRef]
- Enami, S.; Sakamoto, Y.; Colussi, A.J. Fenton chemistry at aqueous interfaces. Proc. Natl. Acad. Sci. USA 2014, 111, 623–628. [Google Scholar] [CrossRef]
- Dunbar, K.L.; Scharf, D.H.; Litomska, A.; Hertweck, C. Enzymatic Carbon–Sulfur Bond Formation in Natural Product Biosynthesis. Chem. Rev. 2017, 117, 5521–5577. [Google Scholar] [CrossRef] [PubMed]
- Jacob, S.W.; Herschler, R. Pharmacology of DMSO. Cryobiology 1986, 23, 14–27. [Google Scholar] [CrossRef]
- Amemori, S.; Iwakiri, R.; Endo, H.; Ootani, A.; Ogata, S.; Noda, T.; Tsunada, S.; Sakata, H.; Matsunaga, H.; Mizuguchi, M.; et al. Oral dimethyl sulfoxide for systemic amyloid A amyloidosis complication in chronic inflammatory disease: A retrospective patient chart review. J. Gastroenterol. 2006, 41, 444–449. [Google Scholar] [CrossRef] [PubMed]
- Galvao, J.; Davis, B.; Tilley, M.; Normando, E.; Duchen, M.R.; Cordeiro, M.F. Unexpected low-dose toxicity of the universal solvent DMSO. FASEB J. 2014, 28, 1317–1330. [Google Scholar] [CrossRef]
- Verheijen, M.; Lienhard, M.; Schrooders, Y.; Clayton, O.; Nudischer, R.; Boerno, S.; Timmermann, B.; Selevsek, N.; Schlapbach, R.; Gmuender, H.; et al. DMSO induces drastic changes in human cellular processes and epigenetic landscape in vitro. Sci. Rep. 2019, 9, 4641. [Google Scholar] [CrossRef]
- Hanley, B.P.; Bains, W.; Church, G. Review of Scientific Self-Experimentation: Ethics History, Regulation, Scenarios, and Views Among Ethics Committees and Prominent Scientists. Rejuvenation Res. 2019, 22, 31–42. [Google Scholar] [CrossRef] [PubMed]
- Einzmann, T.; Schroll, M.; Kleint, J.F.; Greule, M.; Keppler, F. Application of concentration and 2-dimensional stable isotope measurements of methane to constrain sources and sinks in a seasonally stratified freshwater lake. Front. Environ. Sci. 2022, 10, 865862. [Google Scholar] [CrossRef]
- Brand, W.A.; Coplen, T.B. Stable isotope deltas: Tiny, yet robust signatures in nature. Isot. Environ. Health Stud. 2012, 48, 393–409. [Google Scholar] [CrossRef]
- Miralles-Robledillo, J.M.; Torregrosa-Crespo, J.; Martínez-Espinosa, R.M.; Pire, C. DMSO Reductase Family: Phylogenetics and Applications of Extremophiles. Int. J. Mol. Sci. 2019, 20, 3349. [Google Scholar] [CrossRef]
- Le, C.; Bae, M.; Kiamehr, S.; Balskus, E.P. Emerging Chemical Diversity and Potential Applications of Enzymes in the DMSO Reductase Superfamily. Annu. Rev. Biochem. 2022, 91, 475–504. [Google Scholar] [CrossRef]
- Anbar, M.; Neta, P. A compilation of specific bimolecular rate constants for the reactions of hydrated electrons, hydrogen atoms and hydroxyl radicals with inorganic and organic compounds in aqueous solution. Int. J. Appl. Radiat. Isot. 1967, 18, 493–523. [Google Scholar] [CrossRef]
- Eberhardt, M.K.; Colina, R. The reaction of OH radicals with dimethyl sulfoxide. A comparative study of Fenton’s reagent and the radiolysis of aqueous dimethyl sulfoxide solutions. J. Org. Chem. 1988, 53, 1071–1074. [Google Scholar] [CrossRef]
- Lee, Y.; Lee, C.; Yoon, J. Kinetics and mechanisms of DMSO (dimethylsulfoxide) degradation by UV/H2O2 process. Water Res. 2004, 38, 2579–2588. [Google Scholar] [CrossRef]
- Lerner, A.; Kornweitz, H.; Zilbermann, I.; Yardeni, G.; Saphier, M.; Bar Ziv, R.; Meyerstein, D. Radicals in ‘biologically relevant’ concentrations behave differently: Uncovering new radical reactions following the reaction of hydroxyl radicals with DMSO. Free Radic. Biol. Med. 2021, 162, 555–560. [Google Scholar] [CrossRef]
- Forman, H.J.; Bernardo, A.; Davies, K.J.A. What is the concentration of hydrogen peroxide in blood and plasma? Arch. Biochem. Biophys. 2016, 603, 48–53. [Google Scholar] [CrossRef] [PubMed]
- Pathak, M.A.; Stratton, K. Free radicals in human skin before and after exposure to light. Arch. Biochem. Biophys. 1968, 123, 468–476. [Google Scholar] [CrossRef] [PubMed]
- Schroeder, P.; Lademann, J.; Darvin, M.E.; Stege, H.; Marks, C.; Bruhnke, S.; Krutmann, J. Infrared Radiation-Induced Matrix Metalloproteinase in Human Skin: Implications for Protection. J. Investig. Dermatol. 2008, 128, 2491–2497. [Google Scholar] [CrossRef] [PubMed]
- Li, M.; Bekö, G.; Zannoni, N.; Pugliese, G.; Carrito, M.; Cera, N.; Moura, C.; Wargocki, P.; Vasconcelos, P.; Nobre, P.; et al. Human metabolic emissions of carbon dioxide and methane and their implications for carbon emissions. Sci. Total Environ. 2022, 833, 155241. [Google Scholar] [CrossRef]
- Mochalski, P.; King, J.; Unterkofler, K.; Hinterhuber, H.; Amann, A. Emission rates of selected volatile organic compounds from skin of healthy volunteers. J. Chromatogr. B Analyt. Technol. Biomed. Life Sci. 2014, 959, 62–70. [Google Scholar] [CrossRef]
- Davies, K.J.A. Oxidative stress: The paradox of aerobic life. Biochem. Soc. Symp. 1995, 61, 1–31. [Google Scholar]
- Milkovic, L.; Cipak Gasparovic, A.; Cindric, M.; Mouthuy, P.A.; Zarkovic, N. Short Overview of ROS as Cell Function Regulators and Their Implications in Therapy Concepts. Cells 2019, 8, 793. [Google Scholar] [CrossRef]
- Zastrow, L.; Doucet, O.; Ferrero, L.; Groth, N.; Klein, F.; Kockott, D.; Lademann, J. Free Radical Threshold Value: A New Universal Body Constant. Ski. Pharmacol. Physiol. 2015, 28, 264–268. [Google Scholar] [CrossRef] [PubMed]
- Sies, H.; Jones, D.P. Reactive oxygen species (ROS) as pleiotropic physiological signalling agents. Nat. Rev. Mol. Cell Biol. 2020, 21, 363–383. [Google Scholar] [CrossRef] [PubMed]
- Tuboly, E.; Molnár, R.; Tőkés, T.; Turányi, R.N.; Hartmann, P.; Mészáros, A.T.; Strifler, G.; Földesi, I.; Siska, A.; Szabó, A.; et al. Excessive alcohol consumption induces methane production in humans and rats. Sci. Rep. 2017, 7, 7329. [Google Scholar] [CrossRef]
- Pearson, T.W.; Dawson, H.J.; Lackey, H.B. Naturally occurring levels of dimethyl sulfoxide in selected fruits, vegetables, grains, and beverages. J. Agric. Food Chem. 1981, 29, 1089–1091. [Google Scholar] [CrossRef] [PubMed]
- Ghyczy, M.; Torday, C.; Boros, M. Simultaneous generation of methane, carbon dioxide, and carbon monoxide from choline and ascorbic acid—A defensive mechanism against reductive stress? FASEB J. 2003, 17, 1124–1126. [Google Scholar] [CrossRef]
- Kell, D.B. Iron behaving badly: Inappropriate iron chelation as a major contributor to the aetiology of vascular and other progressive inflammatory and degenerative diseases. BMC Med. Genom. 2009, 2, 2. [Google Scholar] [CrossRef]
- Chifman, J.; Laubenbacher, R.; Torti, S.V. A systems biology approach to iron metabolism. Adv. Exp. Med. Biol. 2014, 844, 201–225. [Google Scholar]
- Basak, T.; Kanwar, R. Iron imbalance in cancer: Intersection of deficiency and overload. Cancer Med. 2022, 11, 3837–3853. [Google Scholar] [CrossRef]
- Boros, M.; Ghyczy, M.; Érces, D.; Varga, G.; Tokés, T.; Kupai, K.; Torday, C.; Kaszaki, J. The anti-inflammatory effects of methane. Crit. Care Med. 2012, 40, 1269–1278. [Google Scholar] [CrossRef]
- Juhász, L.; Tallósy, S.P.; Nászai, A.; Varga, G.; Érces, D.; Boros, M. Bioactivity of Inhaled Methane and Interactions With Other Biological Gases. Front. Cell Dev. Biol. 2022, 9, 824749. [Google Scholar] [CrossRef] [PubMed]
- Jász, D.K.; Szilágyi, Á.L.; Tuboly, E.; Baráth, B.; Márton, A.R.; Varga, P.; Varga, G.; Érces, D.; Mohácsi, Á.; Szabó, A.; et al. Reduction in hypoxia-reoxygenation-induced myocardial mitochondrial damage with exogenous methane. J. Cell. Mol. Med. 2021, 25, 5113–5123. [Google Scholar] [CrossRef] [PubMed]
- Benke, K.; Jász, D.K.; Szilágyi, Á.L.; Baráth, B.; Tuboly, E.; Márton, A.R.; Varga, P.; Mohácsi, Á.; Szabó, A.; Széll, Z.; et al. Methane supplementation improves graft function in experimental heart transplantation. J. Heart Lung Transplant. 2021, 40, 183–192. [Google Scholar] [CrossRef] [PubMed]
- Keppler, F.; Ernst, L.; Polag, D.; Zhang, J.; Boros, M. ROS-driven cellular methane formation: Potential implications for health sciences. Clin. Transl. Med. 2022, 12, e905. [Google Scholar] [CrossRef] [PubMed]
- Liu, C.; Zhang, J. Methane might be made by all living organisms. Nature 2022, 603, 396–397. [Google Scholar] [CrossRef]


Disclaimer/Publisher’s Note: The statements, opinions and data contained in all publications are solely those of the individual author(s) and contributor(s) and not of MDPI and/or the editor(s). MDPI and/or the editor(s) disclaim responsibility for any injury to people or property resulting from any ideas, methods, instructions or products referred to in the content. |
© 2023 by the authors. Licensee MDPI, Basel, Switzerland. This article is an open access article distributed under the terms and conditions of the Creative Commons Attribution (CC BY) license (https://creativecommons.org/licenses/by/4.0/).