Abstract
To date, there is no information on the effect of TBI on the changes in brain CoQ levels and possible variations in its redox state. In this study, we induced graded TBIs (mild TBI, mTBI and severe TBI, sTBI) in male rats, using the weight-drop closed-head impact acceleration model of trauma. At 7 days post-injury, CoQ9, CoQ10 and α-tocopherol were measured by HPLC in brain extracts of the injured rats, as well as in those of a group of control sham-operated rats. In the controls, about the 69% of total CoQ was in the form of CoQ9 and the oxidized/reduced ratios of CoQ9 and CoQ10 were, respectively, 1.05 ± 0.07 and 1.42 ± 0.17. No significant changes in these values were observed in rats experiencing mTBI. Conversely, in the brains of sTBI-injured animals, an increase in reduced and a decrease in oxidized CoQ9 produced an oxidized/reduced ratio of 0.81 ± 0.1 (p < 0.001 compared with both controls and mTBI). A concomitant decrease in both reduced and oxidized CoQ10 generated a corresponding oxidized/reduced ratio of 1.38 ± 0.23 (p < 0.001 compared with both controls and mTBI). An overall decrease in the concentration of the total CoQ pool was also found in sTBI-injured rats (p < 0.001 compared with both controls and mTBI). Concerning α-tocopherol, whilst no differences compared with the controls were found in mTBI animals, a significant decrease was observed in rats experiencing sTBI (p < 0.01 compared with both controls and mTBI). Besides suggesting potentially different functions and intracellular distributions of CoQ9 and CoQ10 in rat brain mitochondria, these results demonstrate, for the first time to the best of knowledge, that sTBI alters the levels and redox states of CoQ9 and CoQ10, thus adding a new explanation to the mitochondrial impairment affecting ETC, OXPHOS, energy supply and antioxidant defenses following sTBI.
1. Introduction
Traumatic brain injury (TBI) occurs any time an external force, directly or indirectly acting to the head, is transferred in part to the nervous tissue initiating a sudden neurometabolic cascade that alters a plethora of biochemical and molecular processes of cerebral cells [1,2,3]. In the clinical setting, there are numerous variables rendering each TBI different from one another, including (i) the type and intensity of the force acting at the time of impact (penetrating, non-penetrating, static, dynamic); (ii) the sub-type of force, if dynamic (rotational, translational); (iii) the timing between the impact and admission to NICUs; (iv) the genotype, phenotype and epigenotype of a TBI patient. Each of these variables has unpredictable consequences on the evolution of the TBI and on patients’ outcome. Therefore, TBI is probably the most complex pathology involving the central nervous system and, notwithstanding its high incidence [4], still requires valid pharmacologic treatments that positively affect TBI patients’ outcome.
However, thanks to experimental studies in laboratory animals, our knowledge on the biochemical and molecular changes characterizing the post-TBI brain has greatly improved in the last few decades. These TBI-associated alterations of nervous cell functions, known as the secondary insult and lasting for days, weeks and months after a TBI, comprise changes in ionic homeostasis [5], an excess release of excitatory neurotransmitters (glutamate, aspartate) [6], an imbalance of glucose metabolism [7], mitochondrial dysfunction [8], an insurgence of oxidative/nitrosative stress [9], the activation of neuroinflammatory processes leading to cellular apoptosis [10,11] and damage to the blood brain barrier (BBB) permeability [12]. Using the closed-head impact acceleration model of graded TBI [13], previous studies from our research group highlighted the differential effects of mild (mTBI) and severe (sTBI) head trauma on energy and glucose dysmetabolism [14,15] and mitochondrial malfunctioning [16,17], evidencing the recovery of biochemical functions following mTBI and the long-lasting metabolic impairment of nervous cells after sTBI. Alterations of the mitochondrial electron transport chain (ETC) coupled to oxidative phosphorylation (OXPHOS) are crucial determinants in the (transient or permanent) post-TBI energy crisis [18,19].
Conzyme Q (CoQ) is the well-known mobile electron transporter which, thanks to its hydrophobicity, is localized within the phospholipid bilayer of various biological membranes [20]. The majority of CoQ is localized intracellularly in the inner mitochondrial membrane [21], where it provides the transfer of electrons from Complexes I and II to Complex III of the ETC. The quinone ring allows CoQ to perform one or two electron transfers, so that CoQ may exist in its fully oxidized and fully reduced forms, as well as in its semiquinone CoQ radical. This last species is principally generated in the so-called Q cycle, occurring within Complex III of the ETC. The vicinity of molecular oxygen may cause the O2 reaction with CoQ−• with the formation of superoxide anion and oxidized CoQ (CoQ ox) [21]. In the case of mitochondrial malfunctioning, the frequency of this reaction increases and the leak of electrons at the Complex III site provokes a net increase in O2−• subsequently leading to the formation of other reactive oxygen species (ROS), ultimately resulting in cell oxidative stress [22,23]. While in humans CoQ is 99% present as CoQ10, where the number of the deponent indicates the length of the repetitive 5-carbon atoms isoprenoid chain, in other animal organisms there are CoQ with shorter hydrophobic chains [20,21] in different proportions. Rats, one of the animal species very frequently used in experimental studies, have two forms of CoQ: CoQ9 and CoQ10 [24]. Curiously, the cells of all rat tissues but the brain have high concentrations of CoQ9 and minimal amounts of CoQ10 [25]. Indeed, although rat cerebral cells have higher CoQ9 levels (~70% of total CoQ), their CoQ10 concentrations (~30% of total CoQ) are about six times higher than those found in non-nervous cells [25].
Notwithstanding the relevant biochemical role of CoQ and the well-defined occurrence of mitochondrial dysfunction, to date there no available data showing whether and how TBI affects both the level and the redox state of this fundamental electron transporter. In order to clarify this issue, in the present study, besides determining the cerebral levels of α-tocopherol for its potential connections with CoQ, we measured the concentrations of the reduced and oxidized species of CoQ9 and CoQ10 in the brains of control rats and in those of animals a week after experiencing a diffuse type of graded TBI (mTBI or sTBI).
2. Materials and Methods
2.1. Chemicals and Preparation of Reduced CoQ9
HPLC-grade acetonitrile (far-UV) and chloroform were obtained from J. T. Baker Inc. (Phillipsburgh, NJ, USA). Oxidized CoQ9, oxidized and reduced CoQ10 and α-tocopherol were purchased from Sigma-Aldrich (St. Louis, Mo, USA). Since the reduced form of CoQ9 is not commercially available, standard solutions of this compound were obtained by the reduction of oxidized CoQ9 with known concentration, using NaBH4 as the reducing agent and following the procedure described in [26]. The full conversion of oxidized into reduced CoQ9 was confirmed by the absence of the oxidized CoQ9 peak in HPLC chromatographic runs, performed immediately after completing the reduction reaction. Stock solutions of reduced CoQ9 were stable for at least 72 h at 4 °C.
2.2. Induction of Graded TBI
The study was approved by the Ethic Committee of the Catholic University of Rome (approval 1F295.52, released on 20 October 2017) and received approval by the Ethical committee of the Italian Ministry of Health (approval No. 78/2018-PR released on 02/05/2018, and approval n° 304/2022-PR released on 22 May 2022). Male Wistar rats (n = 26) of 300–350 g body weight (b.w.) were kept in the animal house under constant temperature and humidity, fed with a standard laboratory diet and water ad libitum. Anesthesia was induced with an intramuscular injection of 35 mg/kg b.w. ketamine and 0.25 mg/kg b.w. midazolam. Graded TBI was induced according to the closed-head impact acceleration model [13] by dropping a 450 g weight from 1 or 2 m heights onto the helmet protected rat head (fixed on the skull with a proper surgical procedure, immediately prior to trauma induction), consequently causing, respectively, mTBI (n = 8) or sTBI (n = 8). In the case that rats suffered from skull fracture, seizures or nasal bleeding, they were not included in the study (an overall rate of mortality of 8% was recorded). Seven days after head impact, animals were again anesthetized and sacrificed. Control animals (n = 8) received the same surgical procedure (used for helmet fixation) and anesthesia administration as the injured rats and were sacrificed 7 days after surgery.
To validate the analytical characteristics of the HPLC separation of reduced and oxidized CoQ9 and CoQ10, previously validated to quantify α-tocopherol and other fat-soluble compounds [27], a separate group of naïve control animals (n = 6) was anesthetized, immediately sacrificed and subjected to craniectomy and brain removal, as described below. The only difference was that each brain was divided into two hemispheres, one of which was processed as described below, whilst the other was spiked with a standard mixture containing either low (n = 3) or high (n = 3) concentrations of reduced and oxidized CoQ9 and CoQ10.
2.3. Tissue Processing and HPLC Determination of Reduced and Oxidized CoQ9 and CoQ10
As described in detail elsewhere [6,14,15,16,17], 7 days after surgical procedures (controls) or TBI induction (mTBI and sTBI rats), anesthetized animals underwent an in vivo craniectomy. The brain was exposed and immediately freeze-clamped by aluminum tongue pre-cooled in liquid N2 and then immersed in liquid N2, with the aim of keeping to the minimum any possible loss of metabolites. The tissue wet weight (w.w.) was quickly recorded and the frozen brain was deproteinized by 90 s homogenization in HPLC-grade CH3CN (acetonitrile), using an Ultra-Turrax homogenizer (Janke and Kunkel, Staufen, Germany) set at the maximal speed (24,000 rpm/min). The solid (tissue) to liquid (CH3CN) ratio was calculated on the basis of the tissue wet weight, in order to obtain a 1:4.5 (w/v) homogenate. The further dilution to have a 1:5 (w/v) homogenate was performed by adding proper volumes of HPLC-grade CHCl3 (chloroform). After vigorous vortexing, samples were centrifuged at 20,690× g, for 10 min at 4 °C; the clear supernatants were saved and pellets underwent a new homogenization step, using the same conditions described above. Samples were again vortexed and centrifuged and the resulting clear supernatants were combined with those saved after the first homogenization step. Mixing the two clear supernatants allowed us to obtain protein-free brain extracts (final tissue to liquid ratio = 1:10, w/v) in which the organic solvent was composed of 9 volumes of CH3CN and 1 volume of CHCl3.
To determine the characteristics of the HPLC analysis, standard mixtures with increasing concentrations of reduced and oxidized CoQ9 and CoQ10 were submitted to the aforementioned extraction process and then analyzed to evaluate the sensitivity (as the lower limit of detection, LLOD, and lower limit of quantification, LLOQ) and linearity. Reproducibility was assessed by analyzing both the same standard mixture for five consecutive times on the same day (intra-assay variability) and five different standard mixtures (with same concentrations of the compounds of interest) on five consecutive days (inter-assay variability). To measure recovery, aliquots with low and high standard mixtures of reduced and oxidized CoQ9 and CoQ10 were added to CH3CN immediately before tissue homogenization. These spiked samples were then processed as described above, in order to determine whether the matrix (brain tissue) influenced the recovery of any of the reduced and oxidized CoQ9 and CoQ10.
The HPLC analysis was carried out using aliquots of 100 μL loaded onto a 150 × 4.6 mm, 5 µm particle size Hypersil Gold RP C-18 column provided with its own guard column (Thermo Fisher Scientific, Milan, Italy) and connected to a Surveyor HPLC system (ThermoFisher Italia, Rodano, Milan, Italy) equipped with a highly-sensitive photodiode array detector (provided by a 5 cm light path flow cell) and set up between 200 and 500 nm wavelength. Chromatographic separations of α-tocopherol, and reduced and oxidized CoQ9 and CoQ10, were carried out with 70% methanol + 30% H2O as the starting solvent A and 100% acetonitrile as the solvent B. A linear gradient from solvent A to solvent B was formed as follows: 0.5 min at 100% A; 8 min at up to 100% B (hold for additional 35 min). A flow rate of 1.0 mL/min and a column temperature of 37 °C were kept constant during the analysis. Data acquisition and analysis were performed using the ChromQuest® software package (5.0 version) provided by the HPLC manufacturer. Calculations of the reduced and oxidized forms of CoQ9 and CoQ10 in unknown sample runs were performed at 290 or 275 nm wavelength, respectively, whilst that of α-tocopherol was carried out at 295 nm wavelength. Comparisons of retention times and area of peaks, with those of ultrapure standards with known concentrations, allowed exact quantifications of the compounds of interest.
2.4. Statistical Analysis
Statistical analysis was performed using the GraphPad Prism program, release 8.01 (GraphPad Software, San Diego, CA, USA). Normal distribution of the data was evaluated according to the Kolmogorov–Smirnov test. Differences among groups were determined by the 1-way analysis of variance for multiple comparisons, followed by the Tukey’s post-hoc test. Differences were considered significant when p < 0.05. Raw data of the CoQ values determined in control, mTBI and sTBI-injured rats have been added as supplementary material.
3. Results
3.1. Characteristics of the HPLC Method for the Simultaneous Determination of Reduced and Oxidized CoQ9 and CoQ10 in the Brain of Control Rats
Table 1 summarizes the parameters of sensitivity and linearity of the HPLC method. The lower limit of detection (LLOD) and the lower limit of quantification (LLOQ) of both reduced CoQ9 and CoQ10 were 10 (LLOD) and 15 (LLOQ) nM (corresponding to 1 and 1.5 pmol/100 μL injected, respectively) and that of both oxidized CoQ9 and CoQ10 were 20 (LLOD) and 30 (LLOQ) nm (corresponding to 2 and 3 pmol/100 μL injected, respectively). The method was highly linear, in a range of concentrations between LLOQ and 4000 × LLOQ. Since standard mixtures underwent the extraction procedure used to deproteinize the brain tissue, it is possible to affirm that these data strongly indicate no effects of the sample preparation process on the compounds of interest.

Table 1.
Lower limit of detection, lower limit of quantification and linearity of the reversed phase HPLC method for the detection of reduced and oxidized CoQ9 and CoQ10.
The reproducibility of the analytical HPLC method was assessed by determining intra-assay (five consecutive chromatographic runs of the same mixture) and inter-assay (five chromatographic runs of five, freshly prepared, standard mixtures analyzed on five consecutive days) coefficients of variations (CV) of peak areas and retention times (Table 2). The coefficients of the variations of peak areas and retention times were lower than 0.5% and 1.5% for retention times and peak areas in the case of intra-assay, and lower than 0.5% and 2% for retention times and peak areas in the case of inter assay. Even when performing these reproducibility tests, all standard mixtures underwent the same extraction process used for biological samples, prior to the HPLC analysis.
Table 2.
Reproducibility of the HPLC method for the separation and detection of reduced and oxidized CoQ9 and CoQ10.
The recovery of the tissue processing of reduced and oxidized CoQ9 and CoQ10, as well as that of the HPLC method used for their determination, was evaluated by spiking acetonitrile (the organic solvent used for tissue protein removal and CoQs extraction) with either low (10 × LLOQ) or high (200 × LLOQ) reduced and oxidized CoQ9 and CoQ10 concentrations. These spiked acetonitrile solutions were then used to homogenize six brain hemispheres (three with 10 × LLOQ and three with 200 × LLOQ), according to the protocol described under Materials and Methods. Recovery, reported in Table 3 and Table 4, demonstrates a high efficiency of the method used for brain deproteinization and CoQ9 and CoQ10 extraction, either when acetonitrile was spiked with low (Table 3) or high (Table 4) concentrations of the compounds of interest.
Table 3.
Recovery of the reversed phase HPLC method for the detection of reduced and oxidized CoQ9 and CoQ10 in brain tissue extracts.
Table 4.
Recovery of the reversed phase HPLC method for the detection of reduced and oxidized CoQ9 and CoQ10 in brain tissue extracts.
Figure 1 shows representative chromatograms of the HPLC separation of reduced and oxidized CoQ9 and CoQ10 of the brain extracts of a control rat (A), of an mTBI-injured rat (B) and of an sTBI-injured rat (C), from which it is possible to observe the full separation of the compounds under evaluation, as well as visible differences in some of the peak areas of reduced and oxidized CoQ9 and CoQ10 in the chromatographic run of the sTBI animal (C).
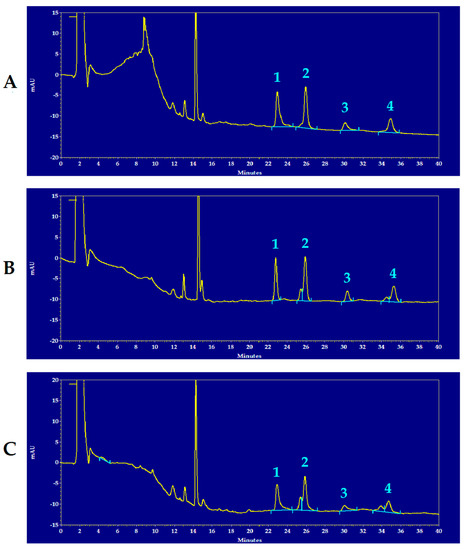
Figure 1.
Representative chromatograms showing the HPLC separation of reduced and oxidized CoQ9 and CoQ10 in rat brain extracts of a control rat (A), an mTBI-injured rat (B) and an sTBI-injured rat (C). Numbered peaks correspond to 1 = reduced CoQ9; 2 = oxidized CoQ9; 3 = reduced CoQ10; 4 = oxidized CoQ10. The chromatographic runs are shown at 288 nm wavelength, in order to obtain easily visible peaks of the compounds of interest in one single run only. In each chromatogram, the peak at 14.4 min of retention time, corresponds to α-tocopherol. Full scale = 35 mAU, where AU = absorbance units.
3.2. Concentrations and Redox State of CoQ9 and CoQ10 in the Brain of Control Rats
Panel A of Figure 2 shows the concentrations of the reduced and oxidized forms of CoQ9 and CoQ10 detectable, under physiologic conditions, in the organic solvent extracts of the whole brain of the control rats. In Panel B of the same Figure 2, the total amounts of CoQ9 and CoQ10, as well as the total reduced and oxidized coenzymes Q species, are indicated.
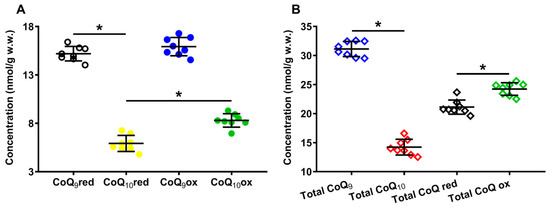
Figure 2.
Concentrations of reduced and oxidized forms of CoQ9 and CoQ10 (A) detected in whole brain extracts of control rats. The total amounts (reduced + oxidized) of CoQ9 and CoQ10 and the total amounts of reduced (reduced CoQ9 + reduced CoQ10) and oxidized (oxidized CoQ9 + oxidized CoQ10) coenzymes Q forms (B) are also shown. Means, standard deviations and all data points (n = 8 control animals) are shown. CoQ9red = reduced coenzyme Q9; CoQ10red = reduced coenzyme Q10; CoQ9ox = oxidized coenzyme Q9; CoQ10ox = oxidized coenzyme Q10. * Significantly different, p < 0.001.
It is possible to observe that, under physiological conditions, while the rat brain has equal amounts of reduced and oxidized CoQ9 (15.19 ± 0.75 and 15.92 ± 0.94 nmol/g w.w., respectively), the concentration of reduced CoQ10 (5.92 ± 0.83 nmol/g w.w.) is 1.4 times lower than that of oxidized CoQ10 (8.30 ± 0.70, p < 0.001), suggesting the possible differential roles of CoQ9 and CoQ10 in the electron transport chain (ETC).
Results separately considering the total concentrations of reduced + oxidized CoQ9 (31.12 ± 1.31 nmol/g w.w.) and CoQ10 (14.22 ± 1.36 nmol/g w.w., p < 0.001), show that the shorter form of coenzyme Q represents 68.86 ± 2.35% of the total coenzyme Q pool and CoQ10 only 31.14 ± 2.35% (Figure 3A). When dividing by the concentration of the total coenzyme Q pool, CoQ9 is distributed into equal amounts of reduced and oxidized CoQ9, whilst CoQ10 is characterized by a significantly higher per cent of the oxidized species (Figure 3B).
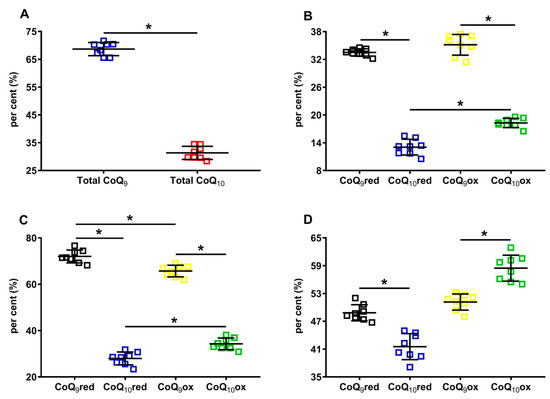
Figure 3.
Per cent of cerebral CoQ9 and CoQ10, and of their respective reduced and oxidized species in brains of control rats. In (A), the per cent of total CoQ9 (reduced + oxidized) and total CoQ10 (reduced + oxidized) were calculated on the total coenzymes Q pool (reduced + oxidized CoQ9 + reduced + oxidized CoQ10). In (B), the per cent of reduced CoQ9 and CoQ10 and oxidized CoQ9 and CoQ10 were calculated on the total coenzymes Q pool (reduced + oxidized CoQ9 + reduced + oxidized CoQ10). In (C), the per cent of reduced CoQ9 and CoQ10 were calculated, respectively, on the amounts of total reduced coenzymes Q (reduced CoQ9 + CoQ10), whilst the per cent of oxidized CoQ9 and CoQ10 were calculated, respectively, on the amounts of total oxidized coenzymes Q (oxidized CoQ9 + CoQ10). In (D), the per cent of reduced and oxidized CoQ9 and reduced and oxidized CoQ10 were calculated, respectively, on the total CoQ9 (reduced + oxidized) or total CoQ10 (reduced + oxidized) levels. CoQ9red = reduced coenzyme Q9; CoQ10red = reduced coenzyme Q10; CoQ9ox = oxidized coenzyme Q9; CoQ10ox = oxidized coenzyme Q10. * Significantly different, p < 0.001.
When using the sum of reduced CoQ9 + CoQ10 or the oxidized CoQ9 + CoQ10 to calculate the different percentages, it was found that 72.03 ± 2.78% and 27.97 ± 2.78% corresponded to reduced CoQ9 or CoQ10, respectively, whilst 65.73 ± 2.51% and 34.27 ± 2.51% corresponded to oxidized CoQ9 or CoQ10, respectively.
Lastly, when using the sum of reduced +oxidized CoQ9 and CoQ10 to calculate the different percentages, it was observed that CoQ9 was almost equally divided into reduced and oxidized (48.84 ± 1.74% and 51.16 ± 1.74%, respectively), whilst significantly lower values of reduced CoQ10 compared with oxidized CoQ10 were observed (41.53 ± 2.80% and 58.47 ± 2.80%, respectively, p < 0.0001). Overall, the different absolute values of CoQ9 and CoQ10, as well as the percent values of their respective reduced and oxidized forms, allowed for the hypothesis that rat brain mitochondria may have a different distribution within the three complexes of ETC using coenzymes Q as mobile electron transporters.
This hypothesis is supported by data reported in Figure 4, where the oxidized/reduced ratios of the total coenzymes Q, CoQ9 and CoQ10 are shown.
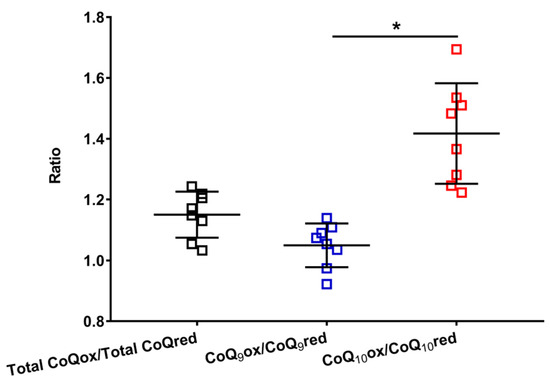
Figure 4.
Values of the oxidized/reduced ratios of CoQ9 and CoQ10 found in whole brain extracts of control rats. Means, standard deviations and all data points (n = 8 control animals) are shown. Total CoQox = oxidized coenzyme Q9 + oxidized coenzyme Q10; Total CoQred = reduced coenzyme Q9 + reduced coenzyme Q10; CoQ9ox = oxidized coenzyme Q9; CoQ9red = reduced coenzyme Q9; CoQ10ox = oxidized coenzyme Q10; CoQ10red = reduced coenzyme Q10. * Significantly different, p < 0.001.
It is possible to observe that the total CoQox/total CoQred ratio is slightly higher than 1 (mean value = 1.15 ± 0.08), allowing us to suppose that more or less equimolar amounts of the oxidized and reduced species are stably present in the brain tissue, under physiological conditions. However, when separately considering the ratios of the short (oxidized CoQ9/reduced CoQ9) and long (oxidized CoQ10/reduced CoQ10) chained coenzymes Q, it was found that the former is equally distributed between the two oxidoreductive species (oxidized CoQ9/reduced CoQ9 mean value = 1.05 ± 0.07), whilst the latter is prevalently present in its oxidized species (oxidized CoQ10/reduced CoQ10 ratio mean value = 1.42 ± 0.17). This unequal distribution of CoQ9 and CoQ10 into the respective oxidized and reduced species seems to corroborate the possibility that the three complexes of ETC do not similarly use CoQ9 and CoQ10 in their respective oxidoreductive reactions.
3.3. Concentrations and Redox State of CoQ9 and CoQ10 in the Rat Brain following Graded TBI
The results reported in Figure 5 show the differential effects of graded TBI (mild and severe) on the concentrations of the total pool of coenzymes Q (reduced + oxidized CoQ9 + CoQ10) (A), as well as on both the total CoQ9 (reduced + oxidized) (B) and CoQ10 (reduced + oxidized) (C) concentrations.
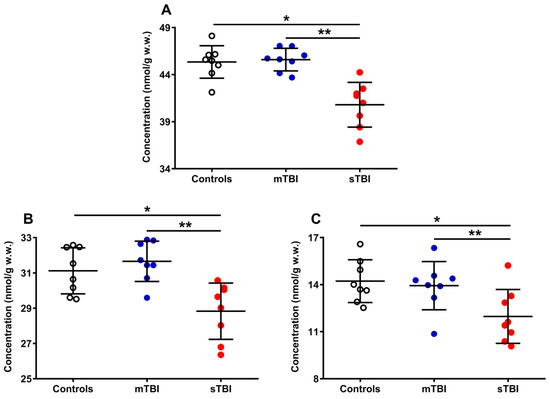
Figure 5.
Concentrations of total CoQ pool (A), CoQ9 pool (B), and CoQ10 pool (C) detected in whole brain extracts of controls and rats sacrificed 7 days after experiencing mTBI or sTBI. Means, standard deviations and all data points (n = 8 in each group) are shown. Total coenzymes Q pool = reduced + oxidized CoQ9 + CoQ10; CoQ9 pool = reduced + oxidized CoQ9; CoQ10 pool = reduced + oxidized CoQ10. * Significantly different from controls, p < 0.001. ** Significantly different from mTBI, p < 0.001.
A week after mTBI, the concentration of the total CoQ pool (A) was not different from the value measured in the controls, whilst the amount of the total CoQ pool of sTBI rats (at the same time point post-impact) was significantly lower (−10%) than that measured in both controls and mTBI animals (p < 0.001). A similar situation was observed when separately considering the levels of total CoQ9 (reduced + oxidized) (B) and total CoQ10 (reduced + oxidized) (C). Animals experiencing mTBI had normal concentrations of both total CoQ9 and total CoQ10, whilst rats receiving sTBI showed a significant decrease in both short (CoQ9) and long (CoQ10) CoQ levels (p < 0.001 compared with both controls and mTBI). It is worth underlining that, when determining the per cent changes of the two coenzymes Q, it was found that a decrease in CoQ9 was −7.4% whilst that of CoQ10 was −18.6%, i.e., the per cent decrease in CoQ10 was 2.5 times more pronounced than that occurring in CoQ9.
Figure 6 illustrates the effects of graded TBI on the total amount of reduced CoQ9 + CoQ10 (A) and oxidized CoQ9 + CoQ10 (B), as well as on the relative concentrations of reduced and oxidized species of both CoQ9 and CoQ10 (C, D, E and F), determined in the whole brain extracts of rats undergoing mTBI or sTBI.
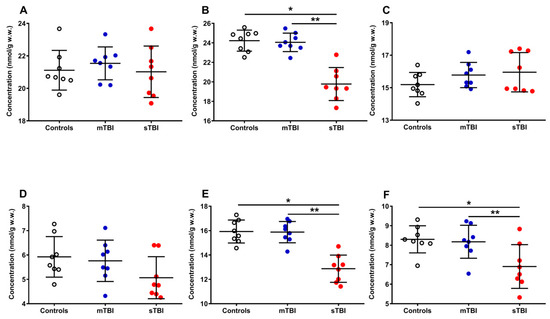
Figure 6.
Concentrations of reduced CoQ9 + CoQ10 (A), oxidized CoQ9 + CoQ10 (B), reduced CoQ9 (C), reduced CoQ10 (D), oxidized CoQ9 (E) and oxidized CoQ10 (F) detected in whole brain extracts of controls and rats sacrificed 7 days after experiencing mTBI or sTBI. Means, standard deviations and all data points (n = 8 in each group) are shown. * Significantly different from controls, p < 0.001. ** Significantly different from mTBI, p < 0.001.
Whilst the amounts of reduced CoQ9 + CoQ10 (A) were not significantly modified by both mTBI and sTBI, the concentrations of oxidized CoQ9 + CoQ10 (−18.4%, B) underwent a remarkable decrease only in animals undergoing sTBI (p < 0.001, compared with both controls and mTBI rats). Both short and long reduced coenzymes Q were significantly affected neither by mild nor by severe TBI, although sTBI injured animals, compared with the controls (15.20 ± 0.75 and 5.92 ± 0.83 nmol/g w.w.), had slightly higher reduced (C) CoQ9 (15.96 ± 1.21 nmol/g w.w.) and lower reduced (D) CoQ10 values (5.07 ± 0.86 nmol/g w.w.). Oxidized CoQ9 (−19.5%, E) and CoQ10 (−16.9%, F) showed a significant decrease only when animals received sTBI (p < 0.001, compared with both controls and mTBI animals).
To evaluate whether graded TBI differentially affected the oxidoreductive state of the two CoQ forms, we calculated the ratios of the oxidized/reduced species of the two CoQ forms (CoQ9 and CoQ10). As shown in Figure 7, the ratio of oxidized CoQ9 + oxidized CoQ10/reduced CoQ9 + reduced CoQ10 (A) had a −21.7% variation in animals undergoing sTBI (p < 0.001 compared with both controls and mTBI), due to the changes in the relative concentrations of the reduced and oxidized species of the two forms occurring only after a severe head injury (Figure 5A–F). Interestingly, when separately considering the oxidized/reduced CoQ9 and oxidized/reduced CoQ10 ratios, we found a −29.5% variation of the oxidized/reduced CoQ9 (B) only in sTBI-injured rats (p < 0.001 compared with both controls and mTBI) and no change (C) in the oxidized/reduced CoQ10. This suggests a potentially different location in the ETC of short and long chained CoQ and, moreover, potentially different functional effects of the changes in the oxidized/reduced ratios of the two forms (CoQ9 and CoQ10), on the overall mitochondrial energy-related activity.
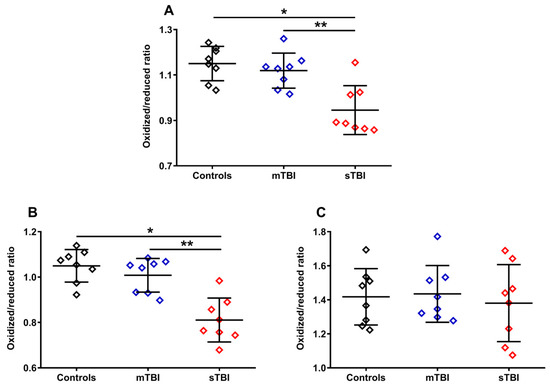
Figure 7.
Ratios of oxidized CoQ9 + CoQ10/reduced CoQ9 + CoQ10 (A), oxidized CoQ9/reduced CoQ9 (B) and oxidized CoQ10/reduced CoQ10 (C) calculated from the values of the different forms (CoQ9 and CoQ10) and oxidoreductive species (reduced and oxidized) of coenzymes Q, determined in whole brain extracts of controls and rats sacrificed 7 days after experiencing mTBI or sTBI. Means, standard deviations and all data points (n = 8 in each group) are shown. * Significantly different from controls, p < 0.001. ** Significantly different from mTBI, p < 0.001.
As indicated in Figure 8, neither mTBI nor sTBI influenced the per cent of total CoQ9 (reduced + oxidized CoQ9, A) and total CoQ10 (reduced + oxidized CoQ10, B), calculated on the total of the coenzymes Q pool (reduced + oxidized CoQ9 + reduced + oxidized CoQ10), although a visible tendency to increase the per cent of total CoQ9 (A) and decrease that of total CoQ10 (B) was observed in the case of sTBI animals.
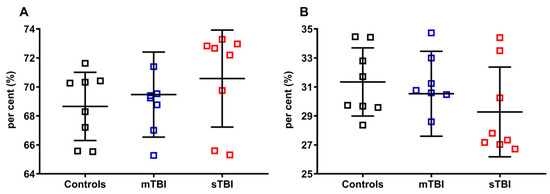
Figure 8.
Per cent of total CoQ9 and total CoQ10 in brains of control rats and rats receiving graded TBI (mild mTBI, severe sTBI). In (A), per cent of total CoQ9 (reduced + oxidized CoQ9) was calculated on the total CoQ pool (reduced + oxidized CoQ9 + reduced + oxidized CoQ10). In (B), per cent of total CoQ10 (reduced + oxidized CoQ10) was calculated on the total CoQ pool (reduced + oxidized CoQ9 + reduced + oxidized CoQ10). Means, standard deviations and all data points (n = 8 in each group) are shown.
Apparently, TBIs at both levels of severity did not influence the per cent of the reduced and oxidized species, when the reduced CoQ9 and CoQ10, or oxidized CoQ9 and CoQ10, were pooled and calculated on the total coenzymes Q concentration (reduced + oxidized CoQ9 + reduced + oxidized CoQ10). To verify this point, we separately considered reduced CoQ9 and CoQ10, or oxidized CoQ9 and CoQ10, then calculated the respective per cent using different dividers. In Figure 9, the per cent of the reduced and oxidized CoQ9 and CoQ10 were calculated on the total CoQ pool (reduced + oxidized CoQ9 + reduced + oxidized CoQ10).
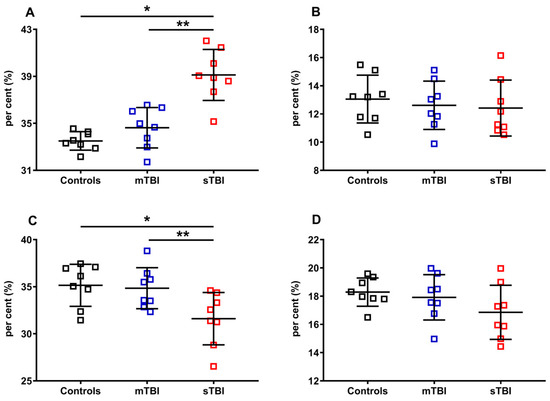
Figure 9.
Per cent of reduced and oxidized CoQ9 and CoQ10 species in brains of controls rats and rats undergoing mild (mTBI) or severe (sTBI) traumatic brain injury. In (A), the per cent of reduced CoQ9. In (B), the per cent of reduced CoQ10. In (C), the per cent of oxidized CoQ9. In (D), the per cent of oxidized CoQ10. In all panels the per cent were calculated on the total CoQ pool (reduced + oxidized CoQ9 + reduced + oxidized CoQ10). Means, standard deviations and all data points (n = 8 in each group) are shown. * Significantly different from controls, p < 0.001. ** Significantly different from mTBI, p < 0.001.
Of the two forms of CoQ, only the per cent of the oxidoreductive species of the shorter chained CoQ (CoQ9) was affected by the highest level of injury tested (sTBI). A +16.8% of reduced CoQ9 and, consequently, an equal -16.8% of oxidized CoQ9 were calculated in rats receiving sTBI (p < 0.001), clearly indicating that graded TBIs differentially affect the oxidoreductive state of only one of the two CoQ forms.
In Figure 10, the per cent of reduced and oxidized CoQ9 and CoQ10 were calculated, respectively, on the total of the reduced (reduced CoQ9 + reduced CoQ10) or oxidized forms (oxidized CoQ9 + oxidized CoQ10). Again, even when using this divider, we found that only the ratios of reduced and oxidized CoQ9 underwent significant changes, with a propensity to increase the amount of reduced CoQ9 and decrease that of oxidized CoQ9, when the brain was solicited by sTBI.
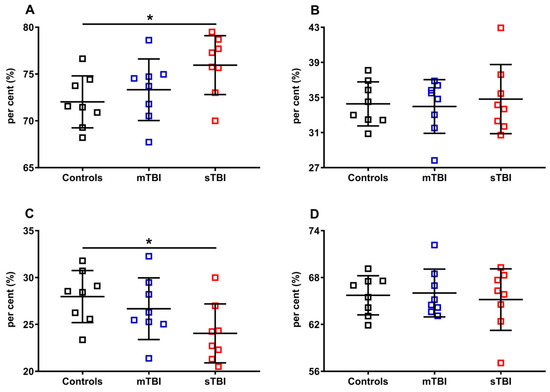
Figure 10.
Per cent of reduced and oxidized CoQ9 and CoQ10 species in brains of controls rats and rats undergoing mild (mTBI) or severe (sTBI) traumatic brain injury. In (A), the per cent of reduced CoQ9. In (B), the per cent of reduced CoQ10. In (C), the per cent of oxidized CoQ9. In (D), the per cent of oxidized CoQ10. In (A,B), the per cent of reduced CoQ9 and CoQ10 were calculated on the total reduced CoQ species (reduced CoQ9 + reduced CoQ10). In (C,D) the per cent of oxidized CoQ9 and CoQ10 were calculated on the total oxidized CoQ species (oxidized CoQ9 + oxidized CoQ10). Means, standard deviations and all data points (n = 8 in each group) are shown. * Significantly different from controls, p < 0.001.
In order to fully evaluate the variations of the reduced and oxidized species of CoQ9 and CoQ10, we calculated their fluctuations in the controls, mTBI- and sTBI-injured rats, using as a divider the total amounts of CoQ9 (reduced + oxidized CoQ9) or CoQ10 (reduced + oxidized CoQ10). The results, illustrated in Figure 11, once again confirmed that only CoQ9 suffered from the effects of sTBI on the balance between the reduced and oxidized species (A and C). Indeed, at one week post-impact, sTBI animals had a −13.4% decline in the per cent of reduced CoQ9, paralleled by an equal +13.4% increase in the per cent of oxidized CoQ9 (p < 0.001 compared with both controls and mTBI). Overall, the calculations of the per cent changes of reduced and oxidized CoQ9 and CoQ10, performed using all the possible dividers, clearly showed that only the redox balance of the short-chained coenzyme Q is affected by sTBI, with a clear tendency to move the balance value towards the preponderance of the reduced CoQ9 species.
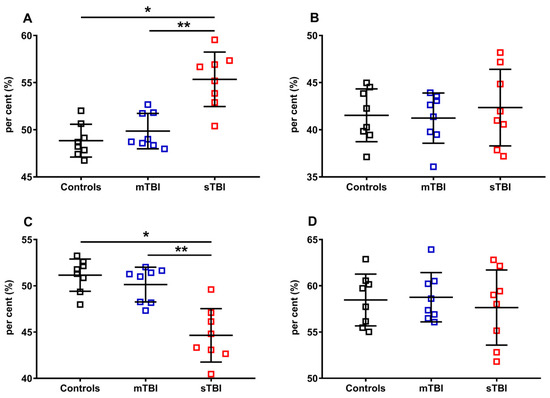
Figure 11.
Per cent of reduced and oxidized CoQ9 and CoQ10 species in brains of controls rats and rats undergoing mild (mTBI) or severe (sTBI) traumatic brain injury. In (A), the per cent of reduced CoQ9, calculated on the total of CoQ9 (reduced + oxidized). In (B), the per cent of reduced CoQ10, calculated on the total of CoQ10 (reduced + oxidized). In (C), the per cent of oxidized CoQ9, calculated on the total of CoQ9 (reduced + oxidized). In (D), the per cent of oxidized CoQ10, calculated on the total of CoQ10 (reduced + oxidized). Means, standard deviations and all data points (n = 8 in each group) are shown. * Significantly different from controls, p < 0.05. ** Significantly different from mTBI, p < 0.05.
To evaluate a potential connection with the depletion of total CoQ levels following TBI, we also measured the cerebral concentrations of α-tocopherol, considered as the main fat-soluble antioxidant, the redox cycling of which is also performed with the intervention of reduced CoQ9 and CoQ10. As shown in Figure 12, whilst no changes occurred a week after mTBI, the levels of α-tocopherol in the brain tissue of sTBI rats at 7 days post-impact was −17% and −12% lower than the values measured, respectively, in the controls and mTBI animals (p < 0.01).
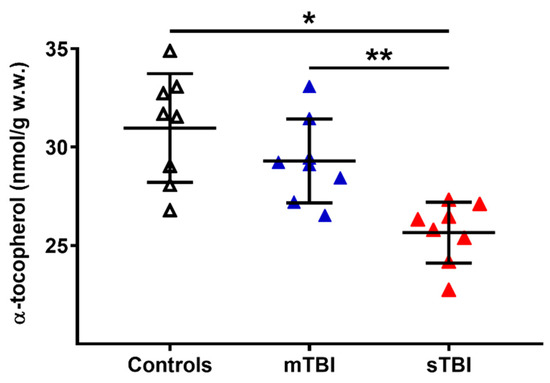
Figure 12.
Concentrations of α-tocopherol in brains of controls rats and rats undergoing mild (mTBI) or severe (sTBI) traumatic brain injury. Means, standard deviations and all data points (n = 8 in each group) are shown. * Significantly different from controls, p < 0.01. ** Significantly different from mTBI, p < 0.01.
4. Discussion
The results of the present study, besides validating both the tissue processing for reduced and oxidized CoQ9 and CoQ10 and the HPLC method used for their determination, clearly evidenced the differential effects of graded TBIs on the concentrations and redox state of CoQ9 and CoQ10, as well as evidencing some potential peculiarities of the two shorter and longer chained CoQ present in cerebral rat tissue.
As reported in the literature, notwithstanding that CoQ9 represents almost the exclusive form of CoQ content (≅95–98% of total CoQ) in the majority of rat tissues (including those with high metabolic-rates such as liver, heart and muscle), the highest levels of CoQ10 are in the brain tissue. In accordance with previous studies [21,28], by applying a two-step extraction protocol followed by HPLC analysis, we confirmed that the total amount of CoQ in the rat brain is composed of 2/3 (about 65%) of CoQ9 and 1/3 (about 35%) of CoQ10. The main biochemical role of CoQ is to act as a mobile lipophilic electron carrier, collecting reducing equivalents from different sources: (i) NADH and FADH2 at the level of Complex I and II of the ETC, respectively; (ii) glycerol 3-phosphate dehydrogenase, one of the shuttle systems ensuring the entrance in the ETC of the cytoplasmic reducing equivalents generated by glycolysis; (iii) mitochondrial dihydroorotate dehydrogenase, a key enzyme involved in the pyrimidine biosynthetic pathway; (iv) electron transport flavoprotein dehydrogenases family (ETFDH), key enzymes of the fatty acid β-oxidation and branched-chain amino acid oxidation pathways [29,30]. Once reduced, due to its high hydrophobicity, CoQ travels within the inner mitochondrial membrane (IMM) and donates electrons to Complex III of the ETC, where it is involved in the well-known Q-cycle, a process terminating with the ratio between the reduced and oxidized states of CoQ in favor of the oxidized state in order to ensure the Q-cycle efficiency. Although potentially involved in various enzymatic functions, brain CoQ is almost completely devoted to guaranteeing the correct functioning of ETC, since glycerol 3-phosphate dehydrogenase, mitochondrial dihydroorotate dehydrogenase and ETFDH are poorly expressed in the brain tissue of rats. With this in mind, it is therefore possible that the differential fractional/percent levels of CoQ9 and CoQ10, identical to those of the ETC complexes donating electrons to CoQ (Complexes I and II = 2/3 of the ETC complexes using CoQ) and with that performing the Q cycle (Complex III = 1/3 of the ETC complexes using CoQ), are indicative of a higher affinity of Complexes I and II for CoQ9 and a higher affinity of Complex III for CoQ10, thus explaining the surprising coincidence indicated above. The reasons why the brain has the highest CoQ10 within the rat organism remain, however, unexplained.
Interestingly, when analyzing the redox states of the shorter and longer chained CoQ, we found that, although the total brain CoQ pool (CoQ9 + CoQ10) is composed of slightly equimolar quantities of reduced and oxidized forms, when considering CoQ9 and CoQ10 singularly, the shorter form is equally distributed in the reduced and oxidized state, whilst the reduced form of CoQ10 is 1.4 times lower than that of the oxidized form. It is reasonable to suppose that CoQ9, whose concentrations are equally distributed in the reduced and oxidized states, may be mainly associated with and involved in the collection of electrons from Complexes I and II, since it is highly probable that in properly working mitochondria equal amounts of the reduced and oxidized CoQ9 forms are needed for a continuous electron transfer to Complex III. Conversely, the 1.4 times higher levels of oxidized CoQ10 may be supportive of the hypothesis of the preferential use of the longer chained CoQ by Complex III, where at the end of a Q-cycle the oxidized/reduced CoQ ratio is increased.
A second hypothesis regarding the different CoQ9 and CoQ10 levels and their redox states in the control rat brain tissue could be due to a dissimilar distribution of CoQ species among the so-called ETC supercomplexes. Recently, the “fluid model” of the ETC organization, in which protein complexes were viewed as independent entities embedded in the inner membrane, with CoQ and cytochrome c acting as mobile carriers that freely diffuse in the lipid membrane and inter-membrane space, respectively [31], has been replaced by the “plasticity” model characterized by the presence of, in addition to fixed and separated protein complexes, supermolecular protein assemblies, known as respiratory supercomplexes (SCs) [32,33]. SCs are functional quaternary structures that increase electron transport efficiency, reduce ROS production and stabilize the structure of free complexes, thus enhancing oxidative phosphorylation efficiency [34,35,36]. It has been found that, in mammalian mitochondria, Complex I is mostly associated with other complexes, either with a Complex III dimer (CI + CIII2) or with a Complex III dimer and a Complex IV monomer or dimer (CI + CIII2+CIV1-2, a superassembly known as N-respirasome) [37]. Complex III is usually found as a dimer (CIII2), but it can also create the SC known as Q-respirasome, in association with a Complex IV monomer or dimer (CIII2+CIV1-2) [38]. The co-existence of SCs and free complexes therefore suggests the possibility of a specific distribution of the CoQ pool in two functional populations and many scientific studies demonstrated the presence of a CoQ pool trapped within SCs containing a Complex I dedicated to transferring electrons originating from NADH (CoQNADH) and a free CoQ pool diffused in the IMM utilized by Complex II and other FAD-containing enzymes (CoQFAD) [39,40,41]. It may be hypothesized that the crucial role of mitochondrial cerebral energy metabolism and the peculiar phospholipid-rich composition of the brain tissue contribute to the use of CoQ9 in the electron transfer within SCs, and to cluster CoQ10, thanks to its higher hydrophobicity, in the shuttling of electrons between free complexes, providing a reasonable explanation for the co-existence of separate CoQ9 and CoQ10 pools in the rat brain, characterized by differential oxidized/reduced states ratio.
In view of the key role of CoQ in ETC, but also in cellular antioxidant protection, alterations of CoQ homeostasis have been associated to pathological conditions characterized by mitochondrial dysfunction, such as neurodegenerative diseases [42,43,44]. Notwithstanding that TBI is characterized by energy impairment [45,46], mitochondrial malfunctioning [47,48] and sustained oxidative and nitrosative stress [49,50], nothing has been reported, to date, on possible changes in the levels and redox state of CoQ. Our results demonstrated, for the first time to the best of our knowledge, that TBI, depending on its severity, clearly affects either absolute concentrations or redox states of both CoQ9 and CoQ10 (although to different extents), adding new evidence to the overall mitochondrial impairment caused by TBI.
When evaluating the impact of TBI on CoQ homeostasis, the results of the present study clearly indicated that whilst mTBI rats had levels of total CoQ (reduced + oxidized CoQ9 + reduced + oxidized CoQ10), CoQ9 pool (reduced + oxidized) and CoQ10 pool (reduced + oxidized), as well as of those of reduced and oxidized CoQ9 and CoQ10, similar to those of the controls, sTBI animals had a significant depletion in total CoQ and in the pools of both shorter and longer chained CoQ levels. Additionally, the brain tissue of sTBI animals, a week after impact, showed differential alterations in the redox states of CoQ9 and CoQ10, with an overall selective decrease in the sum of oxidized CoQ species, but also differential alterations when separately considering the concentrations of reduced and oxidized CoQ9 and CoQ10 (Figure 5). Consequently, these unequal changes had different reflexes on the oxidized/reduced ratios of oxidized CoQ9 + CoQ10/reduced CoQ9 + CoQ10, oxidized CoQ9/reduced CoQ9 and oxidized CoQ10/reduced CoQ10, indicating that the decrease in the oxidized CoQ9 + CoQ10/reduced CoQ9 + CoQ10 ratio of the sTBI brain is solely due to the decrease in the ratio of oxidized CoQ9/reduced CoQ9 but not in that of the oxidized CoQ10/reduced CoQ10 (Figure 6).
Using the same rat model of graded diffused TBI, we previously showed that the mitochondrial quality control (MQC) system, finely regulating the mitochondrial dynamics through the processes of fusion, fission and mitophagy [51] and of crucial relevance for cell survival [52], undergoes selective changes depending on the severity of TBI. In particular, we found that, at 5 days post injury, while the mTBI-injured brain activated fusion and inhibited fission, thus promoting mitochondrial recovery, the sTBI-injured brain oppositely activated fission and mitophagy and inhibited fusion, with an overall decrease in the cerebral mitochondrial mass [16]. Therefore, it is conceivable that the profound alterations of MQC following TBI may contribute, through two possible mechanisms, to the depletion of the CoQ pool content occurring in the rat brain tissue following sTBIs only: (i) since sTBI induces sudden and long-lasting alterations in the mitochondrial phosphorylating capacity, causing energy crisis [45,46,53] and dysfunctional mitochondria [16,54], the brain tissue promptly activates the fission and mitophagy processes reducing the number of dysfunctional mitochondria consequently leading to an overall depletion of cerebral CoQ content; (ii) since sTBI induces a downregulation of the genes and protein expressions of mitofusins (MFN1 and MFN2 involved in the regulation of mitochondrial fusion), the decrease in MFN2, a component of the MQC involved in CoQ biosynthesis [29] and the maintenance of correct CoQ levels [55], may certainly contribute to the significant decrease in the CoQ content.
As previously mentioned, our results clearly showed that the impact of TBI was not only circumscribed to the decrease in cerebral CoQ9 and CoQ10 levels, but also to differentially modify their respective redox states. Once again, whilst no changes were found in mTBI animals at 7 days post-impact, sTBI-injured rats had significant imbalance in the oxidoreductive states of CoQ species. In particular, the concentrations of reduced CoQ9 + CoQ10 pool were not affected, whilst the concentrations of the oxidized pool underwent a remarkable decrease, thus inducing a significant decrease in the oxidized/reduced ratio of CoQ9 + CoQ10. When separately analyzing the concentrations of the four CoQ (reduced and oxidized CoQ9 and reduced and oxidized CoQ10) and the resulting oxidized/reduced ratios, it was observed that the oxidized/reduced ratio of CoQ10 was unaltered and that of CoQ9 underwent a significant decrease. This occurs as a consequence of a slight increase in reduced CoQ9 and a decrease in oxidized CoQ9, accompanied by an equal decrease in reduced and oxidized CoQ10. Therefore, compared with the values of the control rats, the resulting values of the respective ratios clearly indicates a more reduced state of CoQ9 and no change in that of CoQ10. These findings suggest that the differential redox imbalance of CoQ9 and CoQ10 may be due to an unequal impairment of the ETC complexes. In fact, the significant tendency to shift the balance value towards the preponderance of the reduced CoQ9 species, besides corroborating the hypothesis that CoQ9 is mainly used by Complexes I and II and CoQ10 by Complex III, may mainly be due to the decreased efficiency of the Q cycle (occurring in Complex III), causing an overall slowdown of the electron flux through ETC, a progressive accumulation of the reduced CoQ9 species, a decreased efficiency in proton pumping in the mitochondrial inner membrane space and a consequent impairment in OXPHOS-dependent ATP production. A schematic representation of these hypotheses is illustrated in Figure 13 (Panels A and B).
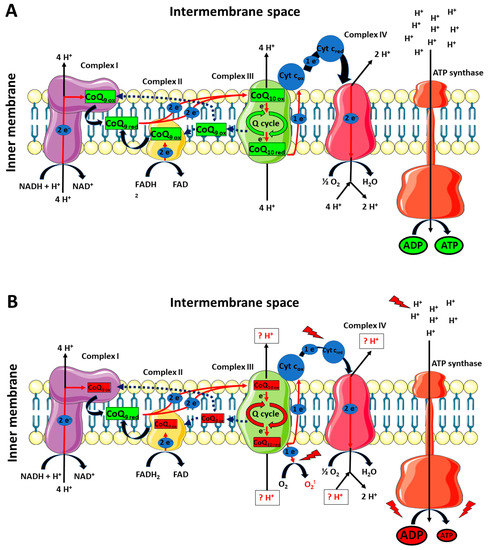
Figure 13.
Schematic representation of the possible differential roles of CoQ9 and CoQ10 in rat brain mitochondria under physiologic conditions and a week after mTBI (A), or a week after sTBI (B). CoQ9 would preferentially be used by Complex I and II, ensuring the electron transfer to Complex III, where CoQ10 would be used to exploit the Q-cycle (A). A week after mTBI, no changes in the actual concentrations of reduced and oxidized CoQ9 and CoQ10 takes place. At 7 days post-sTBI (B), there is a significant decrease in both CoQ9 and CoQ10 levels. Additionally, change in the oxidized/reduced CoQ9 ratio is also observed, due to a slight increase in reduced CoQ9 and a decrease in oxidized CoQ9. This may be due to the slight decrease in the oxidized/reduced CoQ10 ratio, indicating an impairment in the Complex III-associated Q-cycle, indirectly responsible for the change in the oxidized/reduced CoQ9 ratio. The decreased efficiency of Complex III should create favorable conditions for the one-electron transfer to molecular oxygen, generating an overflow of superoxide anions. Furthermore, malfunctioning of the Q-cycle may cause defects in proton pumping in the intermembrane space by Complex III and Complex IV. In fact, diminished electron flow from Complex III to Complex IV, due to the electron leak when superoxide anions are formed, should even alter the efficiency in Complex IV proton translocation. The final result is an overall decreased mitochondrial capacity to phosphorylate ATP, with a subsequent cell energy crisis.
Taken together, these hypotheses are supported by previous studies reporting an overall downregulation of ETC complexes, particularly affecting Complex IV, in different animal models of TBI [53,56,57]. Using the same TBI animal model, we previously demonstrated the occurrence of permanent downregulations of pyruvate dehydrogenase (PDH) and selective tricarboxylic acid cycle enzymes [15], an increase in lactate production and a decrease in the NAD+/NADH ratio in sTBI animals only [14]. The present results may help to hypothesize that such phenomena take place through a sort of feedback mechanism induced by the decreased efficiency of ETC and the consequent accumulation of reducing equivalents in the mitochondrial membrane (decrease in the oxidized/reduced ratio of CoQ9) and matrix (decrease in the NAD+/NADH ratio), acting as negative modulators of PDH activity and expression [58].
In addition to the effect on CoQ homeostasis, the present study also showed that sTBI only provokes a significant depletion of the cerebral concentration of α-tocopherol, confirming the occurrence of decreased antioxidant defenses with consequent oxidative stress following severe head injury [3,45,49,59]. According to our interpretation of a potential clustering of CoQ10 as the preferential CoQ form to ensure efficiency of the Q-Cycle at the Complex III level, and keeping in mind that the oxidized/reduced ratio of CoQ10 was slightly affected by sTBI suggesting the potentially altered activity of Complex III, the decrease in α-tocopherol may just be due to the incorrect exploitation of the Q-cycle, during an overall malfunctioning of ETC, using molecular oxygen for the oxidation of the semiquinone radical, generating ROS overflow and decreasing α-tocopherol content.
5. Conclusions
To the best of our knowledge, the results reported in the present study highlighted, for the first time, TBI’s effects on the brain’s CoQ homeostasis, causing not only a significant decrease in the brain CoQ pool, but also an imbalance of the two oxidoreductive species occurring in the rat brain. Specifically, the CoQ homeostasis appears to suffer profound alterations following sTBI only. Combined with previous findings obtained using the same TBI animal model [14,15,16,17,45,47,49], it is now possible to conclude that, following mTBI, all metabolic pathways and cycles, independently from their cytoplasmic, mitochondrial matrix or mitochondrial membrane localizations, completely recover their functionality after a week post injury, ensuring a mitochondrial capacity to satisfy the cerebral cells energy demand. Conversely, it is now possible to add that, after sTBI, as a metabolic feature of the sTBI-post-injured brain, there is a long-lasting, possibly irreversible, CoQ depletion and an alteration of its redox state, both of which have profound influences on mitochondrial dysfunction and the consequent energy crisis. Therefore, we here provided the rationale for the development of new pharmacological treatments aimed to restore CoQ homeostasis and ETC functionality. In this light, due to the plethora of biochemical, metabolic and molecular alterations induced by TBI to brain cells, multi-drug administration protocols might represent the choice of election to ameliorate TBI patients’ treatment. It is evident that increased efforts should be dedicated to elucidating the molecular mechanisms, inducing alterations of the ETC functionality and connecting CoQ alterations to those occurring in specific ETC complexes, that fully characterize the complex TBI-mediated biochemical/metabolic/molecular changes of cerebral cells.
Supplementary Materials
The following supporting information can be downloaded at: https://www.mdpi.com/article/10.3390/antiox12050985/s1.
Author Contributions
Conceptualization, G.L. (Giacomo Lazzarino), G.L. (Giuseppe Lazzarino), V.D.P. and A.M.A.; methodology, G.L. (Giacomo Lazzarino), V.D.P. and R.M.; software, M.W.S. and A.P.; validation, M.W.S., B.T., S.S., V.D.P. and A.P.; formal analysis, G.L. (Giacomo Lazzarino) and R.M.; data curation, G.L. (Giacomo Lazzarino), S.S. and V.D.P.; writing—original draft preparation, G.L. (Giacomo Lazzarino), G.L. (Giuseppe Lazzarino), B.T. and A.M.A.; writing—review and editing, G.L. (Giacomo Lazzarino), R.M., M.W.S., B.T., A.P., S.S., V.D.P., G.L. (Giuseppe Lazzarino) and A.M.A.; supervision, G.L. (Giuseppe Lazzarino), B.T. and A.M.A. All authors have read and agreed to the published version of the manuscript.
Funding
This research was funded by research funds of the Catholic University of Rome (number DU-665438-BT).
Institutional Review Board Statement
This study was approved by the Ethics Committee of the Catholic University of Rome (approval 1F295.52, released on 20 October 2017) and received approval by the Ethical Committee of the Italian Ministry of Health (approval No. 78/2018-PR released on 2 May 2018, and approval n° 304/2022-PR released on 22 May 2022).
Informed Consent Statement
Not applicable.
Data Availability Statement
Raw data are available as an excel file in Supplementary Materials.
Conflicts of Interest
Authors declare that they have no competing interests.
References
- Demers-Marcil, S.; Coles, J.P. Cerebral metabolic derangements following traumatic brain injury. Curr. Opin. Anaesthesiol. 2022, 35, 562–569. [Google Scholar] [CrossRef] [PubMed]
- Giza, C.C.; Hovda, D.A. The new neurometabolic cascade of concussion. Neurosurgery 2014, 75 (Suppl. S4), S24–S33. [Google Scholar] [CrossRef]
- Di Pietro, V.; Yakoub, K.M.; Caruso, G.; Lazzarino, G.; Signoretti, S.; Barbey, A.K.; Tavazzi, B.; Lazzarino, G.; Belli, A.; Amorini, A.M. Antioxidant Therapies in Traumatic Brain Injury. Antioxidants 2020, 9, 260. [Google Scholar] [CrossRef] [PubMed]
- Dewan, M.C.; Rattani, A.; Gupta, S.; Baticulon, R.E.; Hung, Y.C.; Punchak, M.; Agrawal, A.; Adeleye, A.O.; Shrime, M.G.; Rubiano, A.M.; et al. Estimating the global incidence of traumatic brain injury. J. Neurosurg. 2018, 1, 1–18. [Google Scholar] [CrossRef]
- Martínez-Valverde, T.; Sánchez-Guerrero, A.; Vidal-Jorge, M.; Torné, R.; Castro, L.; Gandara, D.; Munar, F.; Poca, M.A.; Sahuquillo, J. Characterization of the Ionic Profile of the Extracellular Space of the Injured and Ischemic Brain: A Microdialysis Study. J. Neurotrauma 2017, 34, 74–85. [Google Scholar] [CrossRef] [PubMed]
- Lazzarino, G.; Di Pietro, V.; Rinaudo, M.; Nagy, Z.; Barnes, N.M.; Bruce, L.; Signoretti, S.; Mangione, R.; Saab, M.W.; Tavazzi, B.; et al. ILB®, a Low Molecular Weight Dextran Sulphate, Restores Glutamate Homeostasis, Amino Acid Metabolism and Neurocognitive Functions in a Rat Model of Severe Traumatic Brain Injury. Int. J. Mol. Sci. 2022, 23, 8460. [Google Scholar] [CrossRef]
- Jalloh, I.; Carpenter, K.L.; Grice, P.; Howe, D.J.; Mason, A.; Gallagher, C.N.; Helmy, A.; Murphy, M.P.; Menon, D.K.; Carpenter, T.A.; et al. Glycolysis and the pentose phosphate pathway after human traumatic brain injury: Microdialysis studies using 1,2-(13)C2 glucose. J. Cereb. Blood Flow Metab. 2015, 35, 111–120. [Google Scholar] [CrossRef]
- Carteri, R.B.; Kopczynski, A.; Rodolphi, M.S.; Strogulski, N.R.; Sartor, M.; Feldmann, M.; De Bastiani, M.A.; Duval Wannmacher, C.M.; de Franceschi, I.D.; Hansel, G.; et al. Testosterone Administration after Traumatic Brain Injury Reduces Mitochondrial Dysfunction and Neurodegeneration. J. Neurotrauma 2019, 36, 2246–2259. [Google Scholar] [CrossRef]
- Schiavone, S.; Neri, M.; Trabace, L.; Turillazzi, E. The NADPH oxidase NOX2 mediates loss of parvalbumin interneurons in traumatic brain injury: Human autoptic immunohistochemical evidence. Sci. Rep. 2017, 7, 8752. [Google Scholar] [CrossRef]
- Kumar Sahel, D.; Kaira, M.; Raj, K.; Sharma, S.; Singh, S. Mitochondrial dysfunctioning and neuroinflammation: Recent highlights on the possible mechanisms involved in Traumatic Brain Injury. Neurosci. Lett. 2019, 710, 134347. [Google Scholar] [CrossRef]
- Xu, X.; Yang, M.; Zhang, B.; Dong, J.; Zhuang, Y.; Ge, Q.; Niu, F.; Liu, B. HIF-1α participates in secondary brain injury through regulating neuroinflammation. Transl. Neurosci. 2023, 14, 20220272. [Google Scholar] [CrossRef] [PubMed]
- Bolden, C.T.; Olson, S.D.; Cox, C.S., Jr. A decade of blood-brain barrier permeability assays: Revisiting old traumatic brain injury rat data for new insights and experimental design. Microvasc. Res. 2023, 145, 104453. [Google Scholar] [CrossRef] [PubMed]
- Marmarou, A.; Foda, M.A.; van den Brink, W.; Campbell, J.; Kita, H.; Demetriadou, K. A new model of diffuse brain injury in rats. Part I: Pathophysiology and biomechanics. J. Neurosurg. 1994, 80, 291–300. [Google Scholar] [CrossRef] [PubMed]
- Amorini, A.M.; Lazzarino, G.; Di Pietro, V.; Signoretti, S.; Lazzarino, G.; Belli, A.; Tavazzi, B. Metabolic, enzymatic and gene involvement in cerebral glucose dysmetabolism after traumatic brain injury. Biochim. Biophys. Acta 2016, 1862, 679–687. [Google Scholar] [CrossRef]
- Lazzarino, G.; Amorini, A.M.; Signoretti, S.; Musumeci, G.; Lazzarino, G.; Caruso, G.; Pastore, F.S.; Di Pietro, V.; Tavazzi, B.; Belli, A. Pyruvate Dehydrogenase and Tricarboxylic Acid Cycle Enzymes Are Sensitive Targets of Traumatic Brain Injury Induced Metabolic Derangement. Int. J. Mol. Sci. 2019, 20, 5774. [Google Scholar] [CrossRef]
- Di Pietro, V.; Lazzarino, G.; Amorini, A.M.; Signoretti, S.; Hill, L.J.; Porto, E.; Tavazzi, B.; Lazzarino, G.; Belli, A. Fusion or fission: The destiny of mitochondria in traumatic brain injury of different severities. Sci. Rep. 2017, 7, 9189. [Google Scholar] [CrossRef]
- Lazzarino, G.; Amorini, A.M.; Barnes, N.M.; Bruce, L.; Mordente, A.; Lazzarino, G.; Di Pietro, V.; Tavazzi, B.; Belli, A.; Logan, A. Low Molecular Weight Dextran Sulfate (ILB®) Administration Restores Brain Energy Metabolism Following Severe Traumatic Brain Injury in the Rat. Antioxidants 2020, 9, 850. [Google Scholar] [CrossRef]
- Chen, H.; Chan, Y.L.; Nguyen, L.T.; Mao, Y.; de Rosa, A.; Beh, I.T.; Chee, C.; Oliver, B.; Herok, G.; Saad, S.; et al. Moderate traumatic brain injury is linked to acute behaviour deficits and long term mitochondrial alterations. Clin. Exp. Pharmacol. Physiol. 2016, 43, 1107–1114. [Google Scholar] [CrossRef]
- Palzur, E.; Edelman, D.; Sakas, R.; Soustiel, J.F. Etifoxine Restores Mitochondrial Oxidative Phosphorylation and Improves Cognitive Recovery Following Traumatic Brain Injury. Int. J. Mol. Sci. 2021, 22, 12881. [Google Scholar] [CrossRef]
- Rauchová, H. Coenzyme Q10 Effects in Neurological Diseases. Physiol. Res. 2021, 70 (Suppl. S4), S683–S714. [Google Scholar] [CrossRef]
- Turunen, M.; Olsson, J.; Dallner, G. Metabolism and function of coenzyme Q. Biochim. Biophys. Acta 2004, 1660, 171–199. [Google Scholar] [CrossRef]
- Chen, C.L.; Zhang, L.; Jin, Z.; Kasumov, T.; Chen, Y.R. Mitochondrial redox regulation and myocardial ischemia-reperfusion injury. Am. J. Physiol. Cell Physiol. 2022, 322, C12–C23. [Google Scholar] [CrossRef]
- Liu, X.; Liu, Z.; Li, D.; Niu, Y.; Zhang, W.; Sun, J.; Zhang, K.; Zhao, H.; Li, Z.; Shen, C. Mitochondria play a key role in oxidative stress-induced pancreatic islet dysfunction after severe burns. J. Trauma Acute Care Surg. 2022, 92, 1012–1019. [Google Scholar] [CrossRef] [PubMed]
- Onur, S.; Niklowitz, P.; Fischer, A.; Metges, C.C.; Grune, T.; Menke, T.; Rimbach, G.; Döring, F. A comparative study into alterations of coenzyme Q redox status in ageing pigs, mice, and worms. Biofactors 2014, 40, 346–354. [Google Scholar] [CrossRef] [PubMed]
- Pandey, R.; Riley, C.L.; Mills, E.M.; Tiziani, S. Highly sensitive and selective determination of redox states of coenzymes Q9 and Q10 in mice tissues: Application of orbitrap mass spectrometry. Anal. Chim. Acta 2018, 1011, 68–76. [Google Scholar] [CrossRef]
- Ruiz-Jiménez, J.; Priego-Capote, F.; Mata-Granados, J.; Quesada, J.; de Castro, M.L. Determination of the ubiquinol-10 and ubiquinone-10 (coenzyme Q10) in human serum by liquid chromatography tandem mass spectrometry to evaluate the oxidative stress. J. Chromatogr. A 2007, 1175, 242–248. [Google Scholar] [CrossRef] [PubMed]
- Lazzarino, G.; Longo, S.; Amorini, A.M.; Di Pietro, V.; D’Urso, S.; Lazzarino, G.; Belli, A.; Tavazzi, B. Single-step preparation of selected biological fluids for the high performance liquid chromatographic analysis of fat-soluble vitamins and antioxidants. J. Chromatogr. A 2017, 1527, 43–52. [Google Scholar] [CrossRef] [PubMed]
- Dominiak, K.; Jarmuszkiewicz, W. The Relationship between Mitochondrial Reactive Oxygen Species Production and Mitochondrial Energetics in Rat Tissues with Different Contents of Reduced Coenzyme Q. Antioxidants 2021, 10, 533. [Google Scholar] [CrossRef]
- Alcázar-Fabra, M.; Navas, P.; Brea-Calvo, G. Coenzyme Q biosynthesis and its role in the respiratory chain structure. Biochim. Biophys. Acta 2016, 1857, 1073–1078. [Google Scholar] [CrossRef]
- Wang, Y.; Hekimi, S. Understanding Ubiquinone. Trends Cell Biol. 2016, 26, 367–378. [Google Scholar] [CrossRef]
- Hackenbrock, C.R.; Chazotte, B.; Gupte, S.S. The random collision model and a critical assessment of diffusion and collision in mitochondrial electron transport. J. Bioenerg. Biomembr. 1986, 18, 331–368. [Google Scholar] [CrossRef]
- Acin-Perez, R.; Enriquez, J.A. The function of the respiratory supercomplexes: The plasticity model. Biochim. Biophys. Acta 2014, 1837, 444–450. [Google Scholar] [CrossRef]
- Letts, J.A.; Sazanov, L.A. Clarifying the supercomplex: The higher-order organization of the mitochondrial electron transport chain. Nat. Struct. Mol. Biol. 2017, 24, 800–808. [Google Scholar] [CrossRef]
- Azuma, K.; Ikeda, K.; Inoue, S. Functional Mechanisms of Mitochondrial Respiratory Chain Supercomplex Assembly Factors and Their Involvement in Muscle Quality. Int. J. Mol. Sci. 2020, 21, 3182. [Google Scholar] [CrossRef]
- Signorile, A.; Pacelli, C.; Palese, L.L.; Santeramo, A.; Roca, E.; Cocco, T.; De Rasmo, D. cAMP/PKA Signaling Modulates Mitochondrial Supercomplex Organization. Int. J. Mol. Sci. 2022, 23, 9655. [Google Scholar] [CrossRef]
- Knapp-Wilson, A.; Pereira, G.C.; Buzzard, E.; Ford, H.C.; Richardson, A.; Corey, R.A.; Neal, C.; Verkade, P.; Halestrap, A.P.; Gold, V.A.M.; et al. Maintenance of complex I and its supercomplexes by NDUF-11 is essential for mitochondrial structure, function and health. J. Cell Sci. 2021, 134, jcs258399. [Google Scholar] [CrossRef]
- Guan, S.; Zhao, L.; Peng, R. Mitochondrial Respiratory Chain Supercomplexes: From Structure to Function. Int. J. Mol. Sci. 2022, 23, 13880. [Google Scholar] [CrossRef]
- Hernansanz-Agustín, P.; Enríquez, J.A. Functional segmentation of CoQ and cyt c pools by respiratory complex superassembly. Free Radic. Biol. Med. 2021, 167, 232–242. [Google Scholar] [CrossRef] [PubMed]
- Lapuente-Brun, E.; Moreno-Loshuertos, R.; Acín-Pérez, R.; Latorre-Pellicer, A.; Colás, C.; Balsa, E.; Perales-Clemente, E.; Quirós, P.M.; Calvo, E.; Rodríguez-Hernández, M.A.; et al. Supercomplex assembly determines electron flux in the mitochondrial electron transport chain. Science 2013, 340, 1567–1570. [Google Scholar] [CrossRef] [PubMed]
- Enriquez, J.A.; Lenaz, G. Coenzyme q and the respiratory chain: Coenzyme q pool and mitochondrial supercomplexes. Mol. Syndromol. 2014, 5, 119–140. [Google Scholar] [CrossRef] [PubMed]
- Calvo, E.; Cogliati, S.; Hernansanz-Agustín, P.; Loureiro-López, M.; Guarás, A.; Casuso, R.A.; García-Marqués, F.; Acín-Pérez, R.; Martí-Mateos, Y.; Silla-Castro, J.C.; et al. Functional role of respiratory supercomplexes in mice: SCAF1 relevance and segmentation of the Qpool. Sci. Adv. 2020, 6, eaba7509. [Google Scholar] [CrossRef] [PubMed]
- Navarro, A.; Boveris, A. Brain mitochondrial dysfunction in aging, neurodegeneration, and Parkinson’s disease. Front. Aging Neurosci. 2010, 2, 34. [Google Scholar] [CrossRef] [PubMed]
- Manzar, H.; Abdulhussein, D.; Yap, T.E.; Cordeiro, M.F. Cellular Consequences of Coenzyme Q10 Deficiency in Neurodegeneration of the Retina and Brain. Int. J. Mol. Sci. 2020, 21, 9299. [Google Scholar] [CrossRef]
- Cirilli, I.; Damiani, E.; Dludla, P.V.; Hargreaves, I.; Marcheggiani, F.; Millichap, L.E.; Orlando, P.; Silvestri, S.; Tiano, L. Role of Coenzyme Q10 in Health and Disease: An Update on the Last 10 Years (2010–2020). Antioxidants 2021, 10, 1325. [Google Scholar] [CrossRef]
- Tavazzi, B.; Signoretti, S.; Lazzarino, G.; Amorini, A.M.; Delfini, R.; Cimatti, M.; Marmarou, A.; Vagnozzi, R. Cerebral oxidative stress and depression of energy metabolism correlate with severity of diffuse brain injury in rats. Neurosurgery 2005, 56, 582–589. [Google Scholar] [CrossRef] [PubMed]
- Pandya, J.D.; Leung, L.Y.; Hwang, H.M.; Yang, X.; Deng-Bryant, Y.; Shear, D.A. Time-Course Evaluation of Brain Regional Mitochondrial Bioenergetics in a Pre-Clinical Model of Severe Penetrating Traumatic Brain Injury. J. Neurotrauma 2021, 38, 2323–2334. [Google Scholar] [CrossRef]
- Vagnozzi, R.; Tavazzi, B.; Signoretti, S.; Amorini, A.M.; Belli, A.; Cimatti, M.; Delfini, R.; Di Pietro, V.; Finocchiaro, A.; Lazzarino, G. Temporal window of metabolic brain vulnerability to concussions: Mitochondrial-related impairment-part I. Neurosurgery 2007, 61, 379–388. [Google Scholar] [CrossRef]
- Mira, R.G.; Quintanilla, R.A.; Cerpa, W. Mild Traumatic Brain Injury Induces Mitochondrial Calcium Overload and Triggers the Upregulation of NCLX in the Hippocampus. Antioxidants 2023, 12, 403. [Google Scholar] [CrossRef]
- Di Pietro, V.; Lazzarino, G.; Amorini, A.M.; Tavazzi, B.; D’Urso, S.; Longo, S.; Vagnozzi, R.; Signoretti, S.; Clementi, E.; Giardina, B.; et al. Neuroglobin expression and oxidant/antioxidant balance after graded traumatic brain injury in the rat. Free Radic. Biol. Med. 2014, 69, 258–264. [Google Scholar] [CrossRef]
- Fesharaki-Zadeh, A. Oxidative Stress in Traumatic Brain Injury. Int. J. Mol. Sci. 2022, 23, 13000. [Google Scholar] [CrossRef]
- Alavi, M.V.; Fuhrmann, N. Dominant optic atrophy, OPA1, and mitochondrial quality control: Understanding mitochondrial network dynamics. Mol. Neurodegener. 2013, 8, 32. [Google Scholar] [CrossRef]
- Rugarli, E.I.; Langer, T. Mitochondrial quality control: A matter of life and death for neurons. EMBO J. 2012, 31, 1336–1349. [Google Scholar] [CrossRef]
- Pandya, J.D.; Leung, L.Y.; Yang, X.; Flerlage, W.J.; Gilsdorf, J.S.; Deng-Bryant, Y.; Shear, D.A. Comprehensive Profile of Acute Mitochondrial Dysfunction in a Preclinical Model of Severe Penetrating TBI. Front. Neurol. 2019, 10, 605. [Google Scholar] [CrossRef] [PubMed]
- Chen, X.; Mi, L.; Gu, G.; Gao, X.; Gao, X.; Shi, M.; Chai, Y.; Chen, F.; Yang, W.; Zhang, J. Dysfunctional Endoplasmic Reticulum-Mitochondrion Coupling Is Associated with Endoplasmic Reticulum Stress-Induced Apoptosis and Neurological Deficits in a Rodent Model of Severe Head Injury. J. Neurotrauma 2022, 39, 560–576. [Google Scholar] [CrossRef]
- Mourier, A.; Motori, E.; Brandt, T.; Lagouge, M.; Atanassov, I.; Galinier, A.; Rappl, G.; Brodesser, S.; Hultenby, K.; Dieterich, C.; et al. Mitofusin 2 is required to maintain mitochondrial coenzyme Q levels. J. Cell Biol. 2015, 208, 429–442. [Google Scholar] [CrossRef]
- Wang, Q.; Fan, W.; Cai, Y.; Wu, Q.; Mo, L.; Huang, Z.; Huang, H. Protective effects of taurine in traumatic brain injury via mitochondria and cerebral blood flow. Amino Acids 2016, 48, 2169–2177. [Google Scholar] [CrossRef] [PubMed]
- Dai, W.; Cheng, H.L.; Huang, R.Q.; Zhuang, Z.; Shi, J.X. Quantitative detection of the expression of mitochondrial cytochrome c oxidase subunits mRNA in the cerebral cortex after experimental traumatic brain injury. Brain Res. 2009, 1251, 287–295. [Google Scholar] [CrossRef]
- Jelinek, B.A.; Moxley, M.A. Detailed evaluation of pyruvate dehydrogenase complex inhibition in simulated exercise conditions. Biophys. J. 2021, 120, 936–949. [Google Scholar] [CrossRef]
- Ismail, H.; Shakkour, Z.; Tabet, M.; Abdelhady, S.; Kobaisi, A.; Abedi, R.; Nasrallah, L.; Pintus, G.; Al-Dhaheri, Y.; Mondello, S.; et al. Traumatic Brain Injury: Oxidative Stress and Novel Anti-Oxidants Such as Mitoquinone and Edaravone. Antioxidants 2020, 9, 943. [Google Scholar] [CrossRef] [PubMed]


Disclaimer/Publisher’s Note: The statements, opinions and data contained in all publications are solely those of the individual author(s) and contributor(s) and not of MDPI and/or the editor(s). MDPI and/or the editor(s) disclaim responsibility for any injury to people or property resulting from any ideas, methods, instructions or products referred to in the content. |
© 2023 by the authors. Licensee MDPI, Basel, Switzerland. This article is an open access article distributed under the terms and conditions of the Creative Commons Attribution (CC BY) license (https://creativecommons.org/licenses/by/4.0/).