

The Total Dietary Antioxidant Capacity, Its Seasonal Variability, and Dietary Sources in Cardiovascular Patients


Abstract
1. Introduction
2. Materials and Methods
2.1. Patients and Methods
- (A)
- Total diet antioxidant capacity (T-ORAC) (in μmolTE/day);
- (B)
- Total antioxidative density of diet (Q–ORAC), i.e., antioxidative potential per 1000 kcal of diet (in μmolTE/1000 kcal) [34];
- (C)
- Shares (%) of selected food groups in total antioxidative density, distinguishing 19 food groups: (1) total drinks; (2) fruits (gooseberry, pineapple, watermelon, avocado, banana, peach, lemon, grapefruit, pear, apple, blackberry, kiwi, raspberry, tangerine, mango, melon, apricot, nectarine, orange, currant, plum, strawberry, grape, cherry); (3) vegetables, incl. potatoes (eggplant, broccoli, beetroot, onion, garlic, pumpkin, cauliflower, white cabbage, red cabbage, maise, carrot, cucumber, pepper, parsley, potato, tomato, leek, radish, lettuce, celery, chive, spinach); (4) black tea; (5) cocoa; (6) green tea; (7) potatoes; (8) dried fruits (date, fig, apricot, dried plum, raisin, cranberry); (9) fruit juices; (10) herbs and spices (basil, curry, cinnamon, nutmeg, clove, ginger, marjoram, oregano, pepper, parsley, sage, thyme); (11) grains; (12) leguminous plants (white dry bean, string bean, green pea, lentil, soya bean); (13) nuts (almond, pistachio nut, walnut, hazelnut); (14) total wines (all types); (15) vegetable juices; (16) red wines; (17) olive oil; (18) chocolate in total (all types, e.g., candy bar, leavened cake, various types of chocolate); and (19) bitter chocolate.
- (D)
- The total daily diet nutritional value, adjusted per 1000 kcal. To accomplish adjusted values called “nutrient densities”, micronutrient values were expressed as intake (in appropriate units)/1000 kcal. Energy adjustment is advantageous in analyses of diet–disease associations and is used when a food frequency questionnaire (FFQ) is the main dietary assessment instrument [35].
2.2. Statistical Analysis
- -
- T-test for independent samples, men and women (Table 1.),
- -
3. Results
3.1. Sample Characteristics
3.2. Total Dietary Antioxidant Capacity (TAOX) and Nutritional Value of Daily Diet
3.3. Shares of Selected Foods and Seasonal Variability in Total Dietary Antioxidant Capacity
4. Discussion
5. Conclusions
Supplementary Materials
Author Contributions
Funding
Institutional Review Board Statement
Informed Consent Statement
Data Availability Statement
Conflicts of Interest
Abbreviations
| CVD | Cardiovascular disease |
| TAOX | Total dietary antioxidant capacity |
| WHO | World Health Organization |
| ORAC | Oxygen radical capacity |
| T-ORAC | Total diet antioxidant capacity (in μmolTE/day) |
| Q–ORAC | Total antioxidative density of diet (in μmolTE/1000 kcal) |
References
- Villaverde, P.; Lajous, M.; MacDonald, C.-J.; Fagherazzi, G.; Bonnet, F.; Boutron-Ruault, M.-C. High dietary total antioxidant capacity is associated with a reduced risk of hypertension in French women. Nutr. J. 2019, 18, 31. [Google Scholar] [CrossRef]
- Parohan, M.; Anjom-Shoae, J.; Nasiri, M.; Khodadost, M.; Khatibi, S.R.; Sadeghi, O. Dietary total antioxidant capacity and mortality from all causes, cardiovascular disease and cancer: A systematic review and dose–response meta-analysis of prospective cohort studies. Eur. J. Nutr. 2019, 58, 2175–2189. [Google Scholar] [CrossRef]
- Santesso, N.; Manheimer, E. A Summary of a Cochrane Review: Green and Black Tea for the Primary Prevention of Cardiovascular Disease. Glob. Adv. Health Med. 2014, 3, 66–67. [Google Scholar] [CrossRef] [PubMed]
- Hermsdorff, H.H.M.; Puchau, B.; Volp, A.C.P.; Barbosa, K.B.F.; Bressan, J.; Zulet, M.Á.; Martínez, J.A. Dietary total antioxidant capacity is inversely related to central adiposity as well as to metabolic and oxidative stress markers in healthy young adults. Nutr. Metab. 2011, 8, 59. [Google Scholar] [CrossRef] [PubMed]
- Okubo, H.; Syddall, H.E.; Phillips, D.I.W.; Sayer, A.A.; Dennison, E.M.; Cooper, C.; Robinson, S.M. Dietary total antioxidant capacity is related to glucose tolerance in older people: The Hertfordshire Cohort Study. Nutr. Metab. Cardiovasc. Dis. 2014, 24, 301–308. [Google Scholar] [CrossRef] [PubMed]
- Psaltopoulou, T.; Panagiotakos, D.B.; Pitsavos, C.; Chrysochoou, C.; Detopoulou, P.; Skoumas, J.; Stefanadis, C. Dietary antioxidant capacity is inversely associated with diabetes biomarkers: The ATTICA study. Nutr. Metab. Cardiovasc. Dis. 2011, 21, 561–567. [Google Scholar] [CrossRef]
- WHO. Cardiovascular Diseases (CVDs). Available online: http://www.who.int/cardiovascular_diseases/en/ (accessed on 30 June 2021).
- Kaliora, A.; Dedoussis, G. Natural antioxidant compounds in risk factors for CVD. Pharmacol. Res. 2007, 56, 99–109. [Google Scholar] [CrossRef]
- Bruckdorfer, K.R. Antioxidants and CVD. Proc. Nutr. Soc. 2008, 67, 214–222. [Google Scholar] [CrossRef]
- Jain, A.; Mehra, N.; Swarnakar, N. Role of Antioxidants for the Treatment of Cardiovascular Diseases: Challenges and Opportunities. Curr. Pharm. Des. 2015, 21, 4441–4455. [Google Scholar] [CrossRef]
- Kusano, C.; Ferrari, B. Total antioxidant capacity: A biomarker in biomedical and nutritional studies. J. Cell Mol. Biol. 2008, 7, 1–15. [Google Scholar]
- Puchau, B.; Zulet, M.Á.; de Echávarri, A.G.; Hermsdorff, H.H.M.; Martínez, J.A. Dietary total antioxidant capacity: A novel indicator of diet quality in healthy young adults. J. Am. Coll. Nutr. 2009, 28, 648–656. [Google Scholar] [CrossRef]
- Varadharaj, S.; Kelly, O.J.; Khayat, R.N.; Kumar, P.S.; Ahmed, N.; Zweier, J.L. Role of Dietary Antioxidants in the Preservation of Vascular Function and the Modulation of Health and Disease. Front. Cardiovasc. Med. 2017, 4, 64. [Google Scholar] [CrossRef]
- Zhang, P.-Y.; Xu, X.; Li, X.-C. Cardiovascular diseases: Oxidative damage and antioxidant protection. Eur. Rev. Med. Pharmacol. Sci. 2014, 18, 3091–3096. [Google Scholar]
- Rodríguez-Monforte, M.; Flores-Mateo, G.; Sánchez, E. Dietary patterns and CVD: A systematic review and meta-analysis of observational studies. Br. J. Nutr. 2015, 114, 1341–1359. [Google Scholar] [CrossRef]
- Wang, Y.; Chun, O.; Song, W. Plasma and Dietary Antioxidant Status as Cardiovascular Disease Risk Factors: A Review of Human Studies. Nutrients 2013, 5, 2969–3004. [Google Scholar] [CrossRef]
- Gülçin, I. Antioxidant activity of food constituents: An overview. Arch. Toxicol. 2012, 86, 345–391. [Google Scholar] [CrossRef]
- Gramza-Michalowska, A.; Korczak, J. Oxygen radical absorbance capacity of selected food products. Acta Sci. Pol. Technol. Aliment. 2013, 12, 175–180. [Google Scholar]
- Kulczyński, B.; Sidor, A.; Gramza-Michałowska, A. Antioxidant potential of phytochemicals in pumpkin varieties belonging to Cucurbita moschata and Cucurbita pepo species. CyTA J. Food 2020, 18, 472–484. [Google Scholar] [CrossRef]
- Gramza-Michałowska, A.; Człapka-Matyasik, M. Evaluation of the antiradical potential of fruit and vegetable snacks. Acta Sci. Pol. Technol. Aliment. 2011, 10, 63–72. [Google Scholar]
- Thaipong, K.; Boonprakob, U.; Crosby, K.; Cisneros-Zevallos, L.; Hawkins Byrne, D. Comparison of ABTS, DPPH, FRAP, and ORAC assays for estimating antioxidant activity from guava fruit extracts. J. Food Compos. Anal. 2006, 19, 669–675. [Google Scholar] [CrossRef]
- Rodríguez-Bonilla, P.; Gandía-Herrero, F.; Matencio, A.; García-Carmona, F.; López-Nicolás, J.M. Comparative Study of the Antioxidant Capacity of Four Stilbenes Using ORAC, ABTS+, and FRAP Techniques. Food Anal. Methods 2017, 10, 2994–3000. [Google Scholar] [CrossRef]
- Ou, B.; Huang, D.; Hampsch-Woodill, M.; Flanagan, J.A.; Deemer, E.K. Analysis of Antioxidant Activities of Common Vegetables Employing Oxygen Radical Absorbance Capacity (ORAC) and Ferric Reducing Antioxidant Power (FRAP) Assays: A Comparative Study. J. Agric. Food Chem. 2002, 50, 3122–3128. [Google Scholar] [CrossRef] [PubMed]
- Pacifico, S.; Piccolella, S.; Galasso, S.; Fiorentino, A.; Kretschmer, N.; Pan, S.P.; Bauer, R.; Monaco, P. Influence of harvest season on chemical composition and bioactivity of wild rue plant hydroalcoholic extracts. Food Chem. Toxicol. 2016, 90, 102–111. [Google Scholar] [CrossRef] [PubMed]
- Kim, K.; Vance, T.M.; Chun, O.K. Greater flavonoid intake is associated with improved CVD risk factors in US adults. Br. J. Nutr. 2016, 115, 1481–1488. [Google Scholar] [CrossRef]
- Kim, K.; Vance, T.; Chun, O. Greater Total Antioxidant Capacity from Diet and Supplements Is Associated with a Less Atherogenic Blood Profile in U.S. Adults. Nutrients 2016, 8, 15. [Google Scholar] [CrossRef]
- Kobayashi, S.; Asakura, K.; Suga, H.; Sasaki, S. Inverse association between dietary habits with high total antioxidant capacity and prevalence of frailty among elderly Japanese women: A multicenter cross-sectional study. J. Nutr. Health Aging 2014, 18, 827–836. [Google Scholar] [CrossRef]
- Mozaffari, H.; Daneshzad, E.; Surkan, P.J.; Azadbakht, L. Dietary Total Antioxidant Capacity and Cardiovascular Disease Risk Factors: A Systematic Review of Observational Studies. J. Am. Coll. Nutr. 2018, 37, 533–545. [Google Scholar] [CrossRef]
- Aviram, M. Review of human studies on oxidative damage and antioxidant protection related to cardiovascular diseases. Free Radic. Res. 2000, 33, S85–S97. [Google Scholar]
- Człapka-Matyasik, M.; Ast, K. Total Antioxidant Capacity and Its Dietary Sources and Seasonal Variability in Diets of Women with Different Physical Activity Levels. Polish J. Food Nutr. Sci. 2014, 64, 267–276. [Google Scholar] [CrossRef]
- Szponar, L.; Rychlik, E.; Wolnicka, K. Album of Photographs of Food Products and Dishes; National Food and Nutrition Institute: Warsaw, Poland, 2000. [Google Scholar]
- Wadolowska, L.; Ulewicz, N.; Sobas, K.; Wuenstel, J.W.; Slowinska, M.A.; Niedzwiedzka, E.; Czlapka-Matyasik, M. Dairy-related dietary patterns, dietary calcium, body weight and composition: A study of obesity in polish mothers and daughters, the MODAF project. Nutrients 2018, 10, 90. [Google Scholar] [CrossRef]
- Haytowitz, D.B.; Bhagwat, S. USDA Database for the Oxygen Radical Absorbance Capacity (ORAC) of Selected Foods, Release 2; U.S. Department of Agriculture: Beltsville, MD, USA, 2010.
- Tomova, G.D.; Arnold, K.F.; Gilthorpe, M.S.; Tennant, P.W.G. Adjustment for energy intake in nutritional research: A causal inference perspective. Am. J. Clin. Nutr. 2022, 115, 189–198. [Google Scholar] [CrossRef]
- National Cancer Institute Learn More about Energy Adjustment | Dietary Assessment Primer. Available online: https://dietassessmentprimer.cancer.gov/learn/adjustment.html (accessed on 20 January 2023).
- Sean, P.K.S. Sample Size Calculator. Available online: https://clincalc.com/stats/samplesize.aspx (accessed on 7 May 2021).
- Cleghorn, C.L.; Harrison, R.A.; Ransley, J.K.; Wilkinson, S.; Thomas, J.; Cade, J.E. Can a dietary quality score derived from a short-form FFQ assess dietary quality in UK adult population surveys? Public Health Nutr. 2016, 19, 2915–2923. [Google Scholar] [CrossRef]
- Cade, J.E.; Burley, V.J.; Warm, D.L.; Thompson, R.L.; Margetts, B.M. Food-frequency questionnaires: A review of their design, validation and utilisation. Nutr. Res. Rev. 2004, 17, 5–22. [Google Scholar] [CrossRef]
- Hervert-Hernández, D.; García, O.P.; Rosado, J.L.; Goñi, I. The contribution of fruits and vegetables to dietary intake of polyphenols and antioxidant capacity in a Mexican rural diet: Importance of fruit and vegetable variety. Food Res. Int. 2011, 44, 1182–1189. [Google Scholar] [CrossRef]
- González, C.M.; Martínez, L.; Ros, G.; Nieto, G. Evaluation of nutritional profile and total antioxidant capacity of the Mediterranean diet of southern Spain. Food Sci. Nutr. 2019, 7, 3853–3862. [Google Scholar] [CrossRef]
- Han, J.H.; Lee, H.J.; Cho, M.R.; Chang, N.; Kim, Y.; Oh, S.Y.; Kang, M.H. Total Antioxidant Capacity of the Korean Diet. Available online: https://www.ncbi.nlm.nih.gov/pmc/articles/PMC3988508/ (accessed on 21 July 2021).
- Martínez, J.; Nieto, G.; Ros, G. Total antioxidant capacity of meat and meat products consumed in a reference ‘Spanish standard diet’. Int. J. Food Sci. Technol. 2014, 49, 2610–2618. [Google Scholar] [CrossRef]
- Sheikhi, M.; Sharifi-Zahabi, E.; Paknahad, Z. Dietary Antioxidant Capacity and Its Association with Preeclampsia. Clin. Nutr. Res. 2017, 6, 47. [Google Scholar] [CrossRef]
- Fulgoni, V.L.; Keast, D.R.; Drewnowski, A. Development and Validation of the Nutrient-Rich Foods Index: A Tool to Measure Nutritional Quality of Foods. J. Nutr. 2009, 139, 1549–1554. [Google Scholar] [CrossRef]
- Drewnowski, A.; Fulgoni, V.L. Nutrient density: Principles and evaluation tools. Am. J. Clin. Nutr. 2014, 99, 1223S–1228S. [Google Scholar] [CrossRef]
- Drewnowski, A. Defining Nutrient Density: Development and Validation of the Nutrient Rich Foods Index. J. Am. Coll. Nutr. 2009, 28, 421S–426S. [Google Scholar] [CrossRef]
- Darmon, N.; Darmon, M.; Maillot, M.; Drewnowski, A. A Nutrient Density Standard for Vegetables and Fruits: Nutrients per Calorie and Nutrients per Unit Cost. J. Am. Diet. Assoc. 2005, 105, 1881–1887. [Google Scholar] [CrossRef] [PubMed]
- Nowak, D.; Gośliński, M. Assessment of Antioxidant Properties of Classic Energy Drinks in Comparison with Fruit Energy Drinks. Foods 2020, 9, 56. [Google Scholar] [CrossRef] [PubMed]
- Hong, M.Y.; Mansour, L.; Klarich, D.S.; Copp, L.; Bloem, K. Comparison of antioxidant capacity of commonly consumed youth beverages in the United States. Int. J. Food Sci. Technol. 2016, 51, 1409–1416. [Google Scholar] [CrossRef]
- Ramadan-Hassanien, M.F. Total antioxidant potential of juices, beverages and hot drinks consumed in Egypt screened by DPPH in vitro assay. Grasas y Aceites 2008, 59, 254–259. [Google Scholar] [CrossRef]
- Brenna, O.V. Antioxidant Capacity of Soft Drinks. In Processing and Impact on Antioxidants in Beverages; Elsevier: Amsterdam, The Netherlands, 2014; pp. 51–56. [Google Scholar]
- Svilaas, A.; Sakhi, A.K.; Andersen, L.F.; Svilaas, T.; Ström, E.C.; Jacobs, D.R.; Ose, L.; Blomhoff, R. Intakes of Antioxidants in Coffee, Wine, and Vegetables Are Correlated with Plasma Carotenoids in Humans. J. Nutr. 2004, 134, 562–567. [Google Scholar] [CrossRef]
- Reyes, C.M.; Cornelis, M.C. Caffeine in the diet: Country-level consumption and guidelines. Nutrients 2018, 10, 1772. [Google Scholar] [CrossRef]
- Sobas, K.; Wadolowska, L.; Slowinska, M.A.; Czlapka-Matyasik, M.; Wuenstel, J.; Niedzwiedzka, E. Like Mother, Like Daughter? Dietary and Non-Dietary Bone Fracture Risk Factors in Mothers and Their Daughters. Iran. J. Public Health 2015, 44, 939–952. [Google Scholar]
- De Irala-Estévez, J.; Groth, M.; Johansson, L.; Oltersdorf, U.; Prättälä, R.; Martínez-González, M.A. A systematic review of socio-economic differences in food habits in Europe: Consumption of fruit and vegetables. Eur. J. Clin. Nutr. 2000, 54, 706–714. [Google Scholar] [CrossRef]
- Nasreddine, L.; Chamieh, M.C.; Ayoub, J.; Hwalla, N.; Sibai, A.-M.; Naja, F. Sex disparities in dietary intake across the lifespan: The case of Lebanon. Nutr. J. 2020, 19, 24. [Google Scholar] [CrossRef]
- Micha, R.; Khatibzadeh, S.; Shi, P.; Andrews, K.G.; Engell, R.E.; Mozaffarian, D. Global, regional and national consumption of major food groups in 1990 and 2010: A systematic analysis including 266 country-specific nutrition surveys worldwide. BMJ Open 2015, 5, e008705. [Google Scholar] [CrossRef]
- Livingstone, K.M.; Burton, M.; Brown, A.K.; McNaughton, S.A. Exploring barriers to meeting recommendations for fruit and vegetable intake among adults in regional areas: A mixed-methods analysis of variations across socio-demographics. Appetite 2020, 153, 104750. [Google Scholar] [CrossRef]
- Baker, A.H.; Wardle, J. Sex differences in fruit and vegetable intake in older adults. Appetite 2003, 40, 269–275. [Google Scholar] [CrossRef]
- Drewnowski, A. The Nutrient Rich Foods Index helps to identify healthy, affordable foods. Am. J. Clin. Nutr. 2010, 91, 1095S–1101S. [Google Scholar] [CrossRef]
- Westenhoefer, J. Age and gender dependent profile of food choice. Forum Nutr. 2005, 57, 44–51. [Google Scholar] [CrossRef]
- Byrnes, N.K.; Hayes, J.E. Gender differences in the influence of personality traits on spicy food liking and intake. Food Qual. Prefer. 2015, 42, 12–19. [Google Scholar] [CrossRef]
- Logue, A.W.; Smith, M.E. Predictors of food preferences in adult humans. Appetite 1986, 7, 109–125. [Google Scholar] [CrossRef]
- Taguchi, C.; Kishimoto, Y.; Takeuchi, I.; Tanaka, M.; Iwashima, T.; Fukushima, Y.; Kondo, K. Estimated Dietary Polyphenol Intake and Its Seasonal Variations among Japanese University Students. J. Nutr. Sci. Vitaminol. 2019, 65, 192–195. [Google Scholar] [CrossRef]
- Stelmach-Mardas, M.; Iqbal, K.; Mardas, M.; Schwingshackl, L.; Walkowiak, J.; Tower, R.J.; Boeing, H. Synchronic inverse seasonal rhythmus of energy density of food intake and sleep quality: A contribution to chrono-nutrition from a Polish adult population. Eur. J. Clin. Nutr. 2017, 71, 718–722. [Google Scholar] [CrossRef]
- Stelmach-Mardas, M.; Kleiser, C.; Uzhova, I.; Penalvo, J.L.; La Torre, G.; Palys, W.; Lojko, D.; Nimptsch, K.; Suwalska, A.; Linseisen, J.; et al. Seasonality of food groups and total energy intake: A systematic review and meta-analysis. Eur. J. Clin. Nutr. 2016, 70, 700–708. [Google Scholar] [CrossRef] [PubMed]
- Shahar, D.R.; Yerushalmi, N.; Lubin, F.; Froom, P.; Shahar, A.; Kristal-Boneh, E. Seasonal variations in dietary intake affect the consistency of dietary assessment. Eur. J. Epidemiol. 2001, 17, 129–133. [Google Scholar] [CrossRef]
- Van der Toorn, J.E.; Cepeda, M.; Kiefte-de Jong, J.C.; Franco, O.H.; Voortman, T.; Schoufour, J.D. Seasonal variation of diet quality in a large middle-aged and elderly Dutch population-based cohort. Eur. J. Nutr. 2020, 59, 493–504. [Google Scholar] [CrossRef] [PubMed]

| Variable | Men + Women (n = 143) | Men (n = 82) | Women (n = 61) | p 3 | |||||||||
|---|---|---|---|---|---|---|---|---|---|---|---|---|---|
| X 4 (95%CI) | Me 5 | Min. 6 | Max. 7 | X (95%CI) | Me | Min. | Max. | X (95%CI) | Me | Min. | Max. | ||
| Age (Years) | 61 (59; 63) | 61 | 23 | 89 | 60 (57; 62) | 61 | 23 | 83 | 63 (61; 66) | 61 | 46 | 89 | NS |
| Weight (kg) | 83.6 (81.1; 86.2) | 82.8 | 50.0 | 136.0 | 89.5 (86.4; 92.5) | 90.0 | 60.0 | 136.0 | 75.9 (72.5; 79.4) | 76.5 | 50.0 | 109.0 | *** |
| BMI (kg/m2) | 29.3 (28.5; 30.1) | 29.1 | 19.0 | 44.8 | 29.2 (28.3; 30.1) | 29.1 | 19.4 | 43.0 | 29.4 (27.9; 30.8) | 29.7 | 19.0 | 44.8 | NS |
| Waist Circumference (cm) | 105 (103; 107) | 105 | 73 | 142 | 107 (104; 110) | 106 | 78 | 137 | 102 (98; 105) | 103 | 73 | 142 | ** |
| Waist-to-Height Ratio (-) | 0.62 (0.61; 0.64) | 0.62 | 0.44 | 0.93 | 0.61 (0.60; 0.63) | 0.60 | 0.44 | 0.81 | 0.63 (0.61; 0.66) | 0.64 | 0.46 | 0.93 | NS |
| Mean of Five Skinfold Thicknesses (mm) 2 | 20.5 (19.6; 21.5) | 20.8 | 7.2 | 35.2 | 18.8 (17.5; 20.0) | 17.8 | 7.2 | 32.7 | 22.9 (21.5; 24.2) | 23.4 | 8.1 | 35.2 | *** |
| n | % | n | % | n | % | ||||||||
| Place of Residence Village Town < 500,000 City ≥ 500,000 | 13 21 109 | 9 15 76 | 7 12 63 | 9 15 77 | 6 9 46 | 10 15 75 | NS. | ||||||
| Education: Primary Lower Secondary Higher Secondary Higher | 14 45 59 25 | 10 31 41 17 | 3 33 32 14 | 4 40 39 17 | 2 15 33 11 | 3 25 54 18 | NS. | ||||||
| Employment Status Unemployed Employed Retired Pensioner | 5 48 65 25 | 3 34 19 18 | 3 33 32 14 | 4 40 39 17 | 2 15 33 11 | 3 25 54 18 | *** | ||||||
| Variable | T (n = 143) Men + Women | T(n = 82) Men | T (n = 61) Women | p 2 | |||||||||
|---|---|---|---|---|---|---|---|---|---|---|---|---|---|
| X 3 (95%CI) | Me 4 | Min. 5 | Max. 6 | X (95%CI) | Me | Min. | Max. | X (95%CI) | Me | Min. | Max. | ||
| Total Drinks | 32.9 (30.2; 35.7) | 33.3 | 0.0 | 74.1 | 32.6 (28.8; 36.3) | 32.1 | 0.0 | 74.1 | 33.5 (29.5; 37.4) | 35.3 | 0.0 | 65.6 | NS |
| Fruits | 27.6 (25.3; 29.8) | 25.6 | 1.9 | 82.0 | 27.8 (24.5; 31.0) | 25.5 | 1.9 | 82.0 | 27.2 (24.0; 30.5) | 26.0 | 4.8 | 56.2 | NS |
| Vegetables, Incl. Potatoes | 16.5 (15.2; 17.8) | 15.0 | 3.9 | 46.5 | 15.7 (13.9; 17.4) | 14.6 | 3.9 | 42.1 | 17.6 (15.6; 19.6) | 15.7 | 6.3 | 46.5 | * |
| Black Tea | 14.4 (13.0; 15.8) | 14.5 | 0.0 | 37.2 | 13.9 (11.9; 15.8) | 14.0 | 0.0 | 37.2 | 15.1 (13.0; 17.2) | 15.7 | 0.0 | 34.2 | NS |
| Cocoa | 13.3 (11.6; 14.9) | 13.2 | 0.0 | 40.1 | 14.0 (11.8; 16.3) | 13.5 | 0.0 | 40.1 | 12.2 (9.7; 14.7) | 11.0 | 0.0 | 31.4 | NS |
| Green Tea | 5.3 (4.0; 6.5) | 0.0 | 0.0 | 32.2 | 4.7 (3.1; 6.3) | 0.0 | 0.0 | 25.8 | 6.1 (4.1; 8.2) | 2.7 | 0.0 | 32.2 | NS |
| Potatoes | 5.2 (4.4; 6.0) | 4.4 | 0.0 | 32.7 | 5.7 (4.5; 6.8) | 5.0 | 0.0 | 32.7 | 4.6 (3.4; 5.8) | 3.8 | 0.0 | 31.3 | NS |
| Dry Fruits | 3.4 (2.7; 4.1) | 1.6 | 0.0 | 18.6 | 3.2 (2.3; 4.2) | 1.1 | 0.0 | 15.9 | 3.7 (2.6; 4.8) | 2.5 | 0.0 | 18.6 | NS |
| Fruit Juices | 2.7 (1.8; 3.6) | 0.0 | 0.0 | 25.9 | 3.2 (1.9; 4.5) | 0.0 | 0.0 | 25.9 | 2.0 (0.9; 3.1) | 0.0 | 0.0 | 22.7 | NS |
| Herbs and Spices | 1.9 (1.5; 2.4) | 0.9 | 0.0 | 16.8 | 1.4 (0.9; 2.0) | 0.3 | 0.0 | 13.9 | 2.6 (1.9; 3.4) | 2.0 | 0.0 | 16.8 | * |
| Grains | 1.1 (0.8; 1.5) | 0.0 | 0.0 | 15.0 | 1.0 (0.5; 1.5) | 0.0 | 0.0 | 15.0 | 1.3 (0.8; 1.9) | 0.4 | 0.0 | 9.2 | NS |
| Legumes | 1.0 (0.6; 1.4) | 0.0 | 0.0 | 13.3 | 1.1 (0.5; 1.7) | 0.0 | 0.0 | 13.3 | 0.8 (0.3; 1.3) | 0.0 | 0.0 | 10.3 | NS |
| Nuts | 0.9 (0.6; 1.2) | 0.0 | 0.0 | 14.4 | 0.9 (0.4; 1.4) | 0.0 | 0.0 | 14.4 | 0.8 (0.4; 1.2) | 0.0 | 0.0 | 6.8 | NS |
| Wines | 0.5 (0.1; 1.0) | 0.0 | 0.0 | 28.3 | 0.8 (0.0; 1.6) | 0.0 | 0.0 | 28.3 | 0.2 (0.0; 0.3) | 0.0 | 0.0 | 3.7 | NS |
| Vegetable Juices | 0.4 (0.2; 0.5) | 0.0 | 0.0 | 6.0 | 0.4 (0.2; 0.6) | 0.0 | 0.0 | 6.0 | 0.4 (0.2; 0.6) | 0.0 | 0.0 | 4.5 | NS |
| Red Wines | 0.4 (0.1; 0.8) | 0.0 | 0.0 | 22.2 | 0.6 (0.0; 1.3) | 0.0 | 0.0 | 22.2 | 0.1 (0.0; 0.2) | 0.0 | 0.0 | 2.6 | NS |
| Oil from Olives | 0.2 (0.1; 0.2) | 0.0 | 0.0 | 1.9 | 0.1 (0.1; 0.2) | 0.0 | 0.0 | 1.9 | 0.2 (0.1; 0.3) | 0.0 | 0.0 | 1.4 | NS |
| Chocolate in Total | 0.04 (0.04; 0.11) | 0.00 | 0.00 | 5.18 | 0.0 (0.0; 0.0) | 0.0 | 0.0 | 0.0 | 0.1 (0.1; 0.3) | 0.0 | 0.0 | 5.2 | NS |
| Dark Chocolate | 0.01 (0.01; 0.04) | 0.00 | 0.00 | 1.99 | 0.0 (0.0; 0.0) | 0.0 | 0.0 | 0.0 | 0.0 (0.0; 0.1) | 0.0 | 0.0 | 2.0 | NS |
| Variable | Spring 2 | Summer | Autumn | Winter | p 3 |
|---|---|---|---|---|---|
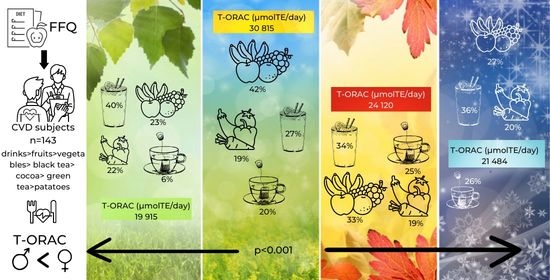
| T-ORAC (μmolTE/day) | 19,915 (18,202; 21,628) | 30,815 (28,260; 33,370) | 24,120 (21,901; 26,338) | 21,484 (19,564; 23,403) | *** |
| Total Drinks | 39.7 (36.3; 42.9) | 27.1 (24.5; 29.7) | 33.8 (30.7; 36.8) | 36.2 (32.9;39.5) | *** |
| Fruits | 23.0 (20.3; 25.6) | 42.1 (39.5; 44.7) | 33.1 (30.3; 36.0) | 27.0 (24.3; 29.6) | *** |
| Vegetables, Incl. Potatoes | 22.0 (20.2; 23.8) | 18.9 (17.6; 20.3) | 19.2 (17.3; 12.1) | 20.1 (18.1; 22.2) | ** |
| Black Tea | 5.7 (3.9; 7.4) | 19.8 (17.1; 22.4) | 24.5 (21.3; 27.6) | 26.3 (22.9; 29.6) | *** |
| Cocoa | 1.83 (0.51; 3.15) | 1.4 (0.4; 2.3) | 1.6 (0.4; 2.8) | 1.7 (0.5; 3.0) | NS |
| Green Tea | 2.8 (2.3; 3.3) | 3.7 (2.5; 4.9) | 0.01 (0.01; 0.03) | 5.1 (3.5; 6.8) | NS |
| Dry Fruits | 0.9 (0.4; 1.3) | 0.5 (0.3; 0.6) | 1.2 (0.8; 1.5) | 0.8 (0.4; 1.3) | NS |
| Herbs and Spices | 2.4 (1.9; 2.9) | 1.5 (1.1; 1.8) | 2.0 (1.5; 2.4) | 2.2 (1.7; 2.7) | NS |
| Grains | 0.5 (0.2; 0.8) | 0.4 (0.2; 0.6) | 0.5 (0.2; 0.7) | 0.5 (0.2; 0.7) | NS |
| Legumes | 0.4 (0.2; 0.6) | 1.4 (1.2; 1.7) | 0.4 (0.2; 0.6) | 0.4 (0.2; 0.6) | NS |
| Nuts | 1.8 (1.1; 2.5) | 1.1 (0.7; 1.5) | 1.5 (0.9; 2.0) | 1.7 (1.0; 2.4) | NS |
| Wines | 0.6 (0.1; 1.1) | 0.4 (0.04; 0.8) | 0.51 (0.1; 0.9) | 0.5 (0.05; 1.0) | NS |
| Vegetable Juices | 0.4 (0.2;0.5) | 0.2 (0.1; 0.4) | 0.3 (0.2; 0.5) | 0.4 (0.2; 0.5) | NS |
| Red Wines | 0.6 (0.05; 1.1) | 0.4 (0.04; 0.8) | 0.5 (0.1; 0.9) | 0.5 (0.05; 1.0) | NS |
| Oil from Olives | 0.2 (0.2; 0.3) | 0.2 (0.1; 0.2) | 0.2 (0.2; 0.3) | 0.2 (0.1; 0.3) | NS |
| Chocolate in Total | 8.7 (6.4; 11.1) | 6.8 (5.0; 8.7) | 8.1 (6.0; 10.3) | 9 (6.4; 11.1) | NS |
| Dark Chocolate | 3.2 (2.0; 4.4) | 2.3 (1.4; 3.2) | 2.5 (1.6; 3.4) | 2.9 (1.8; 3.9) | NS |
Disclaimer/Publisher’s Note: The statements, opinions and data contained in all publications are solely those of the individual author(s) and contributor(s) and not of MDPI and/or the editor(s). MDPI and/or the editor(s) disclaim responsibility for any injury to people or property resulting from any ideas, methods, instructions or products referred to in the content. |
© 2023 by the authors. Licensee MDPI, Basel, Switzerland. This article is an open access article distributed under the terms and conditions of the Creative Commons Attribution (CC BY) license (https://creativecommons.org/licenses/by/4.0/).
Share and Cite
Czlapka-Matyasik, M.; Gramza-Michalowska, A. The Total Dietary Antioxidant Capacity, Its Seasonal Variability, and Dietary Sources in Cardiovascular Patients. Antioxidants 2023, 12, 292. https://doi.org/10.3390/antiox12020292
Czlapka-Matyasik M, Gramza-Michalowska A. The Total Dietary Antioxidant Capacity, Its Seasonal Variability, and Dietary Sources in Cardiovascular Patients. Antioxidants. 2023; 12(2):292. https://doi.org/10.3390/antiox12020292
Chicago/Turabian StyleCzlapka-Matyasik, Magdalena, and Anna Gramza-Michalowska. 2023. "The Total Dietary Antioxidant Capacity, Its Seasonal Variability, and Dietary Sources in Cardiovascular Patients" Antioxidants 12, no. 2: 292. https://doi.org/10.3390/antiox12020292
APA StyleCzlapka-Matyasik, M., & Gramza-Michalowska, A. (2023). The Total Dietary Antioxidant Capacity, Its Seasonal Variability, and Dietary Sources in Cardiovascular Patients. Antioxidants, 12(2), 292. https://doi.org/10.3390/antiox12020292