
Polish and New Zealand Propolis as Sources of Antioxidant Compounds Inhibit Glioblastoma (T98G, LN-18) Cell Lines and Astrocytoma Cells Derived from Patient


 ,
,  ,
,  ,
, 
Abstract
:1. Introduction
2. Materials and Methods
2.1. Materials
2.2. Sample Preparations
2.3. Gas Chromatography–Mass Spectrometry (GC-MS) Analysis
2.4. Total Phenolic Content Analysis
2.5. Toxic Elements Analysis (Arsenic, Cadmium, and Lead)
2.6. Cell Culture
2.7. Cell Viability Assay
2.8. DNA Synthesis Assay
2.9. Migration Assay (Scratch Assay)
2.10. Cell Cycle Assay
2.11. Annexin V Assay
2.12. Statistical Analysis
3. Results
3.1. Chemical Composition and Total Phenolic Content of PPE and MPE
3.2. Toxic Elements Content
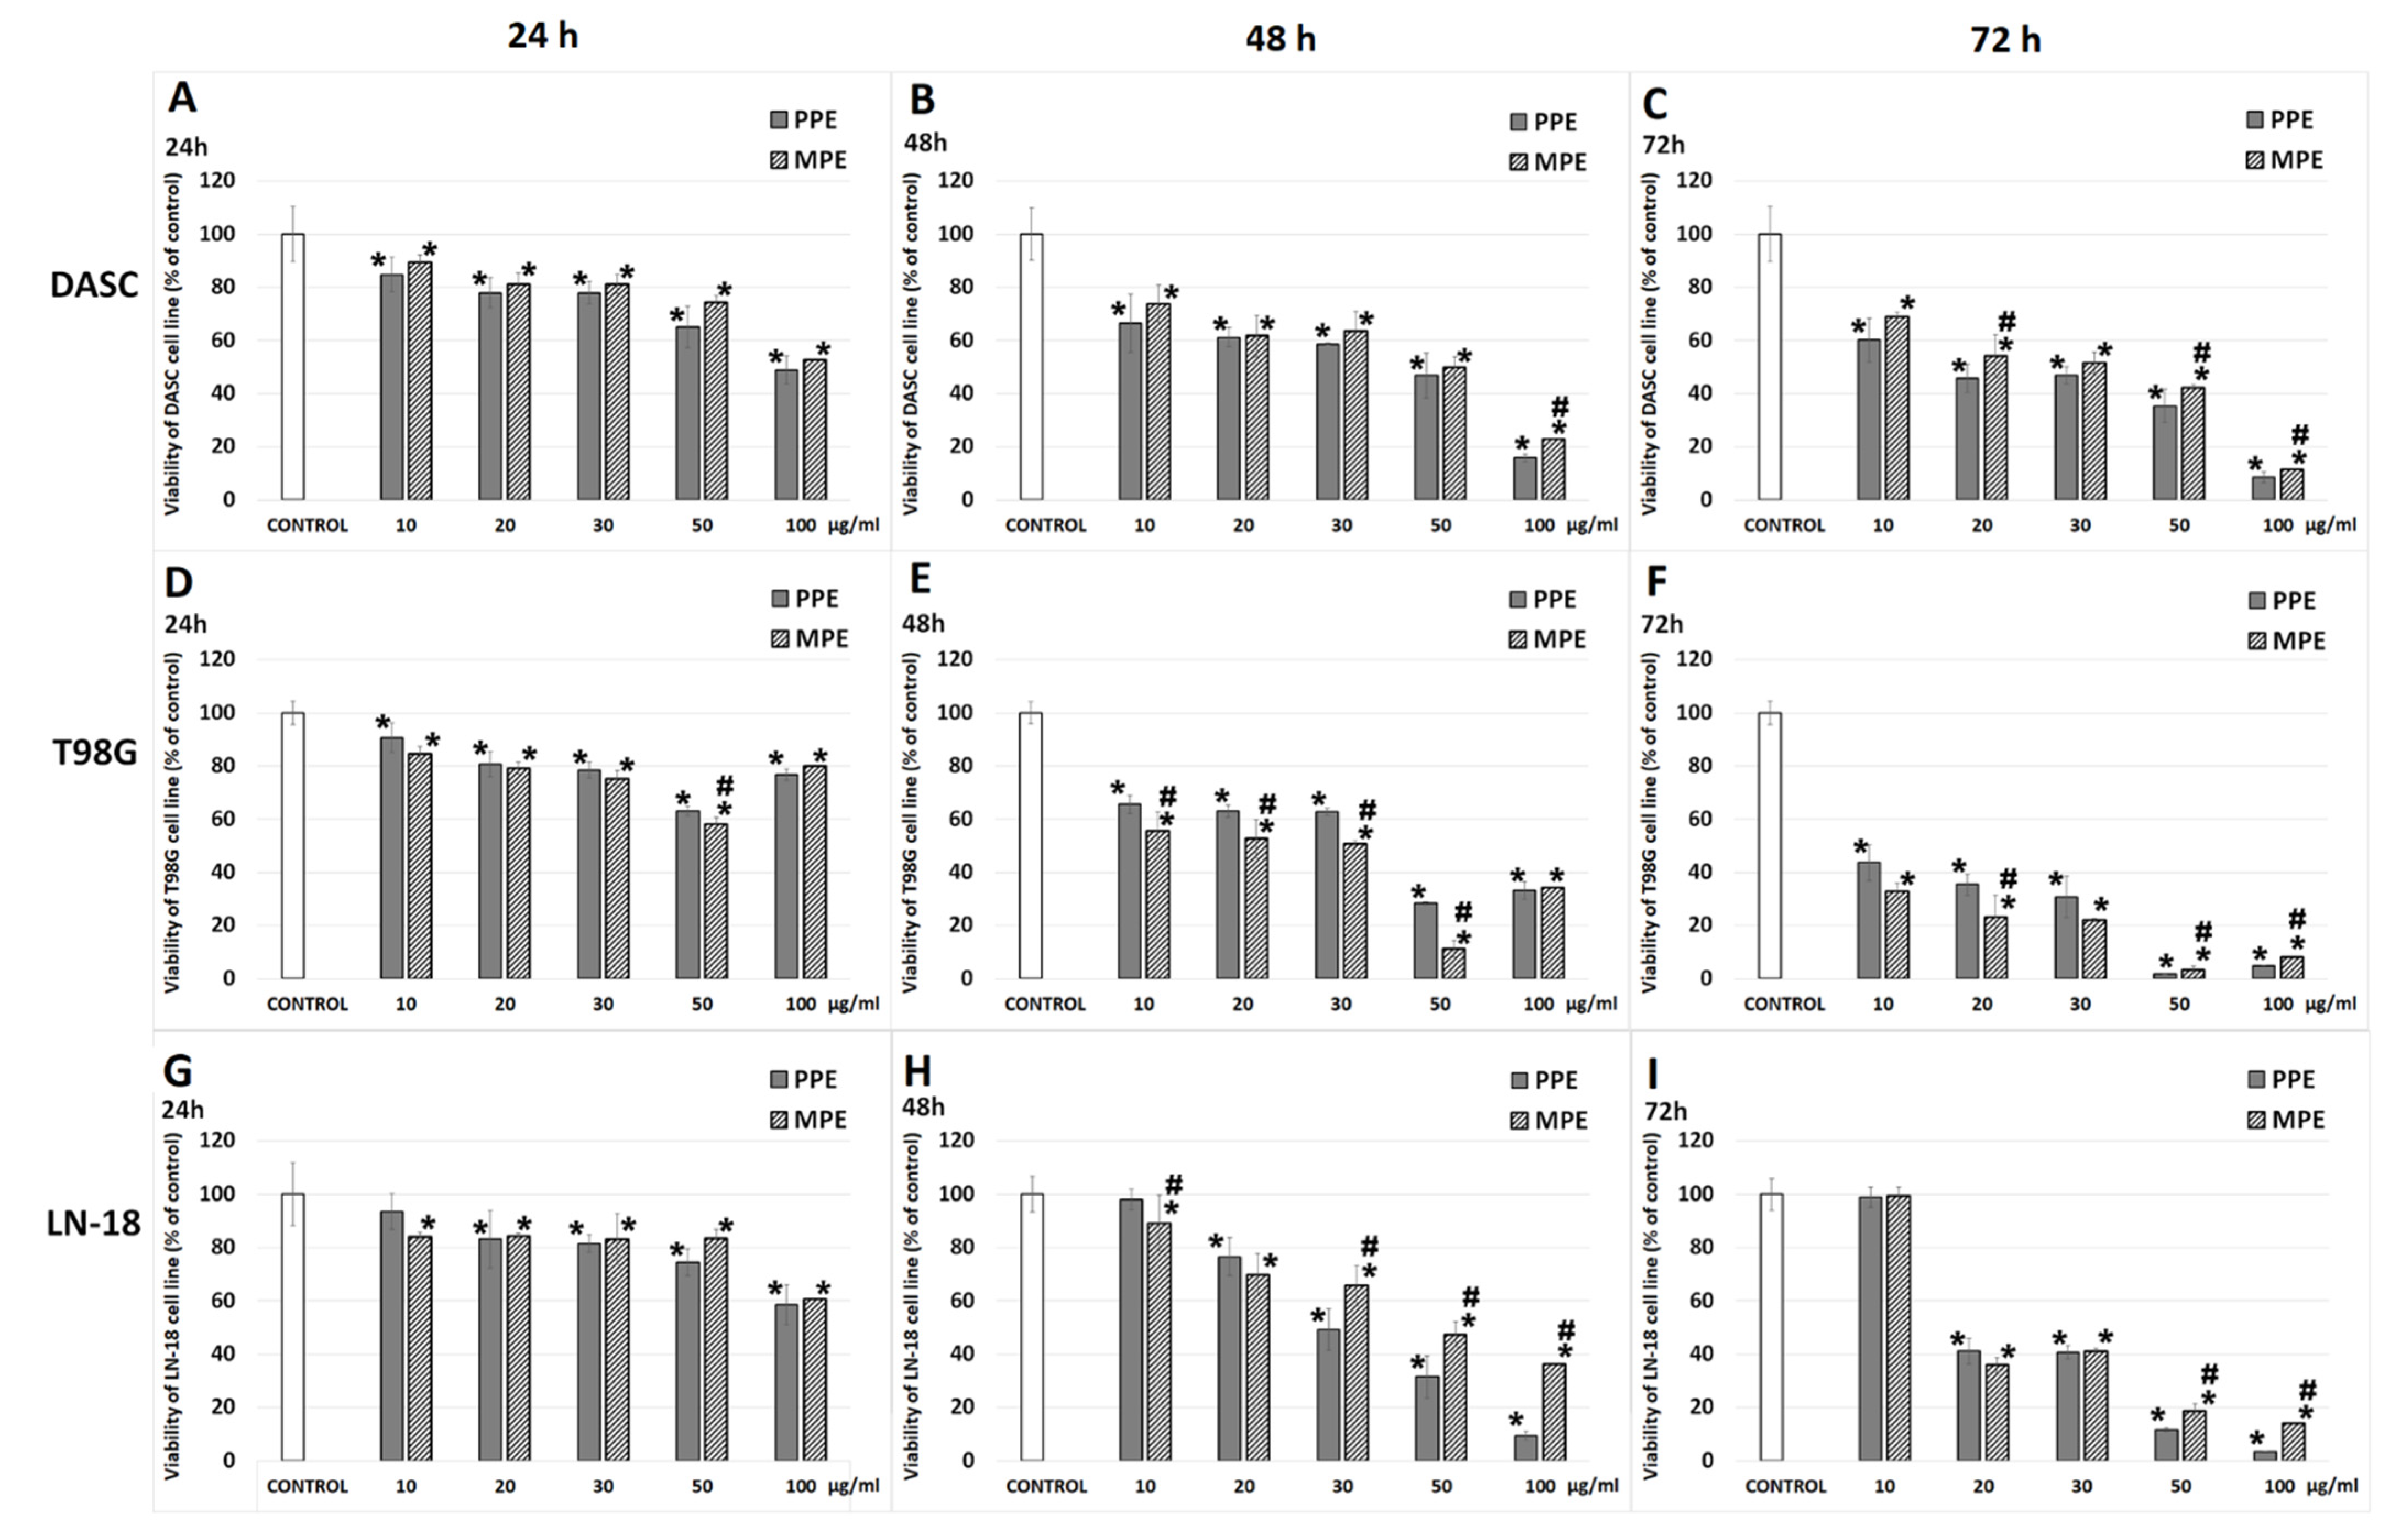
3.3. Cell Viability
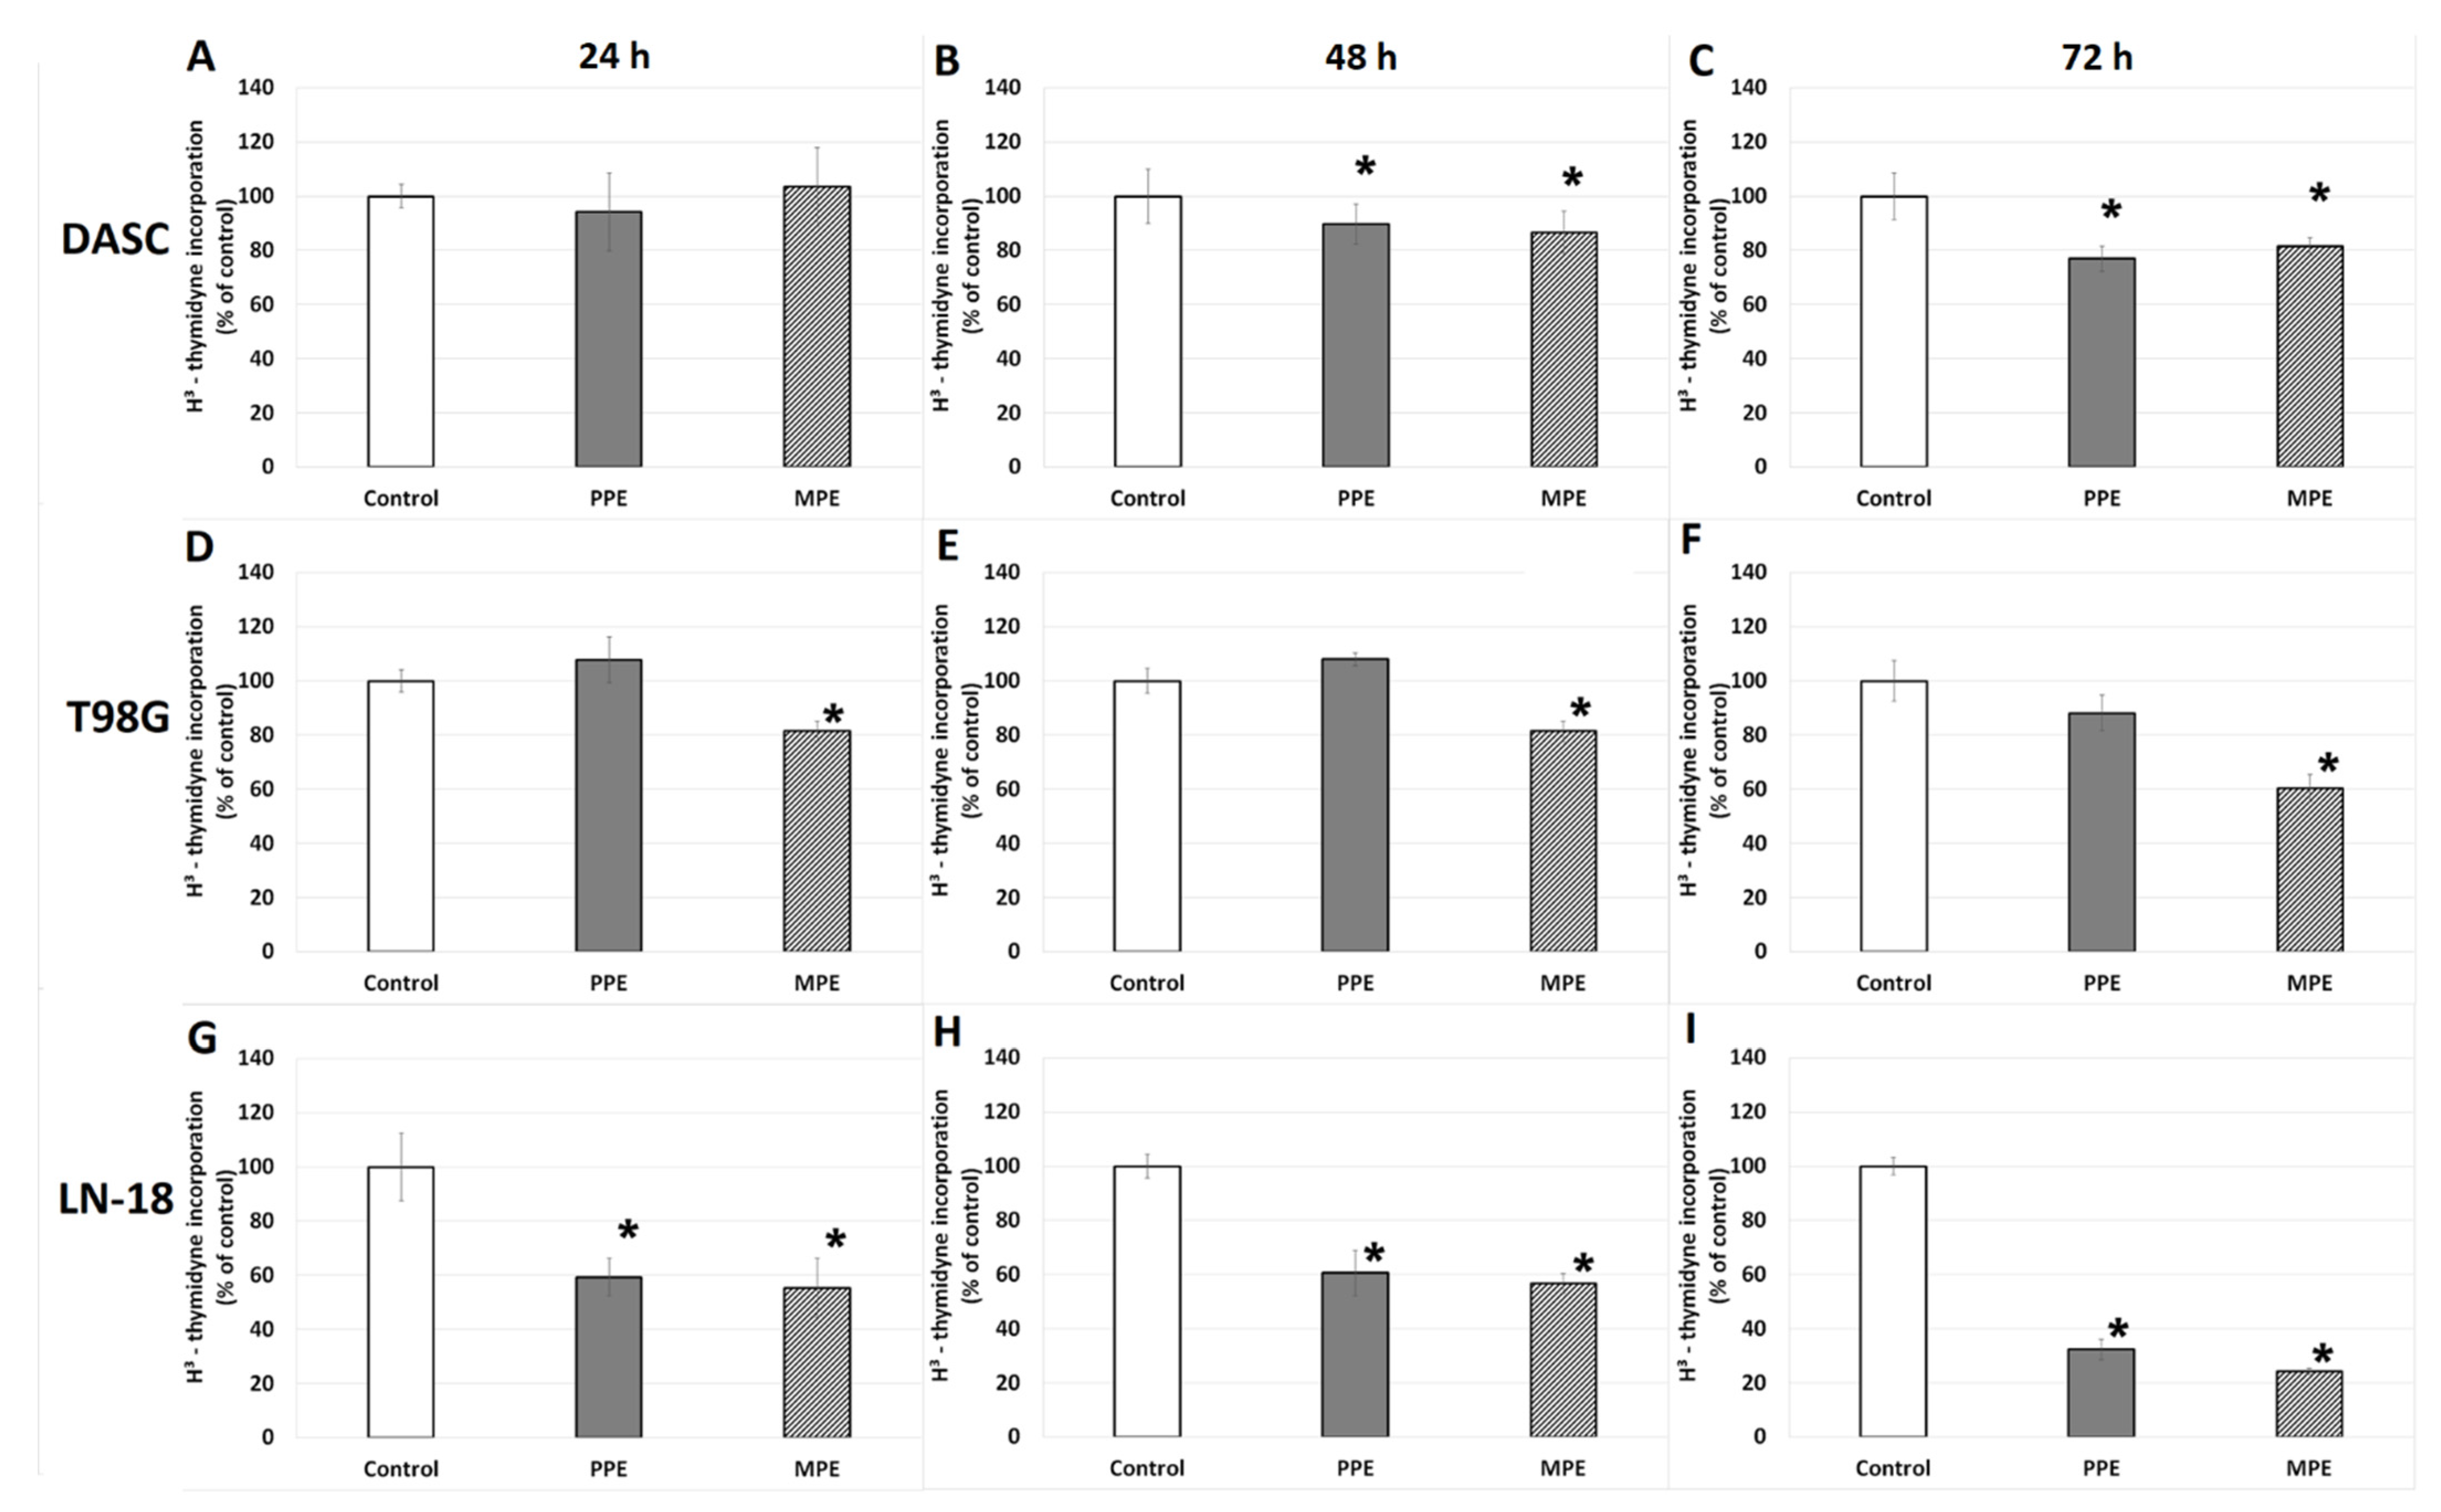
3.4. DNA Biosynthesis
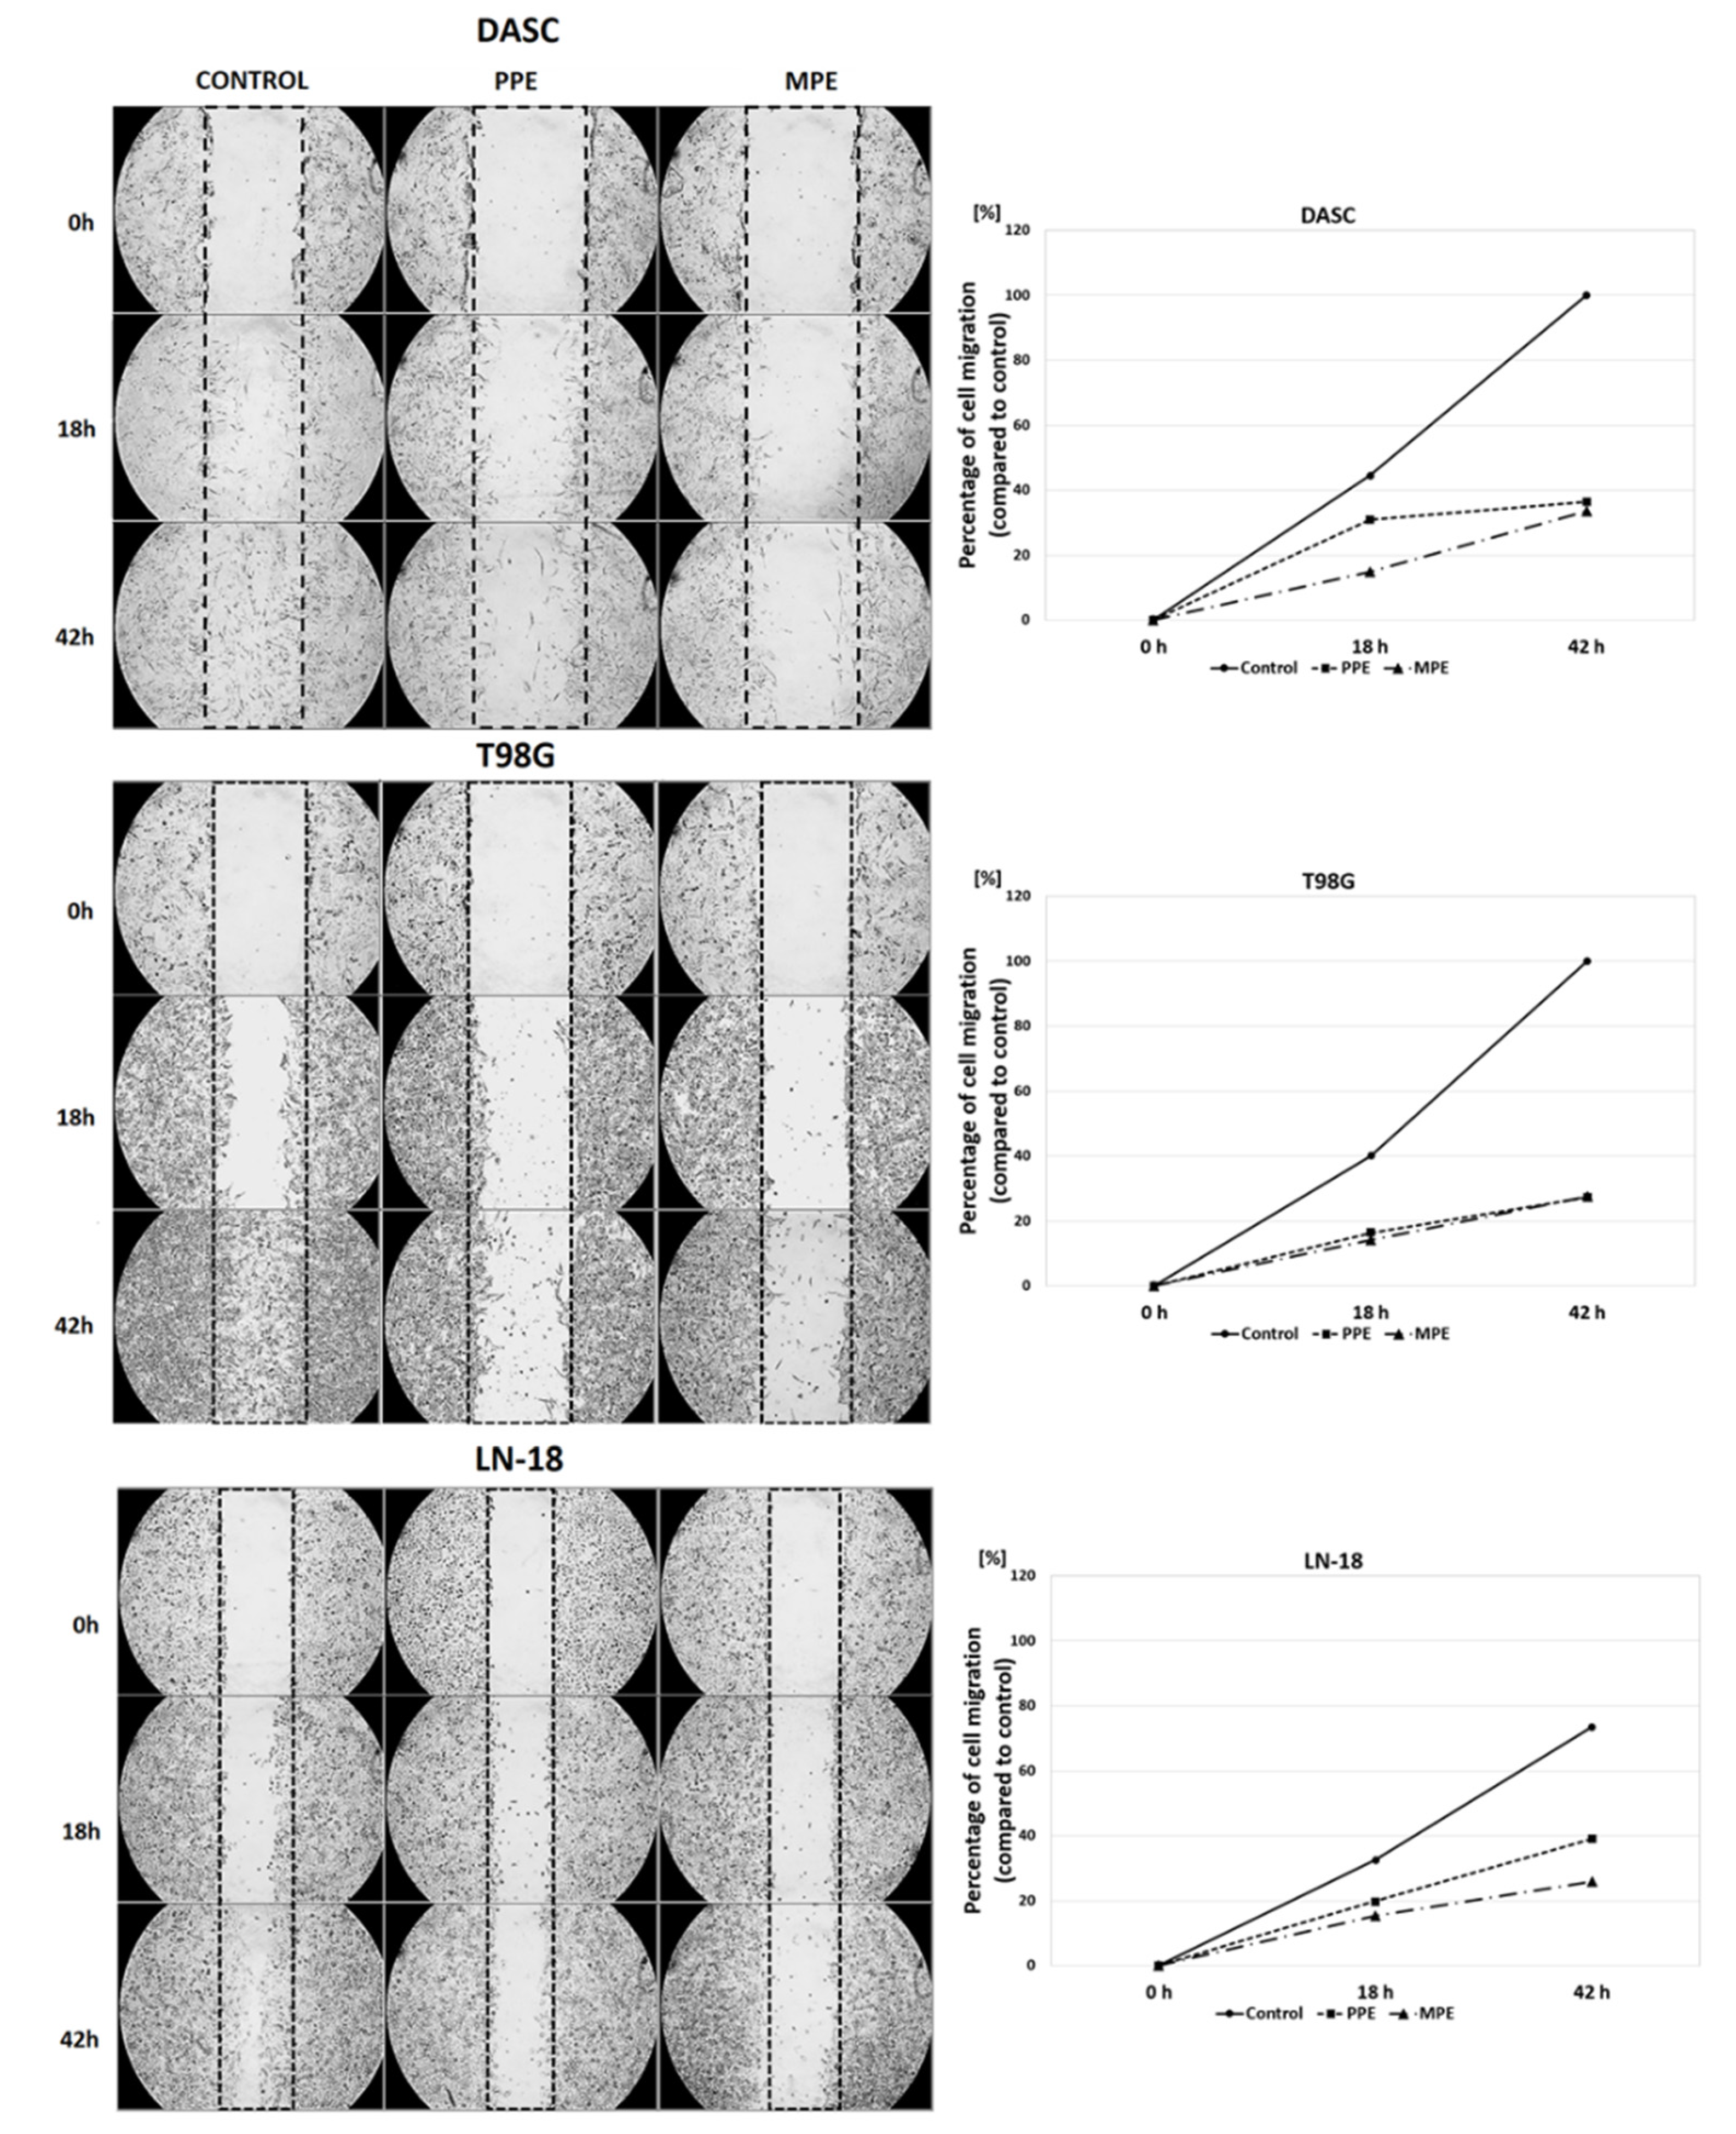
3.5. Cells Migration
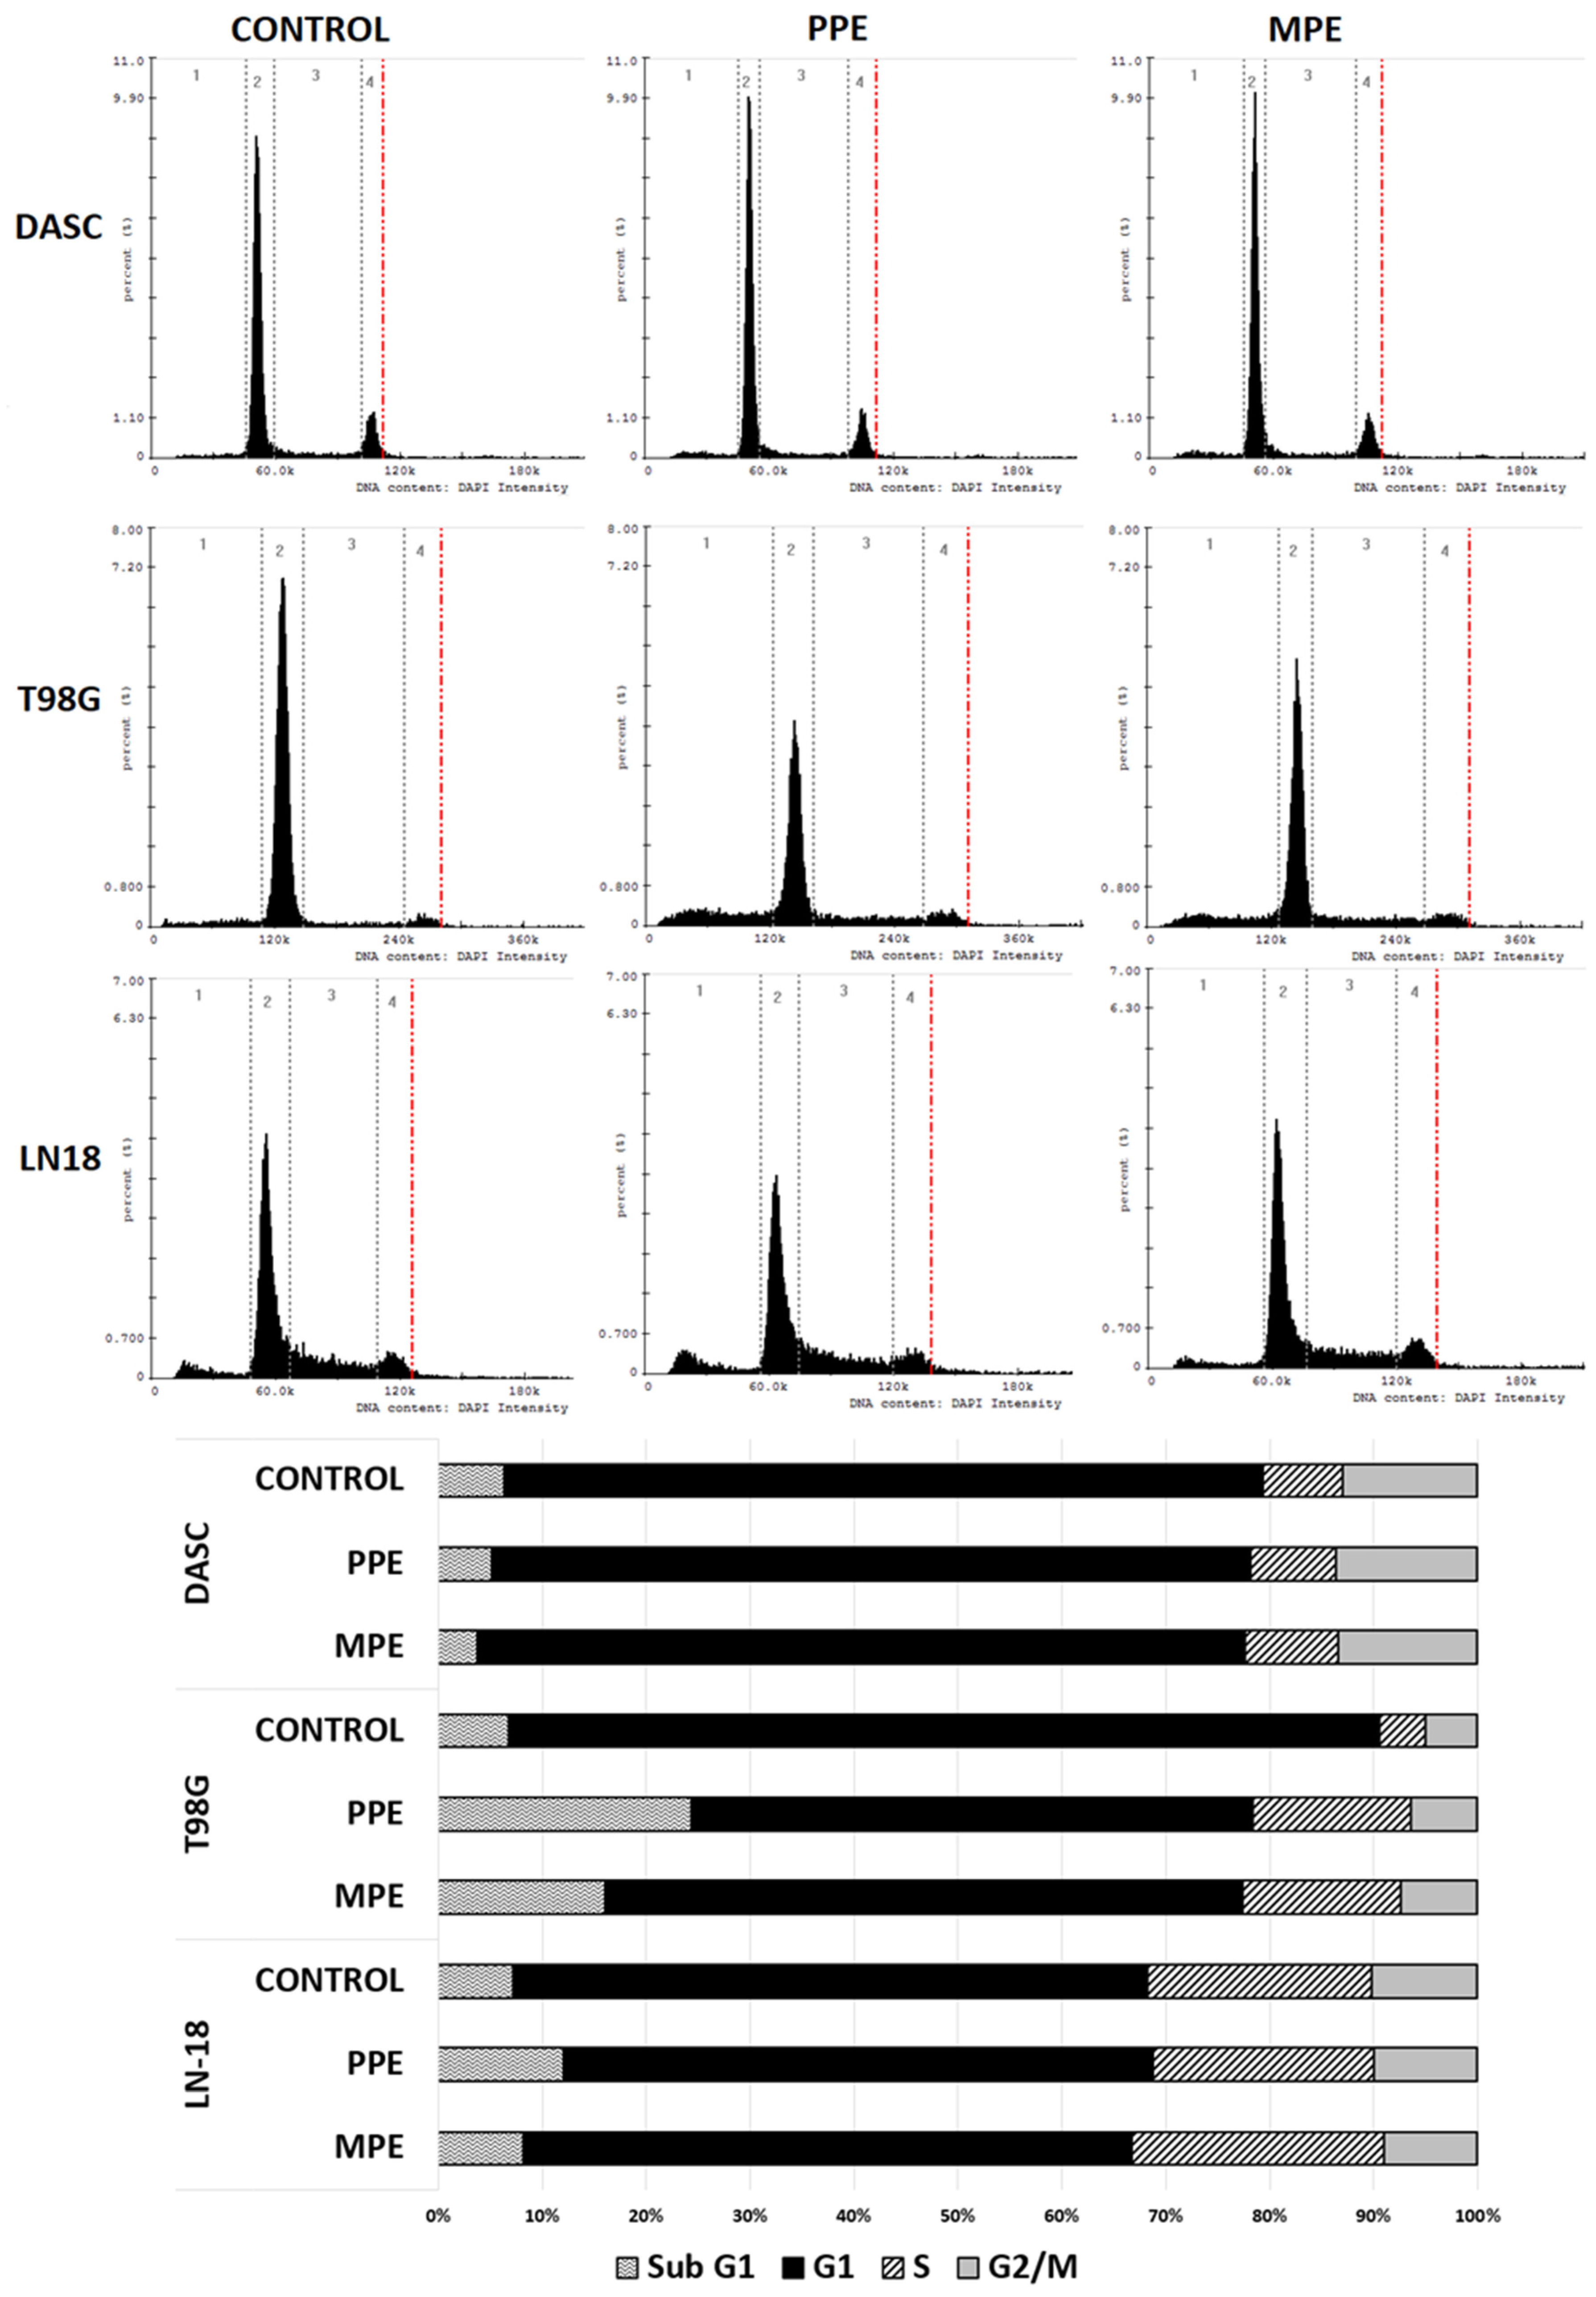
3.6. Cell Cycle
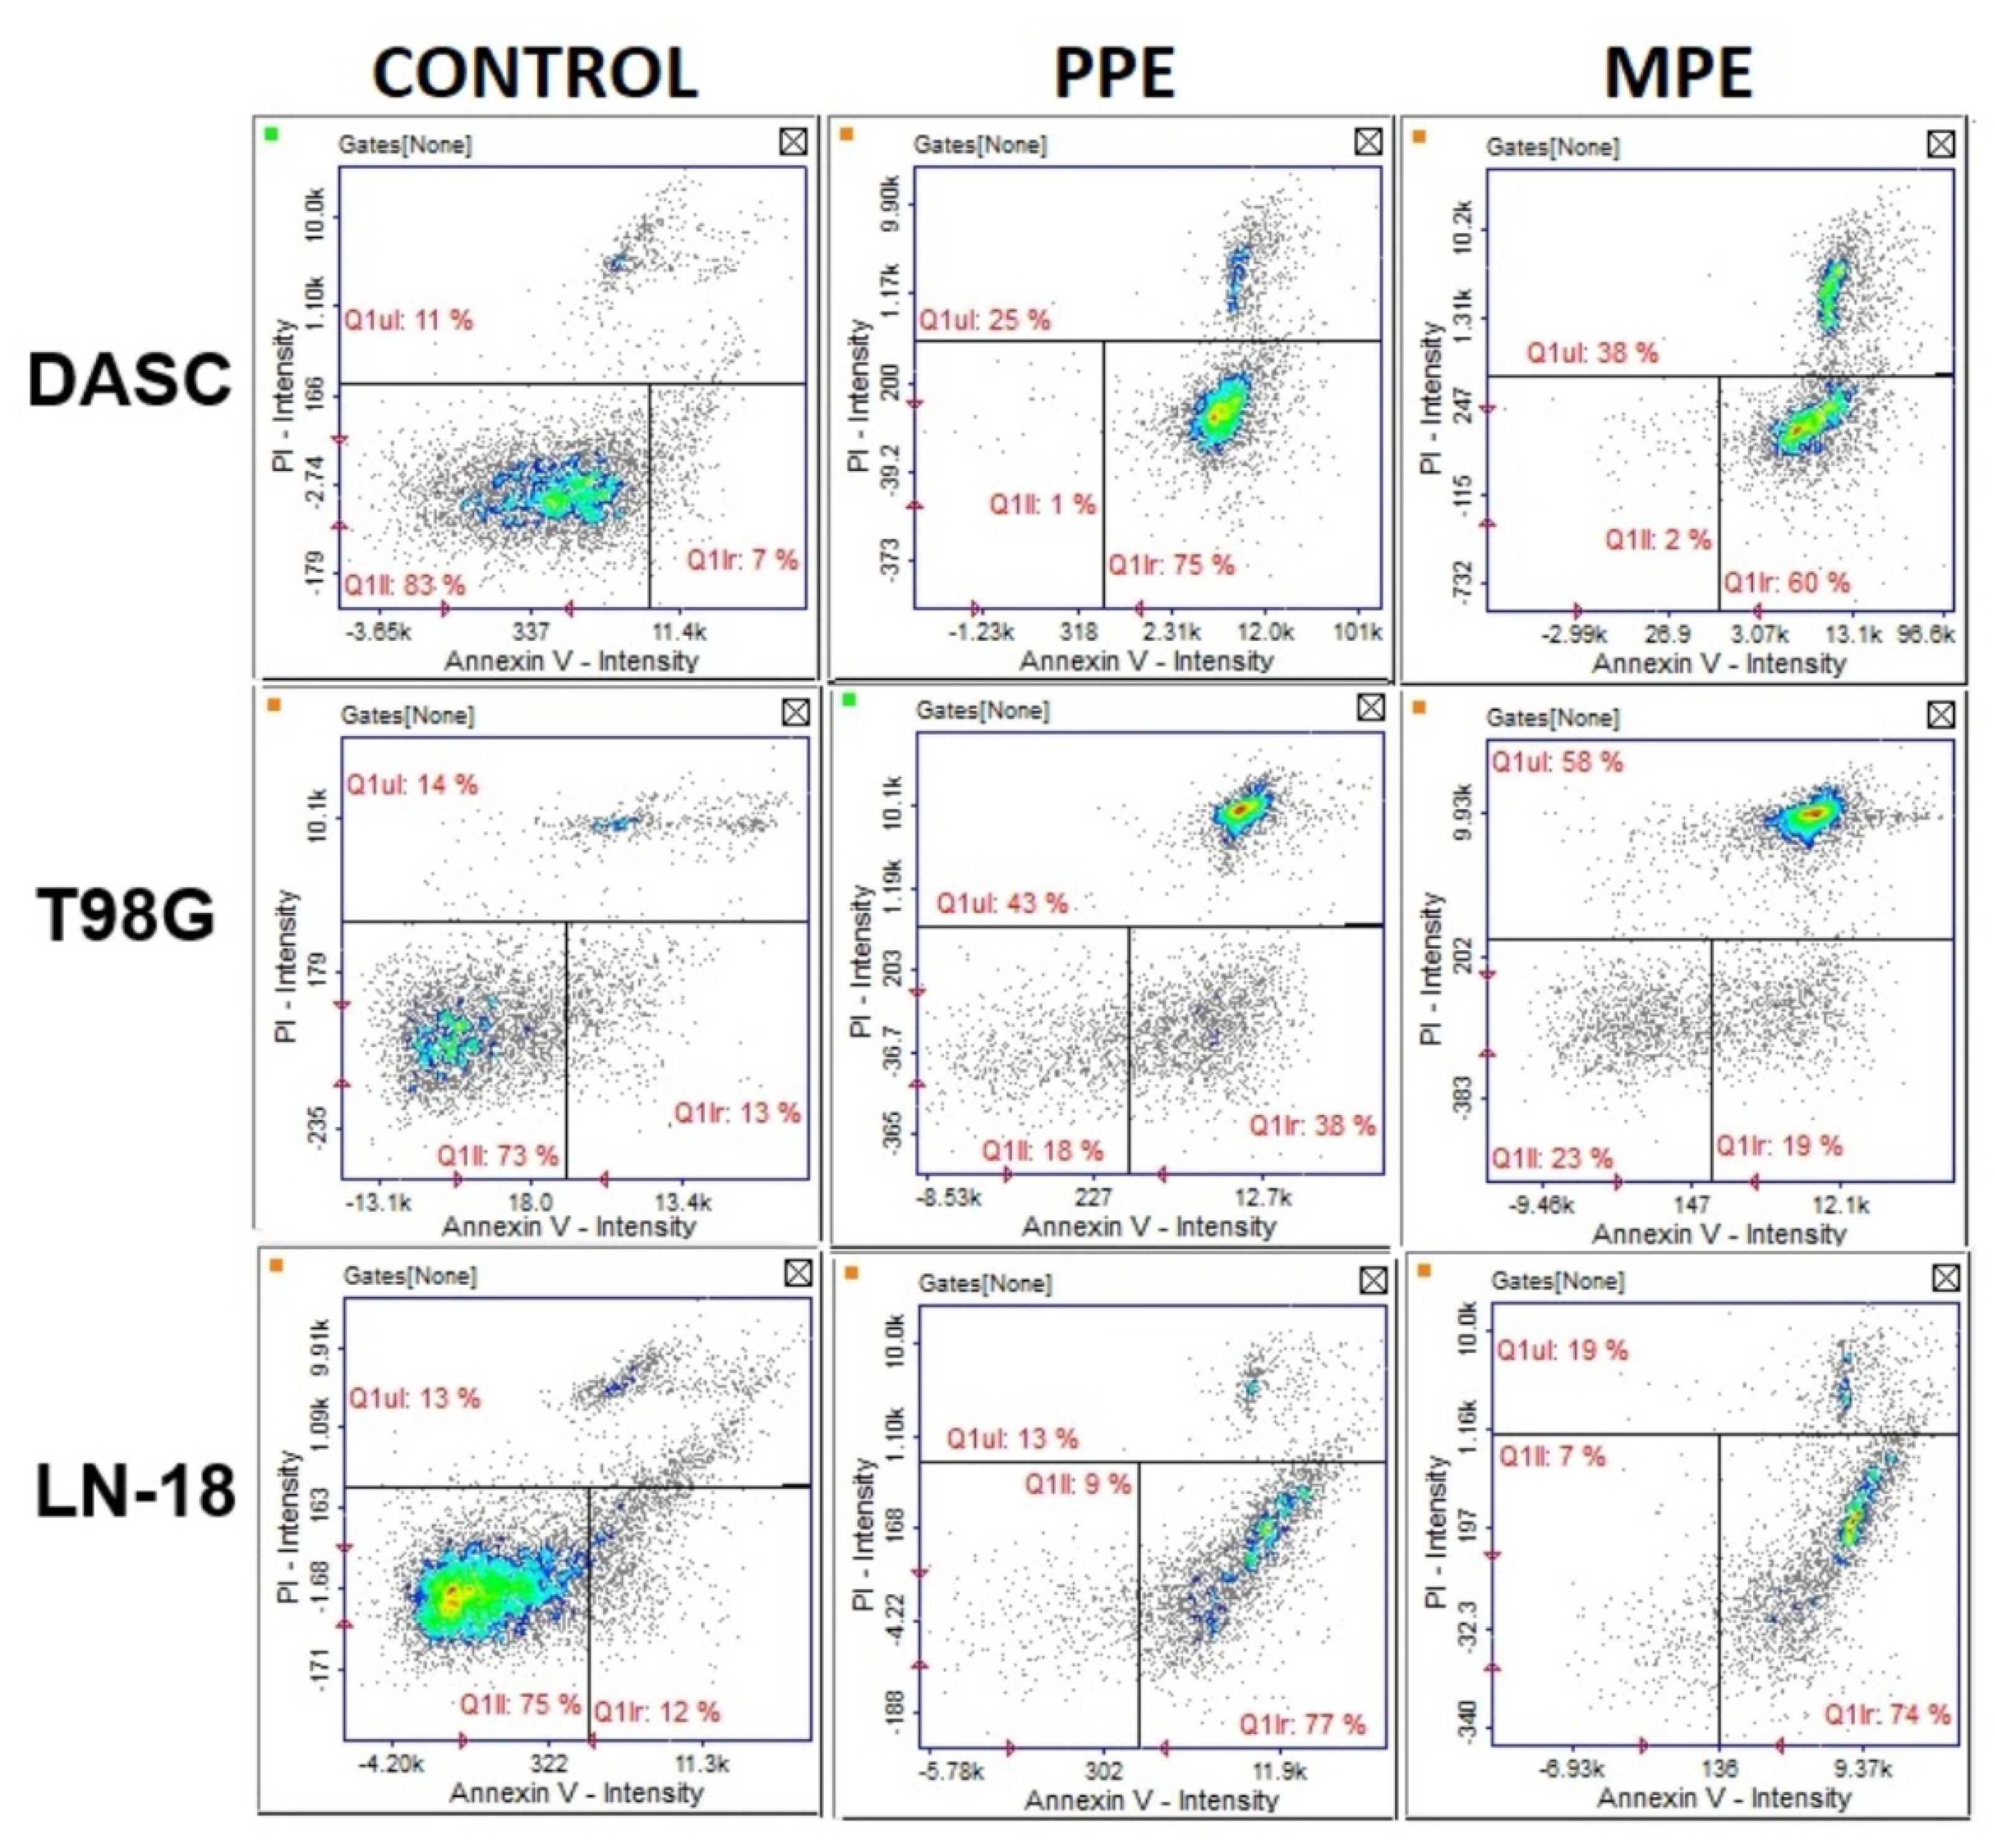
3.7. Cell Apoptosis
4. Discussion
5. Conclusions
Supplementary Materials
Author Contributions
Funding
Institutional Review Board Statement
Informed Consent Statement
Data Availability Statement
Conflicts of Interest
References
- Ostrom, Q.T.; Cioffi, G.; Gittleman, H.; Patil, N.; Waite, K.; Kruchko, C.; Barnholtz-Sloan, J.S. CBTRUS Statistical Report: Primary brain and other central nervous system tumors diagnosed in the United States in 2012–2016. Neuro-Oncology 2019, 21, v1–v100. [Google Scholar] [CrossRef]
- Thakkar, J.P.; Dolecek, T.A.; Horbinski, C. Epidemiologic and molecular prognostic review of glioblastoma. Cancer Epidemiol. Biomark. Prev. 2014, 23, 1985–1996. [Google Scholar] [CrossRef] [Green Version]
- Barker, C.A.; Chang, M.; Beal, K.; Chan, T.A. Survival of patients treated with radiation therapy for anaplastic astrocytoma. Radiat. Oncol. 2014, 48, 381–386. [Google Scholar] [CrossRef] [Green Version]
- Catchpole, O.; Mitchell, K.; Bloor, S.; Davis, P.; Suddes, A. Antiproliferative activity of New Zealand propolis and phenolic compounds vs human colorectal adenocarcinoma cells. Fitoterapia 2015, 106, 167–174. [Google Scholar] [CrossRef]
- Markiewicz-Żukowska, R.; Car, H.; Naliwajko, S.K.; Sawicka, D.; Szynaka, B.; Chyczewski, L.; Isidorov, V.; Borawska, M.H. Ethanolic extract of propolis, chrysin, CAPE inhibit human astroglia cells. Adv. Med. Sci. 2012, 57, 208–216. [Google Scholar] [CrossRef]
- Isidorov, V.A.; Szczepaniak, L.; Bakier, S. Rapid GC/MS determination of botanical precursors of Eurasian propolis. Food Chem. 2014, 142, 101–106. [Google Scholar] [CrossRef]
- Demir, S.; Aliyazicioglu, Y.; Turan, I.; Misir, S.; Mentese, A.; Yaman, S.O.; Akbulut, K.; Kilinc, K.; Deger, O. Antiproliferative and proapoptotic activity of Turkish propolis on human lung cancer cell line. Nutr. Cancer 2016, 68, 165–172. [Google Scholar] [CrossRef]
- Aru, B.; Güzelmeric, E.; Akgül, A.; Demirel, G.Y.; Kırmızıbekmez, H. Antiproliferative activity of chemically characterized propolis from Turkey and its mechanisms of action. Chem. Biodivers. 2019, 16, e1900189. [Google Scholar] [CrossRef]
- Salim, E.I.; Abd El-Magid, A.D.; Farara, K.M.; Maria, D.S. Antitumoral and antioxidant potential of Egyptian propolis against the PC3 prostate cancer cell line. Asian Pac. J. Cancer Prev. 2015, 16, 7641–7651. [Google Scholar] [CrossRef] [Green Version]
- Borawska, M.H.; Naliwajko, S.K.; Moskwa, J.; Markiewicz-Żukowska, R.; Puścion-Jakubik, A.; Soroczyńska, J. Anti-proliferative and anti-migration effects of Polish propolis combined with Hypericum perforatum L. on glioblastoma multiforme cell line U87MG. BMC Complement. Altern. Med. 2016, 16, 367. [Google Scholar] [CrossRef] [PubMed] [Green Version]
- Markiewicz-Żukowska, R.; Borawska, M.H.; Fiedorowicz, A.; Naliwajko, S.K.; Sawicka, D.; Car, H. Propolis changes the anticancer activity of temozolomide in U87MG human glioblastoma cell line. BMC Complement. Altern. Med. 2013, 13, 50. [Google Scholar] [CrossRef] [PubMed] [Green Version]
- Sforcin, J.M. Biological properties and therapeutic applications of propolis. Phytother. Res. 2016, 905, 894–905. [Google Scholar] [CrossRef] [PubMed]
- Patel, S. Emerging adjuvant therapy for cancer: Propolis and its constituents. J. Diet Suppl. 2015, 13, 245–268. [Google Scholar] [CrossRef]
- Harris, I.S.; DeNicola, G.M. The complex interplay between antioxidants and ROS in cancer. Trends Cell Biol. 2020, 30, 440–451. [Google Scholar] [CrossRef]
- Schafer, Z.T.; Grassian, A.R.; Song, L.; Jiang, Z.; Gerhart-Hines, Z.; Irie, H.Y.; Gao, S.; Puigserver, P.; Brugge, J.S. Antioxidant and oncogene rescue of metabolic defects caused by loss of matrix attachment. Nature 2009, 461, 109–113. [Google Scholar] [CrossRef] [PubMed] [Green Version]
- Isidorov, V.A. Identification of Biologically and Environmentally Significant Organic Compounds: Mass Spectra and Retention Indices Library of Trimethylsilyl Derivatives, 1st ed.; PWN: Warszawa, Poland, 2015. [Google Scholar]
- Bielecka, J.; Markiewicz-Żukowska, R.; Nowakowski, P.; Grabia, M.; Puścion-Jakubik, A.; Mielcarek, K.; Gromkowska-Kępka, K.J.; Soroczyńska, J.; Socha, K. Content of toxic elements in 12 groups of rice products available on polish market: Human health risk assessment. Foods 2020, 9, 1906. [Google Scholar] [CrossRef] [PubMed]
- Borawska, M.H.; Markiewicz-Żukowska, R.; Naliwajko, S.K.; Moskwa, J.; Bartosiuk, E.; Socha, K.; Surażyński, A.; Kochanowicz, J.; Mariak, Z. The interaction of bee products with temozolomide in human diffuse astrocytoma, glioblastoma multiforme and astroglia cell lines. Nutr. Cancer 2014, 66, 1247–1256. [Google Scholar] [CrossRef] [PubMed]
- Moskwa, J.; Naliwajko, S.K.; Markiewicz-Żukowska, R.; Gromkowska-Kępka, K.J.; Nowakowski, P.; Strawa, J.W.; Borawska, M.H.; Tomczyk, M.; Socha, K. Chemical composition of Polish propolis and its antiproliferative effect in combination with Bacopa monnieri on glioblastoma cell lines. Sci. Rep. 2020, 10, 21127. [Google Scholar] [CrossRef]
- Bruggisser, R.; von Daeniken, K.; Jundt, G.; Schaffner, W.; Tullberg-Reinert, H. Interference of plant extracts, phytoestrogens and antioxidants with the MTT tetrazolium assay. Planta Med. 2002, 68, 445–448. [Google Scholar] [CrossRef]
- Wang, P.; Henning, S.M.; Heber, D. Limitations of MTT and MTS-based assays for measurement of antiproliferative activity of green tea polyphenols. PLoS ONE 2010, 5, e10202. [Google Scholar] [CrossRef]
- Villota, H.; Moreno-Ceballos, M.; Santa-González, G.A.; Uribe, D.; Castañeda, I.C.H.; Preciado, L.M.; Pedroza-Díaz, J. Biological impact of phenolic compounds from coffee on colorectal cancer. Pharmaceuticals 2021, 14, 761. [Google Scholar] [CrossRef] [PubMed]
- Kumazawa, S.; Hamasaka, T.; Nakayama, T. Antioxidant activity of propolis of various geographic origins. Food Chem. 2004, 84, 329–339. [Google Scholar] [CrossRef]
- Popova, M.; Giannopoulou, E.; Skalicka-Woźniak, K.; Graikou, K.; Widelski, J.; Bankova, V.; Kalofonos, H.; Sivolapenko, G.; Gaweł-Bęben, K.; Antosiewicz, B.; et al. Characterization and biological evaluation of propolis from Poland. Molecules 2017, 22, 1159. [Google Scholar] [CrossRef] [PubMed]
- Wieczynska, A.; Wezgowiec, J.; Wieckiewicz, W.; Czarny, A.; Kulbacka, J.; Nowakowska, D.; Gancarz, R.; Wilk, K.A. Antimicrobial activity, cytotoxicity and total phenolic content of different extracts of propolis from the west pomeranian region in Poland. Acta Pol. Pharm. 2017, 74, 715–722. [Google Scholar]
- Gemiarto, A.T.; Ninyio, N.N.; Lee, S.W.; Logis, J.; Fatima, A.; Chan, E.W.; Lim, C.S. Isoprenyl caffeate, a major compound in manuka propolis, is a quorum-sensing inhibitor in Chromobacterium violaceum. Antonie Leeuwenhoek 2015, 108, 491–504. [Google Scholar] [CrossRef]
- Commission Regulation (EC) No 629/2008 of 2 July 2008 Amending Regulation (EC) No 1881/2006 Setting Maximum Levels for Certain Contaminants in Foodstuffs [L 173/6]. Available online: https://eur-lex.europa.eu/legal-content/EN/TXT/PDF/?uri=CELEX:32008R0629&from=ES (accessed on 14 April 2022).
- Matuszewska, E.; Klupczynska, A.; Maciołek, K.; Kokot, Z.J.; Matysiak, J. Multielemental Analysis of bee pollen, propolis, and royal jelly collected in west-central Poland. Molecules 2021, 26, 2415. [Google Scholar] [CrossRef]
- Roman, A.; Madras-Majewska, B.; Popiela-Pleban, E. Comparative study of selected toxic elements in propolis and honey. J. Apic. Sci. 2011, 55, 97–106. [Google Scholar]
- Ahamed, M.; Akhtar, M.J.; Majeed Khan, M.A. Single-walled carbon nanotubes attenuate cytotoxic and oxidative stress response of pb in human lung epithelial (A549) Cells. Int. J. Environ. Res. Public Health 2020, 17, 8221. [Google Scholar] [CrossRef]
- Mu, Y.; Yu, J.; Ji, W.; Chen, L.; Wang, X.; Yan, B. Alleviation of Pb2+ pollution-induced oxidative stress and toxicity in microglial cells and zebrafish larvae by chicoric acid. Ecotoxicol. Environ. Saf. 2019, 180, 396–402. [Google Scholar] [CrossRef]
- Watanabe, M.A.E.; Amarante, M.K.; Conti, B.J.; Sforcin, J.M. Cytotoxic constituents of propolis inducing anticancer effects: A review. J. Pharm. Pharmacol. 2011, 63, 1378–1386. [Google Scholar] [CrossRef]
- Borges, K.S.; Brassesco, M.S.; Scrideli, C.A.; Soares, A.E.; Tone, L.G. Antiproliferative effects of Tubi-bee propolis in glioblastoma cell lines. Genet. Mol. Biol. 2011, 34, 310–314. [Google Scholar] [CrossRef] [PubMed] [Green Version]
- Chang, H.; Wang, Y.; Yin, X.; Liu, X.; Xuan, H. Ethanol extract of propolis and its constituent caffeic acid phenethyl ester inhibit breast cancer cells proliferation in inflammatory microenvironment by inhibiting TLR4 signal pathway and inducing apoptosis and autophagy. BMC Complement. Altern. Med. 2017, 17, 471. [Google Scholar] [CrossRef] [PubMed] [Green Version]
- Begnini, K.R.; Moura de Leon, P.M.; Thurow, H.; Schultze, E.; Campos, V.F.; Martins Rodrigues, F.; Borsuk, S.; Dellagostin, O.A.; Savegnago, L.; Roesch-Ely, M.; et al. Brazilian red propolis induces apoptosis-like cell death and decreases migration potential in bladder cancer cells. Evid. Based Complement. Alternat. Med. 2014, 2014, 639856. [Google Scholar] [CrossRef]
- Frión-Herrera, Y.; Díaz-García, A.; Ruiz-Fuentes, J.; Rodríguez-Sánchez, H.; Sforcin, J.M. The cytotoxic effects of propolis on breast cancer cells involve PI3K/Akt and ERK1/2 pathways, mitochondrial membrane potential, and reactive oxygen species generation. Inflammopharmacology 2019, 27, 1081–1089. [Google Scholar] [CrossRef] [PubMed] [Green Version]
- Jiang, X.S.; Xie, H.Q.; Li, C.G.; You, M.M.; Zheng, Y.F.; Li, G.Q.; Chen, X.; Zhang, C.P.; Hu, F.L. Chinese propolis inhibits the proliferation of human gastric cancer cells by inducing apoptosis and cell cycle arrest. Evid. Based Complement. Alternat. Med. 2020, 2020, 2743058. [Google Scholar] [CrossRef]
- Zeynep, M.C.; Melike, E.; Melike, G.; Aytek, O.; Aynur, A. Cytotoxic and apoptotic effects of ethanolic propolis extract on C6 glioma cells. Environ. Toxicol. 2020, 35, 768–773. [Google Scholar]
- Noureddine, H.; Hage-Sleiman, R.; Wehbi, B.; Fayyad-Kazan, H.; Hayar, S.; Traboulssi, M.; Alyamani, O.A.; Faour, W.H.; El Makhour, Y. Chemical characterization and cytotoxic activity evaluation of Lebanese propolis. Biomed. Pharmacother. 2017, 95, 298–307. [Google Scholar] [CrossRef]
- Szliszka, E.; Krol, W. Polyphenols isolated from propolis augment TRAIL-induced apoptosis in cancer cells. Evid. Based Complement. Alternat. Med. 2013, 2013, 731940. [Google Scholar] [CrossRef] [Green Version]
- Bernardi, S.; Secchiero, P.; Zauli, G. State of art and recent developments of anti-cancer strategies based on TRAIL. Recent Pat. Anticancer Drug Discov. 2012, 7, 207–217. [Google Scholar] [CrossRef]
- Li, X.; Huang, Q.; Ong, C.N.; Yang, X.F.; Shen, H.M. Chrysin sensitizes tumor necrosis factor-α-induced apoptosis in human tumor cells via suppression of nuclear factor-κB. Cancer Lett. 2010, 293, 109–116. [Google Scholar] [CrossRef]
- Szliszka, E.; Czuba, Z.P.; Domino, M.; Mazur, B.; Zydowicz, G.; Krol, W. Ethanolic extract of propolis (EEP) enhances the apoptosis-inducing potential of TRAIL in cancer cells. Molecules 2009, 14, 738–754. [Google Scholar] [CrossRef] [PubMed]
- Morin, P.; St-Coeur, P.D.; Doiron, J.A.; Cormier, M.; Poitras, J.J.; Surette, M.E.; Touaibia, M. Substituted caffeic and ferulic acid phenethyl esters: Synthesis, leukotrienes biosynthesis inhibition, and cytotoxic activity. Molecules 2017, 22, 1124. [Google Scholar] [CrossRef] [PubMed] [Green Version]
- Lee, Y.J.; Liao, P.H.; Chen, W.K.; Yang, C.C. Preferential cytotoxicity of caffeic acid phenethyl ester analogues on oral cancer cells. Cancer Lett. 2000, 153, 51–56. [Google Scholar] [CrossRef]
- Li, X.; Wang, J.N.; Huang, J.M.; Xiong, X.K.; Chen, M.F.; Ong, C.N.; Shen, H.M.; Yang, X.F. Chrysin promotes tumor necrosis factor (TNF)-related apoptosis-inducing ligand (TRAIL) induced apoptosis in human cancer cell lines. Toxicol. In Vitro 2011, 25, 630–635. [Google Scholar] [CrossRef]
- Sawicka, D.; Car, H.; Borawska, M.H.; Nikliński, J. The anticancer activity of propolis. Folia Histochem. Cytobiol. 2012, 50, 25–37. [Google Scholar] [CrossRef] [Green Version]
- Zhai, K.; Siddiqui, M.; Abdellatif, B.; Liskova, A.; Kubatka, P.; Büsselberg, D. Natural compounds in glioblastoma therapy: Preclinical insights, mechanistic pathways, and outlook. Cancers 2021, 13, 2317. [Google Scholar] [CrossRef]
- Mani, R.; Natesan, V. Chrysin: Sources, beneficial pharmacological activities, and molecular mechanism of action. Phytochemistry 2018, 145, 187–196. [Google Scholar] [CrossRef]
- Curti, V.; Zaccaria, V.; Tsetegho Sokeng, A.J.; Dacrema, M.; Masiello, I.; Mascaro, A.; D’Antona, G.; Daglia, M. Bioavailability and in vivo antioxidant activity of a standardized polyphenol mixture extracted from brown propolis. Int. J. Mol. Sci. 2019, 20, 1250. [Google Scholar] [CrossRef] [Green Version]
- Grabska-Kobylecka, I.; Kaczmarek-Bak, J.; Figlus, M.; Prymont-Przyminska, A.; Zwolinska, A.; Sarniak, A.; Wlodarczyk, A.; Glabinski, A.; Nowak, D. The presence of caffeic acid in cerebrospinal fluid: Evidence that dietary polyphenols can cross the blood-brain barrier in humans. Nutrients 2020, 12, 1531. [Google Scholar] [CrossRef]
- Shimazu, R.; Anada, M.; Miyaguchi, A.; Nomi, Y.; Matsumoto, H. Evaluation of blood-brain barrier permeability of polyphenols, anthocyanins, and their metabolites. J. Agric. Food Chem. 2021, 69, 11676–11686. [Google Scholar] [CrossRef]
- Figueira, I.; Garcia, G.; Pimpão, R.C.; Terrasso, A.P.; Costa, I.; Almeida, A.F.; Tavares, L.; Pais, T.F.; Pinto, P.; Ventura, M.R.; et al. Polyphenols journey through blood-brain barrier towards neuronal protection. Sci. Rep. 2017, 7, 11456. [Google Scholar] [CrossRef] [PubMed]


| Element | Precision (%) | Recovery (%) | Declared Concentration in CRM (µg/kg) |
|---|---|---|---|
| As | 3.3 | 99.0 | 10 |
| Cd | 2.5 | 99.1 | 7 |
| Pb | 2.4 | 99.5 | 52 |
| Components, TMS Derivative | ITExp | ITLit | PPE [%] | MPE [%] |
|---|---|---|---|---|
| Benzoic acid | 1244 | 1247 | 1.80 | 0.33 |
| Cinnamic acid | 1542 | 1546 | 0.20 | 1.82 |
| p-Coumaric acid | 1944 | 1947 | 9.77 | 0.87 |
| 3,4-Dimethoxycinnamic acid | 2030 | 2034 | - | 1.51 |
| (E)-Ferulic acid | 2101 | 2101 | 3.22 | 0.15 |
| (E)-Caffeic acid | 2155 | 2155 | 2.10 | 1.53 |
| 3-Methyl-3-butenyl (E)-caffeate | 2371 | 2367 | 1.18 | 3.39 |
| 3-Methyl-1-butenyl (E)-caffeate | 2374 | 2375 | 0.50 | 0.44 |
| 3-Methyl-2-bytenyl (E)-caffeate | 2425 | 2421 | 1.65 | 2.36 |
| Pinocembrin, mono-TMS | 2460 | 2461 | 1.14 | 0.46 |
| Benzyl (E)-p-coumarate | 2516 | 2515 | 3.78 | 0.37 |
| Pinocembrin | 2551 | 2552 | 6.93 | 14.10 |
| 2-Phenylethyl p-coumarate | 2603 | 2603 | 1.02 | 0.11 |
| Pinobanksin | 2613 | 2611 | 4.25 | 4.73 |
| Pinobanksin 3-acetate, mono-TMS | 2634 | 2632 | 1.26 | 0.21 |
| Chrysin, mono-TMS | 2655 | 2648 | 1.95 | 0.42 |
| 5,7-Dihydroxy-3-methoxyflavanone | 2675 | 2673 | 2.02 | 2.04 |
| Benzyl (E)-ferulate | 2680 | 2680 | 1.64 | 0.45 |
| Pinobanksin 3-acetate, di-TMS | 2694 | 2693 | 10.01 | 9.00 |
| Benzyl (E)-caffeate | 2723 | 2722 | 3.79 | 2.70 |
| Chrysin, di-TMS | 2746 | 2745 | 5.33 | 5.73 |
| Galangin, tri-TMS | 2767 | 2769 | 8.95 | 9.60 |
| CAPE | 2805 | 2805 | 1.29 | 1.15 |
| Cinnamyl (E)-p-coumarate | 2836 | 2833 | 1.91 | 0.23 |
| Sakuranetin | 2877 | 2880 | 0.55 | 0.05 |
| Quercetine | 3218 | 3213 | 0.11 | - |
| Group of Compounds | PPE [%] | MPE [%] |
|---|---|---|
| Flavonoids and chalcones | 49.4 | 52.1 |
| Aromatic acids | 18.3 | 7.8 |
| Cinnamic acid esters | 19.8 | 14.5 |
| Phenylpropenoid glicerydes | 1.3 | 0.0 |
| Aliphatic and aromatic alcohol | 0.2 | 0.8 |
| Aliphatic acids | 0.8 | 0.2 |
| Carbohydrates | 6.2 | 18.7 |
| Sesquiterpenoids | 0.0 | 0.2 |
| Other compounds | 4.0 | 5.7 |
| Total | 100.0 | 100.0 |
| Extracts | TPC [mg GAE/g] Mean ± SD | Toxic Elements [mg/kg] | ||
|---|---|---|---|---|
| As | Cd | Pb | ||
| PPE | 243.7 ± 9.0 | 0.00 | 0.01 | 0.16 |
| MPE | 245.6 ± 5.9 | 0.88 | 0.01 | 3.74 |
Publisher’s Note: MDPI stays neutral with regard to jurisdictional claims in published maps and institutional affiliations. |
© 2022 by the authors. Licensee MDPI, Basel, Switzerland. This article is an open access article distributed under the terms and conditions of the Creative Commons Attribution (CC BY) license (https://creativecommons.org/licenses/by/4.0/).
Share and Cite
Moskwa, J.; Naliwajko, S.K.; Markiewicz-Żukowska, R.; Gromkowska-Kępka, K.J.; Soroczyńska, J.; Puścion-Jakubik, A.; Borawska, M.H.; Isidorov, V.; Socha, K. Polish and New Zealand Propolis as Sources of Antioxidant Compounds Inhibit Glioblastoma (T98G, LN-18) Cell Lines and Astrocytoma Cells Derived from Patient. Antioxidants 2022, 11, 1305. https://doi.org/10.3390/antiox11071305
Moskwa J, Naliwajko SK, Markiewicz-Żukowska R, Gromkowska-Kępka KJ, Soroczyńska J, Puścion-Jakubik A, Borawska MH, Isidorov V, Socha K. Polish and New Zealand Propolis as Sources of Antioxidant Compounds Inhibit Glioblastoma (T98G, LN-18) Cell Lines and Astrocytoma Cells Derived from Patient. Antioxidants. 2022; 11(7):1305. https://doi.org/10.3390/antiox11071305
Chicago/Turabian StyleMoskwa, Justyna, Sylwia Katarzyna Naliwajko, Renata Markiewicz-Żukowska, Krystyna Joanna Gromkowska-Kępka, Jolanta Soroczyńska, Anna Puścion-Jakubik, Maria Halina Borawska, Valery Isidorov, and Katarzyna Socha. 2022. "Polish and New Zealand Propolis as Sources of Antioxidant Compounds Inhibit Glioblastoma (T98G, LN-18) Cell Lines and Astrocytoma Cells Derived from Patient" Antioxidants 11, no. 7: 1305. https://doi.org/10.3390/antiox11071305
APA StyleMoskwa, J., Naliwajko, S. K., Markiewicz-Żukowska, R., Gromkowska-Kępka, K. J., Soroczyńska, J., Puścion-Jakubik, A., Borawska, M. H., Isidorov, V., & Socha, K. (2022). Polish and New Zealand Propolis as Sources of Antioxidant Compounds Inhibit Glioblastoma (T98G, LN-18) Cell Lines and Astrocytoma Cells Derived from Patient. Antioxidants, 11(7), 1305. https://doi.org/10.3390/antiox11071305