Abstract
Xanthine oxidase (XO) contributes to oxidative stress and vascular disease. Hyperuricemia and gout are common in patients with chronic kidney disease (CKD), a population at increased risk of vascular disease. We evaluated effects of allopurinol on serum XO activity and metabolome of CKD patients who had participated in a randomized double-blind clinical trial of allopurinol vs. placebo. XO activity was measured in participants’ serum. XO expression in venous endothelial cells was evaluated via immunofluorescence. Gas chromatography mass spectrometry (GC/MS) was utilized for metabolomics analysis. We found that in patients with stage 3 CKD and hyperuricemia, allopurinol lowered serum urate while increasing serum xanthine levels. Allopurinol, however, did not significantly suppress measured serum XO activity. Of note, baseline serum XO activity was low. Additionally, neither baseline serum XO activity nor XO protein expression were associated with measures of vascular dysfunction or with systemic or endothelial biomarkers of oxidative stress. Allopurinol affected several pathways, including pentose phosphate, pyrimidine, and tyrosine metabolism. Our findings suggest that circulating XO does not contribute to vascular disease in CKD patients. In addition to inhibition of XO activity, allopurinol was observed to impact other pathways; the implications of which require further study.
1. Introduction
Gout and hyperuricemia are associated with several cardio-metabolic risk factors, including cardiovascular and kidney disease [1]. It is estimated that >70% of those with gout have significant chronic kidney disease (CKD) [1]. Patients with CKD represent a group at markedly increased risk of morbidity and mortality due to cardiovascular disease (CVD) [2,3,4,5,6]. Increased serum urate levels in CKD have been shown to associate with increased risk of cardiovascular events and death in this group of patients [7]. Xanthine oxidase (XO), the enzyme that converts hypoxanthine to xanthine, and xanthine to uric acid, is an important source for oxygen free radical production [8,9]. In the vasculature, XO is expressed in the endothelial cells where enhanced XO activity has been shown to contribute to increased superoxide production and to reduced nitric oxide availability (i.e., endothelial dysfunction) [10]. As such, XO may play a role in the development and progression of vascular disease in patients with CKD [11,12].
Serum urate levels are known to be elevated in CKD. This is likely related, at least partially, to reduced renal clearance of uric acid in the setting of reduced glomerular filtration rate [13]. However, it is also plausible that XO activity is increased in CKD considering the high prevalence of cardio-metabolic risk factors in this patient population. Several studies have explored the potential effect of urate-lowering on CVD outcomes in patients with CKD [14,15]. These studies have utilized the XO inhibitor, allopurinol [14,15,16,17]. Of note, no study to date has evaluated the effects of allopurinol on systemic XO activity in CKD.
Considering the high prevalence of gout/hyperuricemia in CKD, the potential links between gout/hyperuricemia, kidney disease progression and CVD in CKD, and that allopurinol is the most commonly prescribed urate-lowering agent for the treatment of gout/hyperuricemia and in clinical trials [18,19], we sought to evaluate the effects of allopurinol on XO activity in patients with CKD. Specifically, we hypothesized that XO inhibition in response to allopurinol therapy would associate with improved oxidative stress in CKD. In addition, the field of mass spectrometry-based metabolomics assessment has undergone considerable technological advances in the last few decades, providing an opportunity to obtain a comprehensive understanding of the potential impact of allopurinol on the metabolome of CKD patients [20]. In this post-hoc analysis, we utilized samples from a randomized double-blind clinical trial of allopurinol therapy in patients with stage three CKD [21].
2. Methods
2.1. Study Subjects
This is a post-hoc analysis. The rationale, design, objectives, and inclusion/exclusion criteria for ‘parent study’ have been described previously [21]. Briefly, the ‘parent study’ was a randomized double-blind placebo-controlled study of 80 patients with stage 3 CKD and asymptomatic hyperuricemia who received 300 mg of allopurinol vs. placebo for 12 weeks. We recruited adult men and women with stage 3 CKD (defined as eGFR between 30–60 mL/min/1.732) [22] and asymptomatic hyperuricemia (defined as serum urate of ≥7.0 and ≥6.0 mg/dL, respectively, with no history of gout). Potential subjects were excluded from participation if they were currently taking allopurinol or another uric acid-lowering agent or if they had a history of intolerance to allopurinol. Additional exclusion criteria included: any contraindication to the use of allopurinol such as severe liver disease, a history of severe congestive heart failure, any infection within the past 2 weeks, any hospitalization within the past 3 months, use of coumadin, and a body mass index > 40 kg/m2. The ‘parent study’ was approved by the Colorado Multiple Institutional Review Board and all participants were required to provide written consent prior to participation in the study. All the research visits for the ‘parent study’ took place at the Clinical and Translational Research Center (CTRC) at the University of Colorado Anschutz Medical Center. For this analysis, we included all the subjects who had an adequate volume of serum samples stored at −80 °C from the baseline and end of study visits (n = 14 in each study group (allopurinol and placebo)).
2.2. Xanthine Oxidase Activity
XO activity of serum samples was assayed using Amplex® Red Xanthine/Xanthine Oxidase Assay Kit (Thermofisher, Eugene, OR, USA) according to user’s instruction [23]. This kit measures superoxide formation in a coupled reaction to the red-fluorescent oxidation product, resofurine. Absorbance at 560 nm was measured via spectrophotometry. Samples were incubated at 37 °C in the reaction mixture for 30 min and absorbance measured at 560 nm in a standard spectrophotometer. Then, serum XO activity was determined from a simultaneously prepared standard curve. Hypoxanthine supplied in the kit was used as the standard and XO activity was measured by comparing the absorbance of samples with standards. XO activity was calculated as mU/mL of serum volume.
2.3. Endothelial Protein Expression
The expression of endothelial XO protein was evaluated via immunofluorescence of the venous endothelial cells that had been collected from the participants’ antecubital veins [21]. Slides were systematically scanned to identify endothelial cells (positive VE-Cadherin). Nuclear integrity was confirmed using 4′,6′-diamidino-2-phenylindole hydrochloride staining (DAPI). The immunofluorescence was quantified for the XO protein utilizing XO antibody (Abcam) in the endothelial cells expressing both VE-Cadherin and DAPI. Images were captured and then analyzed using NIS Elements BR Software (version 4.60.00, 64-bit, Nikon, Tokyo, Japan) to quantify the intensity of CY3 staining (i.e., average pixel intensity). Values for each sample were reported as ratios of endothelial cell XO protein expression to human umbilical vein endothelial cell (HUVEC) expression to account for any variation in the staining procedure. Technicians were blinded to subject identity during the staining and analysis procedures. In addition, we had previously evaluated the endothelial expression of nitrotyrosine (Abcam) [21], a footprint of oxidative injury in the endothelium [24]. The endothelial expression of nitrotyrosine (NT) was included in this analysis as an outcome.
2.4. Endothelium-Dependent and Independent Dilation
Endothelium-dependent dilation was evaluated via brachial artery flow-mediated dilation (BA-FMD) and endothelium-independent dilation via nitroglycerin mediation dilation (NMD). This was the primary outcome for the ‘parent study’ and was measured as described originally by Celermajer et al. [25] and subsequently by our group [26]. Briefly, BA-FMD was measured at the CTRC by a trained technician using high-resolution ultrasonography (GE Vivid 7 Dimension). Reactive hyperemia was produced by inflating a pediatric forearm cuff around the forearm to 250 mmHg for 5 min followed by rapid deflation. NMD was determined by measuring brachial artery dilation for 10 min after administration of sublingual nitroglycerin (0.4 mg). We used a commercially available software package (Vascular Analysis Tools 5.8.1, Medical Imaging Applications, LLC, Coralville, Iowa, USA) to concurrently acquire electrocardiogram (ECG)-gated brachial artery diameters during baseline, FMD, and NMD conditions. Brachial artery dilation was determined as the % change from baseline. Doppler flow of the brachial artery was also measured and peak shear rate was calculated as a potential covariate. Brachial artery dilation was determined as the % change from baseline. The images were analyzed by an independent research assistant who was blinded to the study groups.
2.5. Carotid Intima-Media Thickness (CIMT)
Similar to BA-FMD, CIMT was measured at the CTRC by an experience technician as previously described [27]. Briefly, the left common carotid artery was imaged via GE Vivid 7 ultrasound equipped with a linear array transducer and carotid artery diameter was analyzed using image analysis software (Carotid Analyzer version 5.10.10, Medical Imaging Applications). A longitudinal segment of the cephalic portion of the carotid artery was acquired ~2 cm distal to the carotid bulb for at least 10 cardiac cycles. Carotid IMT was defined as the distance from the leading edge of the lumen-intima interface to the leading edge of the media-adventitia interface on the far wall, measured during end diastole. All image analysis was performed by a single research assistant blinded to the study randomization.
2.6. Metabolomics Analysis
The analysis was conducted at the Fraternal Order of Eagles Diabetes Research Center Metabolomics Core facility in the Carver College of Medicine at the University of Iowa [28]. This targeted, in-house, standard-verified protocol measures more than 100 metabolites via gas chromatography–mass spectrometry. These include tricarboxylic acid (TCA) cycle and glycolytic/gluconeogenic intermediates in addition to amino acids, sugars, neurotransmitters, and fatty acids [29]. For metabolite extraction, the plasma samples were extracted in ice-cold 1:1 methanol/acetonitrile, which contained a mixture of 9 internal standards (d4-Citric Acid, 13C5-Glutamine, 13C5-Glutamic Acid, 13C6-Lysine, 13C5-Methionine, 13C3-Serine, d4-Succinic Acid, 13C11-Tryptophan, d8-Valine; Cambridge Isotope Laboratories, Tewksbury, MA, USA) at a concentration of 1 ug/mL each. The ratio of extraction solvent to sample volume was 18:1. The samples were then incubated at −20 °C for 1 h followed by a 10-min centrifugation at maximum speed. Supernatants were transferred to fresh tubes. Pooled quality control (QC) samples were prepared by adding an equal volume of each sample to a fresh 1.5 mL microcentrifuge tube. Processing blanks were utilized by adding extraction solvent to microcentrifuge tubes. Samples, pooled QCs, and processing blanks were evaporated using a speed-vac. The resulting dried extracts were derivatized using methyoxyamine hydrochloride (MOC) and N,O-Bis(trimethylsilyl)trifluoroacetamide (TMS) (both purchased from Sigma, St. Louis, MO, USA). Briefly, dried extracts were reconstituted in 30 μL of 11.4 mg/mL MOC in anhydrous pyridine (VWR), vortexed for 10 min, and heated for 1 h at 60 °C. Next, 20 μL TMS was added to each sample, and samples were vortexed for 1 min before heating for 30 min at 60 °C. The derivatized samples, blanks, and pooled QCs were then immediately analyzed using GC-MS.
GC chromatographic separation was conducted on a Thermo Trace 1300 GC with a TraceGold TG-5SilMS column (0.25 µm film thickness; 0.25 mm ID; 30 m length). The injection volume of 1 μL was used for all samples, blanks, and QCs. The GC was operated in split mode with the following settings: 20:1 split ratio; split flow: 24 μL/min, purge flow: 5 mL/min, Carrier mode: Constant Flow, Carrier flow rate: 1.2 mL/min). The GC inlet temperature was 250 °C. The GC oven temperature gradient was as follows: 80 °C for 3 min, ramped at 20 °C/minute to a maximum temperature of 280 °C, which was held for 8 min. The injection syringe was washed 3 times with pyridine between each sample. Metabolites were detected using a Thermo ISQ single quadrupole mass spectrometer. The data were acquired from 3.90 to 21.00 min in EI mode (70eV) by single ion monitoring (SIM). Metabolite profiling data were analyzed using Tracefinder 4.1 utilizing standard verified peaks and retention times.
We used TraceFinder 4.1 to identify metabolites in extracted samples, blank, and QCs. We do this by comparing sample metabolite peaks against an in-house library of standards. The standard library was prepared by processing and analyzing authentic standards via the method described above. We created a database of retention times and three fragment ions for each metabolite standard: a target peak/ion and two confirming peaks/ions. When running biological samples, we identify metabolites that not only match with the known retention times of the authentic standard, but also with its target and confirming peaks. Tracefinder was also used for GC-MS peak integration to obtain peak areas for each metabolite. After TraceFinder analysis, we correct for instrument drift over time using local regression analysis as described by Li et al. [30]. We use the pooled QC samples, which were run in duplicate at the beginning and end of the GC-MS run for this purpose. The data are then normalized to an internal standard (d4-Succinic Acid) to control for extraction, derivatization, and/or loading effects. Levels of the given metabolites were compared ratiometrically and are presented as fold change for each metabolite at the end of study visit normalized to the metabolite at the baseline visit with the baseline values normalized to 1.
2.7. Statistical Analysis
Baseline characteristics by study treatment group are presented as mean ± SD for continuous variables with categorical variables shown as %. Pearson’s chi-square test was used to evaluate the relationship between two categorical variables. Mann-Whitney test was used to access the difference of outcome variables between the two treatment groups. The vast majority of the metabolites were not normally distributed. Thus, we utilized the Wilcoxon Sign Rank test to evaluate differences in the metabolites between the baseline and end of study visits within each group. We then evaluated if the change in metabolites (from baseline to end of study) differed between the allopurinol and placebo groups via the Wilcoxon Rank Sum test. Next, we evaluated the potential correlation between the baseline levels of the metabolites and measures of vascular function and oxidative stress including BA-FMD, NMD, CIMT, serum oxidized low-density lipoprotein (oxLDL), and endothelial NT expression. Similarly, we evaluated the correlation between the baseline metabolite levels and measures of kidney function including Chronic Kidney Disease Epidemiology Collaboration (CKD-EPI) eGFR [31] and urinary albumin/creatinine ratio (ACR). SAS (version 9.4, Cary, N.C.) was used to conduct these analyses. To better characterize the pathways reflected by the metabolites that were significantly altered by allopurinol, we created a correlation network diagram in MetaboAnalyst 4.0. Metabolite Set Enrichment Analysis and Metabolomic Pathway Analysis are web-based tools that incorporated into MetaboAnalyst platform. We use those tools to perform metabolite enrichment and pathway analyses, respectively [32]. Color intensity (white to red) reflects a larger number of metabolites and higher statistical significance. Metabolites were included if they met the p < 0.05 threshold for the in-between group significance for the change in allopurinol vs. placebo. The color and size of each circle was based on p-value and pathway impact value, respectively. Significance was defined as p value < 0.05 for all analyses.
3. Results
3.1. Clinical Characteristics of the Participants
Twenty-eight subjects had residual samples at the baseline and end of study visits and were included in the analysis. No clinically significant differences were noted between those included in the analysis (n = 28) vs. the subjects that were not included (without residual samples). These data are shown in Supplemental Table S1. Baseline characteristics of the included subjects are presented in Table 1 according to treatment group. No significant differences were found between the placebo and allopurinol groups in demographics. Systolic and diastolic blood pressure, hemoglobin A1C, eGFR, ACR, and history of DM or cardiovascular disease did not differ between the groups. We, furthermore, observed no significant different in baseline BA-FMD, NMD, CIMT, oxLDL, or endothelial NT. Notably, serum urate levels, serum XO activity, and XO protein expression were similar between the allopurinol and placebo groups at baseline.

Table 1.
Subjects Baseline Characteristics.
3.2. Correlation of Baseline XO Activity and Expression with Makers of Vascular Function and Oxidative Stress
First, we evaluated whether baseline serum XO activity correlated with baseline measures of vascular or kidney function. We found no significant relation between serum XO activity and BA-FMD, NMD, CIMT, oxLDL, or endothelial NT. These data are shown in Table 2. Similarly, we found no significant relation between the baseline endothelial expression of XO and baseline BA-FMD, NMD, CIMT, oxLDL, or endothelial NT. Of note, serum XO activity did not correlate with serum urate. Rather, when evaluating the potential relation between serum urate levels and vascular and kidney outcomes, we found a significant inverse relation of baseline serum urate levels with baseline CKD-EPI GFR (Spearman correlation coefficient = −0.58, p < 0.0001).
Table 2.
Baseline correlation between serum urate, XO activity, and endothelial XO expression and measures of vascular and kidney function.
3.3. The Effects of Allopurinol on Serum Urate and XO Activity
As shown in Table 3, allopurinol effectively lowered serum urate levels by −3.60 (−4.24, −2.96) mg/dL as compared with a change of 0.26 (−0.38, 0.89) mg/dL in the placebo group (p < 0.0001). Allopurinol use was associated with a significant increase in serum xanthine 7.54 (5.74, 9.90) compared to no change in the placebo group 1.02 (0.77, 1.33); in between group difference p < 0.0001. Of interest, we found no significant change in the serum activity of XO; the absolute change of serum XO activity was −0.14 (−0.34, 0.064) and −0.04 (−0.39, 0.09) for the allopurinol and placebo groups, respectively (p value = 0.70). We observed no significant change in the expression of XO protein in the endothelium of the participating individuals in either group. These data are shown in Figure 1.
Table 3.
Allopurinol, compared to placebo, did not affect serum XO activity.
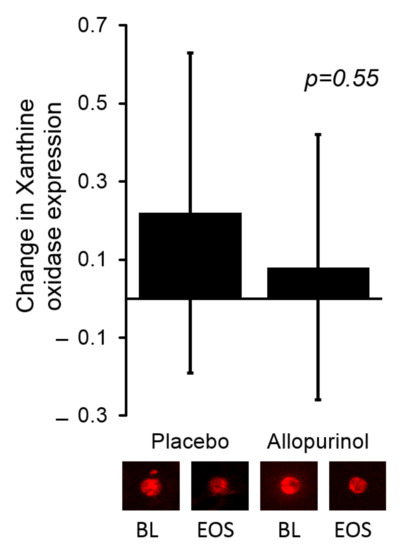
Figure 1.
There was no significant change in the expression of endothelial XO when comparing allopurinol to placebo. The bars in the graph represent the change from baseline for each study group. Representative images of the endothelial expression of XO are shown below the bar graph for the baseline (BL) and end of study (EOS) visits for the corresponding study group. Values for each sample were reported as arbitrary units and represent ratios of endothelial cell protein expression to human umbilical vein endothelial cell (HUVEC) expression.
3.4. Correlation of Change in Serum XO Activity with Makers of Vascular and Kidney Function and Markers of Oxidative Stress
We subsequently evaluated whether change in serum XO activity over the 12-week study period correlated with any of the markers of vascular function or oxidative stress. Consistent with the findings of the cross-sectional analysis, we found no significant relation between the change in serum XO activity and change in BA-FMD, NMD, CIMT, oxLDL, or endothelial NT.
3.5. The Effects of Allopurinol on the Metabolome in Patients with CKD
We identified 11 metabolites that changed significantly in the group treated with allopurinol vs. placebo (Table 4). The intensities of two metabolites (xanthine and orotate) increased by approximately six and twelve fold, respectively, after twelve weeks of allopurinol treatment without notable change in the placebo group. Ribose-5-phosphate (R5P), dihydroxyphenylalanine, and N-Acetyl Tyrosine were reduced by approximately 40%, 30%, and 60% with allopurinol but did not change in placebo group. The metabolites most impacted by allopurinol vs. placebo and their corresponding pathways included: xanthine/purine metabolism, R5P/the pentose phosphate pathway, orotate/pyrimidine metabolism, and dihydrophenylalanine and N-acetyl tyrosine/tyrosine metabolism. To better characterize the pathways reflected by the metabolites that were significantly altered by allopurinol vs. placebo, a correlation network diagram was created in MetaboAnalyst. Limited overlap was observed amongst the affected pathways; the most notable being glycerolipid, purine metabolism and the Warburg effect. These data are shown in Figure 2.
Table 4.
Change in metabolites according to treatment group (allopurinol vs. placebo).
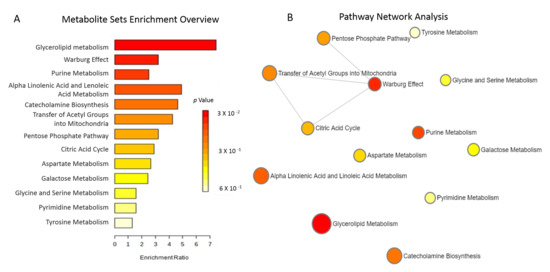
Figure 2.
(A). Metabolites Sets Enrichment. Over-representation analysis including the metabolites most significantly altered by allopurinol is shown. This does not account for the direction of the change in the metabolites (increased vs. decreased). Bar colors reflect the significance (p value) for the specific pathway. The length of each bar indicates fold enrichment of each metabolic pathway. (B). Metabolic Pathway Analysis highlights the significant pathways affected by allopurinol compared to placebo. We found limited overlap between the pathways affected by allopurinol. The matched pathways are shown as circles. The Y-axis represents the −log of p-values from pathway enrichment. The X-axis represents pathway impact value calculated from pathway topology analysis. The color and diameter of each circle is based on p-value and pathway impact value, respectively.
4. Discussion
We report, for the first time, the comprehensive effects of the most-commonly prescribed XO inhibitor, allopurinol, on the metabolome of patients with stage three CKD. Importantly, we measured circulating XO activity at baseline and in response to allopurinol therapy in patients with CKD. Our analysis indicates that allopurinol lowers serum urate concentration and increases serum xanthine but does not suppress circulating XO activity (as measured in the serum). XO activity is a major source of reactive oxidative species (ROS) [33] and XO inhibition is associated with reduced ROS [34]. However, here were unable to identify a significant change in of the biomarkers of vascular inflammation or oxidative stress with allopurinol [21]. We, furthermore, were unable to identify any association between serum XO activity or endothelial XO expression and biomarkers of vascular inflammation or oxidative stress. Collectively, our data suggest that circulating XO does not contribute to vascular dysfunction or oxidative stress in patients with CKD.
Allopurinol was discovered as a result of the drug discovery program at Burroughs Wellcome, an effort that yielded several impactful drugs, including allopurinol [35]. In 1966, allopurinol was approved by the Food and Drug Administration for the treatment of gout. To this day, allopurinol is a mainstay in the treatment of gout and hyperuricemia [36]. Over the last two decades, several investigators have produced data to suggest that allopurinol may treat several cardiovascular diseases common in CKD patients, including coronary artery disease and congestive heart failure (CHF) [36]. The benefits of allopurinol have been attributed, mostly, to the improvement in endothelial function observed with the inhibition of XO [37]. XO is believed to be one of the main contributors to oxidative stress in the vascular endothelium [33]. While XO is expressed in the endothelial and smooth muscle cells of human vessels [38], a number of reports suggest that endothelial XO is derived from the circulation and that circulating XO is sufficient (with adequate substrate) to produce severe endothelial cell injury [33,39]. While several studies have shown XO inhibition with allopurinol improves endothelial function and reduces oxidative stress in patients with CHF [40,41], our group was unable to reproduce similar findings in patients with CKD and hyperuricemia [21]. Our results in this analysis may explain these discrepant findings.
First, we observed contrasting findings regarding allopurinol’s effect on XO. Specifically, allopurinol did lead to decreased serum urate and increased serum xanthine levels, which are known effects on purine metabolism. However, allopurinol did not lead to decreased XO activity as measured in the serum samples. That allopurinol would decrease serum urate and increase serum xanthine is not surprising considering that XO is abundantly expressed in the liver [42] and that allopurinol is metabolized quickly in the liver (within 1–2 h) to oxypurinol, that also inhibits XO [43]. Thus, these data are consistent with allopurinol inhibiting XO activity in the liver. Still, oxypurinol is eliminated almost entirely unchanged in the urine and, as such, accumulates in patients with reduced kidney function [43]. Based on this, we expected allopurinol treatment to result in a robust XO- inhibitory effect on measured circulating (serum) XO when compared to placebo. Contrary to our hypothesis, we observed no significant difference in serum XO activity with allopurinol vs. placebo. These findings may be explained by the notably low baseline serum XO activity in our subjects. Of note, while XO activity is reportedly detectable in the circulation of humans [44,45], it would appear that the expression of XO in the serum is extremely low vs. that of the liver or the intestine, as Sarnesto et al. were unable to detect the XO protein in human serum [42]. In addition to the seemingly low amounts of XO protein in the circulation, increased serum urate in CKD may contribute to reduced XO activity [46,47]. In CKD, serum urate accumulates due to reduced clearance of urate by the kidneys. This accumulation of uric acid in the serum of CKD patients would inhibit XO activity. Considering that the parent study required hyperuricemia as an inclusion criterion, it is not surprising that serum XO activity was low in our patients at baseline. Our data suggest that circulating XO does not contribute significantly to oxidative stress nor increased serum urate levels in CKD patients. Rather that the increased serum urate levels are largely related to reduced renal clearance. This conclusion is further supported by the lack of an association between baseline serum XO activity or endothelial XO expression with biomarkers of oxidative stress. These findings may explain why recently conducted clinical trials have shown no benefit of urate-lowering via allopurinol to slow CKD progression in patients with CKD, despite the large number of observational studies linking hyperuricemia to kidney disease [16,17].
Second, our metabolomics analysis suggests that the effects of allopurinol extend to other pathways beyond XO. Importantly, our data are consistent with allopurinol leading to decreased pentose phosphate pathway (PPP). PPP pathway (summarized in Figure 3) is a critical source of nicotinamide adenine dinucleotide phosphate (NADPH) [48], necessary for ROS-neutralizing [49]. We found that ribose-5-phosphate (R5P), which is produced by the PPP, was significantly decreased, which is consistent with PPP inhibition. The PPP, depicted in Figure 3, is also an important pathway to provide precursors for nucleotide and amino acid biosynthesis [48]. Allopurinol-induced decreases in PPP activity may contribute further to the urate-lowering effect of the drug by reducing R5P availability for purine synthesis and potentially other effects in tissues that were not observed by this study [50]. Additionally, our data are consistent with allopurinol impacting the oxidative branch of the PPP. The oxidative branch of PPP converts G6P to R5P while reducing nicotinamide adenine dinucleotide phosphate (NADP+) to NADPH [48]. NADPH is critical to protect against reactive oxygen species (ROS)-mediated damage and for the synthesis of antioxidants such as glutathione [49]. Allopurinol-mediated inhibition of the oxidative branch could decrease NADPH availability and thus antioxidant capacity. Whether the inhibitory effect of allopurinol on the PPP offsets the potential antioxidant benefit of XO inhibition requires further study.
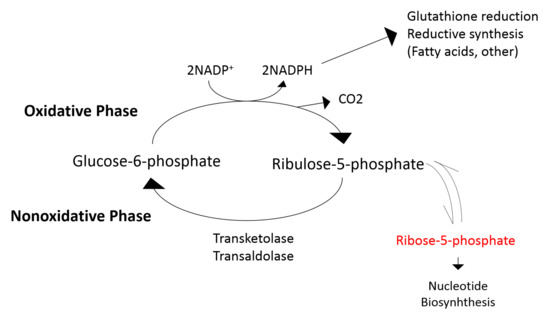
Figure 3.
Illustration of the pentose phosphate pathway (PPP). Allopurinol-mediated inhibition of PPP reduces ribose-5-phosphate availability for purine synthesis, which likely contributes to the urate-lowering effect of the drug. Allopurinol, additionally, inhibits the oxidative branch of the PPP and may result in reduced availability NADPH.
A few additional observations warrant mention. The effects of allopurinol and its downstream metabolite, oxypurinol, on pyrimidine synthesis include inhibition of orotodine monophosphate decarboxylase (OMD) [51]. The inhibition of OMD results in the accumulation of orotidine monophosphate and its precursor orotic acid ultimately leading to orotidinuria [52]. Allopurinol-induced orotidinuria is significantly exaggerated in individuals with ornithine carbamoyltransferase deficiency and has been utilized as a diagnostic test to identify female carriers of this genetic deficiency [52]. This effect of allopurinol is likely independent of XO inhibitory effect and appears to be specific to allopurinol (a purine analogue XO inhibitor) as it is reportedly not observed in non-purine analogue XO inhibitors [53]. It is furthermore hypothesized that allopurinol may impede re-composition of high-energy phosphates via the purine salvage pathway [53]. Whether allopurinol-mediated inhibition of pyrimidine synthesis translates to clinically significant sequela in patients with CKD remains unclear.
In addition to the above, we observed a significant reduction in N-acetyl tyrosine and dihydrophenylalanine, both precursors of tyrosine [54]. Of note, it is known that CKD patients suffer from impaired hydroxylation and removal of phenylalanine, reduced synthesis of tyrosine, and the accumulation of metabolites of phenylalanine and tyrosine [54]. Our data suggest that allopurinol treatment further contributes to tyrosine deficiency in CKD patients. These findings are important, as tyrosine is a semi-essential amino acid critical in the synthesis of catecholamines including dopamine. Dopamine deficiency in the brain is a critical contributor to Parkinson’s disease [55]. Of note, allopurinol has been shown to lower serum and striatal (brain) urate in addition to striatal dopamine in animal models of Parkinson’s disease [56]. As such, the decrease in N-acetyl tyrosine and dihydrophenylalanine is likely a result of urate lowering rather than a direct effect of allopurinol or XO inhibition [57].
Lastly, we observed a significant effect of allopurinol on the glycerolipid pathway with reduced serum levels of glycerate and glycerol. Glycerol is released into the blood from adipose tissues through adipolysis and is a key component of the glycerolipid/free fatty acid cycling and critical in thermoregulation [58]. In our review of the literature, we were unable to identify other studies with a similar observation. While the exact mechanism behind this observation is unclear, fever and flushing of the skin are known potential adverse events of the drug [59]. Based on our findings, an intriguing possibility is that that allopurinol may affect thermoregulation via glycerolipid metabolism.
This work has several limitations. First it is a post-hoc analysis with a subset of participants from the parent study. Second, the parent study only recruited subjects with CKD, thus, we are unable to evaluate if serum XO activity is truly reduced in CKD vs. non-CKD subjects. Considering that our findings are limited to patients with CKD, our results are not generalizable to individuals without CKD. Nevertheless, the study has several strengths including that the parent study was a randomized placebo-controlled study, we were able to evaluate circulating and endothelial biomarkers of oxidative stress, and we offer a detailed metabolomics analysis.
5. Conclusions
We provide the first comprehensive evaluation of the effects of allopurinol on circulating XO activity and the metabolome of patients with CKD. Our data indicate that allopurinol, at the commonly utilized dose of 300 mg per day, lowers serum urate levels significantly in CKD patients, but (contrary to common belief), allopurinol does not appear to result in significant antioxidant effects in this patient population. This may be explained by the low activity of circulating XO in this population. These data support the use of allopurinol to lower serum urate levels in patients with an indication for such therapy (e.g., gout) but do not support the use of allopurinol to reduce ROS-mediated injury in CKD.
Supplementary Materials
The following supporting information can be downloaded at: https://www.mdpi.com/article/10.3390/antiox11071297/s1, Table S1: Baseline characteristics of the subjects included vs. those excluded from this analysis.
Author Contributions
M.S. designed the study and drafted the first version of the manuscript. N.H. and D.S. conducted the xanthine oxidase assays and coordinated the metabolomics analyses. J.B., D.Z.-O. and E.B.T. oversaw the metabolomics analyses and provided critical input regarding the data analysis and interpretation. C.W. and P.T.E. conducted the statistical analysis and provided critical edits to the manuscript. D.I.J. conceived the study, oversaw the study design, analyses, and data interpretation, and conducted the final edits for the manuscript. All authors have read and agreed to the published version of the manuscript.
Funding
This research was funded by the NIH grants T32 DK007690 (MS), K23DK088833 (DJ), F30 DK127845 (JB), R01HL134738 (DJ), K12 HD027748 (DZO), and R01 DK104998 (EBT). In addition, this study was supported in part by The University of Iowa Clinical and Translational Science Award granted with funds from the NIH (UL1TR002537).
Institutional Review Board Statement
Ethical review and approval were waived for this study, due to the utilization of de-identified data and samples in post-hoc analysis of a previously approved study. The parent study was approved by the Colorado multiple institutional review board (#10-0265).
Informed Consent Statement
Informed consent was not applicable as this was deemed ‘not human subjects research’ due to the utilization of de-identified data and samples. For the parent study, informed consent was obtained from all subjects involved in the study. The consent included the agreement for future utilization of data and samples.
Data Availability Statement
Restrictions apply to the availability of these data. Data were obtained from VA Eastern Colorado Health Care System, Denver, CO and are available from the authors with the permission of the VA Eastern Colorado Health Care System via a data use agreement. This can be accomplished by contacting the research compliance office at the Rocky Mountain Regional VAMC (ADDRESS: 1700 N. Wheeling St.; Research—151, Aurora, CO 80045-5701, phone: 303-399-8020).
Conflicts of Interest
D.I.J. declares that all authors participated in the conception and design of the study, interpretation of data, drafting and critical revision of the manuscript, and have read and approved the manuscript. The manuscript is not under consideration elsewhere, and none of the content has been previously published. The authors have no conflict of interest to disclose. As corresponding author, I had full access to all the data in the study, had final responsibility for the decision to submit for publication, and have seen and approved the final version.
References
- Zhu, Y.; Pandya, B.J.; Choi, H.K. Comorbidities of gout and hyperuricemia in the US general population: NHANES 2007–2008. Am. J. Med. 2012, 125, 679–687.e1. [Google Scholar] [CrossRef] [PubMed]
- BBrantsma, A.H.; Bakker, S.J.L.; Hillege, H.L.; de Zeeuw, D.; de Jong, P.E.; Gansevoort, R.T. Cardiovascular and renal outcome in subjects with K/DOQI stage 1-3 chronic kidney disease: The importance of urinary albumin excretion. Nephrol. Dial. Transplant. 2008, 23, 3851–3858. [Google Scholar] [CrossRef] [PubMed]
- Go, A.S.; Chertow, G.M.; Fan, D.; McCulloch, C.E.; Hsu, C.Y. Chronic kidney disease and the risks of death, cardiovascular events, and hospitalization. N. Engl. J. Med. 2004, 351, 1296–1305. [Google Scholar] [CrossRef] [PubMed]
- McCullough, P.A.; Jurkovitz, C.T.; Pergola, P.E.; McGill, J.B.; Brown, W.W.; Collins, A.J.; Chen, S.C.; Li, S.; Singh, A.; Norris, K.C.; et al. Independent components of chronic kidney disease as a cardiovascular risk state: Results from the Kidney Early Evaluation Program (KEEP). Arch. Intern. Med. 2007, 167, 1122–1129. [Google Scholar] [CrossRef]
- McCullough, P.A.; Li, S.; Jurkovitz, C.T.; Stevens, L.; Collins, A.J.; Chen, S.-C.; Norris, K.C.; McFarlane, S.; Johnson, B.; Shlipak, M.G.; et al. Chronic kidney disease, prevalence of premature cardiovascular disease, and relationship to short-term mortality. Am. Heart J. 2008, 156, 277–283. [Google Scholar] [CrossRef]
- Weiner, D.E.; Tighiouart, H.; Stark, P.C.; Amin, M.G.; MacLeod, B.; Griffith, J.L.; Salem, D.N.; Levey, A.S.; Sarnak, M.J. Kidney disease as a risk factor for recurrent cardiovascular disease and mortality. Am. J. Kidney Dis. 2004, 44, 198–206. [Google Scholar] [CrossRef]
- Madero, M.; Sarnak, M.J.; Wang, X.; Greene, T.; Beck, G.J.; Kusek, J.W.; Collins, A.J.; Levey, A.S.; Menon, V. Uric acid and long-term outcomes in CKD. Am. J. Kidney Dis. 2009, 53, 796–803. [Google Scholar] [CrossRef]
- Battelli, M.G.; Polito, L.; Bortolotti, M.; Bolognesi, A. Xanthine oxidoreductase-derived reactive species: Physiological and pathological effects. Oxid Med. Cell Longev. 2016, 2016, 3527579. [Google Scholar] [CrossRef]
- Granger, D.N.; Kvietys, P.R. Reperfusion injury and reactive oxygen species: The evolution of a concept. Redox. Biol. 2015, 6, 524–551. [Google Scholar] [CrossRef]
- Ohara, Y.; Peterson, T.E.; Harrison, D.G. Hypercholesterolemia increases endothelial superoxide anion production. J. Clin. Investig. 1993, 91, 2546–2551. [Google Scholar] [CrossRef]
- El Boueiz, A.; Damarla, M.; Hassoun, P.M. Xanthine oxidoreductase in respiratory and cardiovascular disorders. Am. J. Physiol Lung Cell Mol. Physiol. 2008, 294, L830–L840. [Google Scholar] [CrossRef] [PubMed]
- Omizo, H.; Tamura, Y.; Morimoto, C.; Ueno, M.; Hayama, Y.; Kuribayashi-Okuma, E.; Uchida, S.; Shibata, S. Cardio-renal protective effect of the xanthine oxidase inhibitor febuxostat in the 5/6 nephrectomy model with hyperuricemia. Sci. Rep. 2020, 10, 9326. [Google Scholar] [CrossRef] [PubMed]
- Jalal, D.I.; Chonchol, M.; Chen, W.; Targher, G. Uric acid as a target of therapy in CKD. Am. J. Kidney Dis. 2013, 61, 134–146. [Google Scholar] [CrossRef]
- Goicoechea, M.; de Vinuesa, S.G.; Verdalles, U.; Verde, E.; Macias, N.; Santos, A.; de Jose, A.P.; Cedeño, S.; Linares, T.; Luño, J. Allopurinol and progression of CKD and cardiovascular events: Long-term follow-up of a randomized clinical trial. Am. J. Kidney Dis. 2015, 65, 543–549. [Google Scholar] [CrossRef] [PubMed]
- Goicoechea, M.; De Vinuesa, S.G.; Verdalles, U.; Ruiz-Caro, C.; Ampuero, J.; Rincón, A.; Arroyo, D.; Luño, J. Effect of allopurinol in chronic kidney disease progression and cardiovascular risk. Clin. J. Am. Soc. Nephrol. 2010, 5, 1388–1393. [Google Scholar] [CrossRef] [PubMed]
- Badve, S.V.; Pascoe, E.M.; Tiku, A.; Boudville, N.; Brown, F.G.; Cass, A.; Clarke, P.; Dalbeth, N.; Day, R.O.; de Zoysa, J.R.; et al. Effects of Allopurinol on the Progression of Chronic Kidney Disease. N. Engl. J. Med. 2020, 382, 2504–2513. [Google Scholar] [CrossRef] [PubMed]
- Doria, A.; Galecki, A.T.; Spino, C.; Pop-Busui, R.; Cherney, D.Z.; Lingvay, I.; Parsa, A.; Rossing, P.; Sigal, R.J.; Afkarian, M.; et al. Serum urate lowering with allopurinol and kidney function in type 1 diabetes. N. Engl. J. Med. 2020, 382, 2493–2503. [Google Scholar] [CrossRef]
- Singh, J.A.; Cleveland, J.D. Hypersensitivity reactions with allopurinol and febuxostat: A study using the Medicare claims data. Ann. Rheum Dis. 2020, 79, 529–535. [Google Scholar] [CrossRef]
- Mohammed, E.; Browne, L.D.; Kumar AU, A.; Adeeb, F.; Fraser, A.D.; Stack, A.G. Prevalence and treatment of gout among patients with chronic kidney disease in the Irish health system: A national study. PLoS ONE 2019, 14, e0210487. [Google Scholar] [CrossRef]
- Zhang, X.-W.; Li, Q.-H.; Xu, Z.-D.; Dou, J.-J. Mass spectrometry-based metabolomics in health and medical science: A systematic review. RSC Adv. 2020, 10, 3092–3104. [Google Scholar] [CrossRef]
- Jalal, D.I.; Decker, E.; Perrenoud, L.; Nowak, K.; Bispham, N.; Mehta, T.; Smits, G.; You, Z.; Seals, D.; Chonchol, M.; et al. Vascular function and uric acid-lowering in stage 3 CKD. J. Am. Soc. Nephrol. 2017, 28, 943–952. [Google Scholar] [CrossRef] [PubMed]
- Levey, A.S.; Bosch, J.P.; Lewis, J.B.; Greene, T.; Rogers, N.; Roth, D. A more accurate method to estimate glomerular filtration rate from serum creatinine: A new prediction equation. Modification of Diet in Renal Disease Study Group. Ann. Intern. Med. 1999, 130, 461–470. [Google Scholar] [CrossRef] [PubMed]
- Meijer, B.; Seinen, M.L.; Hosman, T.; Linskens, R.K.; Kneppelhout, J.-K.; Peters, G.J.; Mulder, C.J.; A Van Bodegraven, A.; De Boer, N.K. High inter-individual variability of serum xanthine oxidoreductase activity in IBD patients. Nucleosides Nucleotides Nucleic Acids 2018, 37, 317–323. [Google Scholar] [CrossRef] [PubMed]
- Vaziri, N.D.; Ni, Z.; Oveisi, F.; Liang, K.; Pandian, R. Enhanced nitric oxide inactivation and protein nitration by reactive oxygen species in renal insufficiency. Hypertension 2002, 39, 135–141. [Google Scholar] [CrossRef]
- Celermajer, D.S.; Sorensen, K.; Ryalls, M.; Robinson, J.; Thomas, O.; Leonard, J.V.; Deanfield, J.E. Impaired endothelial function occurs in the systemic arteries of children with homozygous homocystinuria but not in their heterozygous parents. J. Am. Coll Cardiol. 1993, 22, 854–858. [Google Scholar] [CrossRef][Green Version]
- Jablonski, K.L.; Decker, E.; Perrenoud, L.; Kendrick, J.; Chonchol, M.; Seals, U.R.; Jalal, D. Assessment of vascular function in patients with chronic kidney disease. J. Vis. Exp. 2014, 88, e51478. [Google Scholar] [CrossRef]
- Andrews, E.S.; Perrenoud, L.; Nowak, K.L.; You, Z.; Pasch, A.; Chonchol, M.; Kendrick, J.; Jalal, D. Examining the effects of uric acid-lowering on markers vascular of calcification and CKD-MBD; A post-hoc analysis of a randomized clinical trial. PLoS ONE 2018, 13, e0205831. [Google Scholar] [CrossRef]
- Tompkins, S.C.; Sheldon, R.; Rauckhorst, A.J.; Noterman, F.M.; Solst, S.R.; Buchanan, J.L.; Mapuskar, K.A.; Pewa, A.D.; Gray, L.R.; Oonthonpan, L.; et al. Disrupting mitochondrial pyruvate uptake directs glutamine into the TCA cycle away from glutathione synthesis and impairs hepatocellular tumorigenesis. Cell Rep. 2019, 28, 2608–2619.e6. [Google Scholar] [CrossRef]
- Metabolomics Core Facility. Available online: https://medicine.uiowa.edu/diabetes/metabolomics-core-facility (accessed on 1 February 2021).
- Li, B.; Tang, J.; Yang, Q.; Li, S.; Cui, X.; Li, Y.H.; Chen, Y.Z.; Xue, W.; Li, X.; Zhu, F. NOREVA: Normalization and evaluation of MS-based metabolomics data. Nucleic Acids Res. 2017, 45, W162–W170. [Google Scholar] [CrossRef]
- Levey, A.S.; Stevens, L.A.; Schmid, C.H.; Zhang, Y.L.; Castro, A.F., III; Feldman, H.I.; Kusek, J.W.; Eggers, P.; Van Lente, F.; Greene, T. A new equation to estimate glomerular filtration rate. Ann. Intern. Med. 2009, 150, 604–612. [Google Scholar] [CrossRef]
- Fanelli, G.; Gevi, F.; Belardo, A.; Zolla, L. Metabolic patterns in insulin-sensitive male hypogonadism. Cell Death Dis. 2018, 9, 653. [Google Scholar] [CrossRef] [PubMed]
- Houston, M.; Estevez, A.; Chumley, P.; Aslan, M.; Marklund, S.; Parks, D.A.; Freeman, B.A. Binding of xanthine oxidase to vascular endothelium. Kinetic characterization and oxidative impairment of nitric oxide-dependent signaling. J. Biol. Chem. 1999, 274, 4985–4994. [Google Scholar] [CrossRef] [PubMed]
- Nomura, J.; Busso, N.; Ives, A.; Matsui, C.; Tsujimoto, S.; Shirakura, T.; Tamura, M.; Kobayashi, T.; So, A.; Yamanaka, Y. Xanthine oxidase inhibition by febuxostat attenuates experimental atherosclerosis in mice. Sci. Rep. 2014, 4, 4554. [Google Scholar] [CrossRef] [PubMed]
- Elion, G.B. Nobel Lecture. The purine path to chemotherapy. Biosci. Rep. 1989, 9, 509–529. [Google Scholar] [CrossRef] [PubMed]
- Pacher, P.; Nivorozhkin, A.; Szabó, C. Therapeutic effects of xanthine oxidase inhibitors: Renaissance half a century after the discovery of allopurinol. Pharmacol. Rev. 2006, 58, 87–114. [Google Scholar] [CrossRef]
- Landmesser, U.; Drexler, H. Allopurinol and endothelial function in heart failure: Future or fantasy? Circulation 2002, 106, 173–175. [Google Scholar] [CrossRef][Green Version]
- Hellsten-Westing, Y. Immunohistochemical localization of xanthine oxidase in human cardiac and skeletal muscle. Histochemistry 1993, 100, 215–222. [Google Scholar] [CrossRef]
- Yokoyama, Y.; Beckman, J.S.; Beckman, T.K.; Wheat, J.K.; Cash, T.G.; Freeman, B.A.; Parks, D.A. Circulating xanthine oxidase: Potential mediator of ischemic injury. Am. J. Physiol. 1990, 258 Pt 1, G564–G570. [Google Scholar] [CrossRef]
- Farquharson, C.A.J.; Butler, R.; Hill, A.; Belch, J.J.F.; Struthers, A.D. Allopurinol improves endothelial dysfunction in chronic heart failure. Circulation 2002, 106, 221–226. [Google Scholar] [CrossRef]
- Doehner, W.; Schoene, N.; Rauchhaus, M.; Leyva-Leon, F.; Pavitt, D.V.; Reaveley, D.A.; Schuler, G.; Coats, A.J.; Anker, S.D.; Hambrecht, R. Effects of xanthine oxidase inhibition with allopurinol on endothelial function and peripheral blood flow in hyperuricemic patients with chronic heart failure: Results from 2 placebo-controlled studies. Circulation 2002, 105, 2619–2624. [Google Scholar] [CrossRef]
- Sarnesto, A.; Linder, N.; O Raivio, K. Organ distribution and molecular forms of human xanthine dehydrogenase/xanthine oxidase protein. Lab. Investig. 1996, 74, 48–56. [Google Scholar] [PubMed]
- Day, R.O.; Graham, G.G.; Hicks, M.; McLachlan, A.J.; Stocker, S.; Williams, K.M. Clinical pharmacokinetics and pharmacodynamics of allopurinol and oxypurinol. Clin. Pharmacokinet. 2007, 46, 623–644. [Google Scholar] [CrossRef] [PubMed]
- Aranda, R.; Doménech, E.; Rus, A.D.; Real, J.T.; Sastre, J.; Vina, J.; Pallardó, F.V. Age-related increase in xanthine oxidase activity in human plasma and rat tissues. Free Radic. Res. 2007, 41, 1195–1200. [Google Scholar] [CrossRef] [PubMed]
- Newaz, M.A.; Adeeb, N.N. Detection of xanthine oxidase in human plasma. Med. J. Malaysia 1998, 53, 70–75. [Google Scholar]
- Tan, S.; Radi, R.; Gaudier, F.L.; A Evans, R.; Rivera, A.; A Kirk, K.; A Parks, D. Physiologic levels of uric acid inhibit xanthine oxidase in human plasma. Pediatr. Res. 1993, 34, 303–307. [Google Scholar] [CrossRef]
- Radi, R.; Tan, S.; Prodanov, E.; Evans, R.A.; Parks, D.A. Inhibition of xanthine oxidase by uric acid and its influence on superoxide radical production. Biochim. Biophys. Acta 1992, 1122, 178–182. [Google Scholar] [CrossRef]
- Stincone, A.; Prigione, A.; Cramer, T.; Wamelink, M.M.C.; Campbell, K.; Cheung, E.; Olin-Sandoval, V.; Grüning, N.-M.; Krüger, A.; Tauqeer Alam, M.; et al. The return of metabolism: Biochemistry and physiology of the pentose phosphate pathway. Biol. Rev. Camb. Philos. Soc. 2015, 90, 927–963. [Google Scholar] [CrossRef]
- Nobrega-Pereira, S.; Fernandez-Marcos, P.J.; Brioche, T.; Gomez-Cabrera, M.C.; Salvador-Pascual, A.; Flores, J.M.; Viña, M.C.G.-C.A.S.-P.J.; Serrano, M. G6PD protects from oxidative damage and improves healthspan in mice. Nat. Commun. 2016, 7, 10894. [Google Scholar] [CrossRef]
- Pilz, R.B.; Willis, R.C.; Boss, G.R. The influence of ribose 5-phosphate availability on purine synthesis of cultured human lymphoblasts and mitogen-stimulated lymphocytes. J. Biol. Chem. 1984, 259, 2927–2935. [Google Scholar] [CrossRef]
- Beardmore, T.D.; Kelley, W.N. Mechanism of allopurinol-mediated inhibition of pyrimidine biosynthesis. J. Lab. Clin. Med. 1971, 78, 696–704. [Google Scholar]
- Hauser, E.R.; Finkelstein, J.E.; Valle, D.; Brusilow, S.W. Allopurinol-induced orotidinuria. A test for mutations at the ornithine carbamoyltransferase locus in women. N. Engl. J. Med. 1990, 322, 1641–1645. [Google Scholar] [CrossRef] [PubMed]
- Tani, T.; Okamoto, K.; Fujiwara, M.; Katayama, A.; Tsuruoka, S. Metabolomics analysis elucidates unique influences on purine/pyrimidine metabolism by xanthine oxidoreductase inhibitors in a rat model of renal ischemia-reperfusion injury. Mol. Med. 2019, 25, 40. [Google Scholar] [CrossRef] [PubMed]
- Kopple, J.D. Phenylalanine and tyrosine metabolism in chronic kidney failure. J. Nutr. 2007, 137 (Suppl. 1), 1586S–1590S. [Google Scholar] [CrossRef] [PubMed]
- Hornykiewicz, O. The discovery of dopamine deficiency in the parkinsonian brain. J. Neural. Transm. Suppl. 2006, 70, 9–15. [Google Scholar]
- Kachroo, A.; Schwarzschild, M.A. Allopurinol reduces levels of urate and dopamine but not dopaminergic neurons in a dual pesticide model of Parkinson’s disease. Brain Res. 2014, 1563, 103–109. [Google Scholar] [CrossRef]
- Crotty, G.F.; Ascherio, A.; Schwarzschild, M.A. Targeting urate to reduce oxidative stress in Parkinson disease. Exp. Neurol. 2017, 298 Pt B, 210–224. [Google Scholar] [CrossRef]
- Prentki, M.; Madiraju, S.R.M. Glycerolipid metabolism and signaling in health and disease. Endocr Rev. 2008, 29, 647–676. [Google Scholar] [CrossRef]
- Eyer, F.; Zilker, T. Bench-to-bedside review: Mechanisms and management of hyperthermia due to toxicity. Critical Care. 2007, 11, 236. [Google Scholar] [CrossRef]


Publisher’s Note: MDPI stays neutral with regard to jurisdictional claims in published maps and institutional affiliations. |
© 2022 by the authors. Licensee MDPI, Basel, Switzerland. This article is an open access article distributed under the terms and conditions of the Creative Commons Attribution (CC BY) license (https://creativecommons.org/licenses/by/4.0/).