
Empagliflozin-Enhanced Antioxidant Defense Attenuates Lipotoxicity and Protects Hepatocytes by Promoting FoxO3a- and Nrf2-Mediated Nuclear Translocation via the CAMKK2/AMPK Pathway

 ,
,  ,
,  and
and 
Abstract
:1. Introduction
2. Materials and Methods
2.1. Cell Culture and Treatment
2.2. Cell Viability
2.3. Oil Red O Staining
2.4. Apoptosis Assay
2.5. LDH Release Assay
2.6. ROS Assay
2.7. Mitochondrial Functions Assay
2.8. Cellular ATP, MDA, and SOD Assay
2.9. Intracellular Calcium Ion (Ca2+) Measurement
2.10. Western Blot Analysis
2.11. Elisa Assay
2.12. Transfection
2.13. Statistical Analysis
3. Results
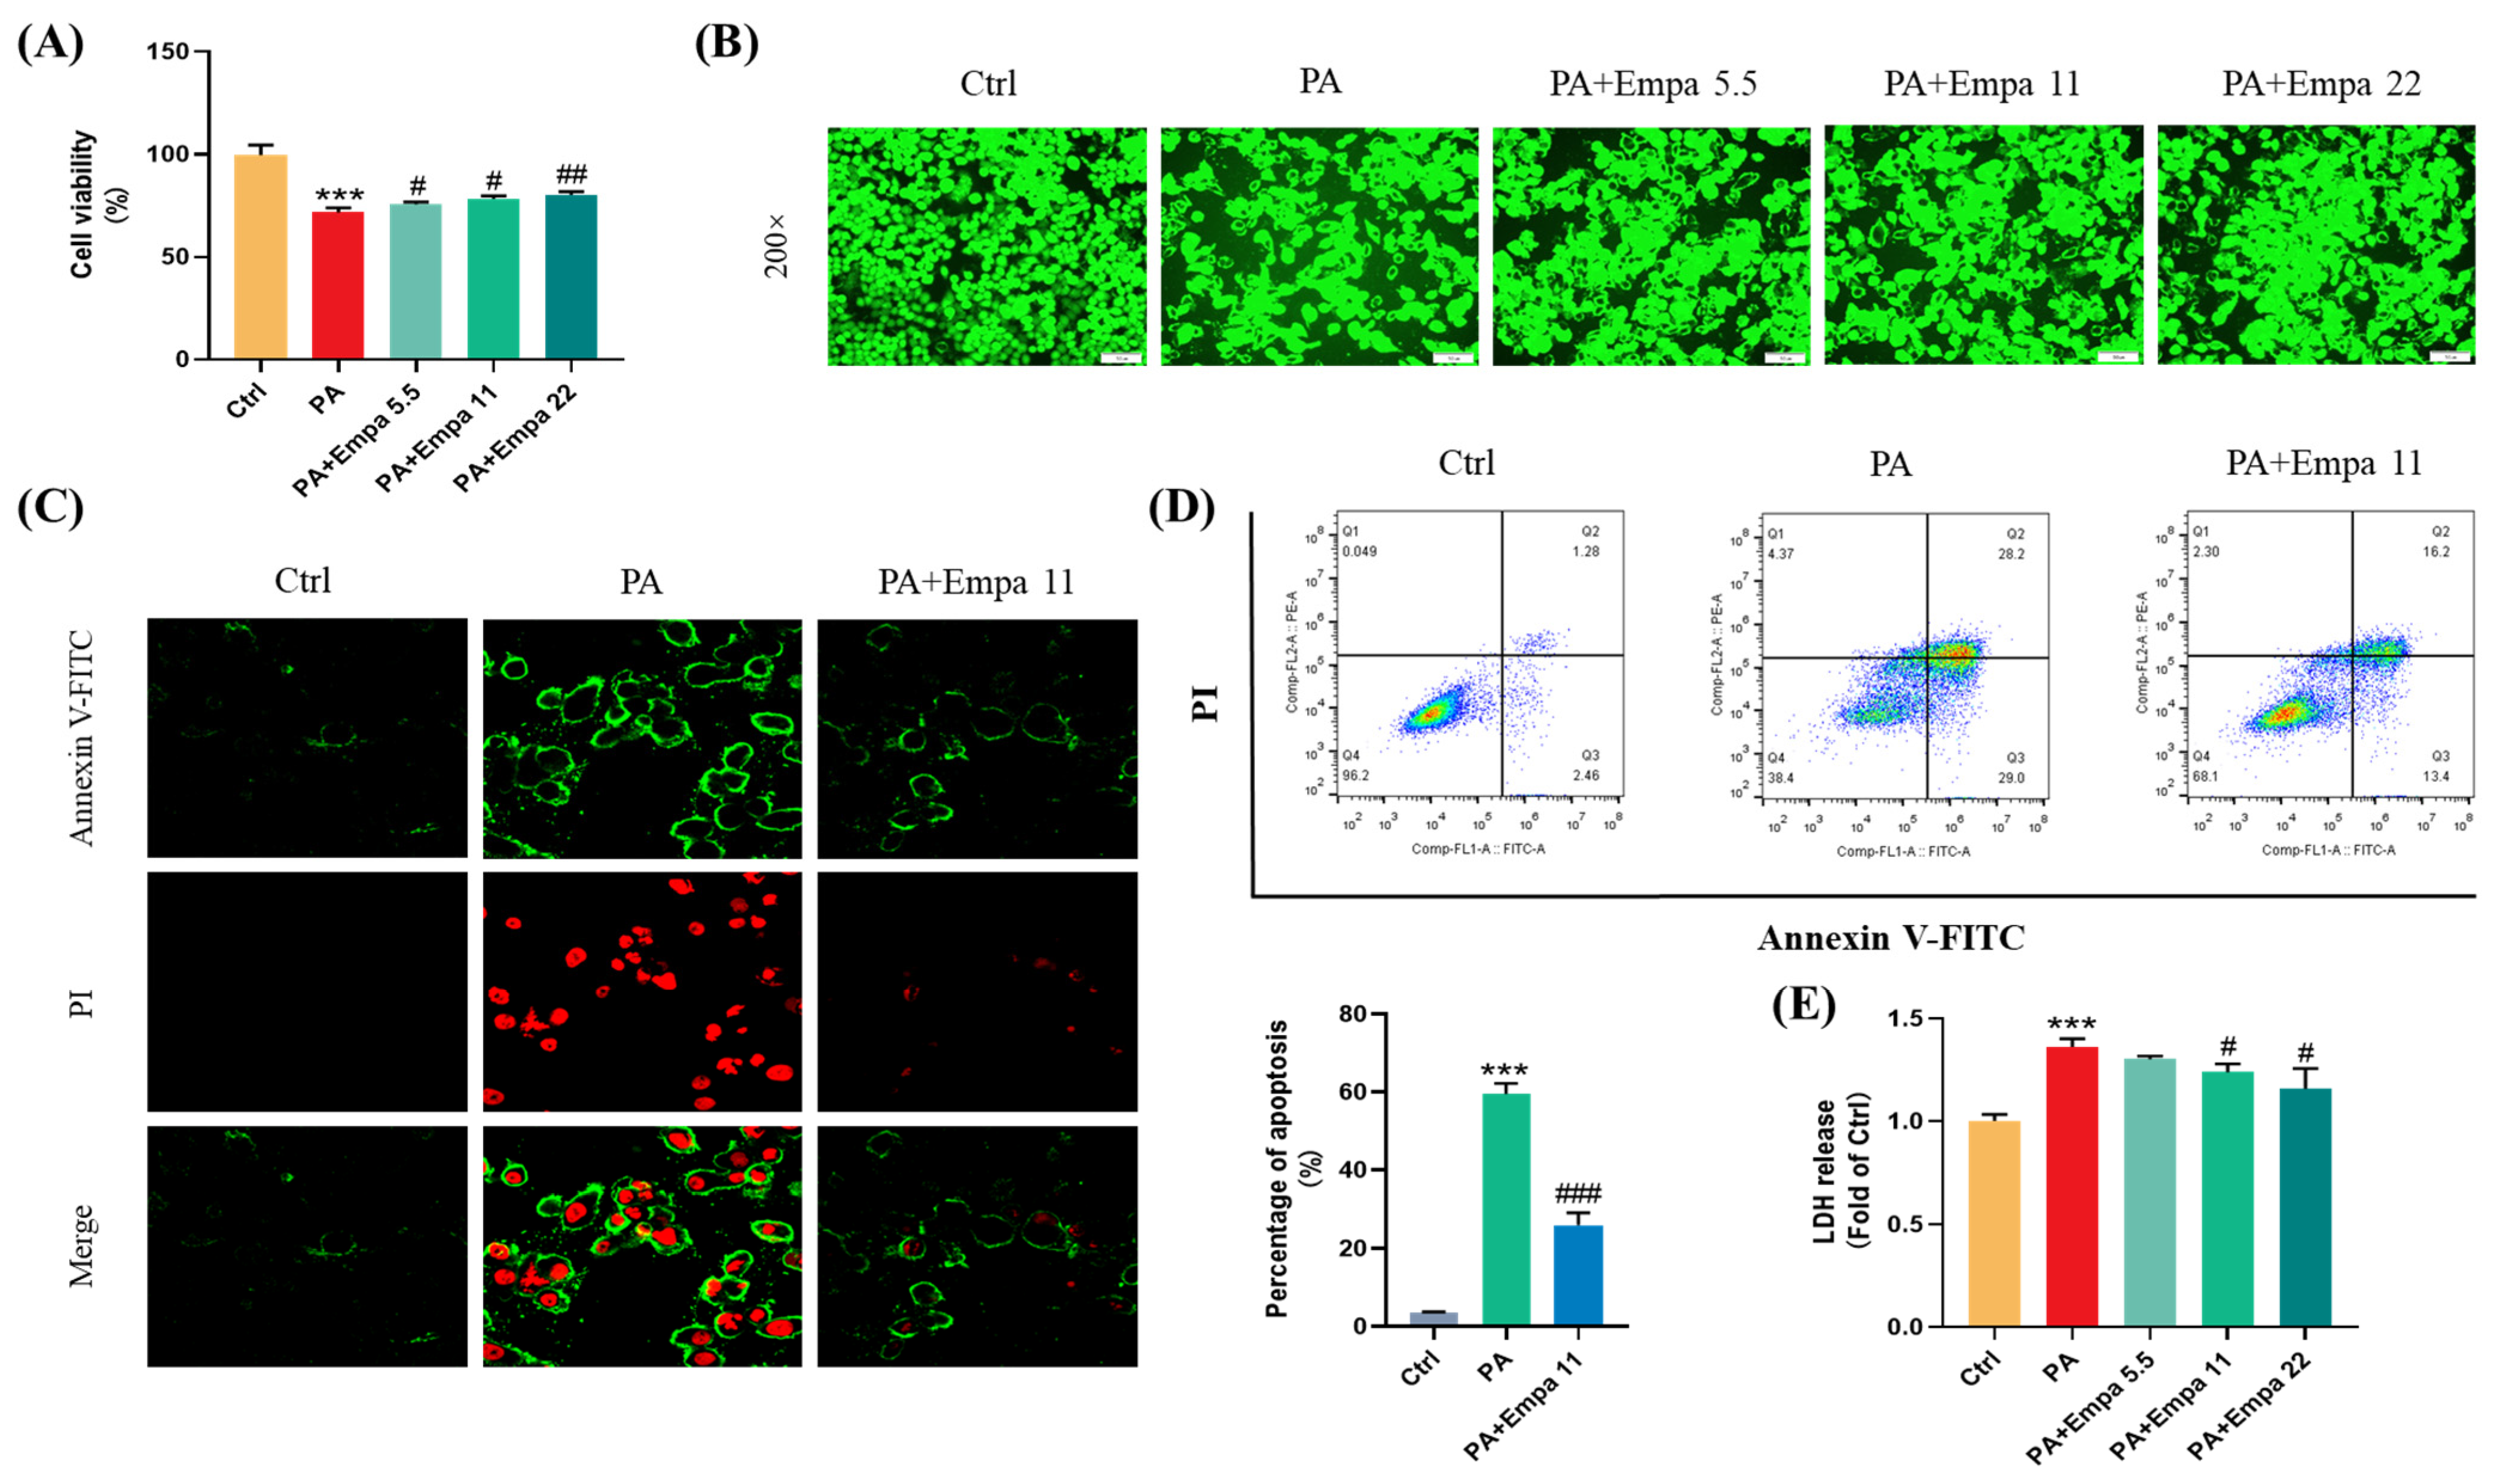
3.1. The Protective Effects of Empa on PA-Mediated Apoptosis and Injuries in LO2 Cells
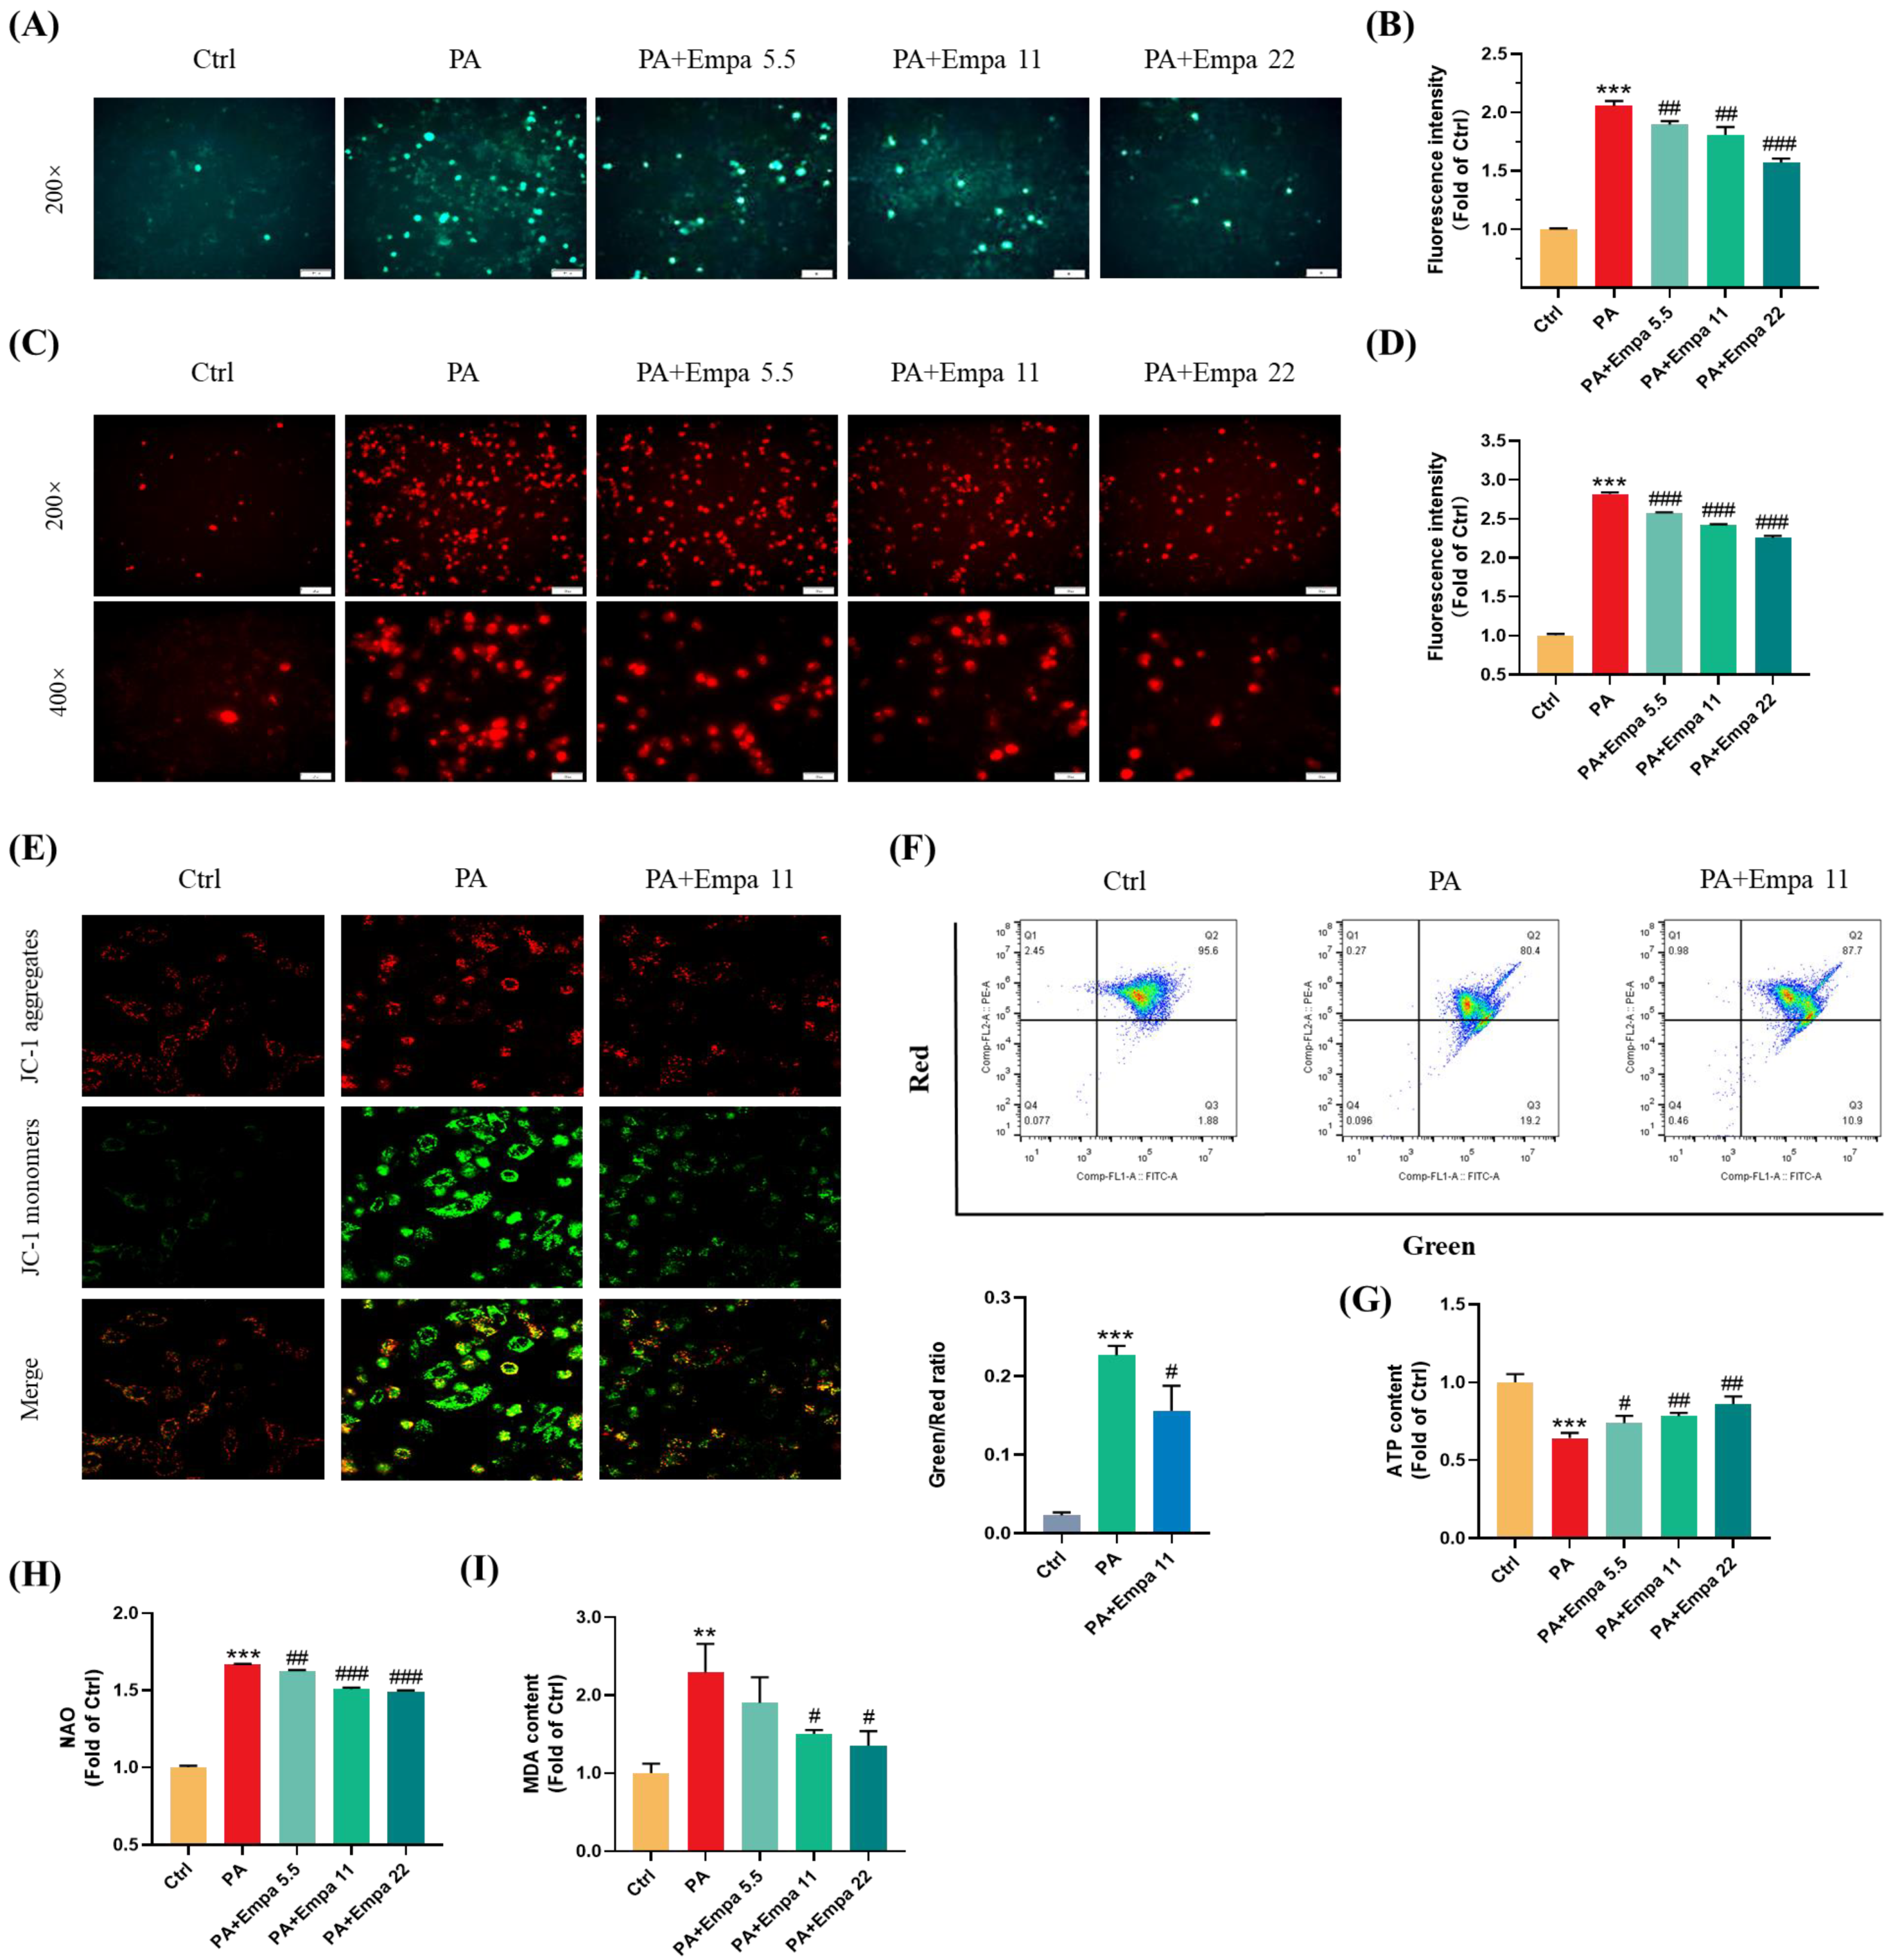
3.2. The Protective Effects of Empa on the Cellular and Mitochondrial ROS Production, and Mitochondrial Functions in PA-Induced Lipotoxicity Model
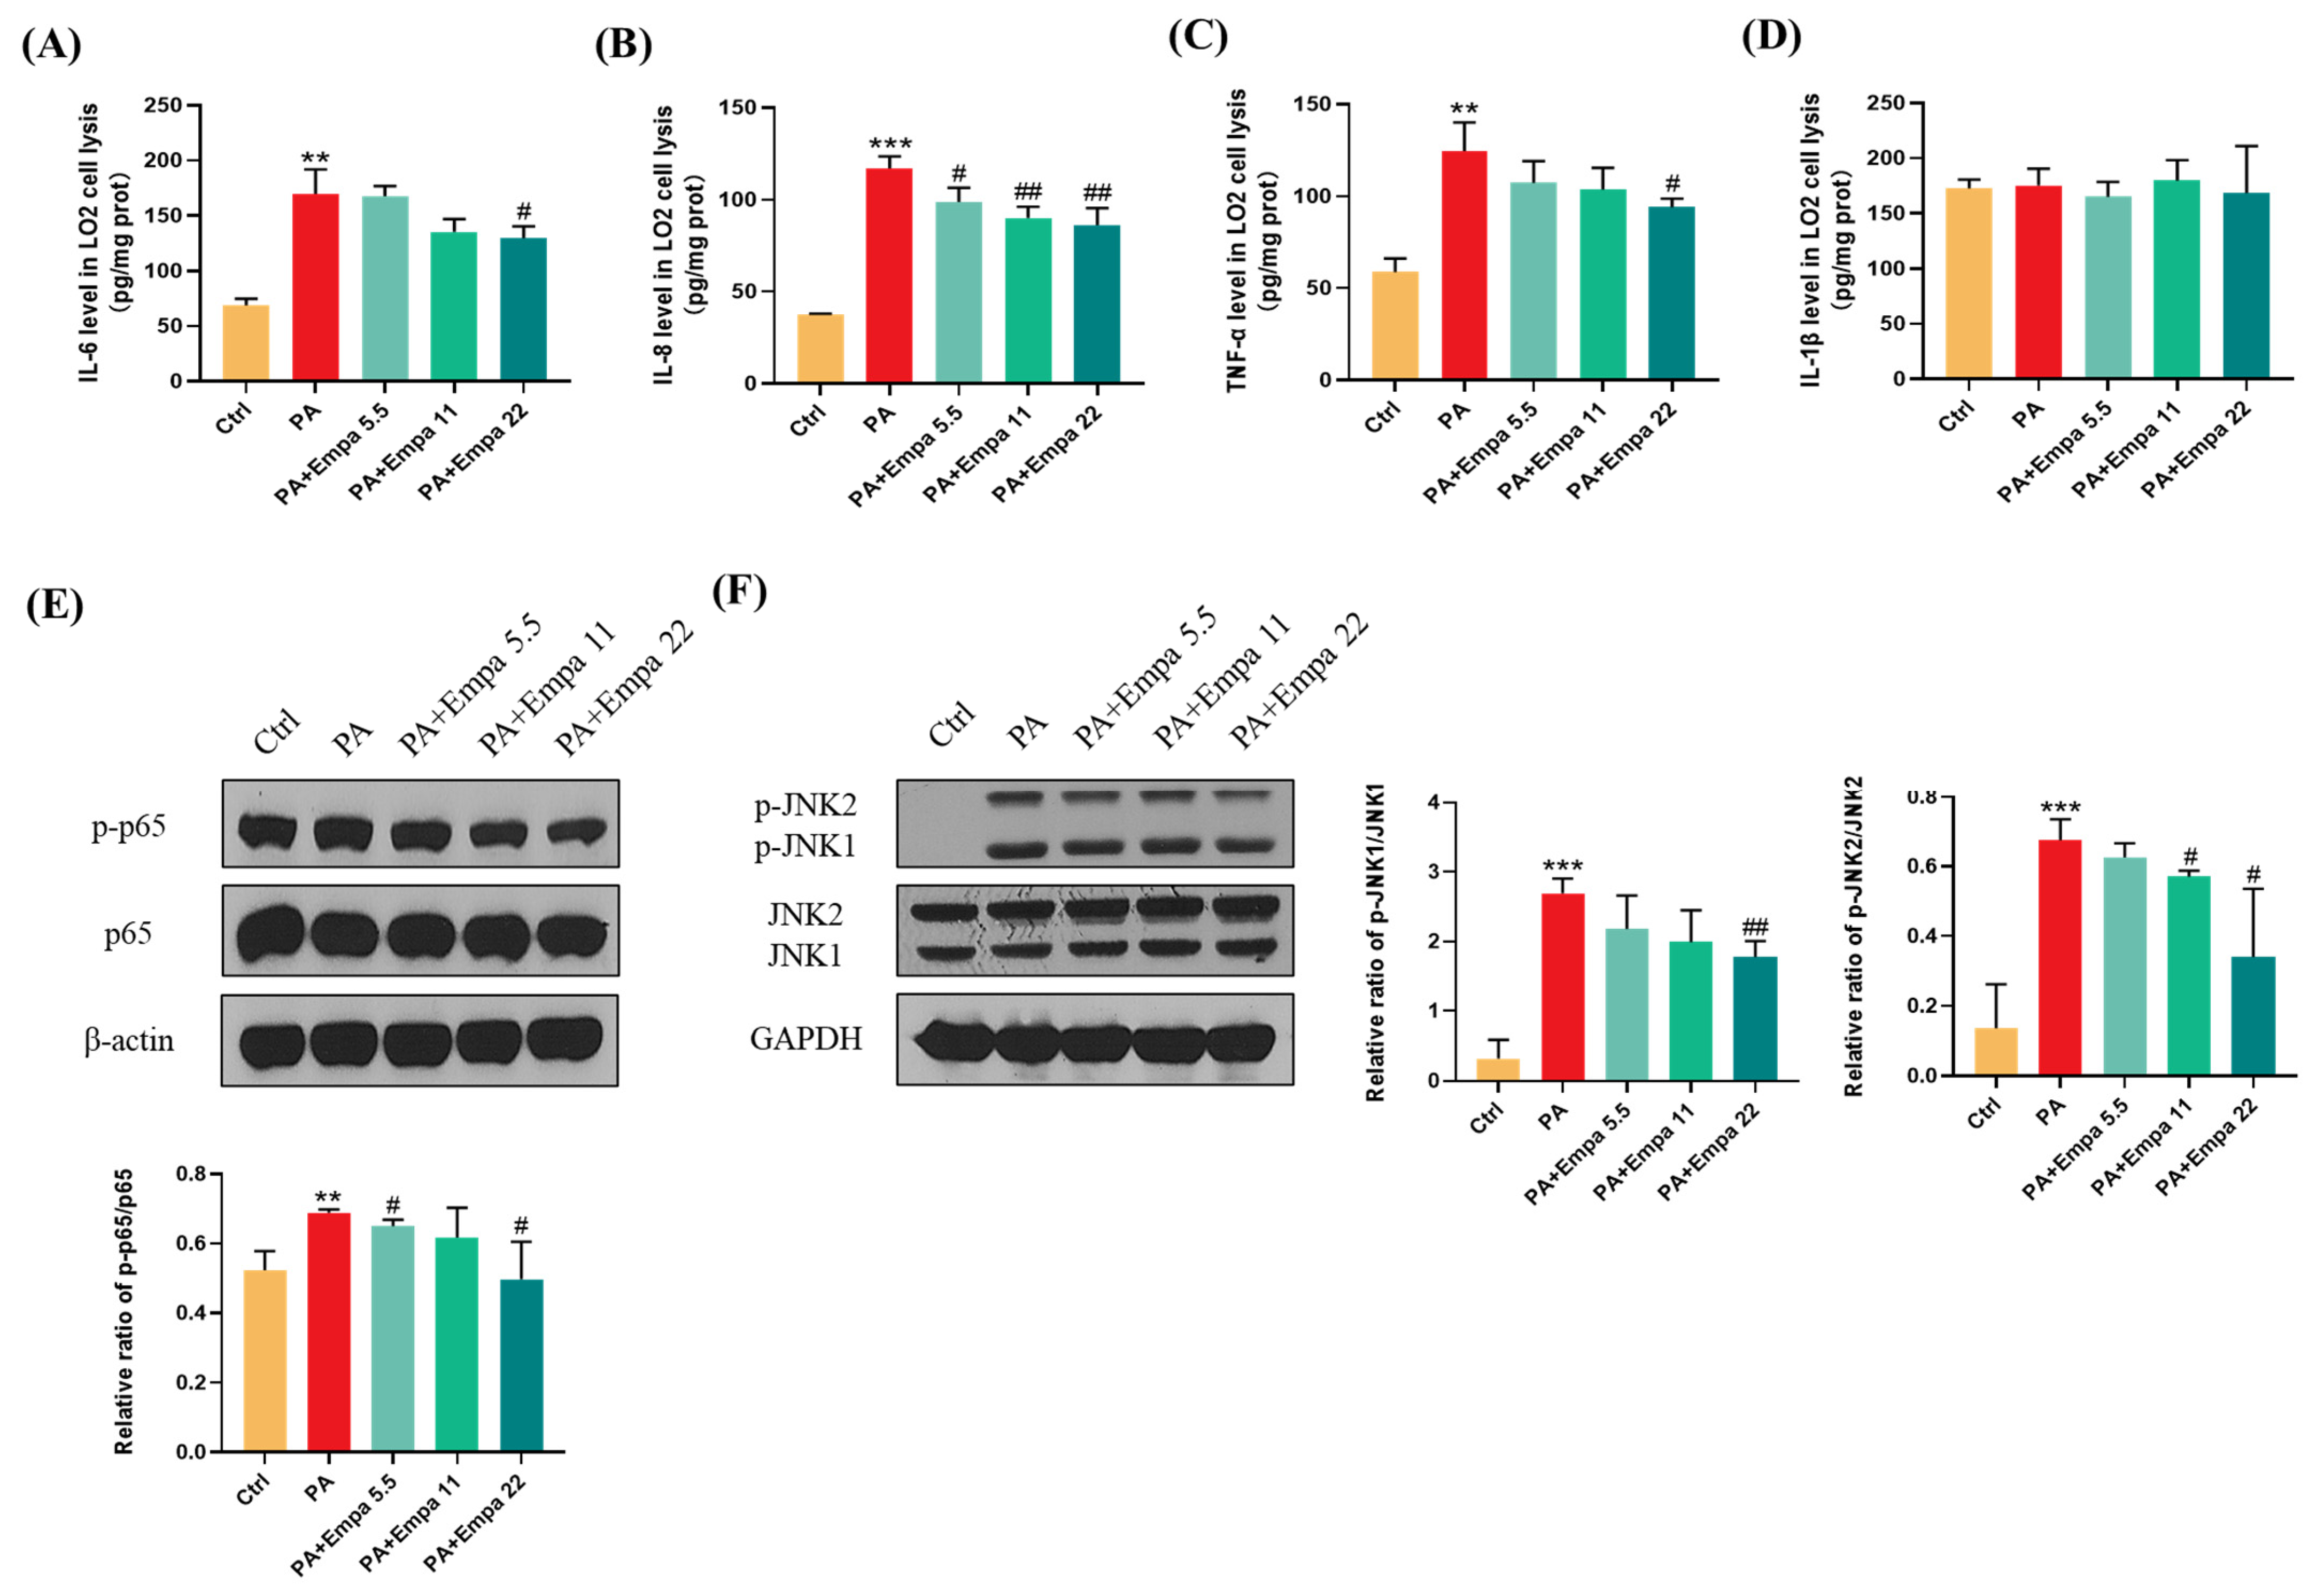
3.3. Empa Protected LO2 Cells from PA-Induced Severe Inflammatory Response and Reduced p-JNK-Mediated Apoptosis
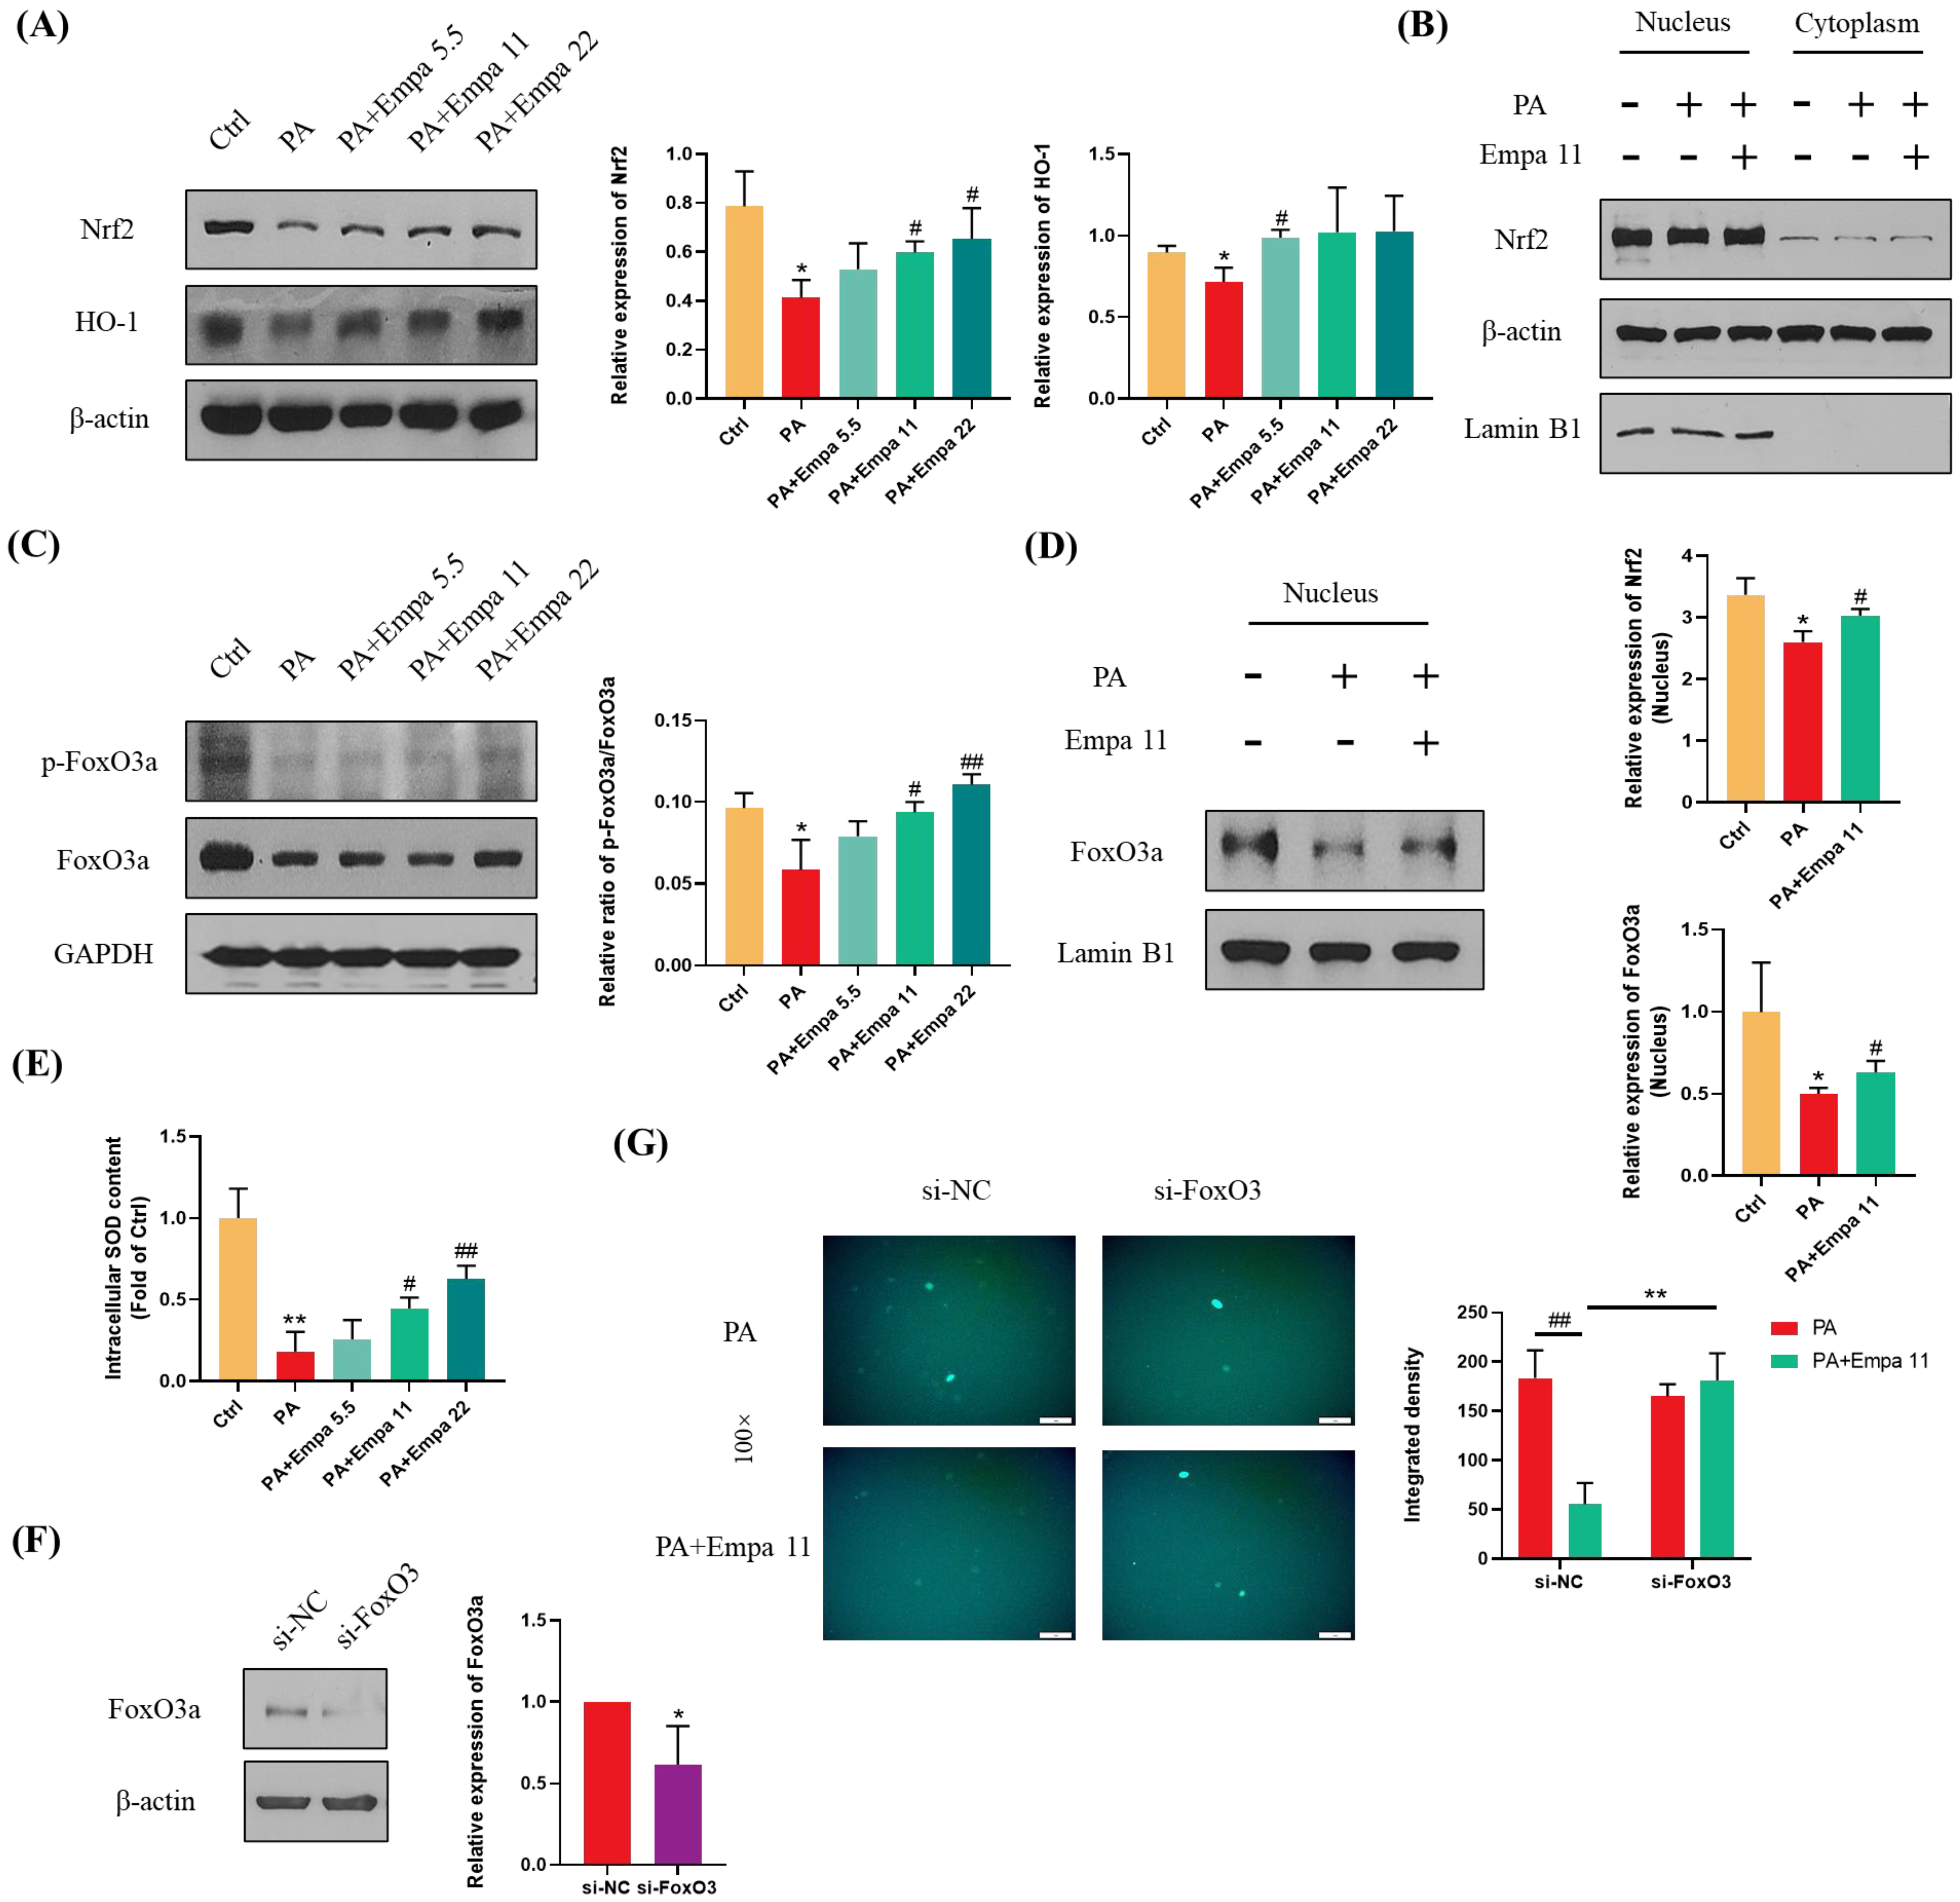
3.4. Nrf2/HO-1 and FoxO3a/SOD Pathway-Mediated Cellular Antioxidant Defense Might Be Involved in the Regulation of Empa on PA-Induced Oxidative Stress
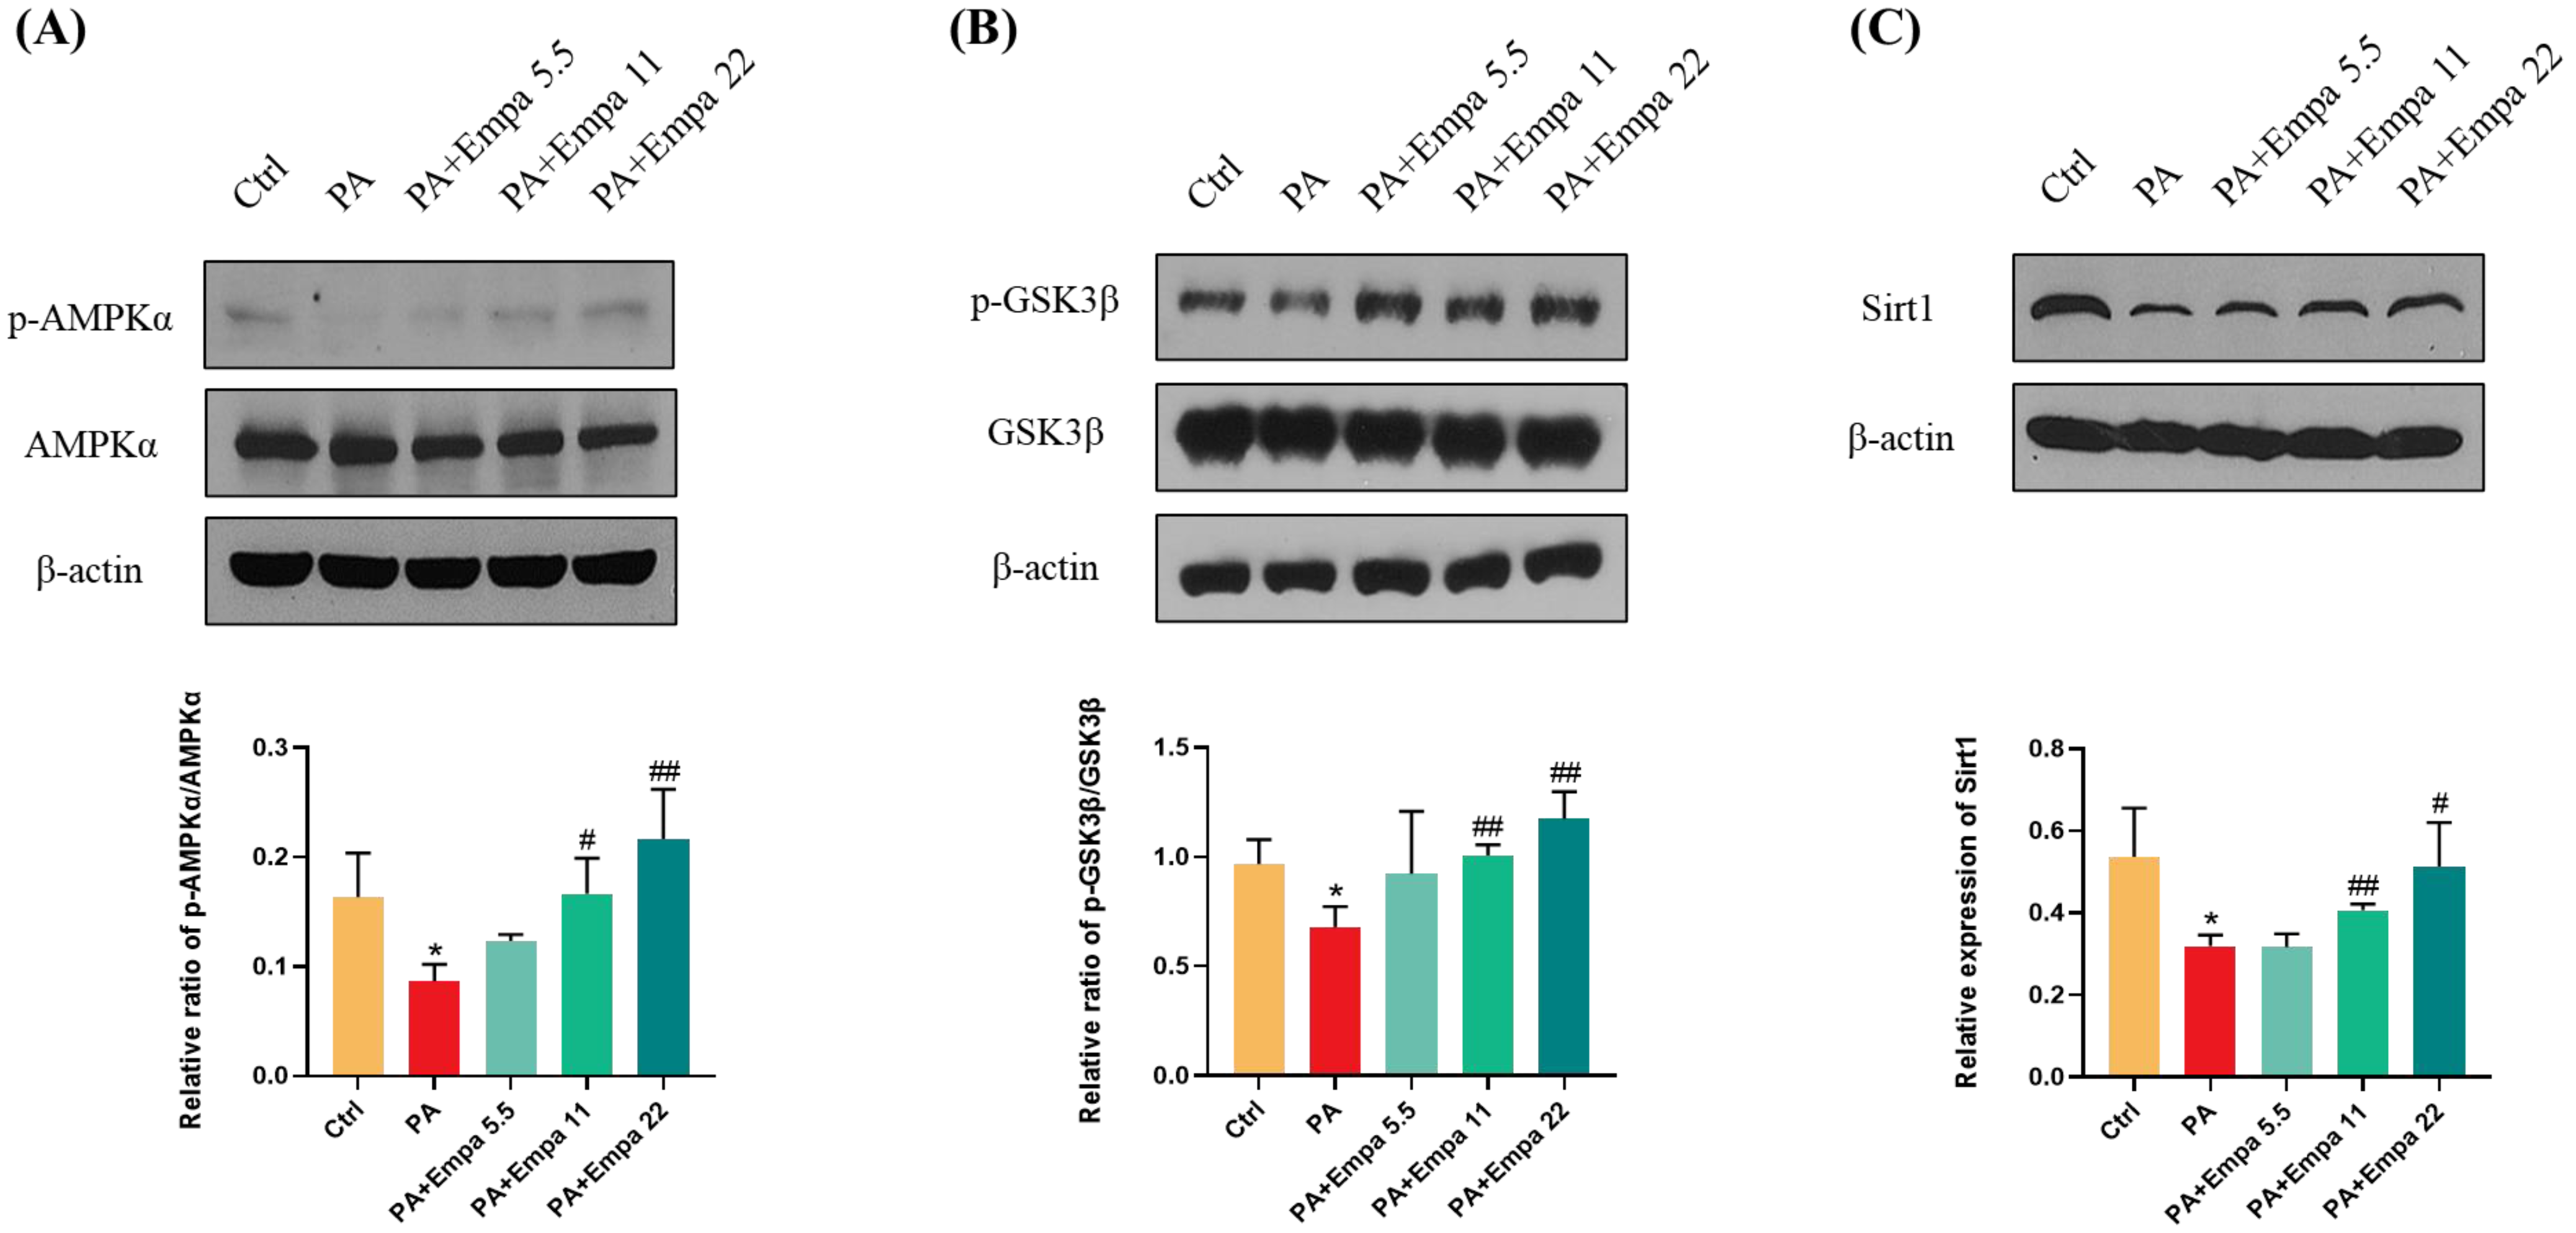
3.5. Empa Activated AMPKα, GSK3β, and Sirt1 in PA-Treated LO2 Cells, Which Might Be Associated with Nrf2 and FoxO3a Signaling Axes-Mediated Antioxidant System
3.6. Empa-Mediated Nrf2/HO-1 and FoxO3a/SOD Signaling Axes Were Dependent on AMPKα Activation
3.7. CAMKK2, but Not LKB1 Or TAK1, Mediated AMPKα Activation by Empa Administration in PA-Treated LO2 Cells
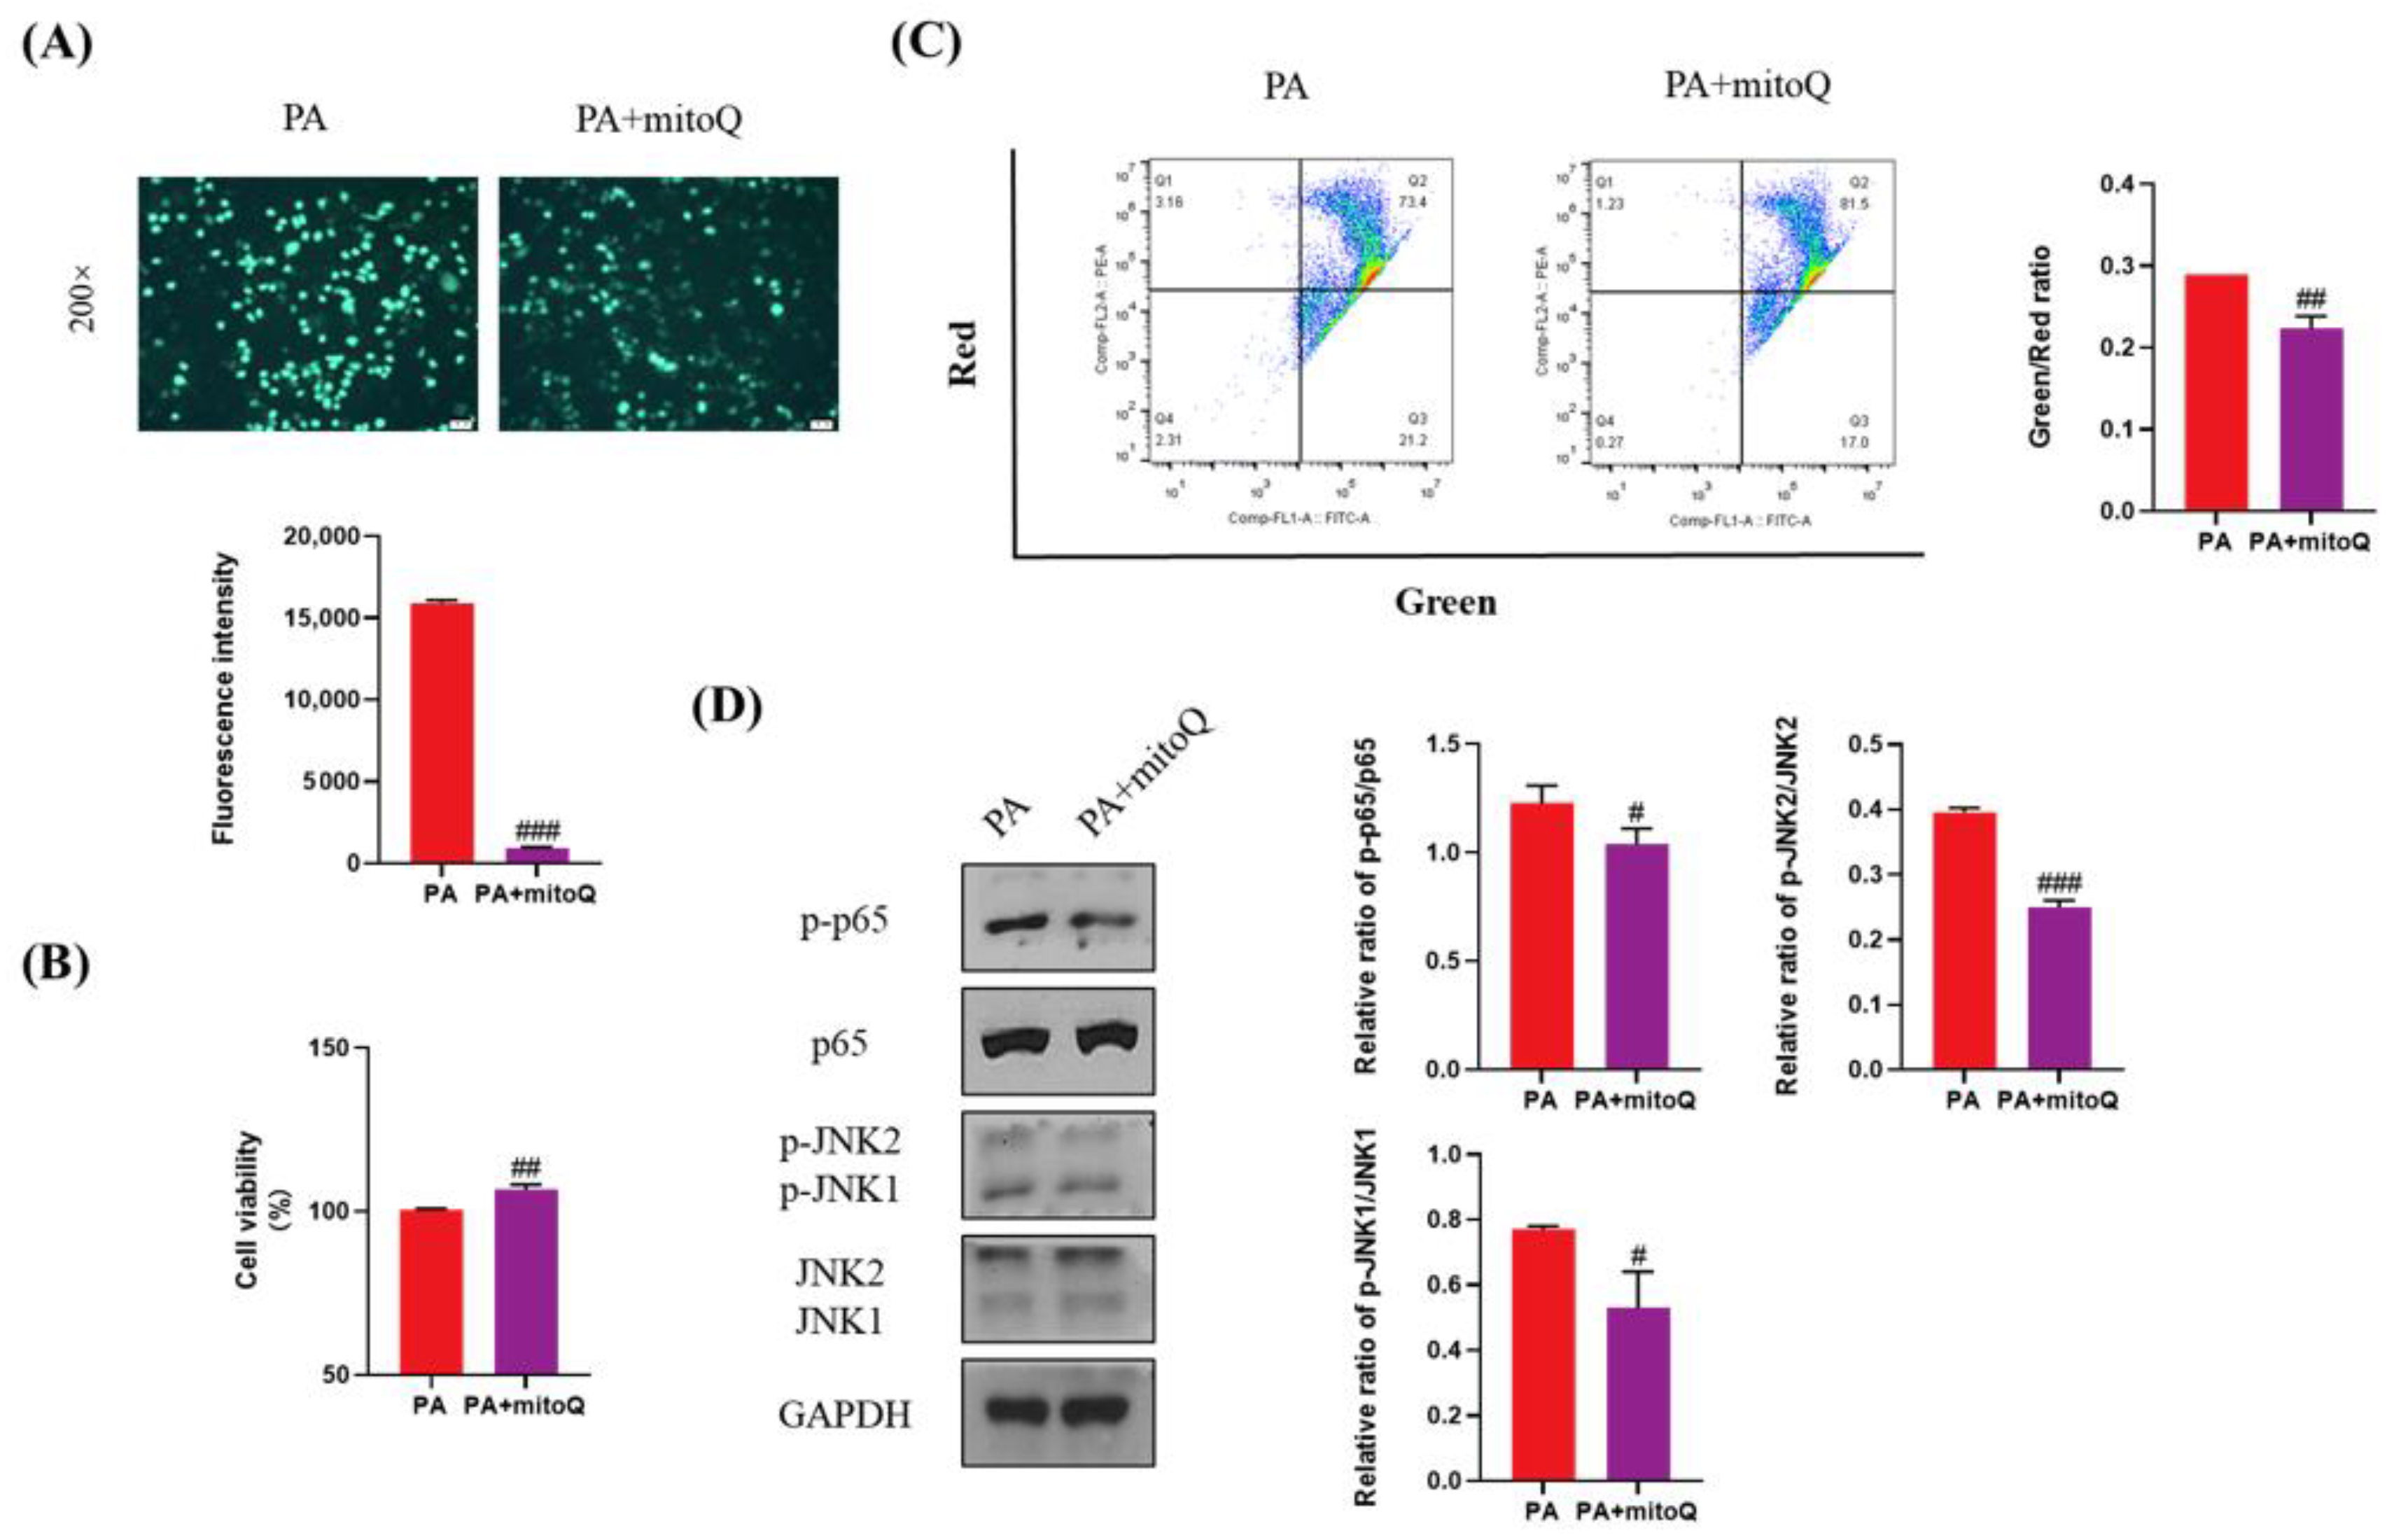
3.8. Protective Effects of ROS Inhibition by mitoQ on PA-Induced Lipotoxicity
4. Discussion
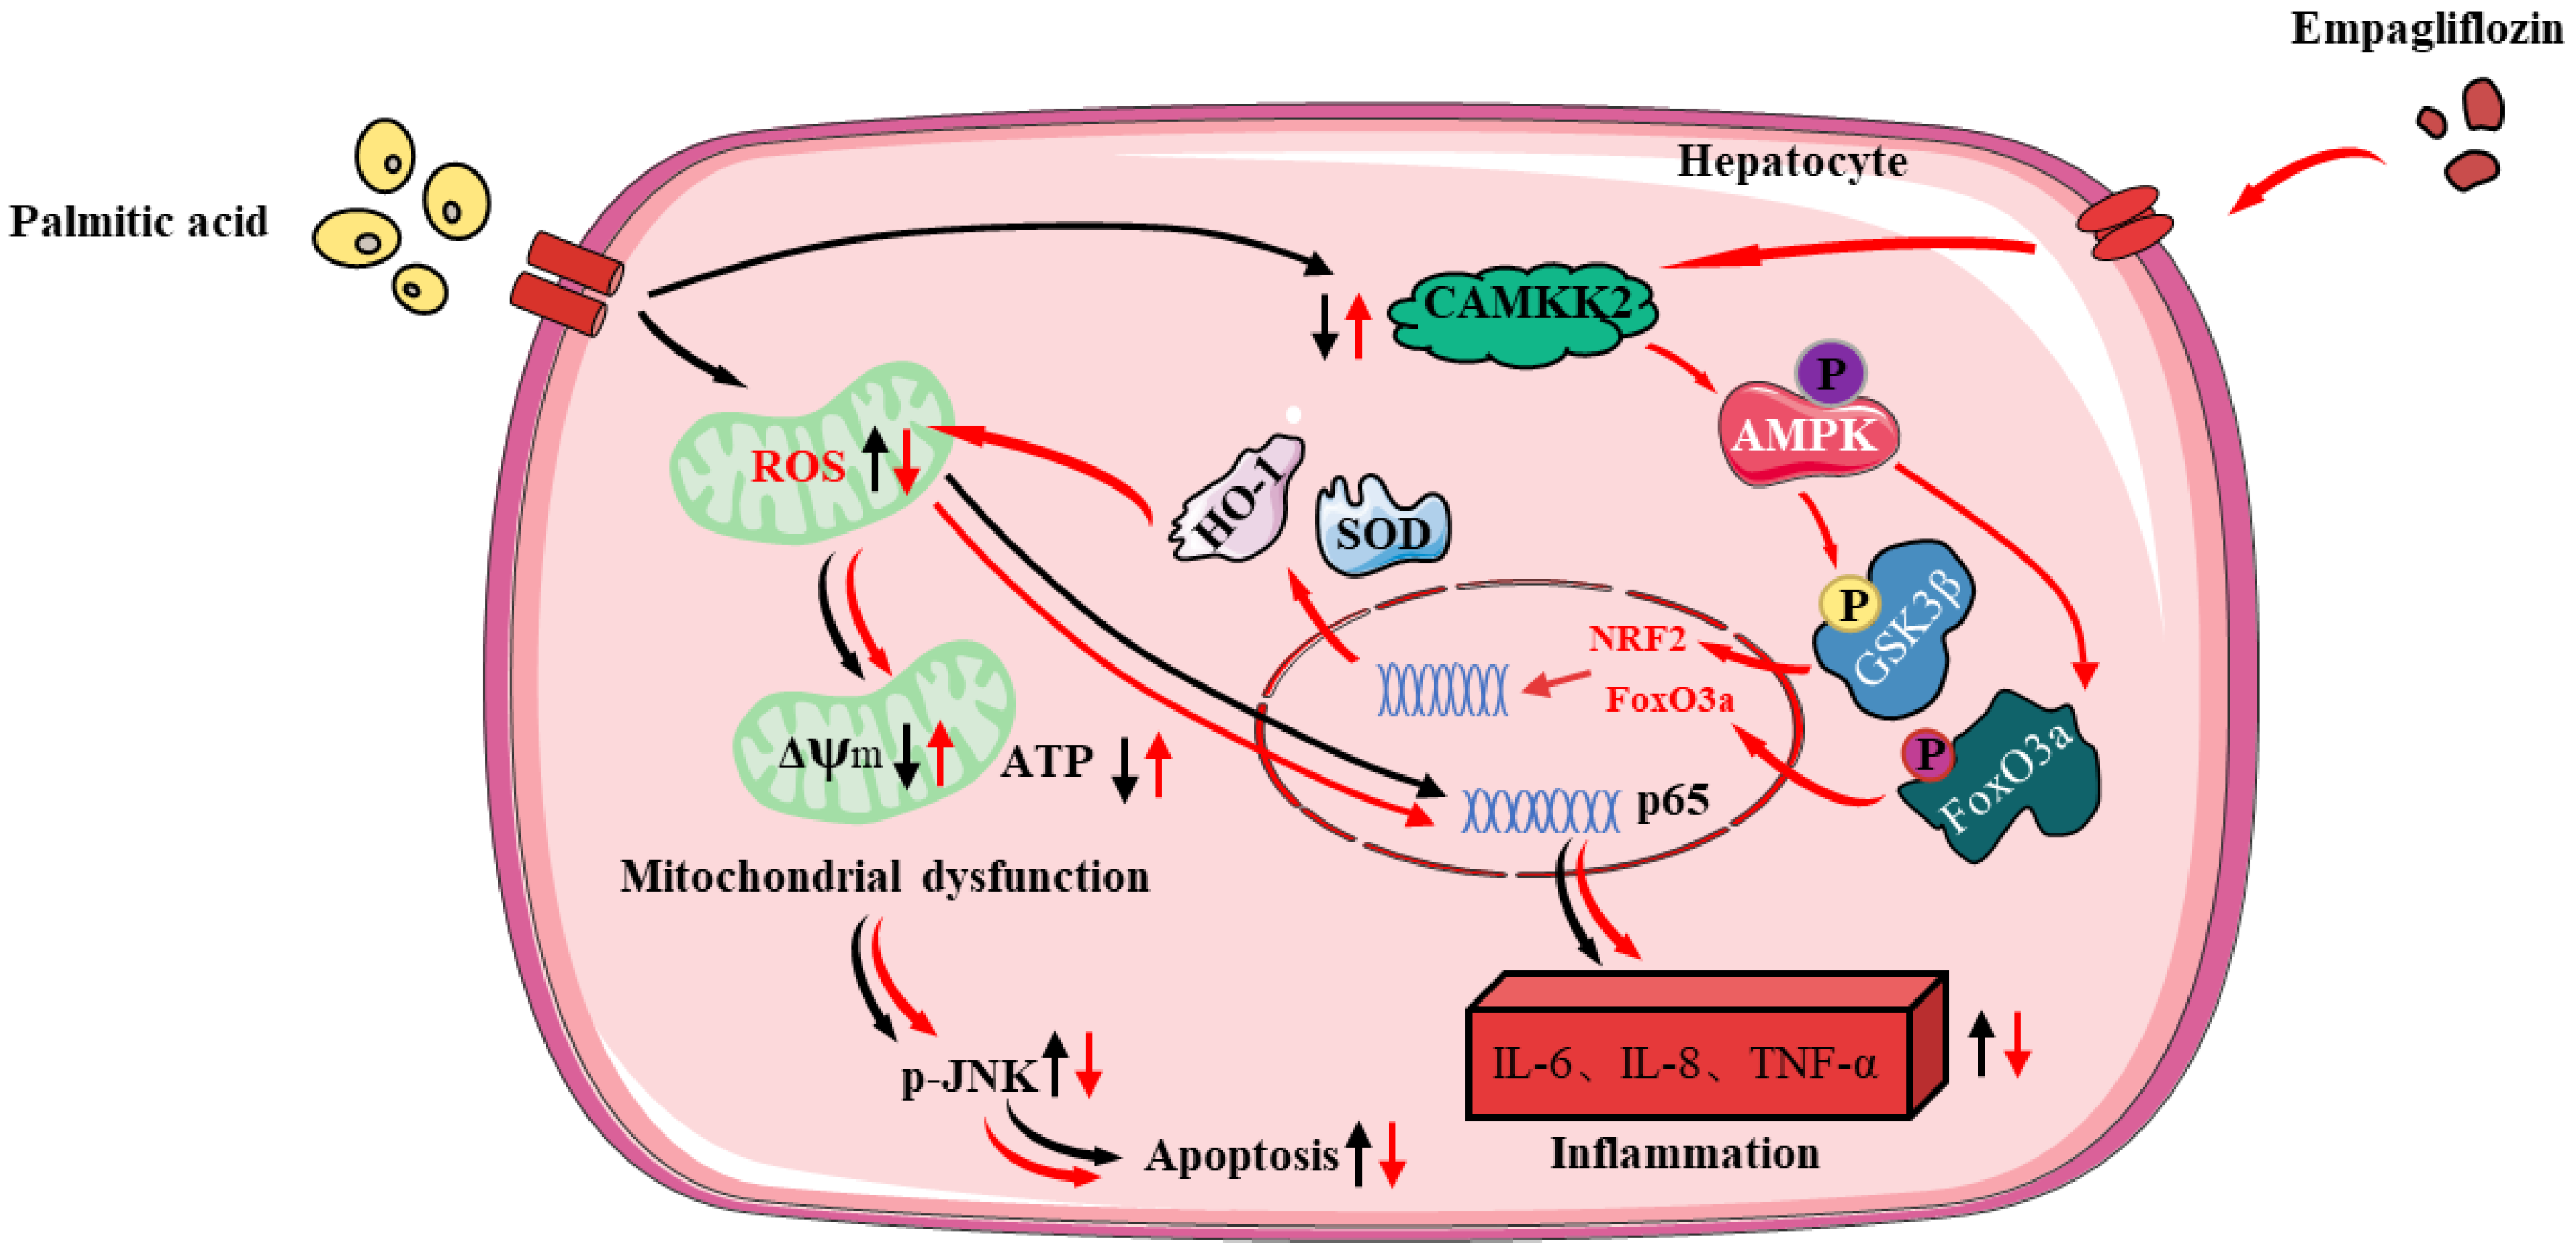
5. Conclusions
Supplementary Materials
Author Contributions
Funding
Institutional Review Board Statement
Informed Consent Statement
Data Availability Statement
Conflicts of Interest
References
- Younossi, Z.M.; Koenig, A.B.; Abdelatif, D.; Fazel, Y.; Henry, L.; Wymer, M. Global Epidemiology of Nonalcoholic Fatty Liver Disease-Meta-Analytic Assessment of Prevalence, Incidence, and Outcomes. Hepatology 2016, 64, 73–84. [Google Scholar] [CrossRef] [PubMed] [Green Version]
- Sheka, A.C.; Adeyi, O.; Thompson, J.; Hameed, B.; Crawford, P.A.; Ikramuddin, S. Nonalcoholic Steatohepatitis: A Review. JAMA-J. Am. Med. Assoc. 2020, 323, 1619. [Google Scholar] [CrossRef] [PubMed]
- Day, C.P.; James, O.F. Steatohepatitis: A tale of two “hits”? Gastroenterology 1998, 114, 842–845. [Google Scholar] [CrossRef]
- Gusdon, A.M.; Song, K.X.; Qu, S. Nonalcoholic Fatty Liver Disease: Pathogenesis and Therapeutics from a Mitochondria-Centric Perspective. Oxidative Med. Cell. Longev. 2014, 2014, 637027. [Google Scholar] [CrossRef] [PubMed] [Green Version]
- Lai, L.L.; Vethakkan, S.R.; Nik Mustapha, N.R.; Mahadeva, S.; Chan, W.K. Empagliflozin for the Treatment of Nonalcoholic Steatohepatitis in Patients with Type 2 Diabetes Mellitus. Dig. Dis. Sci. 2020, 65, 623–631. [Google Scholar] [CrossRef] [PubMed]
- Sattar, N.; Fitchett, D.; Hantel, S.; George, J.T.; Zinman, B. Empagliflozin is associated with improvements in liver enzymes potentially consistent with reductions in liver fat: Results from randomised trials including the EMPA-REG OUTCOMEA (R) trial. Diabetologia 2018, 61, 2155–2163. [Google Scholar] [CrossRef] [Green Version]
- Li, T.; Fang, T.; Xu, L.; Liu, X.; Li, X.; Xue, M.; Yu, X.; Sun, B.; Chen, L. Empagliflozin Alleviates Hepatic Steatosis by Activating the AMPK-TET2-Autophagy Pathway in vivo and in vitro. Front. Pharmacol. 2021, 11, 13. [Google Scholar] [CrossRef]
- Nasiri-Ansari, N.; Nikolopoulou, C.; Papoutsi, K.; Kyrou, I.; Mantzoros, C.S.; Kyriakopoulos, G.; Chatzigeorgiou, A.; Kalotychou, V.; Randeva, M.S.; Chatha, K.; et al. Empagliflozin Attenuates Non-Alcoholic Fatty Liver Disease (NAFLD) in High Fat Diet Fed ApoE((-/-)) Mice by Activating Autophagy and Reducing ER Stress and Apoptosis. Int. J. Mol. Sci. 2021, 22, 818. [Google Scholar] [CrossRef]
- Li, L.; Li, Q.; Huang, W.; Han, Y.; Tan, H.; An, M.; Xiang, Q.; Zhou, R.; Yang, L.; Cheng, Y. Dapagliflozin Alleviates Hepatic Steatosis by Restoring Autophagy via the AMPK-mTOR Pathway. Front. Pharmacol. 2021, 12, 10. [Google Scholar] [CrossRef]
- Garcia, D.; Hellberg, K.; Chaix, A.; Wallace, M.; Herzig, S.; Badur, M.G.; Lin, T.; Shokhirev, M.N.; Pinto, A.F.; Ross, D.S.; et al. Genetic Liver-Specific AMPK Activation Protects against Diet-Induced Obesity and NAFLD. Cell Rep. 2019, 26, 192–208. [Google Scholar] [CrossRef] [Green Version]
- Lavine, J.E.; Schwimmer, J.B.; Molleston, J.P.; Scheimann, A.O.; Murray, K.F.; Abrams, S.H.; Rosenthal, P.; Sanyal, A.J.; Robuck, P.R.; Brunt, E.M.; et al. Treatment of nonalcoholic fatty liver disease in children: TONIC trial design. Contemp. Clin. Trials 2010, 31, 62–70. [Google Scholar] [CrossRef] [PubMed] [Green Version]
- Sun, P.; Wang, Y.; Ding, Y.; Luo, J.; Zhong, J.; Xu, N.; Zhang, Y.; Xie, W. Canagliflozin attenuates lipotoxicity in cardiomyocytes and protects diabetic mouse hearts by inhibiting the mTOR/HIF-1 alpha pathway. Iscience 2021, 24, 21. [Google Scholar] [CrossRef] [PubMed]
- Alnahdi, A.; John, A.; Raza, H. Augmentation of Glucotoxicity, Oxidative Stress, Apoptosis and Mitochondrial Dysfunction in HepG2 Cells by Palmitic Acid. Nutrients 2019, 11, 979. [Google Scholar] [CrossRef] [PubMed] [Green Version]
- Park, E.J.; Lee, A.Y.; Park, S.; Kim, J.H.; Cho, M.H. Multiple pathways are involved in palmitic acid-induced toxicity. Food Chem. Toxicol. 2014, 67, 26–34. [Google Scholar] [CrossRef]
- He, Y.; Zhou, L.; Fan, Z.; Liu, S.; Fang, W. Palmitic acid, but not high-glucose, induced myocardial apoptosis is alleviated by N-acetylcysteine due to attenuated mitochondrial-derived ROS accumulation-induced endoplasmic reticulum stress. Cell Death Dis. 2018, 9, 15. [Google Scholar] [CrossRef]
- Joshi-Barve, S.; Barve, S.S.; Amancherla, K.; Gobejishvili, L.; Hill, D.; Cave, M.; Hote, P.; McClain, C.J. Palmitic acid induces production of proinflammatory cytokine interleukin-8 from hepatocytes. Hepatology 2007, 46, 823–830. [Google Scholar] [CrossRef] [PubMed]
- Win, S.; Than, T.A.; Le, B.H.A.; García-Ruiz, C.; Fernandez-Checa, J.C.; Kaplowitz, N. Sab (Sh3bp5) dependence of JNK mediated inhibition of mitochondrial respiration in palmitic acid induced hepatocyte lipotoxicity. J. Hepatol. 2015, 62, 1367–1374. [Google Scholar] [CrossRef] [Green Version]
- Hu, Q.; Ren, J.; Li, G.; Wu, J.; Wu, X.; Wang, G.; Gu, G.; Ren, H.; Hong, Z.; Li, J. The mitochondrially targeted antioxidant MitoQ protects the intestinal barrier by ameliorating mitochondrial DNA damage via the Nrf2/ARE signaling pathway. Cell Death Dis. 2018, 9, 403. [Google Scholar] [CrossRef]
- Uddin, M.J.; Kim, E.H.; Hannan, M.; Ha, H. Pharmacotherapy against Oxidative Stress in Chronic Kidney Disease: Promising Small Molecule Natural Products Targeting Nrf2-HO-1 Signaling. Antioxidants 2021, 10, 258. [Google Scholar] [CrossRef]
- Li, X.N.; Song, J.; Zhang, L.; LeMaire, S.A.; Hou, X.; Zhang, C.; Coselli, J.S.; Chen, L.; Wang, X.L.; Zhang, Y.; et al. Activation of the AMPK-FOXO3 Pathway Reduces Fatty Acid-Induced Increase in Intracellular Reactive Oxygen Species by Upregulating Thioredoxin. Diabetes 2009, 58, 2246–2257. [Google Scholar] [CrossRef] [Green Version]
- Klotz, L.O.; Sánchez-Ramos, C.; Prieto-Arroyo, I.; Urbánek, P.; Steinbrenner, H.; Monsalve, M. Redox regulation of FoxO transcription factors. Redox Biol. 2015, 6, 51–72. [Google Scholar] [CrossRef] [PubMed] [Green Version]
- Lv, H.; Liu, Q.; Wen, Z.; Feng, H.; Deng, X.; Ci, X. Xanthohumol ameliorates lipopolysaccharide (LPS)-induced acute lung injury via induction of AMPK/GSK3 beta-Nrf2 signal axis. Redox Biol. 2017, 12, 311–324. [Google Scholar] [CrossRef] [PubMed]
- Sun, X.; Han, F.; Lu, Q.; Li, X.; Ren, D.; Zhang, J.; Han, Y.; Xiang, Y.K.; Li, J. Empagliflozin Ameliorates Obesity-Related Cardiac Dysfunction by Regulating Sestrin2-Mediated AMPK-mTOR Signaling and Redox Homeostasis in High-Fat Diet-Induced Obese Mice. Diabetes 2020, 69, 1292–1305. [Google Scholar] [CrossRef] [PubMed]
- Hawley, S.A.; Ford, R.J.; Smith, B.K.; Gowans, G.J.; Mancini, S.J.; Pitt, R.D.; Day, E.A.; Salt, I.P.; Steinberg, G.R.; Hardie, D.G. The Na+/Glucose Cotransporter Inhibitor Canagliflozin Activates AMPK by Inhibiting Mitochondrial Function and Increasing Cellular AMP Levels. Diabetes 2016, 65, 2784–2794. [Google Scholar] [CrossRef] [Green Version]
- Luo, J.; Sun, P.; Wang, Y.; Chen, Y.; Niu, Y.; Ding, Y.; Xu, N.; Zhang, Y.; Xie, W. Dapagliflozin attenuates steatosis in livers of high-fat diet-induced mice and oleic acid-treated L02 cells via regulating AMPK/mTOR pathway. Eur. J. Pharmacol. 2021, 907, 174304. [Google Scholar] [CrossRef]
- Xu, C.; Wang, W.; Zhong, J.; Lei, F.; Xu, N.; Zhang, Y.; Xie, W. Canagliflozin exerts anti-inflammatory effects by inhibiting intracellular glucose metabolism and promoting autophagy in immune cells. Biochem. Pharmacol. 2018, 152, 45–59. [Google Scholar] [CrossRef]
- Peverill, W.; Powell, L.W.; Skoien, R. Evolving Concepts in the Pathogenesis of NASH: Beyond Steatosis and Inflammation. Int. J. Mol. Sci. 2014, 15, 8591–8638. [Google Scholar] [CrossRef]
- Marra, F.; Svegliati-Baroni, G. Lipotoxicity and the gut-liver axis in NASH pathogenesis. J. Hepatol. 2018, 68, 280–295. [Google Scholar] [CrossRef]
- Li, S.; Qian, Q.; Ying, N.; Lai, J.; Feng, L.; Zheng, S.; Jiang, F.; Song, Q.; Chai, H.; Dou, X. Activation of the AMPK-SIRT1 pathway contributes to protective effects of Salvianolic acid A against lipotoxicity in hepatocytes and NAFLD in mice. Front. Pharmacol. 2020, 11, 15. [Google Scholar] [CrossRef]
- Hsu, J.-Y.; Lin, H.-H.; Chyau, C.-C.; Wang, Z.-H.; Chen, J.H. Aqueous Extract of Pepino Leaves Ameliorates Palmitic Acid-Induced Hepatocellular Lipotoxicity via Inhibition of Endoplasmic Reticulum Stress and Apoptosis. Antioxidants 2021, 10, 903. [Google Scholar] [CrossRef]
- Petito-da-Silva, T.I.; Souza-Mello, V.; Barbosa-da-Silva, S. Empaglifozin mitigates NAFLD in high-fat-fed mice by alleviating insulin resistance, lipogenesis and ER stress. Mol. Cell. Endocrinol. 2019, 498, 14. [Google Scholar] [CrossRef] [PubMed]
- Tumova, J.; Andel, M.; Trnka, J. Excess of Free Fatty Acids as a Cause of Metabolic Dysfunction in Skeletal Muscle. Physiol. Res. 2016, 65, 193–207. [Google Scholar] [CrossRef] [PubMed]
- Palomer, X.; Pizarro-Delgado, J.; Barroso, E.; Vázquez-Carrera, M. Palmitic and Oleic Acid: The Yin and Yang of Fatty Acids in Type 2 Diabetes Mellitus. Trends Endocrinol. Metab. 2018, 29, 178–190. [Google Scholar] [CrossRef] [PubMed]
- Park, J.S.; Lee, D.H.; Lee, Y.S.; Oh, E.; Bae, K.H.; Oh, K.J.; Kim, H.; Bae, S.H. Dual roles of ULK1 (unc-51 like autophagy activating kinase 1) in cytoprotection against lipotoxicity. Autophagy 2020, 16, 86–105. [Google Scholar] [CrossRef] [PubMed]
- Uthman, L.; Homayr, A.; Juni, R.P.; Spin, E.L.; Kerindongo, R.; Boomsma, M.; Hollmann, M.W.; Preckel, B.; Koolwijk, P.; van Hinsbergh, V.W.; et al. Empagliflozin and Dapagliflozin Reduce ROS Generation and Restore NO Bioavailability in Tumor Necrosis Factor alpha-Stimulated Human Coronary Arterial Endothelial Cells. Cell. Physiol. Biochem. Int. J. Exp. Cell. Physiol. Biochem. Pharmacol. 2019, 53, 865–886. [Google Scholar]
- Juni, R.P.; Kuster, D.W.; Goebel, M.; Helmes, M.; Musters, R.J.; van der Velden, J.; Koolwijk, P.; Paulus, W.J.; van Hinsbergh, V.W. Cardiac Microvascular Endothelial Enhancement of Cardiomyocyte Function Is Impaired by Inflammation and Restored by Empagliflozin. JACC Basic Transl. Sci. 2019, 4, 575–591. [Google Scholar] [CrossRef]
- Willems, P.H.; Rossignol, R.; Dieteren, C.E.; Murphy, M.P.; Koopman, W.J.H. Redox Homeostasis and Mitochondrial Dynamics. Cell Metab. 2015, 22, 207–218. [Google Scholar] [CrossRef] [Green Version]
- Rizwan, H.; Pal, S.; Sabnam, S.; Pal, A. High glucose augments ROS generation regulates mitochondrial dysfunction and apoptosis via stress signalling cascades in keratinocytes. Life Sci. 2020, 241, 18. [Google Scholar] [CrossRef]
- Lee, W.C.; Chau, Y.Y.; Ng, H.Y.; Chen, C.H.; Wang, P.W.; Liou, C.W.; Lin, T.K.; Chen, J.B. Empagliflozin Protects HK-2 Cells from High Glucose-Mediated Injuries via a Mitochondrial Mechanism. Cells 2019, 8, 1085. [Google Scholar] [CrossRef] [Green Version]
- Shao, Q.; Meng, L.; Lee, S.; Tse, G.; Gong, M.; Zhang, Z.; Zhao, J.; Zhao, Y.; Li, G.; Liu, T. Empagliflozin, a sodium glucose co-transporter-2 inhibitor, alleviates atrial remodeling and improves mitochondrial function in high-fat diet/streptozotocin-induced diabetic rats. Cardiovasc. Diabetol. 2019, 18, 14. [Google Scholar] [CrossRef] [Green Version]
- Zhou, H.; Wang, S.; Zhu, P.; Hu, S.; Chen, Y.; Ren, J. Empagliflozin rescues diabetic myocardial microvascular injury via AMPK-mediated inhibition of mitochondrial fission. Redox Biol. 2018, 15, 335–346. [Google Scholar] [CrossRef] [PubMed]
- Griffin, M.; Rao, V.; Ivey-Miranda, J.; Fleming, J.; Maulion, C.; Moskow, J.; Mahoney, D.; Jeon, S.; Inzucchi, S.E.; Testani, J.M. Empagliflozin in Heart Failure: Diuretic and Cardio-Renal Effects. Circulation 2019, 140, E996–E997. [Google Scholar]
- Palmeira, C.M.; Teodoro, J.S.; Amorim, J.A.; Steegborn, C.; Sinclair, D.A.; Rolo, A.P. Mitohormesis and metabolic health: The interplay between ROS, cAMP and sirtuins. Free Radic. Biol. Med. 2019, 141, 483–491. [Google Scholar] [CrossRef] [PubMed]
- Parlati, L.; Régnier, M.; Guillou, H.; Postic, C. New targets for NAFLD. JHEP Rep. Innov. Hepatol. 2021, 3, 100346. [Google Scholar] [CrossRef] [PubMed]
- Kabil, S.L.; Mahmoud, N.M. Canagliflozin protects against non-alcoholic steatohepatitis in type-2 diabetic rats through zinc alpha-2 glycoprotein up-regulation. Eur. J. Pharmacol. 2018, 828, 135–145. [Google Scholar] [CrossRef] [PubMed]
- Jojima, T.; Tomotsune, T.; Iijima, T.; Akimoto, K.; Suzuki, K.; Aso, Y. Empagliflozin (an SGLT2 inhibitor), alone or in combination with linagliptin (a DPP-4 inhibitor), prevents steatohepatitis in a novel mouse model of non-alcoholic steatohepatitis and diabetes. Diabetol. Metab. Syndr. 2016, 8, 11. [Google Scholar] [CrossRef] [Green Version]
- Niu, Y.; Chen, Y.; Sun, P.; Wang, Y.; Luo, J.; Ding, Y.; Xie, W. Intragastric and atomized administration of canagliflozin inhibit inflammatory cytokine storm in lipopolysaccharide-treated sepsis in mice: A potential COVID-19 treatment. Int. Immunopharmacol. 2021, 96, 9. [Google Scholar] [CrossRef]
- Wang, K. Molecular mechanisms of hepatic apoptosis. Cell Death Dis. 2014, 5, e996. [Google Scholar] [CrossRef]
- Lin, A.; Dibling, B. The true face of JNK activation in apoptosis. Aging Cell 2002, 1, 112–116. [Google Scholar] [CrossRef]
- Feng, X.; Yu, W.; Li, X.; Zhou, F.; Zhang, W.; Shen, Q.; Li, J.; Zhang, C.; Shen, P. Apigenin, a modulator of PPAR gamma, attenuates HFD-induced NAFLD by regulating hepatocyte lipid metabolism and oxidative stress via Nrf2 activation. Biochem. Pharmacol. 2017, 136, 136–149. [Google Scholar] [CrossRef]
- Upadhyay, K.K.; Jadeja, R.N.; Vyas, H.S.; Pandya, B.; Joshi, A.; Vohra, A.; Thounaojam, M.C.; Martin, P.M.; Bartoli, M.; Devkar, R.V. Carbon monoxide releasing molecule-A1 improves nonalcoholic steatohepatitis via Nrf2 activation mediated improvement in oxidative stress and mitochondrial function. Redox Biol. 2020, 28, 12. [Google Scholar] [CrossRef] [PubMed]
- Joo, M.S.; Kim, W.D.; Lee, K.Y.; Kim, J.H.; Koo, J.H.; Kim, S.G. AMPK Facilitates Nuclear Accumulation of Nrf2 by Phosphorylating at Serine 550. Mol. Cell. Biol. 2016, 36, 1931–1942. [Google Scholar] [CrossRef] [PubMed] [Green Version]
- Lv, H.; Hong, L.; Tian, Y.; Yin, C.; Zhu, C.; Feng, H. Corilagin alleviates acetaminophen-induced hepatotoxicity via enhancing the AMPK/GSK3-Nrf2 signaling pathway. Cell Commun. Signal. 2019, 17, 15. [Google Scholar] [CrossRef] [PubMed] [Green Version]
- Zeng, Y.Y.; Liang, H.X.; Guo, Y.; Feng, Y.Z.; Yao, Q.Q. Adiponectin regulates osteocytic MLO-Y4 cell apoptosis in a high-glucose environment through the AMPK/FoxO3a signaling pathway. J. Cell. Physiol. 2021, 236, 7088–7096. [Google Scholar] [CrossRef]
- Liu, Y.; Ao, X.; Ding, W.; Ponnusamy, M.; Wu, W.; Hao, X.; Yu, W.; Wang, Y.; Li, P.; Wang, J. Critical role of FOXO3a in carcinogenesis. Mol. Cancer 2018, 17, 12. [Google Scholar] [CrossRef] [Green Version]
- Li, C.G.; Zhang, J.; Xue, M.; Li, X.; Han, F.; Liu, X.; Xu, L.; Lu, Y.; Cheng, Y.; Li, T. SGLT2 inhibition with empagliflozin attenuates myocardial oxidative stress and fibrosis in diabetic mice heart. Cardiovasc. Diabetol. 2019, 18, 13. [Google Scholar] [CrossRef]
- Mansouri, A.; Gattolliat, C.H.; Asselah, T. Mitochondrial Dysfunction and Signaling in Chronic Liver Diseases. Gastroenterology 2018, 155, 629–647. [Google Scholar] [CrossRef] [Green Version]
- Makrecka-Kuka, M.; Korzh, S.; Videja, M.; Vilks, K.; Cirule, H.; Kuka, J.; Dambrova, M.; Liepinsh, E. Empagliflozin Protects Cardiac Mitochondrial Fatty Acid Metabolism in a Mouse Model of Diet-Induced Lipid Overload. Cardiovasc. Drugs Ther. 2020, 34, 791–797. [Google Scholar] [CrossRef]
- Yang, M.; Pi, H.; Li, M.; Xu, S.; Zhang, L.; Xie, J.; Tian, L.; Tu, M.; He, M.; Lu, Y.; et al. From the Cover: Autophagy Induction Contributes to Cadmium Toxicity in Mesenchymal Stem Cells via AMPK/FOXO3a/BECN1 Signaling. Toxicol. Sci. 2016, 154, 101–114. [Google Scholar] [CrossRef] [Green Version]
- Price, N.L.; Gomes, A.P.; Ling, A.J.; Duarte, F.V.; Martin-Montalvo, A.; North, B.J.; Agarwal, B.; Ye, L.; Ramadori, G.; Teodoro, J.S.; et al. SIRT1 Is Required for AMPK Activation and the Beneficial Effects of Resveratrol on Mitochondrial Function. Cell Metab. 2012, 15, 675–690. [Google Scholar] [CrossRef] [Green Version]
- Li, Q.X.; Jia, S.H.; Xu, L.; Li, B.; Chen, N. Metformin-induced autophagy and irisin improves INS-1 cell function and survival in high-glucose environment via AMPK/SIRT1/PGC-1 alpha signal pathway. Food Sci. Nutr. 2019, 7, 1695–1703. [Google Scholar] [CrossRef] [PubMed] [Green Version]
- Gowans, G.J.; Hawley, S.A.; Ross, F.A.; Hardie, D.G. AMP Is a True Physiological Regulator of AMP-Activated Protein Kinase by Both Allosteric Activation and Enhancing Net Phosphorylation. Cell Metab. 2013, 18, 556–566. [Google Scholar] [CrossRef] [PubMed] [Green Version]
- Oakhill, J.S.; Steel, R.; Chen, Z.P.; Scott, J.W.; Ling, N.; Tam, S.; Kemp, B.E. AMPK Is a Direct Adenylate Charge-Regulated Protein Kinase. Science 2011, 332, 1433–1435. [Google Scholar] [CrossRef] [PubMed]
- Anderson, K.A.; Lin, F.; Ribar, T.J.; Stevens, R.D.; Muehlbauer, M.J.; Newgard, C.B.; Means, A.R. Deletion of CaMKK2 from the Liver Lowers Blood Glucose and Improves Whole-Body Glucose Tolerance in the Mouse. Mol. Endocrinol. 2012, 26, 281–291. [Google Scholar] [CrossRef] [Green Version]
- Zhong, Y.; Luo, R.; Liu, Q.; Zhu, J.; Lei, M.; Liang, X.; Wang, X.; Peng, X. Jujuboside A ameliorates high fat diet and streptozotocin induced diabetic nephropathy via suppressing oxidative stress, apoptosis, and enhancing autophagy. Food Chem. Toxicol. 2022, 159, 112697. [Google Scholar] [CrossRef]
- Kan, J.B.; Zhao, C.P.; Lu, S.; Shen, G.Q.; Yang, J.; Tong, P.; Xi, L.; Zhang, R.H.; Liang, X.B.; Su, D.M.; et al. S100A16, a novel lipogenesis promoting factor in livers of mice and hepatocytes in vitro. J. Cell. Physiol. 2019, 234, 21395–21406. [Google Scholar] [CrossRef]

Publisher’s Note: MDPI stays neutral with regard to jurisdictional claims in published maps and institutional affiliations. |
© 2022 by the authors. Licensee MDPI, Basel, Switzerland. This article is an open access article distributed under the terms and conditions of the Creative Commons Attribution (CC BY) license (https://creativecommons.org/licenses/by/4.0/).
Share and Cite
Wang, Y.; Ding, Y.; Sun, P.; Zhang, W.; Xin, Q.; Wang, N.; Niu, Y.; Chen, Y.; Luo, J.; Lu, J.; et al. Empagliflozin-Enhanced Antioxidant Defense Attenuates Lipotoxicity and Protects Hepatocytes by Promoting FoxO3a- and Nrf2-Mediated Nuclear Translocation via the CAMKK2/AMPK Pathway. Antioxidants 2022, 11, 799. https://doi.org/10.3390/antiox11050799
Wang Y, Ding Y, Sun P, Zhang W, Xin Q, Wang N, Niu Y, Chen Y, Luo J, Lu J, et al. Empagliflozin-Enhanced Antioxidant Defense Attenuates Lipotoxicity and Protects Hepatocytes by Promoting FoxO3a- and Nrf2-Mediated Nuclear Translocation via the CAMKK2/AMPK Pathway. Antioxidants. 2022; 11(5):799. https://doi.org/10.3390/antiox11050799
Chicago/Turabian StyleWang, Yangyang, Yipei Ding, Pengbo Sun, Wanqiu Zhang, Qilei Xin, Ningchao Wang, Yaoyun Niu, Yang Chen, Jingyi Luo, Jinghua Lu, and et al. 2022. "Empagliflozin-Enhanced Antioxidant Defense Attenuates Lipotoxicity and Protects Hepatocytes by Promoting FoxO3a- and Nrf2-Mediated Nuclear Translocation via the CAMKK2/AMPK Pathway" Antioxidants 11, no. 5: 799. https://doi.org/10.3390/antiox11050799
APA StyleWang, Y., Ding, Y., Sun, P., Zhang, W., Xin, Q., Wang, N., Niu, Y., Chen, Y., Luo, J., Lu, J., Zhou, J., Xu, N., Zhang, Y., & Xie, W. (2022). Empagliflozin-Enhanced Antioxidant Defense Attenuates Lipotoxicity and Protects Hepatocytes by Promoting FoxO3a- and Nrf2-Mediated Nuclear Translocation via the CAMKK2/AMPK Pathway. Antioxidants, 11(5), 799. https://doi.org/10.3390/antiox11050799