
Evaluation of Hemp Seed Oils Stability under Accelerated Storage Test


 , ,
, ,
Abstract
:1. Introduction
2. Materials and Methods
2.1. Samples and Accelerated Storage
2.2. Peroxide Value
2.3. Determination of Thiobarbituric Acid Reactive Substances (TBARs)
2.4. Determination of Total Phenols
2.5. Fatty Acid Composition
2.6. Volatile Profile
2.7. Tocopherols
2.8. Cannabinoids
2.9. Data Analysis
3. Results
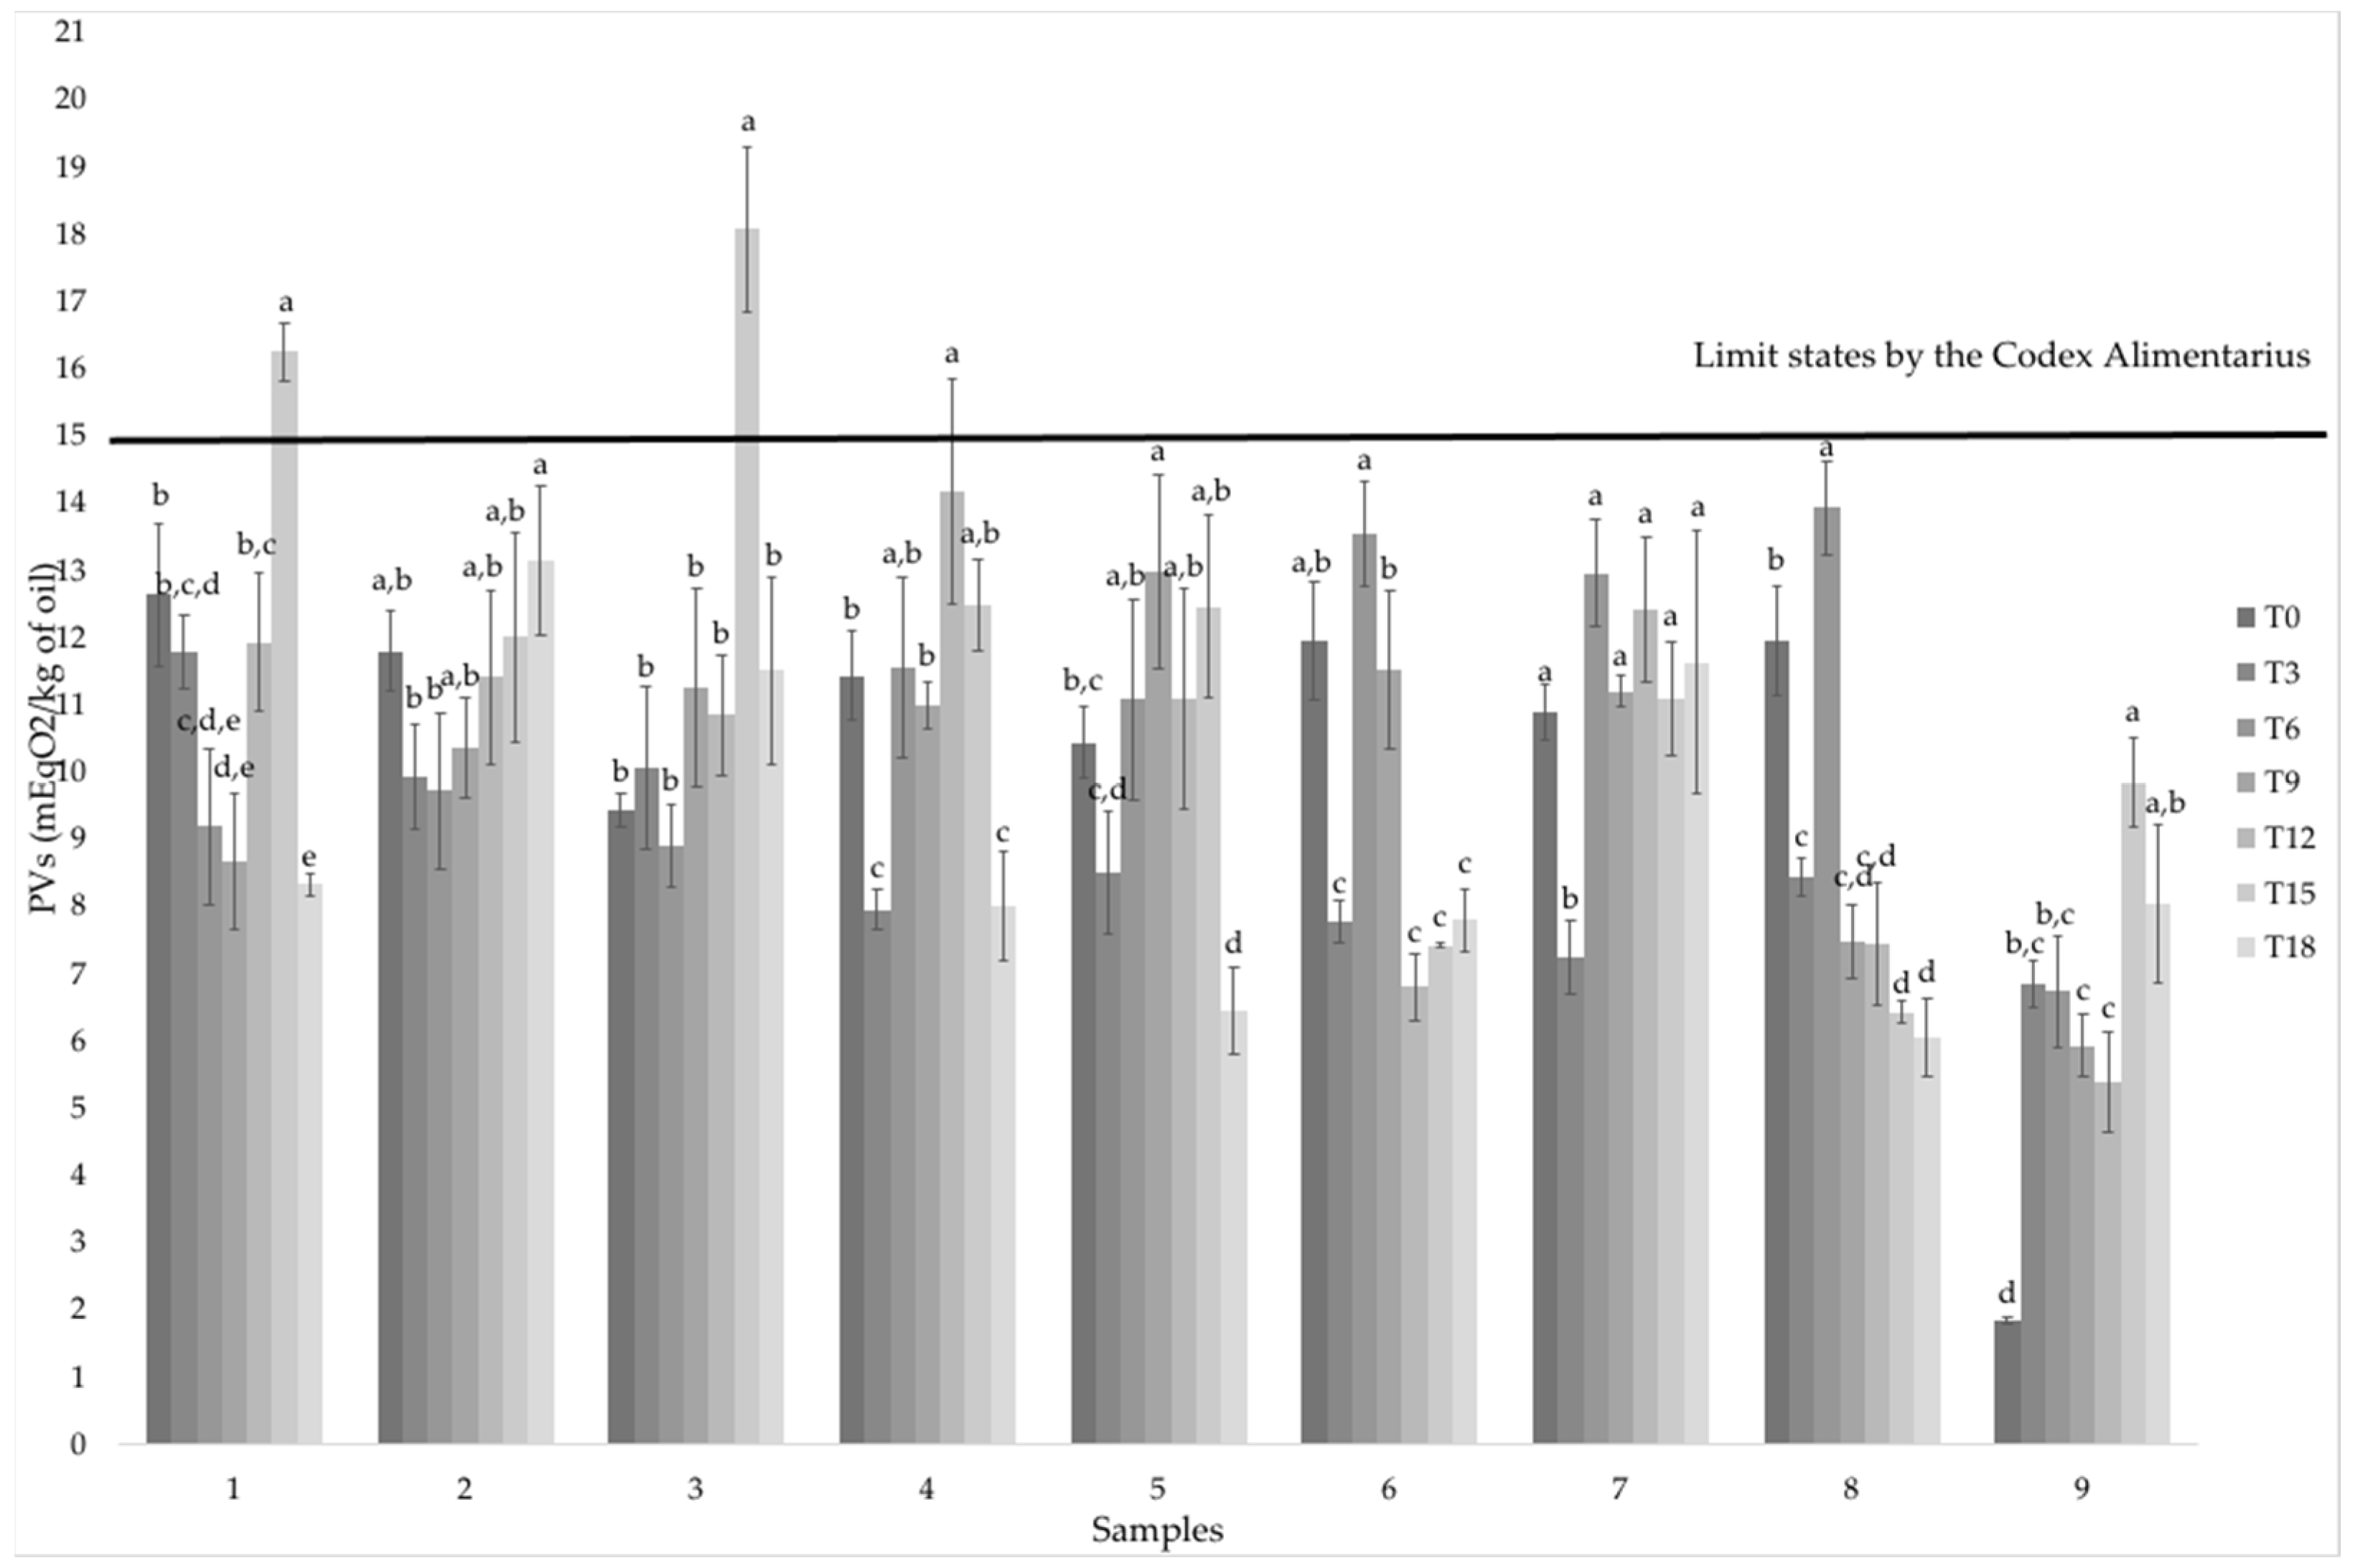
3.1. Peroxide Value
3.2. TBARs
3.3. Total Phenolic Compounds
3.4. Fatty Acids
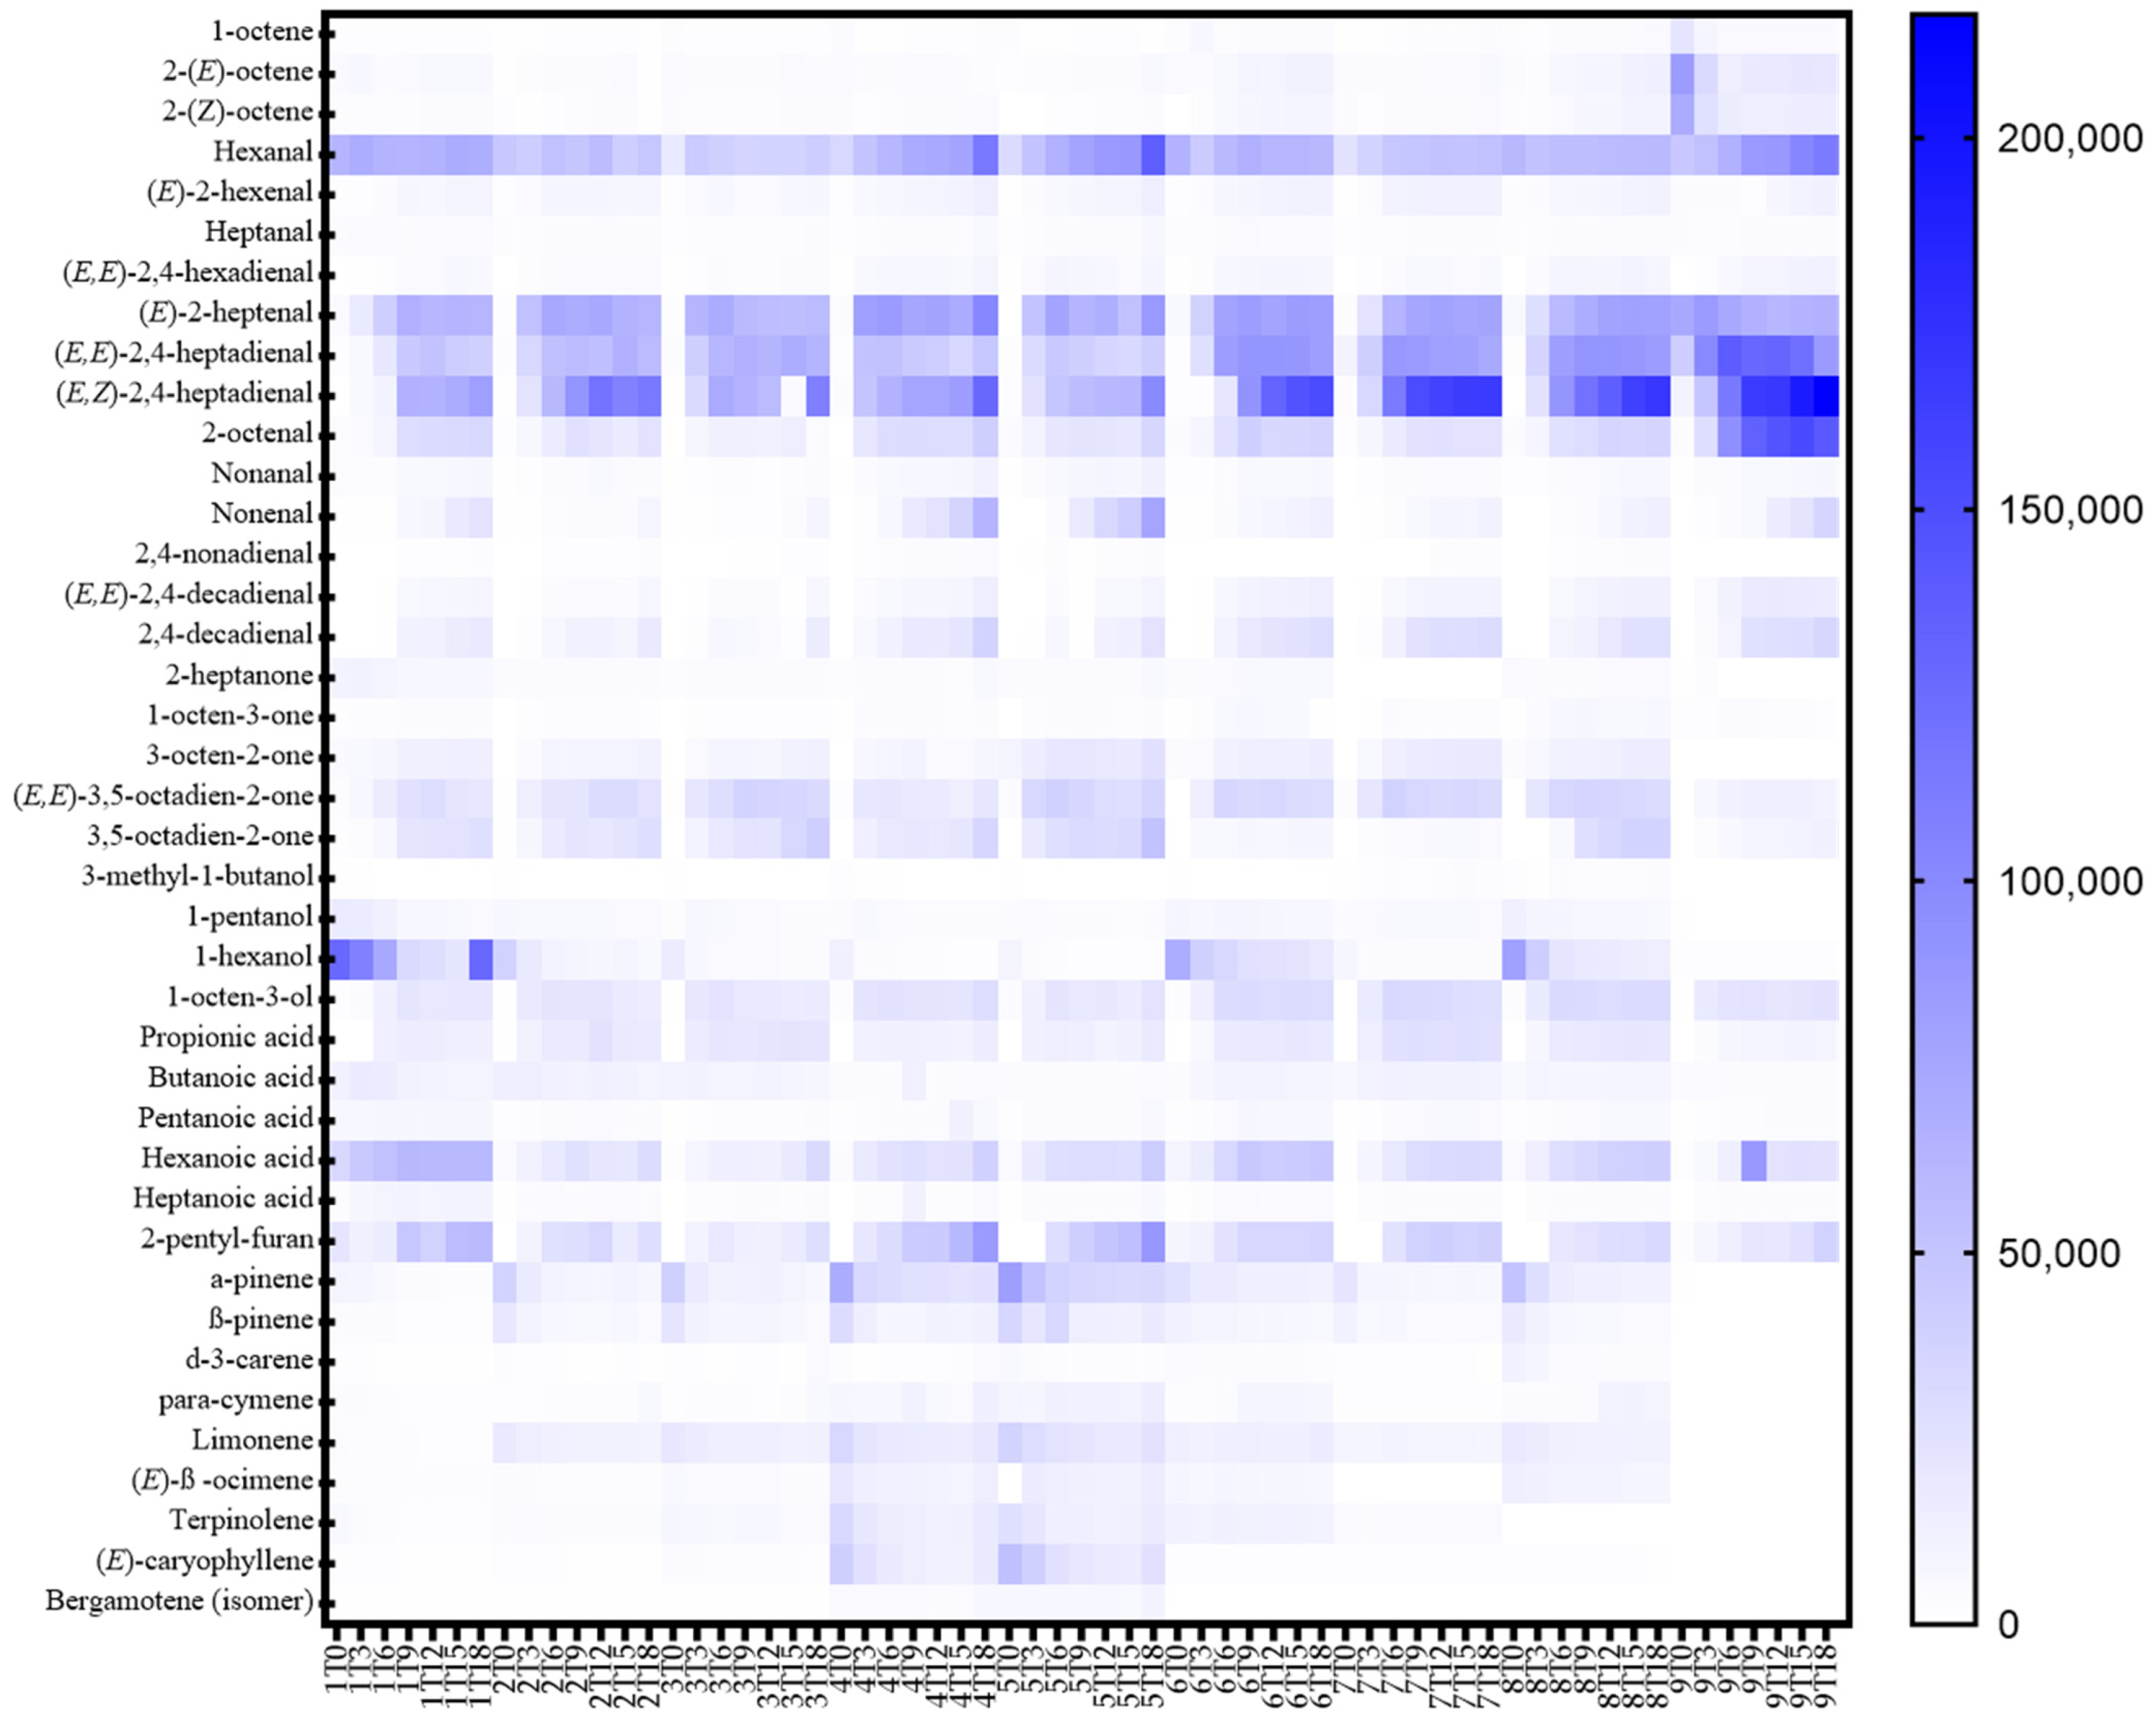
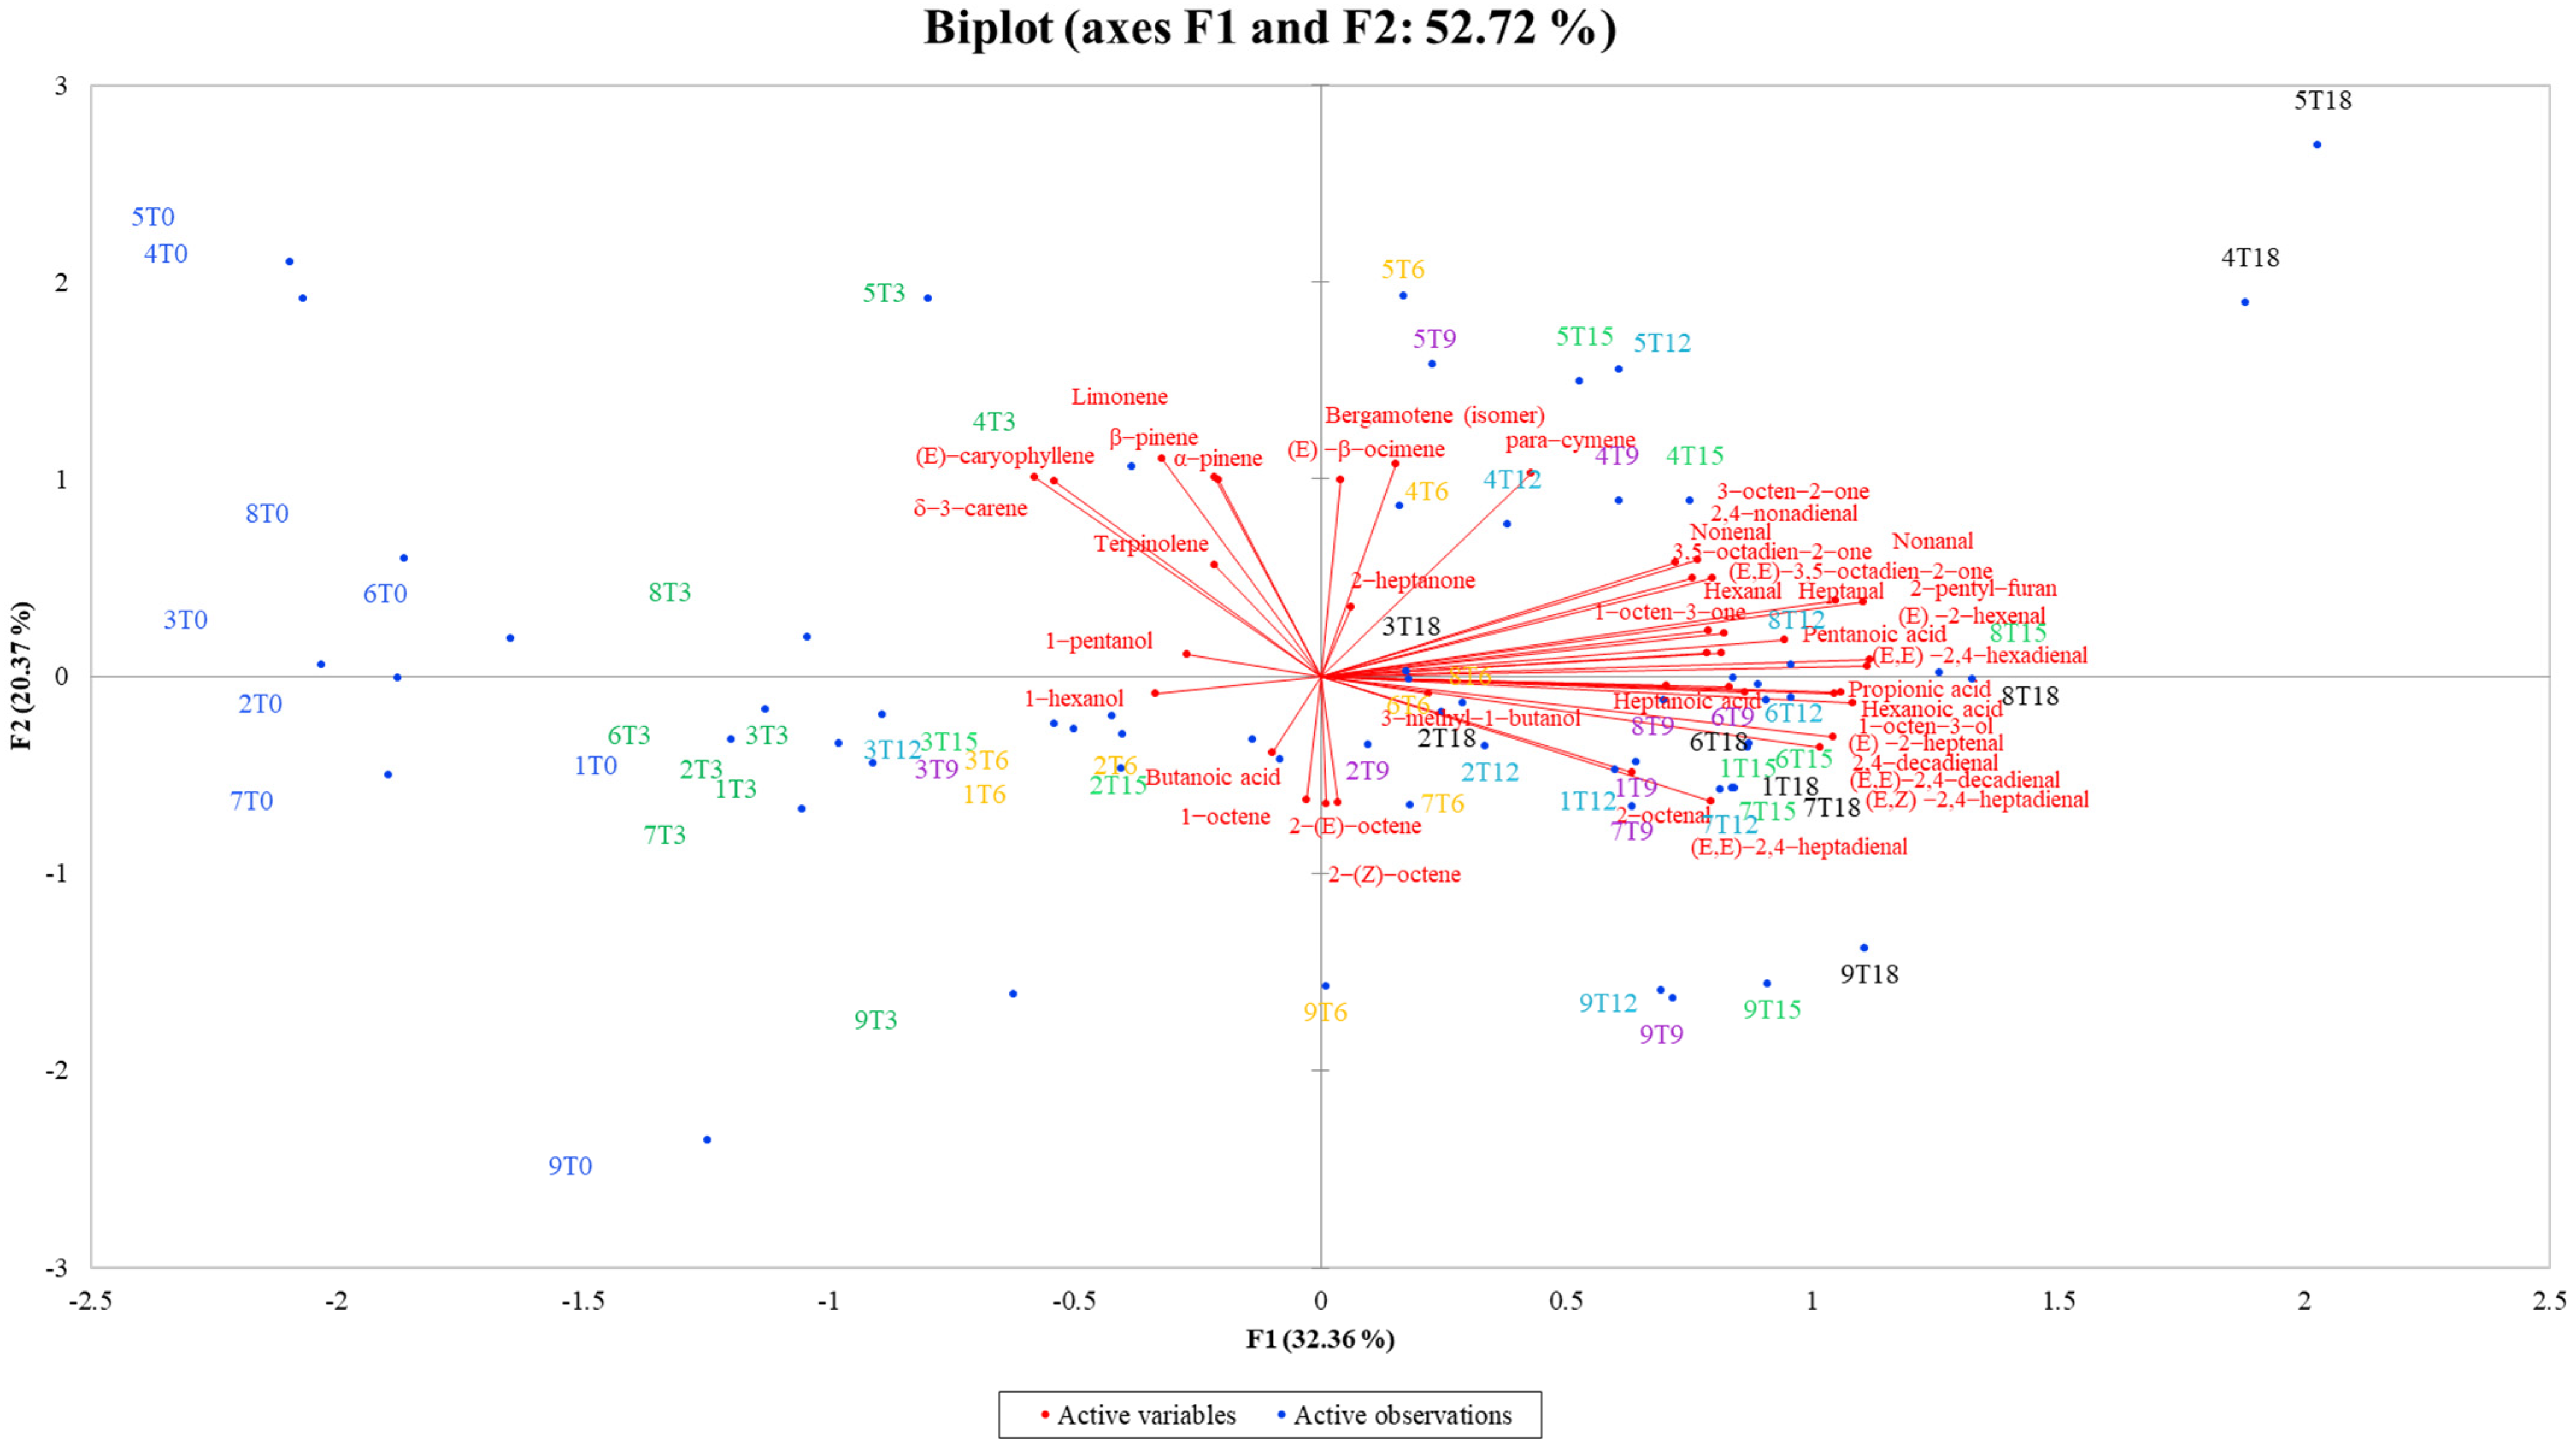
3.5. Volatile Profile
3.6. Tocopherols
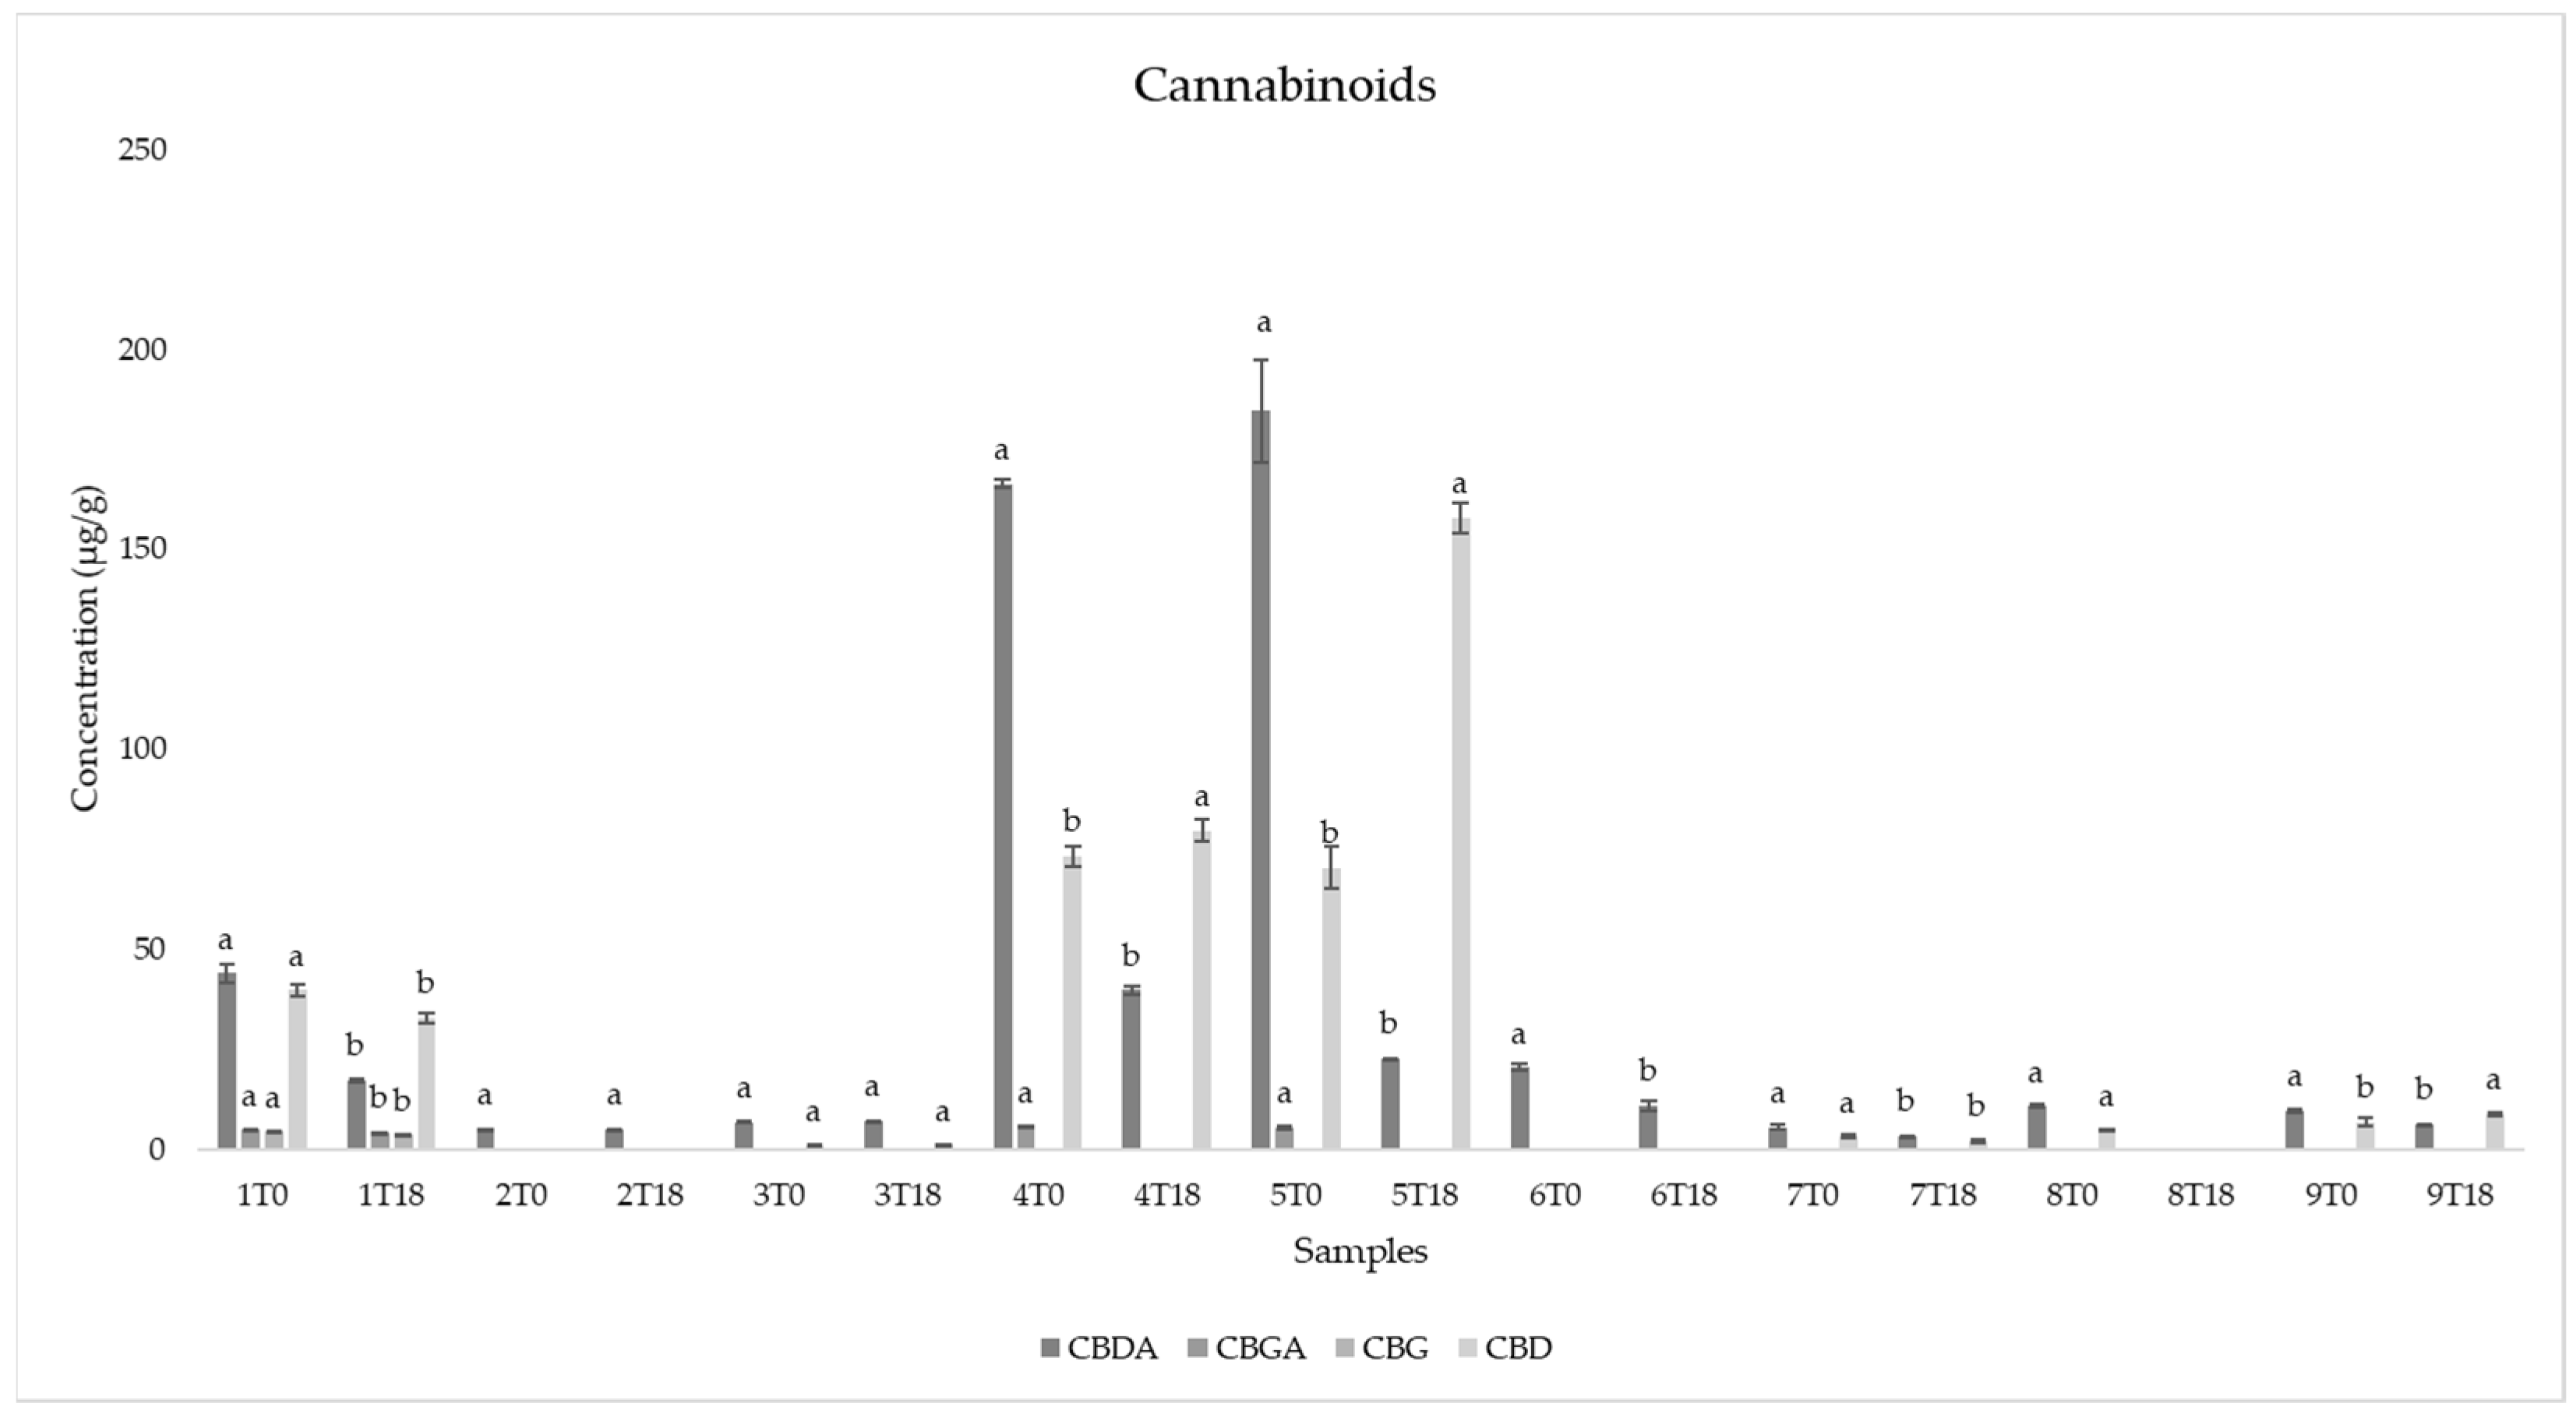
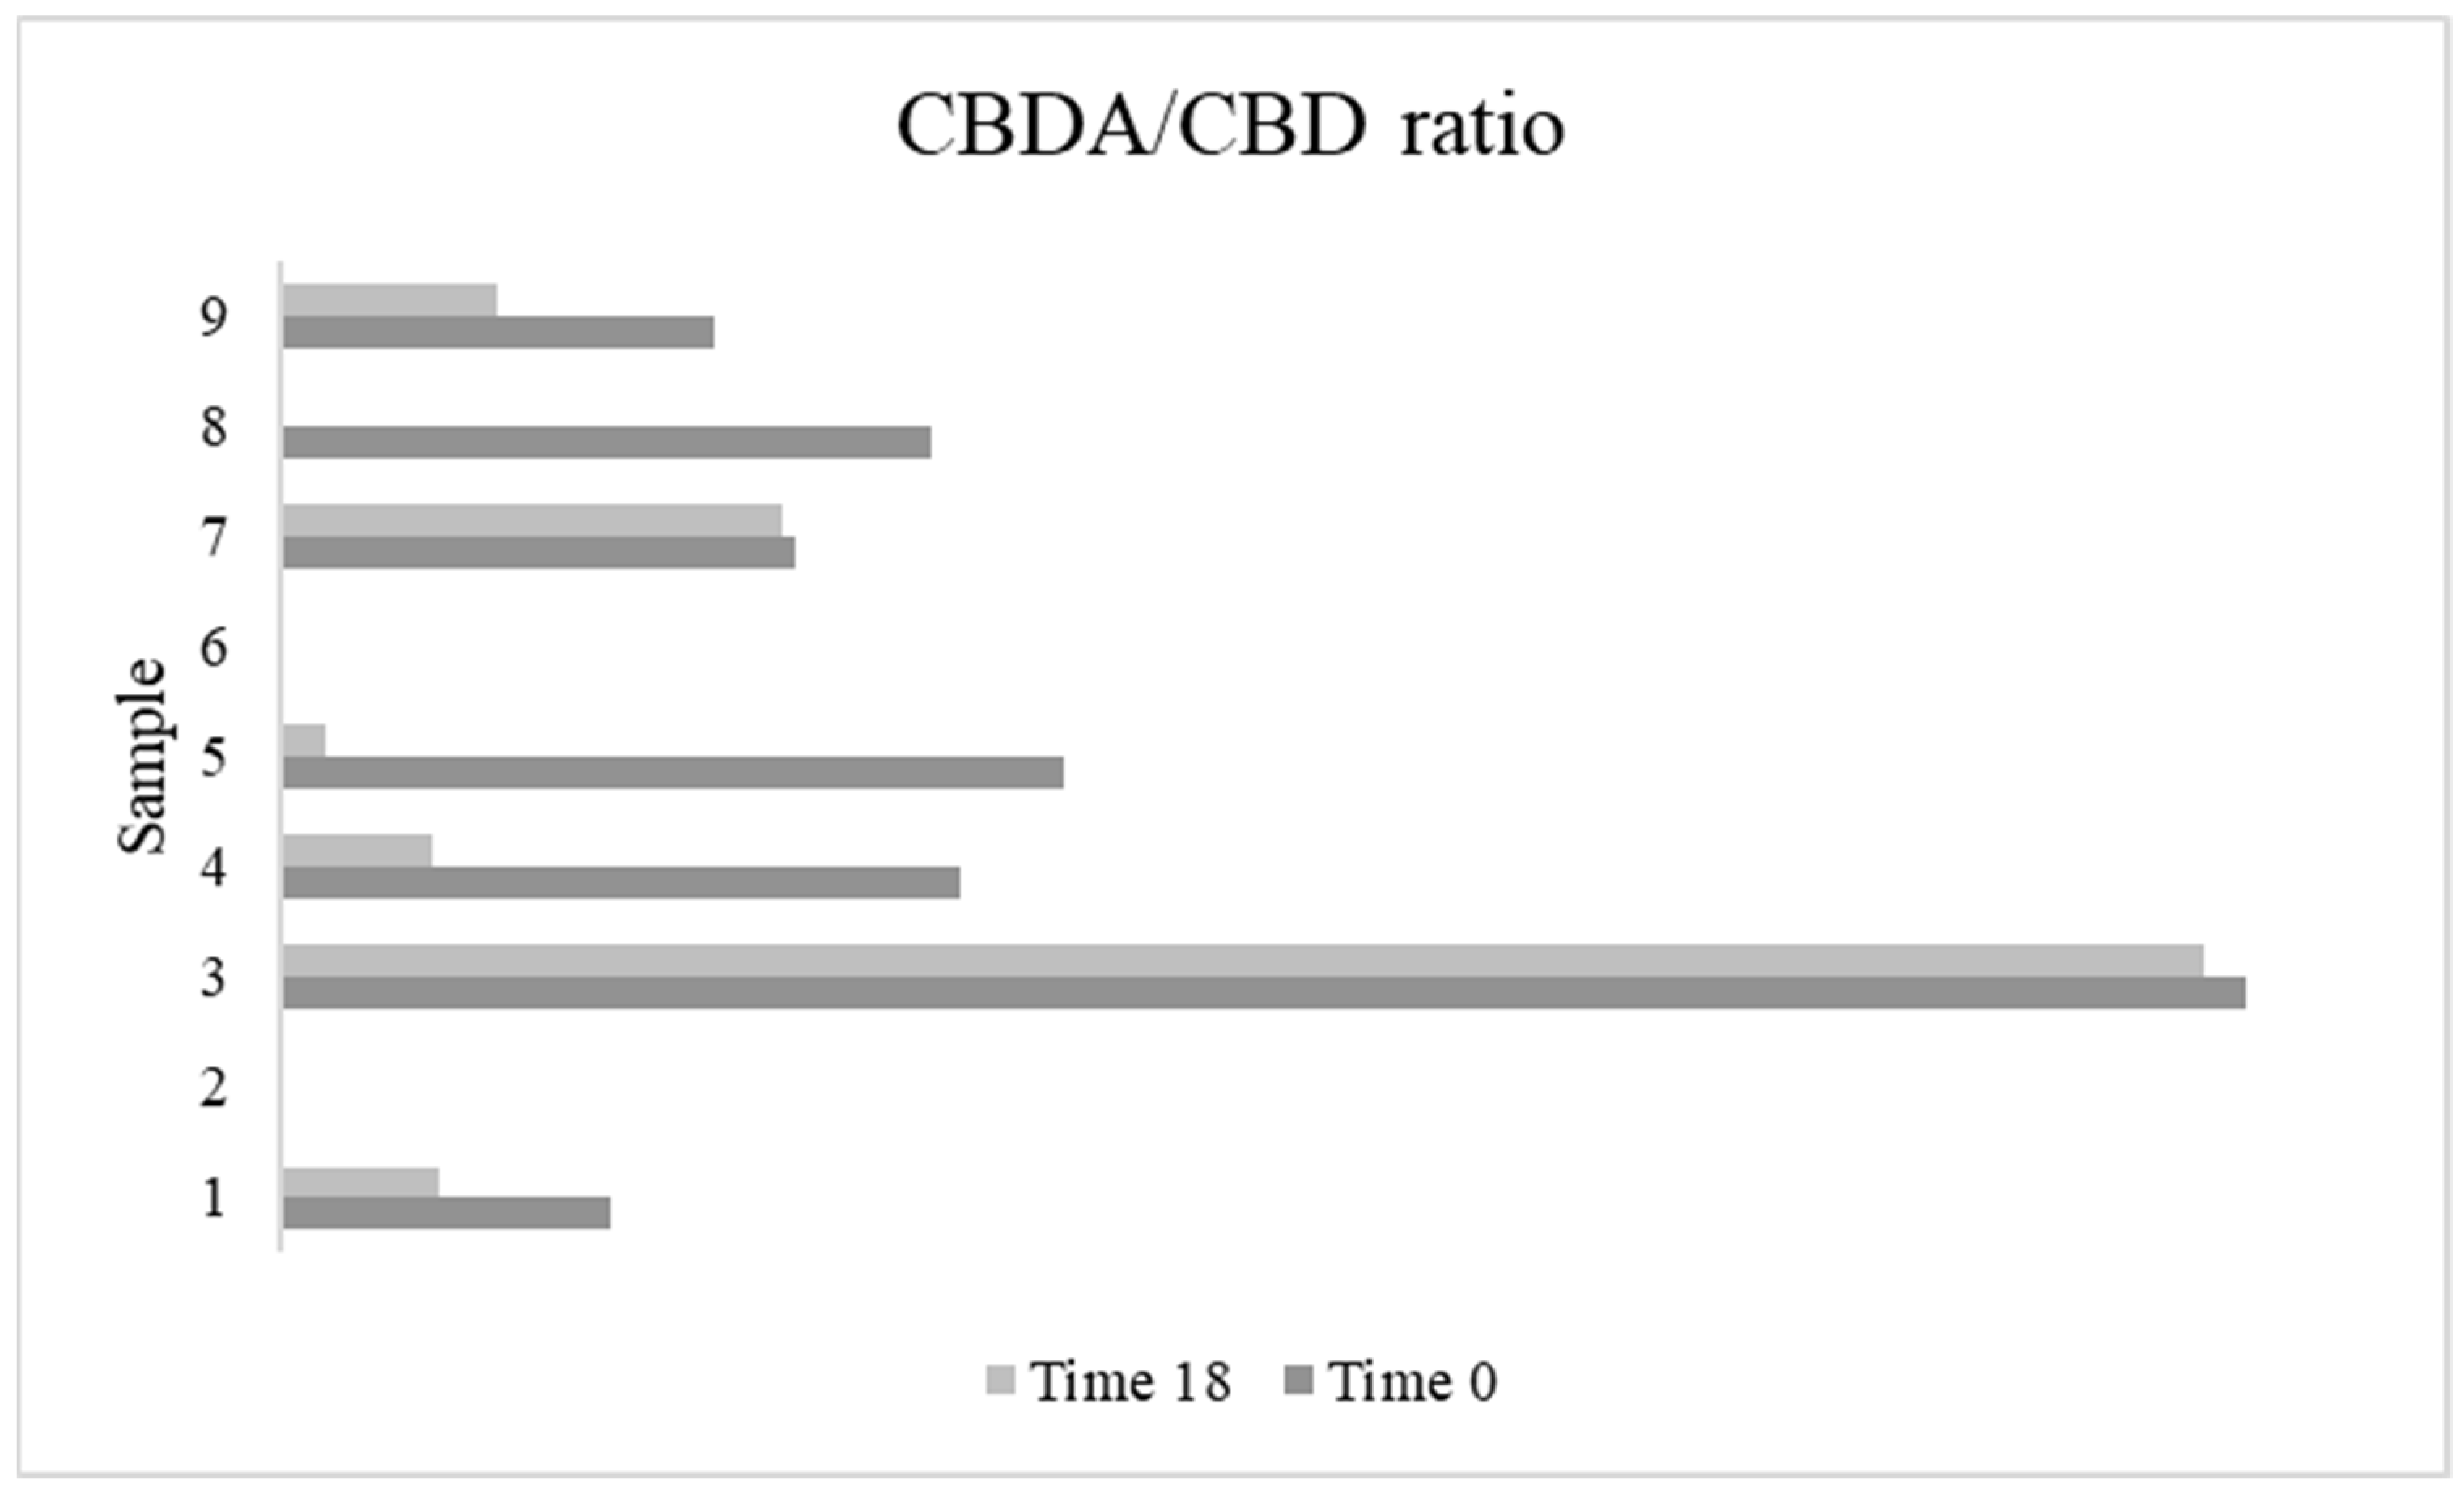
3.7. Cannabinoids
4. Discussion
4.1. Oxidative State and Composition of the Hemp Seed Oils at the Initial Stage of the Accelerated Oxidation Test
4.2. Evolution of the Oxidative State and Composition of the Hemp Seed Oils during the Accelerated Heating Test
4.3. Evaluation of the Oxidation and Freshness Volatiles Markers
5. Conclusions
Supplementary Materials
Author Contributions
Funding
Institutional Review Board Statement
Informed Consent Statement
Data Availability Statement
Acknowledgments
Conflicts of Interest
References
- Citti, C.; Pacchetti, B.; Vandelli, M.A.; Forni, F.; Cannazza, G. Analysis of cannabinoids in commercial hemp seed oil and decarboxylation kinetics studies of cannabidiolic acid (CBDA). J. Pharm. Biomed. Anal. 2018, 149, 532–540. [Google Scholar] [CrossRef] [PubMed]
- Vogl, C.R.; Mölleken, H.; Lissek-Wolf, G.; Surböck, A.; Kobert, J. Hemp (Cannabis sativa L.) as a resource for green cosmetics: Yield of seed and fatty acid compositions of 20 varieties under the growing conditions of organic farming in Austria. J. Ind. Hemp 2004, 9, 51–68. [Google Scholar] [CrossRef]
- Moscariello, C.; Matassa, S.; Esposito, G.; Papirio, S. From residue to resource: The multifaceted environmental and bioeconomy potential of industrial hemp (Cannabis sativa L.). Resour. Conserv. Recycl. 2021, 175, 105864. [Google Scholar] [CrossRef]
- Alonso-Esteban, J.I.; González-Fernández, M.J.; Fabrikov, D.; Torija-Isasa, E.; Sánchez-Mata, M.D.C.; Guil-Guerrero, J.L. Hemp (Cannabis sativa L.) Varieties: Fatty acid profiles and upgrading of γ-linolenic acid–containing hemp seed oils. Eur. J. Lipid Sci. Technol. 2020, 122, 1900445. [Google Scholar] [CrossRef]
- Mikulcová, V.; Kašpárková, V.; Humpolíček, P.; Buňková, L. Formulation, characterization and properties of hemp seed oil and its emulsions. Molecules 2017, 22, 700. [Google Scholar] [CrossRef] [PubMed]
- Codex Alimentarius. Standard for named vegetable oils CXS 210-1999. Adopted in 1999. Revised in 2001, 2003, 2009, 2017, 2019. Amended in 2005, 2011, 2013, 2015, 2019. Available online: https://www.fao.org/fao-who-codexalimentarius/sh-proxy/ar/?lnk=1&url=https%253A%252F%252Fworkspace.fao.org%252Fsites%252Fcodex%252FStandards%252FCXS%2B210-1999%252FCXS_210e.pdf (accessed on 9 February 2022).
- Dimić, E.; Romanić, R.; Vujasinović, V. Essential fatty acids, nutritive value and oxidative stability of cold pressed hempseed (Cannabis sativa L.) oil from different varieties. Acta Aliment. 2009, 38, 229–236. [Google Scholar] [CrossRef]
- Teh, S.S.; Birch, J. Physicochemical and quality characteristics of cold-pressed hemp, flax and canola seed oils. J. Food Compos. Anal. 2013, 30, 26–31. [Google Scholar] [CrossRef]
- Faugno, S.; Piccolella, S.; Sannino, M.; Principio, L.; Crescente, G.; Baldi, G.M.; Fiorentino, N.; Pacifico, S. Can agronomic practices and cold-pressing extraction parameters affect phenols and polyphenols content in hempseed oils? Ind. Crops Prod. 2019, 130, 511–519. [Google Scholar] [CrossRef]
- Okogeri, O.; Tasioula-Margari, M. Changes occurring in phenolic compounds and α- tocopherol of virgin olive oil during storage. J. Agric. Food Chem. 2002, 50, 1077–1080. [Google Scholar] [CrossRef]
- Aachary, A.A.; Liang, J.; Hydamaka, A.; Eskin, N.M.; Thiyam-Holländer, U. A new ultrasound-assisted bleaching technique for impacting chlorophyll content of cold-pressed hempseed oil. LWT 2016, 72, 439–446. [Google Scholar] [CrossRef]
- Liang, J.; Aachary, A.A.; Hydamaka, A.; Eskin, N.M.; Eck, P.; Thiyam-Holländer, U. Reduction of chlorophyll in cold-pressed hemp (Cannabis sativa) seed oil by ultrasonic bleaching and enhancement of oxidative stability. Eur. J. Lipid Sci. Technol. 2018, 120, 1700349. [Google Scholar] [CrossRef]
- Frankel, E.N. Lipid oxidation: Mechanisms, products and biological significance. J. Am. Oil Chem. Soc. 1984, 61, 1908–1917. [Google Scholar] [CrossRef]
- Maroon, J.; Bost, J. Review of the neurological benefits of phytocannabinoids. Sur. Neurol. Int. 2018, 9, 91. [Google Scholar] [CrossRef] [PubMed]
- Pratap Singh, A.; Fathordoobady, F.; Guo, Y.; Singh, A.; Kitts, D.D. Antioxidants help favorably regulate the kinetics of lipid peroxidation, polyunsaturated fatty acids degradation and acidic cannabinoids decarboxylation in hempseed oil. Sci. Rep. 2020, 10, 1–12. [Google Scholar]
- Barriuso, B.; Astiasarán, I.; Ansorena, D. A review of analytical methods measuring lipid oxidation status in foods: A challenging task. Eur. Food Res. Technol. 2013, 236, 1–15. [Google Scholar] [CrossRef]
- Xu, L.; Yu, X.; Li, M.; Chen, J.; Wang, X. Monitoring oxidative stability and changes in key volatile compounds in edible oils during ambient storage through HS-SPME/GC–MS. Int. J. Food Prop. 2017, 20 (Suppl. S3), S2926–S2938. [Google Scholar] [CrossRef] [Green Version]
- Gaca, A.; Kludská, E.; Hradecký, J.; Hajšlová, J.; Jeleń, H. Changes in volatile compound profiles in cold-pressed oils obtained from various seeds during accelerated storage. Molecules 2021, 26, 285. [Google Scholar] [CrossRef] [PubMed]
- Poyato, C.; Ansorena, D.; Navarro-Blasco, I.; Astiasarán, I. A novel approach to monitor the oxidation process of different types of heated oils by using chemometric tools. Food Res. Int. 2014, 57, 152–161. [Google Scholar] [CrossRef]
- Goicoechea, E.; Guillén, M.D. Volatile compounds generated in corn oil stored at room temperature. Presence of toxic compounds. Eur. J. Lipid Sci. Technol. 2014, 116, 395–406. [Google Scholar] [CrossRef]
- Vichi, S.; Pizzale, L.; Conte, L.S.; Buxaderas, S.; López-Tamames, E. Solid-phase microextraction in the analysis of virgin olive oil volatile fraction: Modifications induced by oxidation and suitable markers of oxidative status. J. Agric. Food Chem. 2003, 51, 6564–6571. [Google Scholar] [CrossRef] [PubMed]
- Dedebas, T.; Ekici, L.; Sagdic, O. Chemical characteristics and storage stabilities of different cold-pressed seed oils. J. Food Process. Preserv. 2021, 45, e15107. [Google Scholar] [CrossRef]
- Shantha, N.C.; Decker, E.A. Rapid, sensitive, iron-based spectrophotometric methods for determination of peroxide values of food lipids. J. AOAC Int. 1994, 77, 421–424. [Google Scholar] [CrossRef] [PubMed]
- Maqsood, S.; Benjakul, S. Comparative studies of four different phenolic compounds on in vitro antioxidative activity and the preventive effect on lipid oxidation of fish oil emulsion and fish mince. Food Chem. 2010, 119, 123–132. [Google Scholar] [CrossRef]
- Singleton, V.L.; Rossi, J.A. Colorimetry of total phenolics with phosphomolybdic-phosphotungstic acid reagents. Am. J. Enol. Vitic. 1965, 16, 144–158. [Google Scholar]
- AOAC. Official Methods of Analysis of AOAC International, 17th ed.; Method 969.33. Fatty acids in oils and fats. Preparation of methyl esters; AOAC: Gaithersburg, MD, USA, 2002. [Google Scholar]
- Gutiérrez-Luna, K.; Ansorena, D.; Astiasarán, I. Flax and hempseed oil functional ingredient stabilized by inulin and chia mucilage as a butter replacer in muffin formulations. J. Food Sci. 2020, 85, 3072–3080. [Google Scholar] [CrossRef]
- Gayoso, L.; Poyato, C.; Calvo, M.I.; Cavero, R.Y.; Ansorena, D.; Astiasarán, I. Volatiles formation in gelled emulsions enriched in polyunsaturated fatty acids during storage: Type of oil and antioxidant. J. Food Sci. Technol. 2017, 54, 2842–2851. [Google Scholar] [CrossRef]
- Gutiérrez-luna, K.; Ansorena, D.; Astiasarán, I. Use of hydrocolloids and vegetable oils for the formulation of a butter replacer: Optimization and oxidative stability. LWT 2022, 153, 112538. [Google Scholar] [CrossRef]
- Kondjoyan, N.; Berdagué, J.L. A Compilation of Relative Retention Indices for the Analysis of Aromatic Compounds; Laboratoire Flaveur, Institut National de la Reserche Agronomique: Theix, France, 1996; pp. 1–234. [Google Scholar]
- ISO 9936:2016 Animal and Vegetable Fats and Oils—Determination of Tocopherol and Tocotrienol Contents by High-Performance Liquid Chromatography; ISO: Geneva, Switzerland, 2016.
- UNI/TS 11825:2021 Oli e grassi vegetali—Determinazione dei Tocoferoli e Tocotrienoli mediante cromatografia liquida ad alta pressione in fase inversa (RP-HPLC) e detector fluorimetrico; UNI: Rome, Italy, 2021.
- Tura, M.; Mandrioli, M.; Gallina Toschi, T. Preliminary study: Comparison of antioxidant activity of cannabidiol (CBD) and α-tocopherol added to refined olive and sunflower oils. Molecules 2019, 24, 3485. [Google Scholar] [CrossRef] [Green Version]
- Mandrioli, M.; Tura, M.; Scotti, S.; Gallina Toschi, T. Fast detection of 10 cannabinoids by RP-HPLC-UV method in Cannabis sativa L. Molecules 2019, 24, 2113. [Google Scholar] [CrossRef] [Green Version]
- Yu, L.L.; Zhou, K.K.; Parry, J. Antioxidant properties of cold-pressed black caraway, carrot, cranberry, and hemp seed oils. Food Chem. 2005, 91, 723–729. [Google Scholar] [CrossRef]
- Parker, T.D.; Adams, D.A.; Zhou, K.; Harris, M.; Yu, L. Fatty acid composition and oxidative stability of cold-pressed edible seed oils. J. Food Sci. 2003, 68, 1240–1243. [Google Scholar] [CrossRef]
- Da Porto, C.D.; Decorti, D.; Natolino, A. Potential oil yield, fatty acid composition, and oxidation stability of the hempseed oil from four Cannabis sativa L. cultivars. J. Diet. Suppl. 2015, 12, 1–10. [Google Scholar] [CrossRef] [PubMed]
- Callaway, J.C. Hempseed as a nutritional resource: An overview. Euphytica 2004, 140, 65–72. [Google Scholar] [CrossRef]
- Oomah, B.D.; Busson, M.; Godfrey, D.V.; Drover, J.C. Characteristics of hemp (Cannabis sativa L.) seed oil. Food Chem. 2002, 76, 33–43. [Google Scholar] [CrossRef]
- Matthäus, B.; Brühl, L. Virgin hemp seed oil: An interesting niche product. Eur. J. Lipid Sci. Technol. 2008, 110, 655–661. [Google Scholar] [CrossRef]
- Liang, J.; Appukuttan Aachary, A.; Thiyam-Holländer, U. Hemp seed oil: Minor components and oil quality. Lipid Technol. 2015, 27, 231–233. [Google Scholar] [CrossRef]
- Latif, S.; Anwar, F. Physicochemical studies of hemp (Cannabis sativa) seed oil using enzyme-assisted cold-pressing. Eur. J. Lipid Sci. Technol. 2009, 111, 1042–1048. [Google Scholar] [CrossRef]
- Spano, M.; Di Matteo, G.; Rapa, M.; Ciano, S.; Ingallina, C.; Cesa, S.; Menghini, L.; Carradori, S.; Giusti, A.M.; Di Sotto, A.; et al. Commercial hemp seed oils: A multimethodological characterization. Appl. Sci. 2020, 10, 6933. [Google Scholar] [CrossRef]
- Bajoub, A.; Bendini, A.; Fernández-Gutiérrez, A.; Carrasco-Pancorbo, A. Olive oil authentication: A comparative analysis of regulatory frameworks with especial emphasis on quality and authenticity indices, and recent analytical techniques developed for their assessment. A review. Crit. Rev. Food Sci. Nutr. 2018, 58, 832–857. [Google Scholar] [CrossRef]
- Morales, M.T.; Luna, G.; Aparicio, R. Comparative study of virgin olive oil sensory defects. Food Chem. 2005, 91, 293–301. [Google Scholar] [CrossRef]
- Guillen, M.D.; Goicoechea, E. Formation of oxygenated α, β-unsaturated aldehydes and other toxic compounds in sunflower oil oxidation at room temperature in closed receptacles. Food Chem. 2008, 111, 157–164. [Google Scholar] [CrossRef]
- Sommano, S.R.; Chittasupho, C.; Ruksiriwanich, W.; Jantrawut, P. The Cannabis Terpenes. Molecules 2020, 25, 5792. [Google Scholar] [CrossRef] [PubMed]
- Abuzaytoun, R.; Shahidi, F. Oxidative stability of flax and hemp oils. J. Am. Oil Chem. Soc. 2006, 83, 855–861. [Google Scholar] [CrossRef]
- Siger, A.; Nogala-kalucka, M.; Lampart-Szczapa, E. The content and antioxidant activity of phenolic compounds in cold-pressed plant oils. J. Food Lipids 2008, 15, 137–149. [Google Scholar] [CrossRef]
- Izzo, L.; Pacifico, S.; Piccolella, S.; Castaldo, L.; Narváez, A.; Grosso, M.; Ritieni, A. Chemical analysis of minor bioactive components and cannabidiolic acid in commercial hemp seed oil. Molecules 2020, 25, 3710. [Google Scholar] [CrossRef] [PubMed]
- Özdemir, H.; Bakkalbaşı, E.; Javidipour, I. Effect of seed roasting on oxidative stability and antioxidant content of hemp seed oil. J. Food Sci. Technol. 2021, 58, 2606–2616. [Google Scholar] [CrossRef] [PubMed]
- Leonard, W.; Zhang, P.; Ying, D.; Fang, Z. Hempseed in food industry: Nutritional value, health benefits, and industrial applications. Compr. Rev. Food Sci. Food Saf. 2020, 19, 282–308. [Google Scholar] [CrossRef] [Green Version]
- Morales, M.T.; Rios, J.J.; Aparicio, R. Changes in the volatile composition of virgin olive oil during oxidation: Flavors and off-flavors. J. Agric. Food Chem. 1997, 45, 2666–2673. [Google Scholar] [CrossRef]
- Muik, B.; Lendl, B.; Molina-Díaz, A.; Ayora-Cañada, M.J. Direct monitoring of lipid oxidation in edible oils by Fourier transform Raman spectroscopy. Chem. Phys. Lipids 2005, 134, 173–182. [Google Scholar] [CrossRef]
- Petrović, M.; Debeljak, Ž.; Kezić, N.; Džidara, P. Relationship between cannabinoids content and composition of fatty acids in hempseed oils. Food Chem. 2015, 170, 218–225. [Google Scholar] [CrossRef]
- Nogueira, M.S.; Scolaro, B.; Milne, G.L.; Castro, I.A. Oxidation products from omega-3 and omega-6 fatty acids during a simulated shelf life of edible oils. LWT 2019, 101, 113–122. [Google Scholar] [CrossRef]
- Zhou, Q.; Huang, F.; Zheng, C.; Guo, P.; Li, W.; Liu, C.; Wan, C. Physicochemical properties and volatile terpene of hempseed oils in Bama region. Oil Crop Sci. 2017, 1, 13–22. [Google Scholar]
- Psomiadou, E.; Tsimidou, M.; Boskou, D. α-Tocopherol content of Greek virgin olive oils. J. Agric. Food Chem. 2000, 48, 1770–1775. [Google Scholar] [CrossRef]
- Pavlovic, R.; Nenna, G.; Calvi, L.; Panseri, S.; Borgonovo, G.; Giupponi, L.; Cannazza, G.; Giorgi, A. Quality traits of “cannabidiol oils”: Cannabinoids content, terpene fingerprint and oxidation stability of European commercially available preparations. Molecules 2018, 23, 1230. [Google Scholar] [CrossRef] [PubMed] [Green Version]
- Liu, Y.; Li, J.; Cheng, Y.; Liu, Y. Volatile components of deep-fried soybean oil as indicator indices of lipid oxidation and quality degradation. Eur. Food Res. Technol. 2020, 246, 1183–1192. [Google Scholar] [CrossRef]

| Sample | Farming System | Technological Information | Seeds Origin |
|---|---|---|---|
| 1 | Organic | Cold-pressed | Italy |
| 2 | Organic | Cold-pressed | UE-Extra UE |
| 3 | Organic | Cold-pressed | Extra UE |
| 4 | Organic | Cold-pressed | UE |
| 5 | Conventional | Cold-pressed | UE |
| 6 | Organic | Cold-pressed | Extra UE |
| 7 | Organic | Cold-pressed | UE |
| 8 | Organic | Cold-pressed | UE |
| 9 | Organic | Cold-pressed | UE |
| Sample | T0 mg MDA/kg of Oil | T18 mg MDA/kg of Oil |
|---|---|---|
| 1 | 11.28 ± 0.69 a | 9.62 ± 0.74 b |
| 2 | 11.04 ± 1.58 a | 9.06 ± 0.47 b |
| 3 | 13.27 ± 1.78 a | 8.50 ± 0.66 b |
| 4 | 11.56 ± 1.70 a | 9.65 ± 1.42 b |
| 5 | 11.54 ± 0.28 a | 8.12 ± 1.19 b |
| 6 | 11.37 ± 1.57 a | 10.25 ± 1.14 a |
| 7 | 12.25 ± 1.15 a | 7.17 ± 0.73 b |
| 8 | 12.01 ± 0.97 a | 9.98 ± 1.32 b |
| 9 | 17.15 ± 0.83 a | 6.87 ± 0.99 b |
| Sample | T0 mg Gallic Acid/kg of Oil | T18 mg Gallic Acid/kg of Oil |
|---|---|---|
| 1 | 50.37 ± 2.03 a | 22.14 ± 1.78 b |
| 2 | 106.50 ± 8.80 a | 16.95 ± 0.82 b |
| 3 | 45.58 ± 2.71 a | 11.28 ± 1.15 b |
| 4 | 15.39 ± 0.79 a | 12.76 ± 1.16 a |
| 5 | 16.75 ± 0.41 a | 10.89 ± 0.28 b |
| 6 | 30.76 ± 6.60 a | 7.90 ± 0.21 b |
| 7 | 25.70 ± 1.07 a | 7.10 ± 0.49 b |
| 8 | 12.08 ± 1.96 a | 11.80 ± 2.25 a |
| 9 | 186.78 ± 4.57 a | 60.10 ± 0.63 b |
| Volatile Compounds | R | p-Values (Pearson) |
|---|---|---|
| 1-Octene | −0.094 | 0.464 |
| 2-(E)-Octene | −0.066 | 0.608 |
| 2-(Z)-Octene | −0.054 | 0.675 |
| Hexanal | 0.482 | <0.0001 |
| (E)-2-hexenal | 0.843 | <0.0001 |
| Heptanal | 0.600 | <0.0001 |
| (E,E)-2,4-Hexadienal | 0.708 | <0.0001 |
| (E)-2-Heptenal | 0.640 | <0.0001 |
| (E,E)-2,4-Heptadienal | 0.488 | <0.0001 |
| (E,Z)-2,4-Heptadienal | 0.752 | <0.0001 |
| 2-Octenal | 0.398 | 0.001 |
| Nonanal | 0.734 | <0.0001 |
| Nonenal | 0.615 | <0.0001 |
| 2,4-Nonadienal | 0.582 | <0.0001 |
| (E,E)-2,4-Decadienal | 0.719 | <0.0001 |
| 2,4-Decadienal | 0.809 | <0.0001 |
| 2-Heptanone | 0.004 | 0.973 |
| 1-Octen-3-one | 0.326 | 0.009 |
| 3-Octen-2-one | 0.516 | <0.0001 |
| (E,E)-3,5-Octadien-2-one | 0.559 | <0.0001 |
| 3,5-Octadien-2-one | 0.667 | <0.0001 |
| 3-Methyl-1-butanol | 0.099 | 0.439 |
| 1-Pentanol | −0.278 | 0.027 |
| 1-Hexanol | −0.253 | 0.045 |
| 1-Octen-3-ol | 0.619 | <0.0001 |
| Propionic acid | 0.648 | <0.0001 |
| Butanoic acid | −0.059 | 0.648 |
| Pentanoic acid | 0.547 | <0.0001 |
| Hexanoic acid | 0.546 | <0.0001 |
| Heptanoic acid | 0.447 | 0.000 |
| 2-Pentyl-furan | 0.741 | <0.0001 |
| α-Pinene | −0.417 | 0.001 |
| β-Pinene | −0.381 | 0.002 |
| δ-3-Carene | −0.167 | 0.191 |
| para-Cymene | 0.254 | 0.045 |
| Limonene | −0.209 | 0.101 |
| (E)-β-Ocimene | −0.063 | 0.626 |
| Terpinolene | −0.173 | 0.175 |
| (E)-Caryophyllene | −0.192 | 0.131 |
| Bergamotene (isomer) | 0.043 | 0.740 |
| Samples | Time (Days) | |||||||||||||
|---|---|---|---|---|---|---|---|---|---|---|---|---|---|---|
| 0 | 3 | 6 | 9 | 12 | 15 | 18 | ||||||||
| α-tocopherol | γ-tocopherol | α-tocopherol | γ-tocopherol | α-tocopherol | γ-tocopherol | α-tocopherol | γ-tocopherol | α-tocopherol | γ-tocopherol | α-tocopherol | γ-tocopherol | α-tocopherol | γ-tocopherol | |
| 1 | 32.09 ± 0.78 a | 641.91 ± 29.25 a | - | 350.13 ± 5.74 b | - | 83.08 ± 2.39 c | - | 76.23 ± 1.41 c | - | 69.93 ± 1.53 c | - | 69.59 ± 1.68 c | - | 70.38 ± 1.80 c |
| 2 | 28.28 ± 0.85 a | 568.68 ± 39.34 a | - | 65.86 ± 0.76 b | - | 56.25 ± 0.30 b | - | 60.95 ± 1.39 b | - | 54.83 ± 1.09 b | - | 58.34 ± 2.40 b | - | 60.03 ± 1.88 b |
| 3 | 45.98 ± 4.15 a | 569.99 ± 16.46 a | - | 65.62 ± 0.63 b | - | 65.48 ± 0.41 b | - | 64.76 ± 0.30 b | - | 64.27 ± 1.21 b | - | 65.74 ± 2.08 b | - | 65.65 ± 2.07 b |
| 4 | 21.02 ± 0.28 a | 376.28 ± 10.72 a | - | 40.40 ± 0.84 b | - | 44.64 ± 1.68 b | - | 46.15 ± 0.73 b | - | 47.36 ± 0.73 b | - | 49.03 ± 3.46 b | - | 50.28 ± 1.14 b |
| 5 | 41.53 ± 3.09 a | 650.52 ± 14.68 a | - | 103.65 ± 2.90 b | - | 65.23 ± 3.58 c | - | 73.80 ± 1.72 c | - | 68.63 ± 0.83 c | - | 72.57 ± 3.44 c | - | 67.71 ± 1.30 c |
| 6 | 65.92 ± 4.86 a | 906.63 ± 65.75 a | - | 301.72 ± 3.88 b | - | 212.29 ± 8.22 c | - | 200.12 ± 3.34 c | - | 209.57 ± 5.87 c | - | 195.09 ± 6.47 c | - | 195.57 ± 8.28 c |
| 7 | 59.30 ± 1.46 a | 622.24 ± 12.12 a | - | 79.69 ± 10.22 b | - | 66.57 ± 1.61 b | - | 73.37 ± 1.31 b | - | 70.54 ± 0.96 b | - | 85.92 ± 5.93 b | - | 86.53 ± 1.16 b |
| 8 | 49.81 ± 0.63 a | 893.81 ± 7.78 a | - | 384.12 ± 4.77 b | - | 300.00 ± 5.10 c | - | 233.05 ± 11.29 d | - | 206.03 ± 8.11 e | - | 207.02 ± 7.70 e | - | 237.66 ± 8.34 d |
| 9 | 1095.62 ± 45.21a | 816.31 ± 53.49 a | - | 327.68 ± 3.27 b | - | 83.29 ± 2.46 c | - | 59.30 ± 1.68 c | - | 55.50 ± 1.75 c | - | 51.84 ± 1.73 c | - | 53.52 ± 0.59 c |
| Volatile Classes (Area Counts × 103) | Alkenes | Aldehydes | Ketones | Alcohols | Acids | Furans Derivatives | Terpenes |
|---|---|---|---|---|---|---|---|
| 1 T0 | 7898 b;B | 79,310 b;B | 18,728 a;B | 145,921 a;A | 53,014 a;B | 21,427 a;B | 27,076 g;A |
| 1 T18 | 10,458 d,e;A | 322,350 f;A | 69,180 c,d;A | 42,371 b;B | 97,513 a;A | 58,562 b;A | 10,756 g;B |
| 2 T0 | 1729 c,d;B | 54,553 c;B | 4161 d;B | 45,175 d;A | 19,997 b;B | ND | 85,764 e;A |
| 2 T18 | 8093 e;A | 299,972 f,g;A | 66,630 c,d;A | 24,523 d,e;B | 61,717 e;A | 27,634 e;A | 33,717 e,f;B |
| 3 T0 | 9960 b;A | 22,471 f;B | 2786 e,f;B | 18,213 e;B | 10,665 c,d;B | ND | 99,763 d;A |
| 3 T18 | 8527 e;A | 283,889 g;A | 88,026 b;A | 22,775 e;A | 65,826 d,e;A | 27,386 e;A | 38,825 e;B |
| 4 T0 | 10,595 b;A | 44,554 d;B | 3931 d,e;B | 19,381 e;B | 8506 d,e;B | ND | 241,727 b;A |
| 4 T18 | 8405 e;B | 542,552 b;A | 71,086 c;A | 33,941 c;A | 68,003 c,d,e;A | 85,247 a;A | 128,554 b;B |
| 5 T0 | 2765 c,d;B | 38,251 d,e;B | 14,477 b;B | 16,151 e,f;B | 9810 d;B | ND | 270,385 a;A |
| 5 T18 | 10,296 d,e;A | 508,137 c;A | 102,539 a;A | 27,664 d;A | 76,551 b,c;A | 88,260 a;A | 157,101 a;B |
| 6 T0 | 6677 b,c;B | 81,114 b;B | 8363 c;B | 79,756 c;A | 14,170 c;B | 8111 b;B | 77,792 e;A |
| 6 T18 | 23,007 c;A | 431,199 d;A | 62,136 d;A | 53,925 a;B | 84,588 b;A | 35,289 c,d;A | 60,481 c;B |
| 7 T0 | 7076 b;B | 30,949 e,f;B | 1757 f;B | 10,271 f;B | 7336 d,e;B | ND | 48,310 f;A |
| 7 T18 | 12,495 d;A | 395,491 e;A | 53,896 e;A | 36,615 c;A | 73,652 c,d;A | 39,376 c;A | 27,033 f;B |
| 8 T0 | 7992 b;B | 73,734 b;B | 8189 c;B | 95,222 b;A | 11,426 c,d;B | ND | 116,165c;A |
| 8 T18 | 27,106 b;A | 428,136 d;A | 92,359 b;A | 52,369 a;B | 77,983 b,c;A | 32,105 d;A | 48,212 d;B |
| 9 T0 | 175,856 a;A | 141,284 a;B | 2156 f;B | 2604 g;B | 4944 e;B | 1777 c;B | 675 h;A |
| 9 T18 | 39,300 a;B | 653,989 a;A | 22,916 f;A | 25,457 d,e;A | 41,981 f;A | 38,068 c;A | ND |
Publisher’s Note: MDPI stays neutral with regard to jurisdictional claims in published maps and institutional affiliations. |
© 2022 by the authors. Licensee MDPI, Basel, Switzerland. This article is an open access article distributed under the terms and conditions of the Creative Commons Attribution (CC BY) license (https://creativecommons.org/licenses/by/4.0/).
Share and Cite
Tura, M.; Ansorena, D.; Astiasarán, I.; Mandrioli, M.; Toschi, T.G. Evaluation of Hemp Seed Oils Stability under Accelerated Storage Test. Antioxidants 2022, 11, 490. https://doi.org/10.3390/antiox11030490
Tura M, Ansorena D, Astiasarán I, Mandrioli M, Toschi TG. Evaluation of Hemp Seed Oils Stability under Accelerated Storage Test. Antioxidants. 2022; 11(3):490. https://doi.org/10.3390/antiox11030490
Chicago/Turabian StyleTura, Matilde, Diana Ansorena, Iciar Astiasarán, Mara Mandrioli, and Tullia Gallina Toschi. 2022. "Evaluation of Hemp Seed Oils Stability under Accelerated Storage Test" Antioxidants 11, no. 3: 490. https://doi.org/10.3390/antiox11030490
APA StyleTura, M., Ansorena, D., Astiasarán, I., Mandrioli, M., & Toschi, T. G. (2022). Evaluation of Hemp Seed Oils Stability under Accelerated Storage Test. Antioxidants, 11(3), 490. https://doi.org/10.3390/antiox11030490