

Design, Synthesis and Evaluation of Novel 1,4-Disubstituted Piperazine-2,5-dione Derivatives as Antioxidants against H2O2-Induced Oxidative Injury via the IL-6/Nrf2 Loop Pathway


Abstract
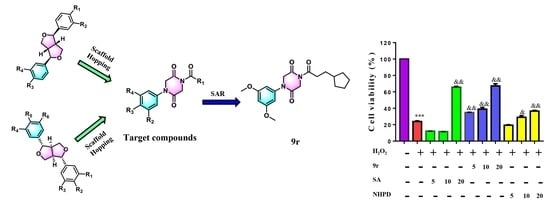
1. Introduction
2. Materials and Methods
2.1. General Methods
2.2. General Method for the Synthesis of Compounds 9a–9s
2.2.1. Ethyl 2-[(3,5-Dimethoxyphenyl)amino]acetate (2a)
2.2.2. Ethyl N-(2-Chloroacetyl)-N-[(3,5-dimethoxyphenyl)amino]acetate (3a)
2.2.3. Ethyl N-(2-Azidoacetyl)-N-[(3,5-dimethoxyphenyl)amino]acetate (4a)
2.2.4. 1-(3,5-Dimethoxyphenyl)piperazine-2,5-dione (7a)
2.2.5. 1-(3,5-Dimethoxyphenyl)-4-(4-methoxybenzoyl)piperazine-2,5-dione (9a)
2.2.6. 1-(3,5-Dimethoxyphenyl)-4-(4-methylbenzoyl)piperazine-2,5-dione (9b)
2.2.7. 1-(4-Methylbenzoyl)-4-(3,4-methylenedioxyphenyl)piperazine-2,5-dione (9c)
2.2.8. 1-(4-Methylbenzoyl)-4-phenylpiperazine-2,5-dione (9d)
2.2.9. 1-(3-Methoxyphenyl)-4-(4-methylbenzoyl)piperazine-2,5-dione (9e)
2.2.10. 1-(4-Methoxyphenyl)-4-(4-methylbenzoyl)piperazine-2,5-dione (9f)
2.2.11. 1-(3,5-Dimethoxyphenyl)-4-benzoylpiperazine-2,5-dione (9g)
2.2.12. 1-(3,5-Dimethoxyphenyl)-4-(4-fluorobenzoyl)piperazine-2,5-dione (9h)
2.2.13. 1-(3,5-Dimethoxyphenyl)-4-(4-(trifluoromethyl)benzoyl)piperazine-2,5-dione (9i)
2.2.14. 1-(3,5-Dimethoxyphenyl)-4-(4-(tert-butyl)benzoyl)piperazine-2,5-dione (9j)
2.2.15. 1-(3,5-Dimethoxyphenyl)-4-acetylpiperazine-2,5-dione (9k)
2.2.16. 1-(3,5-Dimethoxyphenyl)-4-(3-bromobenzoyl)piperazine-2,5-dione (9l)
2.2.17. 1-(3,5-Dimethoxyphenyl)-4-propionylpiperazine-2,5-dione (9m)
2.2.18. 1-(3,5-Dimethoxyphenyl)-4-butyrylpiperazine-2,5-dione (9n)
2.2.19. 1-(3,5-Difluorobenzoyl)-4-(3,5-dimethoxyphenyl)piperazine-2,5-dione (9o)
2.2.20. 1-(3,5-Dimethoxyphenyl)-4-pivaloylpiperazine-2,5-dione (9p)
2.2.21. 1-(3,5-Dimethoxyphenyl)-4-(cyclopropanecarbonyl)piperazine-2,5-dione (9q)
2.2.22. 1-(3,5-Dimethoxyphenyl)-4-(3-cyclopentylpropanoyl)piperazine-2,5-dione (9r)
2.2.23. 1-(3,5-Dimethoxyphenyl)-4-(2-methoxyacetyl)piperazine-2,5-dione (9s)
2.3. Biological Antioxidant Assays Used for the Study of Compounds 9a–9s
2.3.1. Cell Culture
2.3.2. Measurement of Intracellular ROS Production
2.3.3. Determination of Mitochondrial Membrane Potential
2.3.4. Cell Apoptosis
2.3.5. Extraction of Cytoplasmic and Nuclear Proteins
2.3.6. Immunofluorescence Staining
2.3.7. SiRNA Transfection
2.3.8. Western Blotting
2.3.9. Statistical Analysis
3. Results and Discussion
3.1. Chemistry
3.2. Biological Evaluation
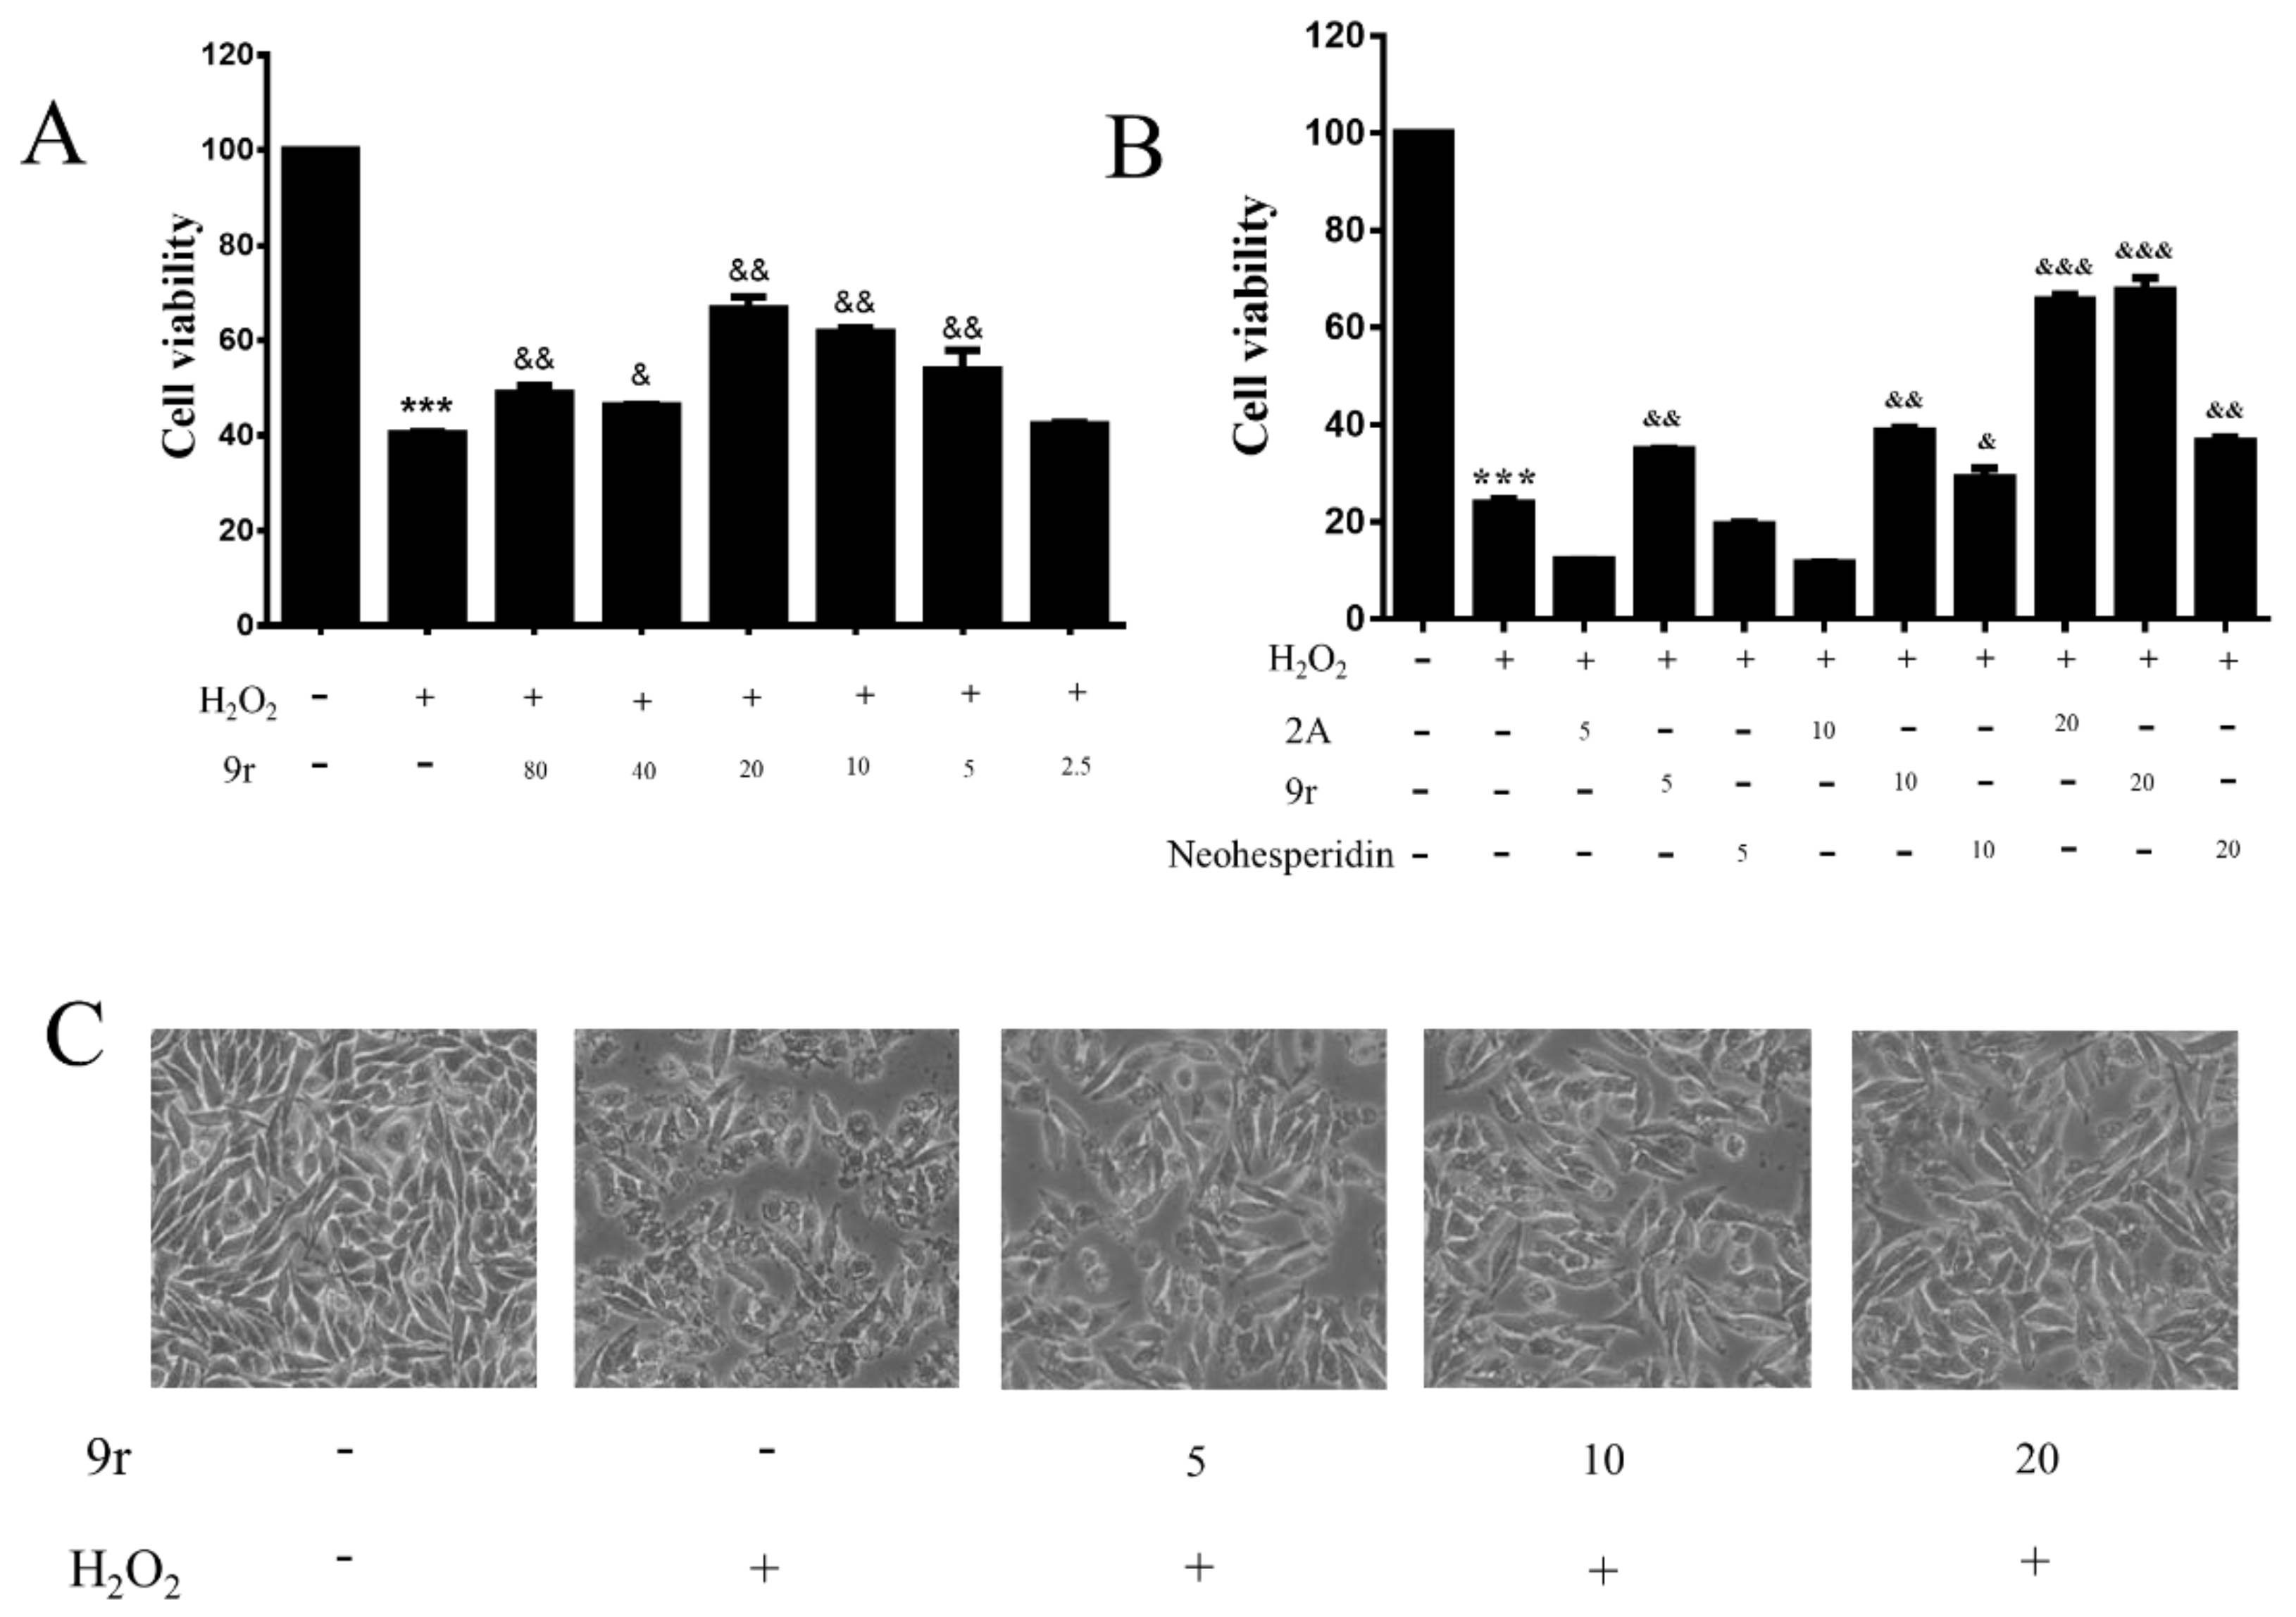
3.2.1. Cell Viability Assay
3.2.2. Compound 9r Exhibited Cytoprotective Effects by Partially Restoring Cell Viability and Ameliorating Morphology
3.2.3. 9r Attenuated H2O2-Induced Cell Apoptosis in SH-SY5Y Cells
3.2.4. Compound 9r Attenuated Mitochondrial Dysfunction Caused by H2O2 Treatment
3.2.5. 9r Decreased the Generation of ROS in H2O2-Treated SH-SY5Y Cells
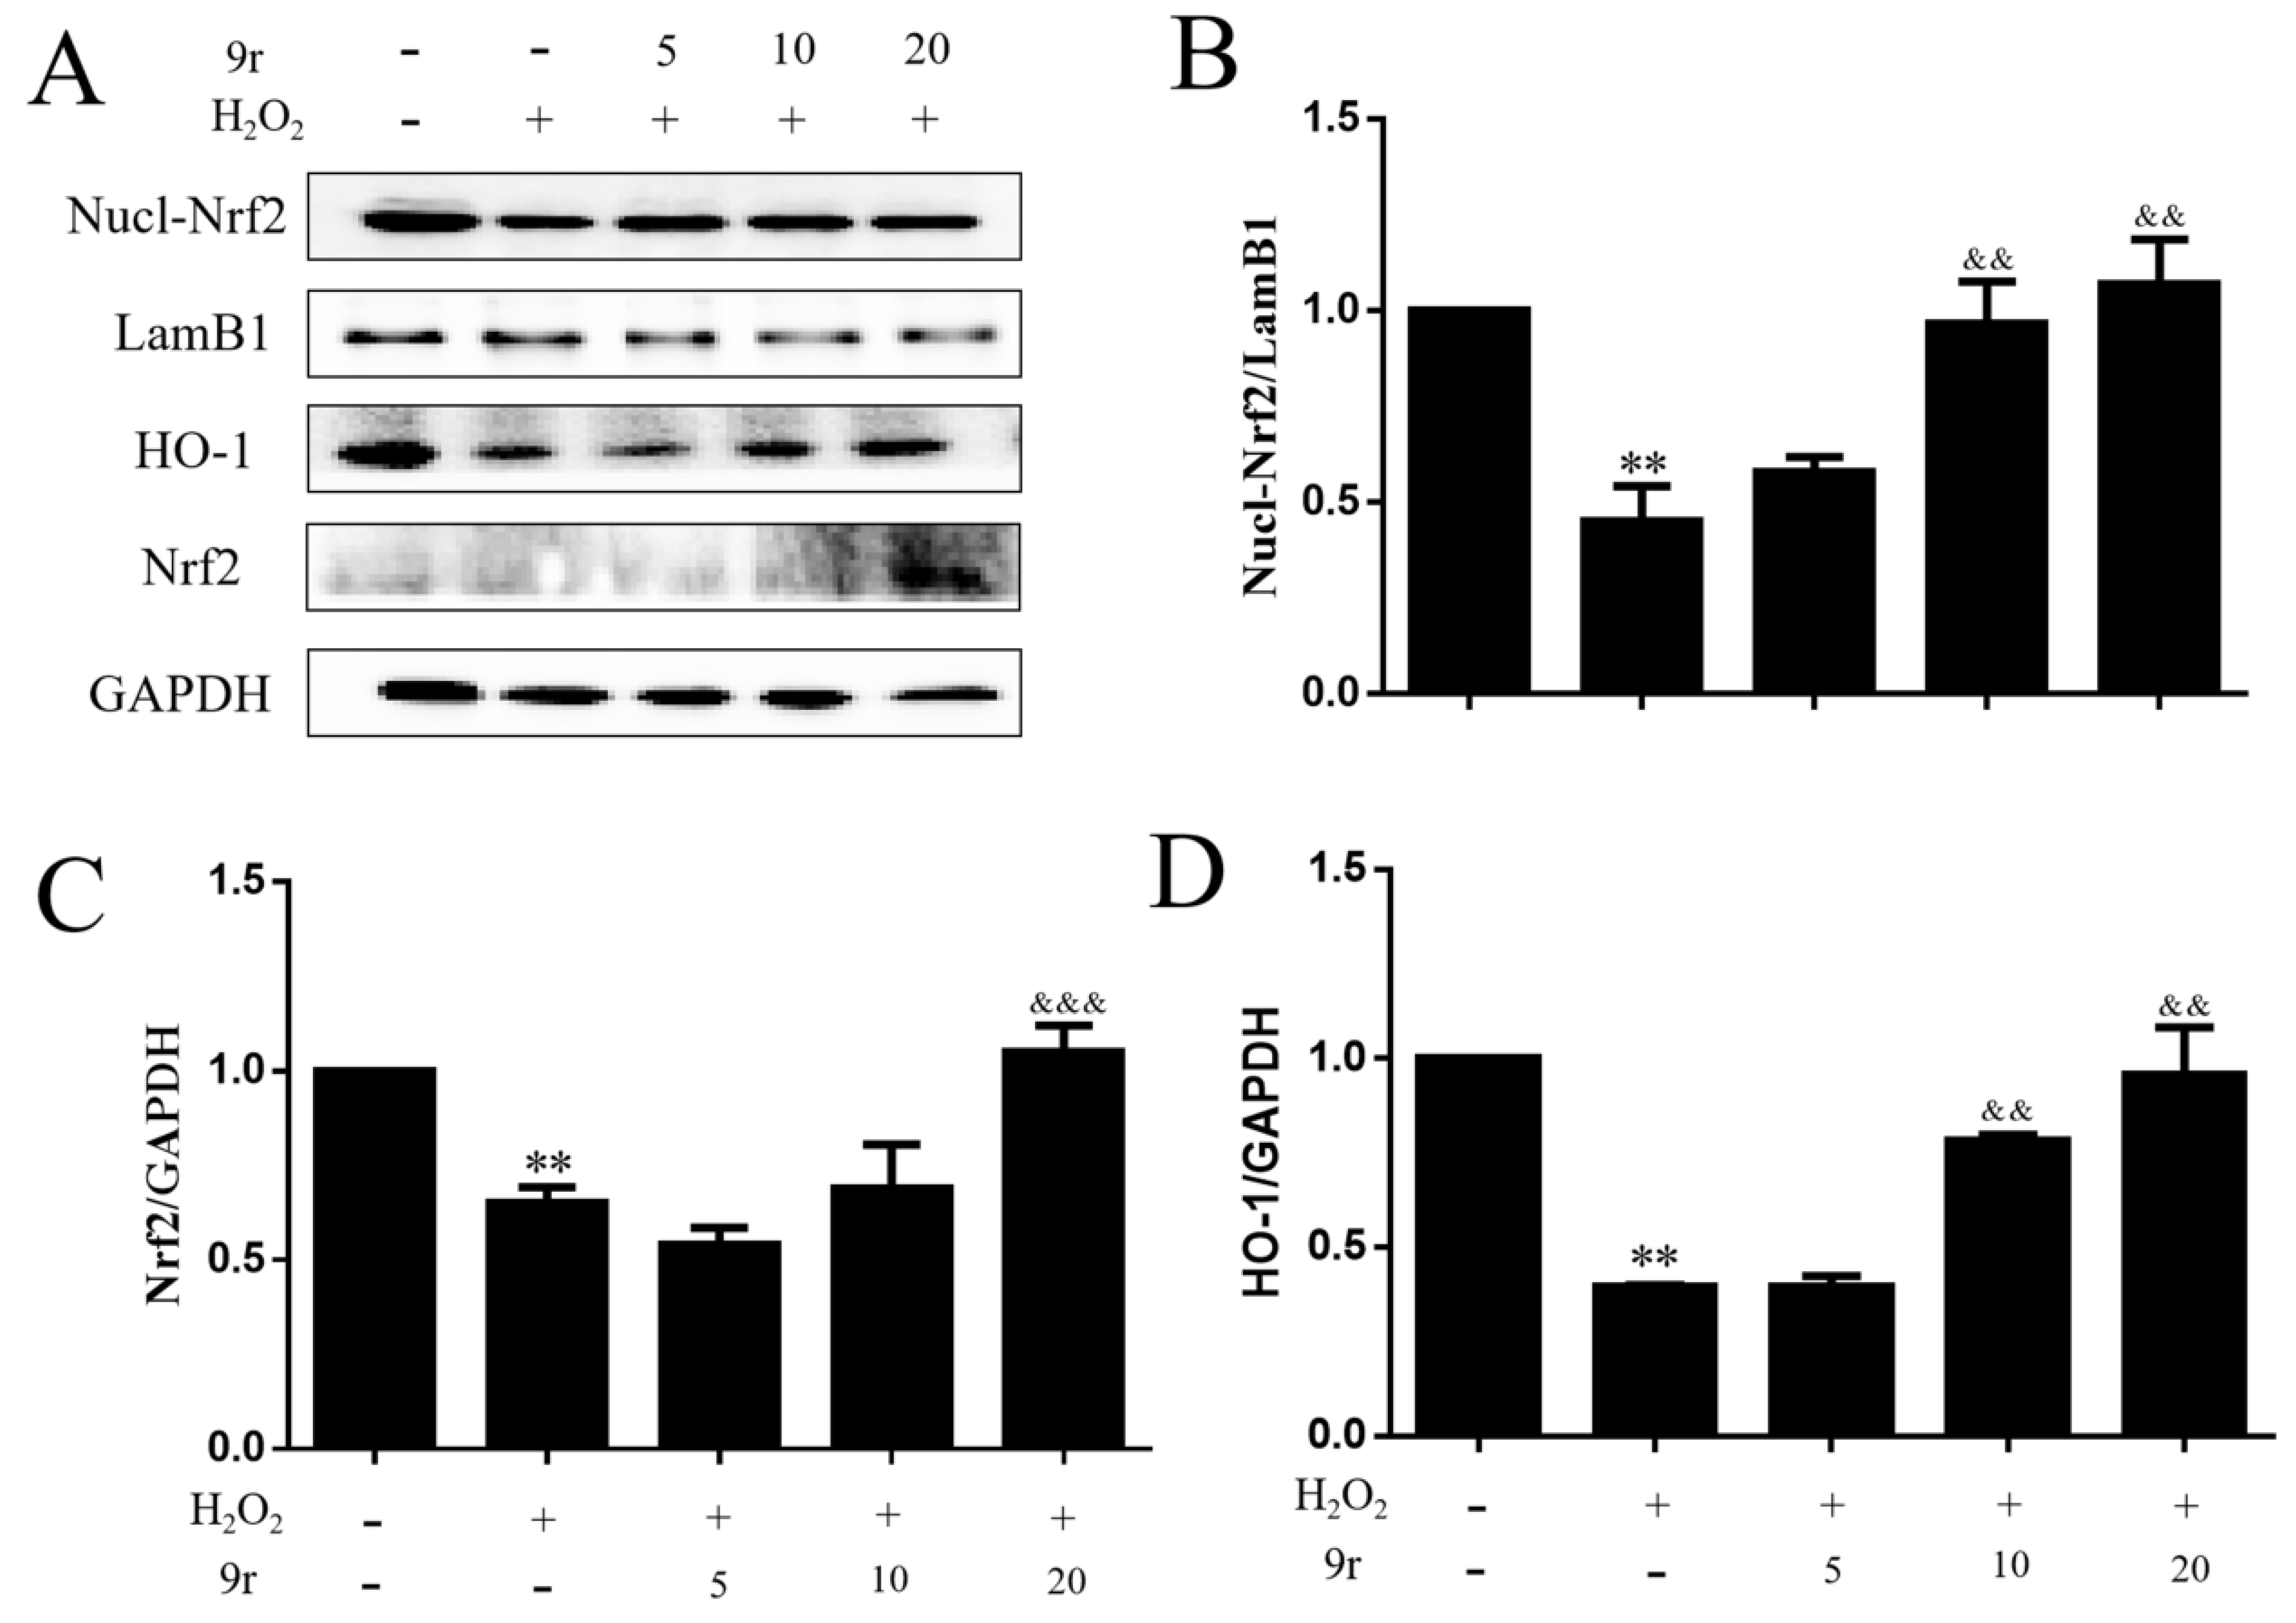
3.2.6. The Antioxidant Capacity of 9r Is Mediated by the Nrf2/HO-1 Signaling Pathway
3.2.7. 9r Exerted Antioxidant Activity Depending on the Activation of Nrf2
3.2.8. 9r Promotes Cell Survival by Regulating the IL-6/Src/Stat3 Signaling Pathway
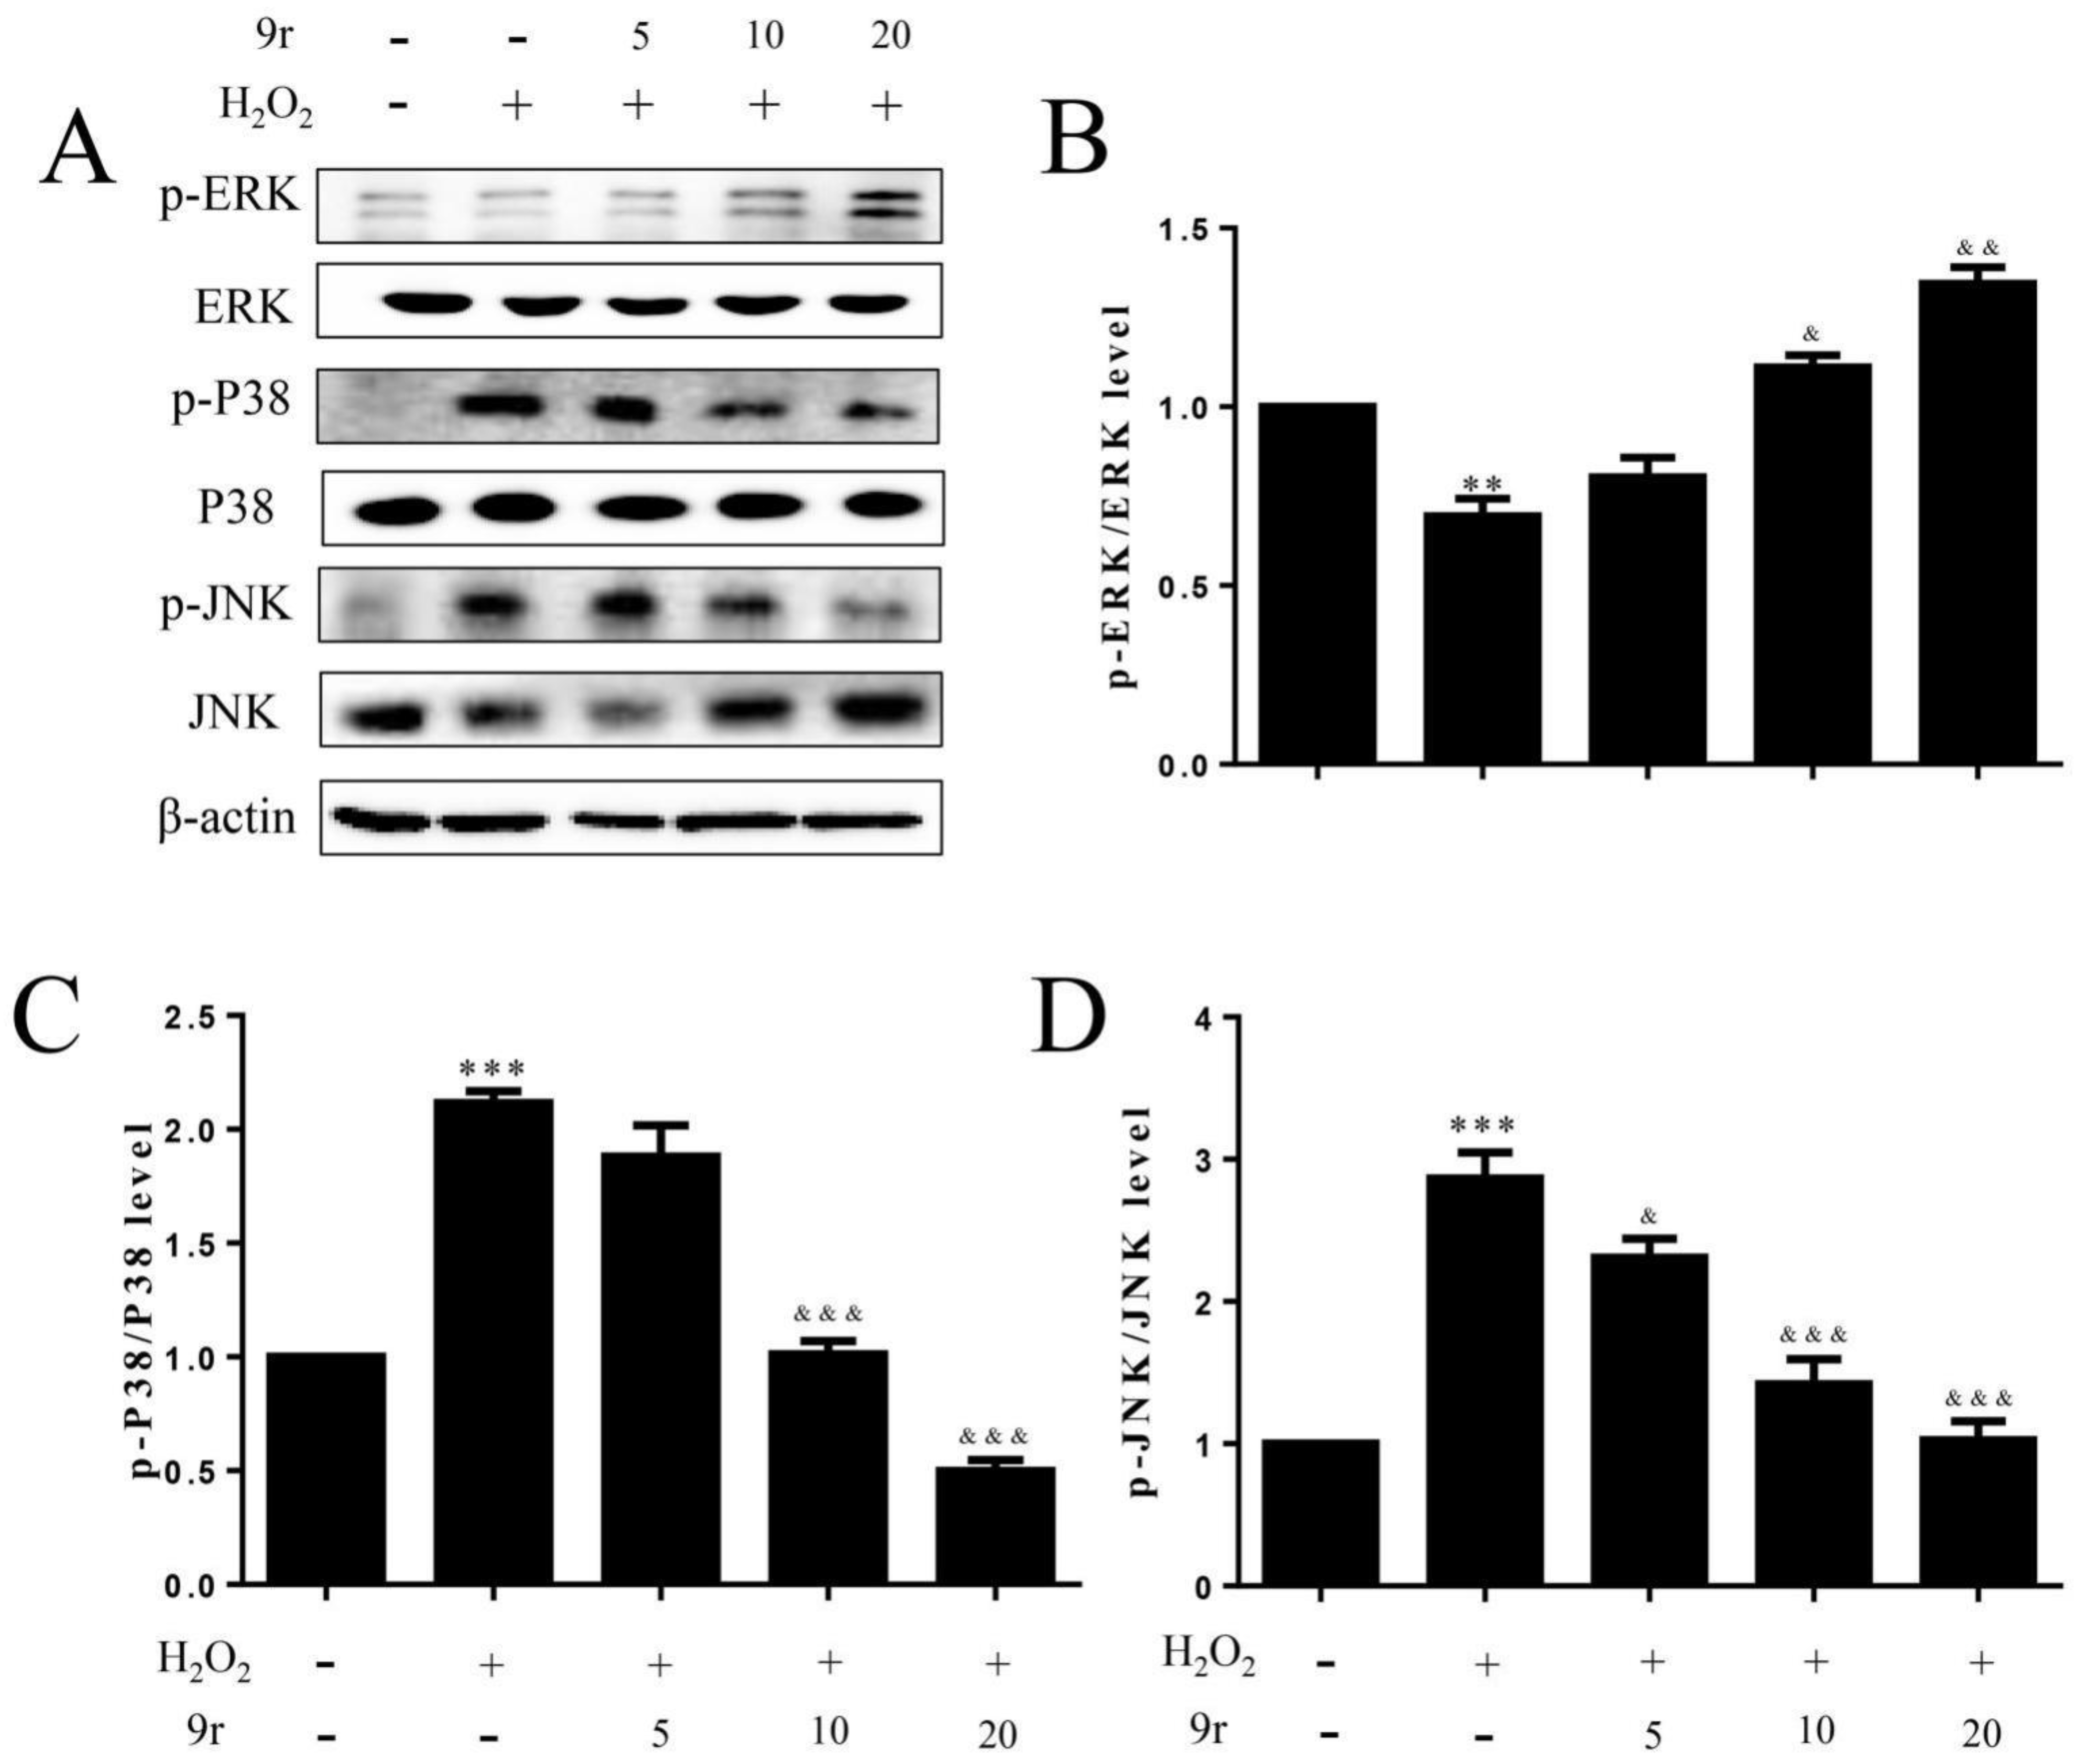
3.2.9. 9r Regulates the PI3K and MAPK Signaling Pathways to Promote Cell Survival
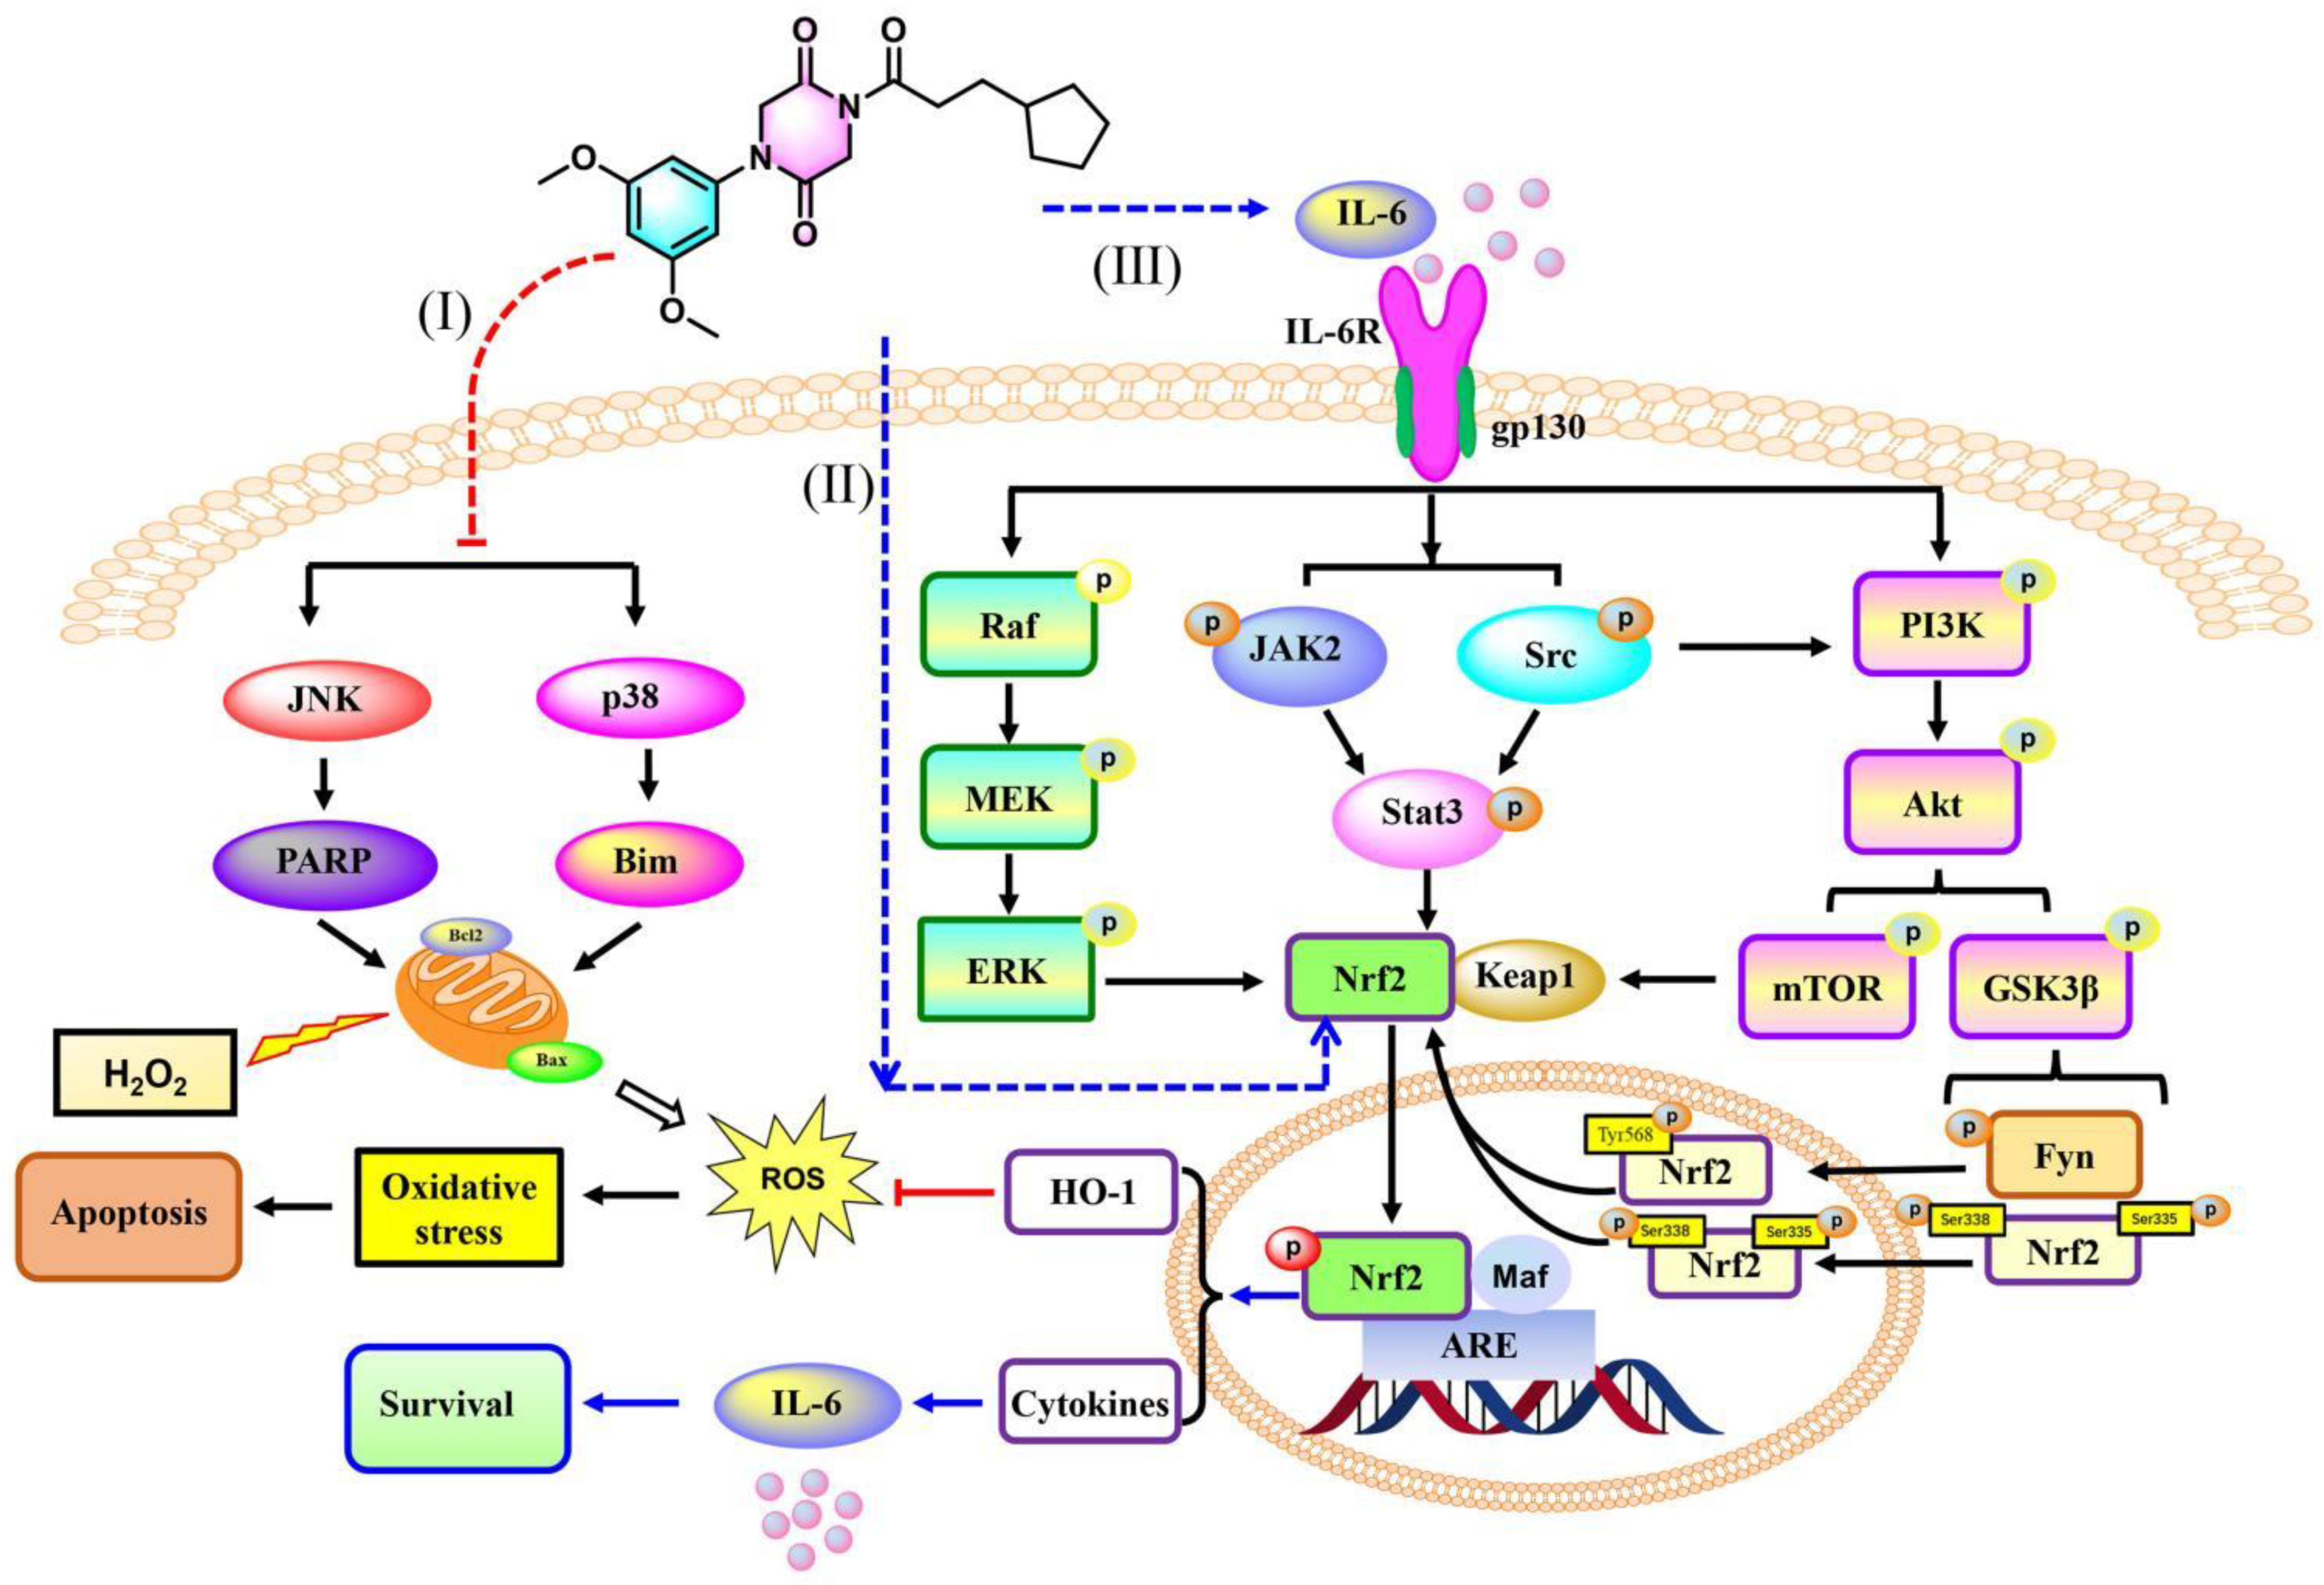
3.2.10. 9r Regulates Oxidative Stress via an IL-6/Nrf2 Positive-Feedback Loop
4. Conclusions
Supplementary Materials
Author Contributions
Funding
Institutional Review Board Statement
Informed Consent Statement
Data Availability Statement
Acknowledgments
Conflicts of Interest
References
- Radi, E.; Formichi, P.; Battisti, C.; Federico, A. Apoptosis and Oxidative Stress in Neurodegenerative Diseases. J. Alzheimer’s Dis. 2014, 42, S125–S152. [Google Scholar] [CrossRef] [PubMed]
- Pizzino, G.; Irrera, N.; Cucinotta, M.; Pallio, G.; Mannino, F.; Arcoraci, V.; Squadrito, F.; Altavilla, D.; Bitto, A. Oxidative Stress: Harms and Benefits for Human Health. Oxidative Med. Cell. Longev. 2017, 2017, 8416763. [Google Scholar] [CrossRef] [PubMed]
- Bello-Medina, P.C.; Rodríguez-Martínez, E.; Prado-Alcalá, R.A.; Rivas-Arancibia, S. Contaminación por ozono, estrés oxidativo, plasticidad sináptica y neurodegeneración. Neurología 2022, 37, 277–286. [Google Scholar] [CrossRef]
- Lee, W.; Lee, C.H.; Lee, J.; Jeong, Y.; Park, J.-H.; Nam, I.-J.; Lee, D.S.; Lee, H.M.; Lee, J.; Yun, N.; et al. Botanical Formulation, TADIOS, Alleviates Lipopolysaccharide (LPS)-Induced Acute Lung Injury in Mice via Modulation of the Nrf2-HO-1 Signaling Pathway. J. Ethnopharmacol. 2021, 270, 113795. [Google Scholar] [CrossRef]
- Heinrich, P.C.; Behrmann, I.; Haan, S.; Hermanns, H.M.; Müller-Newen, G.; Schaper, F. Principles of Interleukin (IL)-6-Type Cytokine Signalling and Its Regulation. Biochem. J. 2003, 374, 1–20. [Google Scholar] [CrossRef] [PubMed]
- Kummer, K.K.; Zeidler, M.; Kalpachidou, T.; Kress, M. Role of IL-6 in the Regulation of Neuronal Development, Survival and Function. Cytokine 2021, 144, 155582. [Google Scholar] [CrossRef]
- Wruck, C.J.; Streetz, K.; Pavic, G.; Götz, M.E.; Tohidnezhad, M.; Brandenburg, L.-O.; Varoga, D.; Eickelberg, O.; Herdegen, T.; Trautwein, C.; et al. Nrf2 Induces Interleukin-6 (IL-6) Expression via an Antioxidant Response Element within the IL-6 Promoter. J. Biol. Chem. 2011, 286, 4493–4499. [Google Scholar] [CrossRef]
- Li, J.; Calkins, M.J.; Johnson, D.A.; Johnson, J.A. Role of Nrf2-Dependent ARE-Driven Antioxidant Pathway in Neuroprotection. Methods Mol. Biol. 2007, 399, 67–78. [Google Scholar] [CrossRef]
- Konishi, T.; Konoshima, T.; Daikonya, A.; Kitanaka, S. Neolignans from Piper Futokadsura and Their Inhibition of Nitric Oxide Production. Chem. Pharm. Bull. 2005, 53, 121–124. [Google Scholar] [CrossRef]
- Li, N.; Wu, J.; Hasegawa, T.; Sakai, J.; Bai, L.; Wang, L.; Kakuta, S.; Furuya, Y.; Ogura, H.; Kataoka, T.; et al. Bioactive Lignans from Peperomia Duclouxii. J. Nat. Prod. 2007, 70, 544–548. [Google Scholar] [CrossRef]
- Xu, W.-H.; Zhao, P.; Wang, M.; Liang, Q. Naturally Occurring Furofuran Lignans: Structural Diversity and Biological Activities. Nat. Prod. Res. 2019, 33, 1357–1373. [Google Scholar] [CrossRef]
- Chen, C.-C.; Chen, H.-Y.; Shiao, M.-S.; Lin, Y.-L.; Kuo, Y.-H.; Ou, J.-C. Inhibition of Low Density Lipoprotein Oxidation by Tetrahydrofurofuran Lignans from Forsythia Suspensa and Magnolia Coco. Planta Med. 1999, 65, 709–711. [Google Scholar] [CrossRef] [PubMed]
- Wang, A.; Fan, Y.; Ouyang, Q.; Fan, C.; Lin, B.; Liu, J.; Xu, Y. Antiproliferative Ent-Kaurane Diterpenoids Isolated from the Roots of Zea mays L. Fitoterapia 2019, 134, 44–49. [Google Scholar] [CrossRef] [PubMed]
- Sun, S.; Xu, S.; Yan, Y.; Xie, P.; Lam, W. Optimized High Performance Liquid Chromatography Tandem Chemiluminescent Detector Applied to Assess the Antioxidative Activity of Caulis Stauntoniae Assisted by Chemometrics. Anal. Methods 2013, 5, 1837. [Google Scholar] [CrossRef]
- Tene, M.; Tane, P.; Sondengam, B.L.; Connolly, J.D. Lignans from the Roots of Echinops Giganteus. Phytochemistry 2004, 65, 2101–2105. [Google Scholar] [CrossRef]
- Venkataraman, R.; Gopalakrishnan, S. A Lignan from the Root of Ecbolium Linneanum Kurz. Phytochemistry 2002, 61, 963–966. [Google Scholar] [CrossRef]
- Brown, N. Bioisosteres and Scaffold Hopping in Medicinal Chemistry. Mol. Inform. 2014, 33, 458–462. [Google Scholar] [CrossRef]
- Sun, H.; Tawa, G.; Wallqvist, A. Classification of Scaffold-Hopping Approaches. Drug Discov. Today 2012, 17, 310–324. [Google Scholar] [CrossRef]
- Majumdar, K.; Ray, K.; Ganai, S. Intramolecular Aza-Wittig Reaction: A New Efficient Tool for the Construction of Piperazine 2,5-Dione Derivatives. Synlett 2010, 2010, 2122–2124. [Google Scholar] [CrossRef]
- Zhong, T.; Li, M.; Wu, H.; Wang, D.; Liu, J.; Xu, Y.; Fan, Y. Novel Flavan-3,4-Diol Vernicidin B from Toxicodendron Vernicifluum (Anacardiaceae) as Potent Antioxidant via IL-6/Nrf2 Cross-Talks Pathways. Phytomedicine 2022, 100, 154041. [Google Scholar] [CrossRef]
- Liguori, I.; Russo, G.; Curcio, F.; Bulli, G.; Aran, L.; Della-Morte, D.; Gargiulo, G.; Testa, G.; Cacciatore, F.; Bonaduce, D.; et al. Oxidative Stress, Aging, and Diseases. Clin. Interv. Aging 2018, 13, 757–772. [Google Scholar] [CrossRef] [PubMed]
- Kudryavtseva, A.V.; Krasnov, G.S.; Dmitriev, A.A.; Alekseev, B.Y.; Kardymon, O.L.; Sadritdinova, A.F.; Fedorova, M.S.; Pokrovsky, A.V.; Melnikova, N.V.; Kaprin, A.D.; et al. Mitochondrial Dysfunction and Oxidative Stress in Aging and Cancer. Oncotarget 2016, 7, 44879–44905. [Google Scholar] [CrossRef] [PubMed]
- Kowalczyk, P.; Sulejczak, D.; Kleczkowska, P.; Bukowska-Ośko, I.; Kucia, M.; Popiel, M.; Wietrak, E.; Kramkowski, K.; Wrzosek, K.; Kaczyńska, K. Mitochondrial Oxidative Stress—A Causative Factor and Therapeutic Target in Many Diseases. Int. J. Mol. Sci. 2021, 22, 13384. [Google Scholar] [CrossRef] [PubMed]
- Ali, T.; Kim, T.; Rehman, S.U.; Khan, M.S.; Amin, F.U.; Khan, M.; Ikram, M.; Kim, M.O. Natural Dietary Supplementation of Anthocyanins via PI3K/Akt/Nrf2/HO-1 Pathways Mitigate Oxidative Stress, Neurodegeneration, and Memory Impairment in a Mouse Model of Alzheimer’s Disease. Mol. Neurobiol. 2018, 55, 6076–6093. [Google Scholar] [CrossRef]
- Kwon, O.Y.; Lee, S.H. Ishige Okamurae Suppresses Trimethyltin-Induced Neurodegeneration and Glutamate-Mediated Excitotoxicity by Regulating MAPKs/Nrf2/HO-1 Antioxidant Pathways. Antioxidants 2021, 10, 440. [Google Scholar] [CrossRef]
- Loboda, A.; Damulewicz, M.; Pyza, E.; Jozkowicz, A.; Dulak, J. Role of Nrf2/HO-1 System in Development, Oxidative Stress Response and Diseases: An Evolutionarily Conserved Mechanism. Cell. Mol. Life Sci. 2016, 73, 3221–3247. [Google Scholar] [CrossRef]
- Hirano, T.; Ishihara, K.; Hibi, M. Roles of STAT3 in Mediating the Cell Growth, Differentiation and Survival Signals Relayed through the IL-6 Family of Cytokine Receptors. Oncogene 2000, 19, 2548–2556. [Google Scholar] [CrossRef] [PubMed]
- Tawfig, N. Proinflammatory Cytokines and Periodontal Disease. J. Dent. Probl. Solut. 2016, 3, 12–17. [Google Scholar] [CrossRef]
- Chepurnova, D.A.; Samoilova, E.V.; Anisimov, A.A.; Verin, A.D.; Korotaeva, A.A. Compounds of IL-6 Receptor Complex during Acute Lung Injury. Bull. Exp. Biol. Med. 2018, 164, 609–611. [Google Scholar] [CrossRef]
- Mihara, M.; Hashizume, M.; Yoshida, H.; Suzuki, M.; Shiina, M. IL-6/IL-6 Receptor System and Its Role in Physiological and Pathological Conditions. Clin. Sci. 2012, 122, 143–159. [Google Scholar] [CrossRef]
- Narazaki, M.; Kishimoto, T. The Two-Faced Cytokine IL-6 in Host Defense and Diseases. Int. J. Mol. Sci. 2018, 19, 3528. [Google Scholar] [CrossRef] [PubMed]
- Yuan, Y.; Shan, N.; Tan, B.; Deng, Q.; Liu, Y.; Wang, H.; Luo, X.; He, C.; Luo, X.; Zhang, H.; et al. SRC-3 Plays a Critical Role in Human Umbilical Vein Endothelial Cells by Regulating the PI3K/Akt/MTOR Pathway in Preeclampsia. Reprod. Sci. 2018, 25, 748–758. [Google Scholar] [CrossRef] [PubMed]


| Compound | R1 | R2 | R3 | R4 |
|---|---|---|---|---|
| 9a |  |  |  | |
| 9b |  | | | |
| 9c | |  | | |
| 9d | | | | |
| 9e | | | | |
| 9f | | | | |
| 9g |  | | | |
| 9h |  | | | |
| 9i |  | | | |
| 9j |  | | | |
| 9k |  | | | |
| 9l |  | | | |
| 9m |  | | | |
| 9n |  | | | |
| 9o |  | | | |
| 9p |  | | | |
| 9q |  | | | |
| 9r |  | | | |
| 9s |  | | | |
| Compound | Viabilities of SH-SY5Y Cells a |
|---|---|
| 20 (μM) | |
| 9a | 38.26 ± 1.12 |
| 9b | 36.09 ± 2.63 |
| 9c | 49.65 ± 9.64 |
| 9d | 59.20 ± 6.23 |
| 9e | 59.12 ± 5.97 |
| 9f | 47.01 ± 4.87 |
| 9g | 28.15 ± 1.94 |
| 9h | 41.24 ± 1.46 |
| 9i | 23.28 ± 1.75 |
| 9j | 38.62 ± 1.17 |
| 9k | 34.41 ± 3.99 |
| 9l | 25.12 ± 2.96 |
| 9m | 21.52 ± 1.82 |
| 9n | 31.55 ± 5.10 |
| 9o | 61.34 ± 7.52 |
| 9p | 37.71 ± 3.34 |
| 9q | 42.41 ± 3.91 |
| 9r | 70.19 ± 5.64 |
| 9s | 55.37 ± 5.04 |
| Neohesperidin | 65.60 ± 2.72 |
| Syringaresinol | 45.39 ± 1.37 |
| H2O2 | 32.85 ± 10.90 |
Publisher’s Note: MDPI stays neutral with regard to jurisdictional claims in published maps and institutional affiliations. |
© 2022 by the authors. Licensee MDPI, Basel, Switzerland. This article is an open access article distributed under the terms and conditions of the Creative Commons Attribution (CC BY) license (https://creativecommons.org/licenses/by/4.0/).
Share and Cite
Xiong, L.; Wu, H.; Zhong, T.; Luo, F.; Li, Q.; Li, M.; Fan, Y. Design, Synthesis and Evaluation of Novel 1,4-Disubstituted Piperazine-2,5-dione Derivatives as Antioxidants against H2O2-Induced Oxidative Injury via the IL-6/Nrf2 Loop Pathway. Antioxidants 2022, 11, 2014. https://doi.org/10.3390/antiox11102014
Xiong L, Wu H, Zhong T, Luo F, Li Q, Li M, Fan Y. Design, Synthesis and Evaluation of Novel 1,4-Disubstituted Piperazine-2,5-dione Derivatives as Antioxidants against H2O2-Induced Oxidative Injury via the IL-6/Nrf2 Loop Pathway. Antioxidants. 2022; 11(10):2014. https://doi.org/10.3390/antiox11102014
Chicago/Turabian StyleXiong, Liang, Hongshan Wu, Ting Zhong, Fang Luo, Qing Li, Mei Li, and Yanhua Fan. 2022. "Design, Synthesis and Evaluation of Novel 1,4-Disubstituted Piperazine-2,5-dione Derivatives as Antioxidants against H2O2-Induced Oxidative Injury via the IL-6/Nrf2 Loop Pathway" Antioxidants 11, no. 10: 2014. https://doi.org/10.3390/antiox11102014
APA StyleXiong, L., Wu, H., Zhong, T., Luo, F., Li, Q., Li, M., & Fan, Y. (2022). Design, Synthesis and Evaluation of Novel 1,4-Disubstituted Piperazine-2,5-dione Derivatives as Antioxidants against H2O2-Induced Oxidative Injury via the IL-6/Nrf2 Loop Pathway. Antioxidants, 11(10), 2014. https://doi.org/10.3390/antiox11102014