Abstract
N-acetylcysteine (NAC) and vitamin D provide effective neuroprotection in animal models of severe or inflammation-sensitized hypoxic ischemic encephalopathy (HIE). To translate these FDA-approved drugs to HIE neonates, we conducted an early phase, open-label trial of 10 days of NAC (25, 40 mg/kg q12h) + 1,25(OH)2D (calcitriol 0.05 mg/kg q12h, 0.03 mg/kg q24h), (NVD), for pharmacokinetic (PK) estimates during therapeutic hypothermia and normothermia. We paired PK samples with pharmacodynamic (PD) targets of plasma isoprostanoids, CNS glutathione (GSH) and total creatine (tCr) by serial MRS in basal ganglia (BG) before and after NVD infusion at five days. Infants had moderate (n = 14) or severe HIE (n = 16), funisitis (32%), and vitamin D deficiency (75%). NVD resulted in rapid, dose-responsive increases in CNS GSH and tCr that correlated positively with plasma [NAC], inversely with plasma isofurans, and was greater in infants with lower baseline [GSH] and [tCr], suggesting increases in these PD markers were titrated by neural demand. Hypothermia and normothermia altered NAC PK estimates. NVD was well tolerated. Excluding genetic syndromes (2), prolonged ECMO (2), lost-to-follow-up (1) and SIDS death (1), 24 NVD treated HIE infants have no evidence of cerebral palsy, autism or cognitive delay at 24–48 months. These data confirm that low, safe doses of NVD in HIE neonates decreased oxidative stress in plasma and CNS, improved CNS energetics, and are associated with favorable developmental outcomes at two to four years.
1. Introduction
Therapeutic hypothermia provides significant neuroprotection for half of neonates with uncomplicated hypoxic ischemic encephalopathy (HIE), but not in more severe HIE or HIE complicated by chorioamnionitis [1,2,3,4,5,6]. Oxidative stress is both an early and persistent contributor to pathology in HIE [7,8,9,10,11]. Glutathione (GSH) is the major intracellular antioxidant which scavenges reactive oxygen species (ROS) and is essential for cell survival [12,13]. Evidence in animal models and humans indicate that oxidative stress depletes reduced GSH within two hours, which is not mitigated by hypothermia alone [14,15,16]. Increased production of superoxide and lipid peroxides persists for days to weeks after moderate to severe HI/stroke, with significant depletion of GSH in the striatum, hippocampus, cortex, and cerebellum [17,18,19]. Additionally, the decrease in GSH potentiates glutamate toxicity and FAS-activated cell death [20,21,22,23]. Increasing intracellular antioxidant reserves in the brain very early after HI may be key to halting progression of neural cell death and improving neuroprotection for HIE infants who do not respond to hypothermia.
Oxidative stress is a trigger for many inflammatory cascades, and early restoration of normal intracellular redox potential moderates these same pathways. Increasing the CNS pool of available GSH in the metabolically active basal ganglia (BG) may improve neuroprotection after significant neonatal HIE [24]. N-acetylcysteine (NAC) effectively mitigates oxidative stress in animals and humans [9,25,26]. NAC crosses the blood–brain barrier, provides the rate-limiting substrate for GSH synthesis, increases intracellular GSH concentrations and improves cell survival in animal models and humans with multiple etiologies of oxidative stress [9,27,28,29,30,31,32,33,34,35,36]. In preclinical work, we previously demonstrated that NAC plus hypothermia improved outcomes over hypothermia alone in neonatal female, but not male, rats subjected to severe HI [37]. When 1,25(OH)2D (calcitriol) was co-administered with NAC and hypothermia, male neonatal rats also showed decreased neuroinflammation and improved neuroprotection [16]. Active vitamin D is a neuro-steroid involved in myelination, neuroplasticity and normal development [38,39,40]. While anti-inflammatory effects are well described, 1,25(OH)2D also induces synthesis of glutathione reductase, the enzyme responsible for regeneration of GSH from oxidized glutathione disulfide, and thereby increases GSH [41,42,43,44,45]. We postulated that NAC plus 1,25(OH)2D (NVD) would synergistically increase GSH, decrease oxidative stress and improve developmental outcomes in human neonates with severe and complicated HIE [16,46,47].
Therapeutic development of antioxidants in clinical translational neuroscience has been hampered by a lack of careful measurement of biomarkers in target tissue to ensure dosing for pharmacodynamic effect (PD). Biomarkers of oxidative stress include reduced glutathione (GSH) and protein and lipid peroxidation products, which are usually measured in blood. MR spectroscopy (MRS) can directly measure CNS GSH in vivo after injury or treatment [14,29,48,49,50,51]. Therefore, we designed this translational study to determine (1) the doses of NAC and 1,25(OH)2D that effectively mitigate oxidative stress in CNS and blood in HIE neonates treated with hypothermia, (2) the duration of NAC and 1,25(OH)2D effect on CNS metabolites and any dose-limiting side effects during hypothermia or normothermia, and (3) the association of improved oxidative stress biomarkers with neurodevelopmental outcomes at >2 years of age.
In a previous rapid communication, we reported our validation of MRS quantification of GSH in this cohort of convalescing HIE infants, with mean BG [GSH] of 1.6 ± 0.2 mM on day of life (DOL) 5 after hypothermia treatment, which is markedly lower than 2.5 ± 0.8 mM previously reported in healthy term neonates [52]. We also reported that NAC with or without calcitriol rapidly and significantly increased [GSH] in the BG to 1.93 ± 0.23 mM (p < 0.0001) on DOL 5–6 [15].
In this manuscript, we report the results of the complete clinical trial of NAC and calcitriol (NVD) in neonates with HIE undergoing hypothermia. We quantified plasma lipid peroxidation products and CNS metabolomics with paired plasma NVD concentrations before and after NVD and employ novel, serial MRS to show PD dose response and duration of GSH response in the BG, a major CNS target for neuroprotection in HIE. We show that NAC and calcitriol were safe and determine the dose tolerability and pharmacokinetics (PK) during hypothermia and normothermia. Finally, we report on developmental outcomes of study participants from two to four years of age.
2. Materials and Methods
2.1. Study Design Overview
We enrolled 30 neonates with moderate to severe HIE receiving hypothermia in this Institutional Review Board (IRB)-approved open-label, early phase study (NCT 04643821). We administered intravenous (iv) NAC and calcitriol (NVD) daily for 10 days. We obtained blood samples for NVD PK estimates and oxidative stress markers around the first dose and during 72 h of hypothermia (HT) and around the 10th–11th dose on DOL 5–6 during subsequent normothermia (NT). We paired plasma PK and oxidative stress samples around the 10th or 11th doses with MRS before and after NVD infusion on DOL 5–6, to determine CNS PD dose response in [GSH] and duration of the CNS effect. We were powered to detect 20% [GSH] change of NVD with 20 paired MRS datasets. Our primary safety outcomes were hypotension (NAC) and hypercalcemia (calcitriol). MRS quantification was blinded to dose and condition.
2.1.1. Consent and Enrollment
This study was approved by the Medical University of South Carolina Institutional Review Board. We approached parents within 6 h of birth and obtained written informed consent according to the Declaration of Helsinki, prior to enrolling 30 consecutive neonates with HIE in MUSC’s Neonatal Intensive Care Unit from 2014 to 2017. All infants had moderate to severe HIE by modified Sarnat staging [53,54], and qualified for cooling for 72 h according to standard HIE criteria: Gestational age ≥ 34 weeks, and they had one factor indicating an acute sentinel event (cord or baby pH ≤ 7.0, base deficit ≥ −13, Apgar score ≤ 5 at 10 min, continued resuscitation after 5 min due to absence of respiratory effort), and two signs of stage 2/3 encephalopathy [55].
2.1.2. Standard of Care: HIE Protocol and Hypothermia Treatment
Infants were cooled to 33–33.5 °C Tr for 72 h (Criticool™, Belmont Medical Technologies, Billerica, MA), and rewarmed at 0.2 °C/h. Infants received nothing by mouth through rewarming other than oral care with breast milk. Parenteral nutrition without cysteine, but with vitamin D3 400 IU/day and lipids (0.5–2 gm/kg/d), was administered during hypothermia. Feeds were introduced if clinically stable on DOL 4–5. Infants received IV morphine 0.02 mg/kg every 4 h for comfort during hypothermia that was increased as clinically required in infants with pulmonary hypertension (PPHN). Standard monitoring during hypothermia included serum lactate, ionized and total calcium, electrolytes, clotting studies, liver function tests, cardiac and renal panels, and circulating cell counts. Continuous 20 montage video EEG was monitored from admission until completion of rewarming. Seizures were defined as electrographic seizure activity. Head ultrasound with Doppler blood flow of three cerebral arteries was obtained within 12 h of admission using a Philips Epic 5 scanner (Koninklijke Philips N.V., Amsterdam, The Netherlands) with a 9–4 MHz curvilinear transducer, and we recorded the average resistive index and time average maximum velocity. Echocardiograms were obtained in all infants. PPHN was defined as evidence of right to left intra- or extracardiac shunting through the patent ductus arteriosus. An MRI and MRS were obtained on day of life 5–6 after rewarming, on a 3T Siemens Skyra, using standard sequences for T1, T2, ADC, and DKI. For MRS, single voxels were placed in the left BG and right frontal white matter. MRI scans were read by a single neuroradiologist (MY).
2.1.3. NAC and Calcitriol Infusion
The study drugs were administered by IV within 4–9 h after birth and continued until DOL 10 or discharge. NAC was infused over 60 min, and calcitriol by IV push. For the first 20 participants the NAC dose was held constant at 25 mg/kg/dose every 12 h while determining the optimal dose and timing of calcitriol. For the next 10 participants, the NAC dose was increased to 40 mg/kg, keeping the calcitriol dose constant. Treatment groups were NAC 25 mg/kg/dose + calcitriol 0.05 mcg/kg/dose iv q12h (n = 10), NAC 25 mg/kg/dose q12h + calcitriol 0.03 mcg/kg/dose q24h (n = 10), or NAC 40 mg/kg/dose q12h + calcitriol 0.03 mcg/kg/dose q24h (n = 10). Both study drugs were held if an infant had untreated/refractory hypotension at time of dosing (mean BP < 40 mmHg). Calcitriol was held for ionized calcium (iCa++) > 1.3 mmol/L, and we limited calcium in parenteral nutrition. An early calcitriol PK analysis estimated serum calcitriol half-life to be 28.2 h during hypothermia and mean peak [1,25(OH)2D] = 263 ± 72 pmol/L (first dose), increasing to 434 ± 146 pmol/L (sixth dose), indicating continued accumulation with 0.05 mcg/kg/dose q12h. Subsequently the calcitriol dose was decreased to 0.03 mcg/kg/dose q24h (n = 20), but still within the range of effective doses in our preclinical studies [16].
2.2. Magnetic Resonance Spectroscopy
2.2.1. MRS Protocol
On DOL 5–6 after rewarming, clinically stable HIE neonates had MRS scans with paired blood samples for NVD and lipid peroxidation products before and after the 10th or 11th NVD dose, using a single voxel placed in either the BG or frontal white matter, with stimulated echo acquisition mode (STEAM), echo time (TE) 20 ms, and point resolved spectroscopy (PRESS) TE 270 ms on a Siemens 3T Skyra, as previously described [15]. Infants received both NAC and calcitriol, or only NAC if the calcitriol dose was held or not given at that time with 24 h dosing, as scans had to be conducted at night. The neuroimaging protocol (Figure 1) consisted of: (1) first MRS immediately preceding NVD dose administration (trough); (2) calcitriol and NAC infusion during the clinical MRI; (3) second MRS immediately after clinical MRI (12–30 min after NVD infusion, peak); (4) third delayed MRS (2–6 h after infusion as the clinical schedule allowed, post-peak) to estimate the duration of NAC effect on [GSH] in the CNS; (5) MRS/diffusion imaging obtained between 10–40 d (convalescent). Sedation with low dose morphine or lorazepam was administered for clinical indications during acute scans. Scans required 90 min for the acute protocol, 12 min for the delayed scan. The PI (neonatologist) and neonatal intensive care unit nurse were present during all scans.
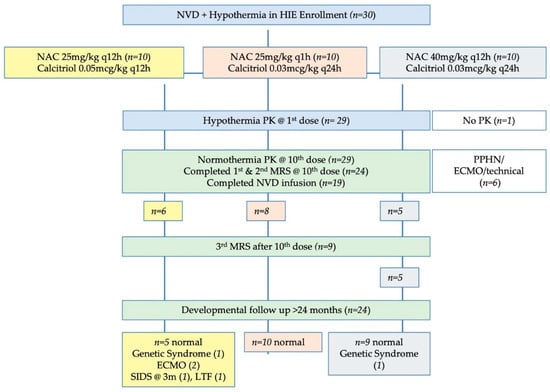
Figure 1.
Study flow diagram. Note that the number of infants with developmental follow-up flows from the original number of infants in each dosing group, not just the infants with complete NVD infusions or complete MRS data. The number of infants with useable data for each MRS metabolite may vary slightly from these numbers due to MRS quality controls for spectral fit which are unique to each metabolite.
2.2.2. LCModel Data Fitting
MRS spectra were fit with LCModel by an investigator blinded to subject and dose, using a custom basis set that included GSH with a cysteinyl peak at 2.95 ppm, as well as standard metabolites: total Choline (tCho: GPC+PCho), total creatine (tCr: Cr+PCr), total N-acetylaspartate (NAA: NAA+NAAG), myoinositol (mIns), glutamate and glutamine (GLX)] [15]. Absolute metabolite concentrations were determined with water normalization from the unsuppressed water scan. Representative 3T MRS of the GSH peak at 2.95 ppm and validation of quantification has been previously published [15]. We excluded spectra for low signal/noise < 5, or coefficient of variation > 15% by LCModel fit.
2.3. Pharmacokinetic Studies
2.3.1. Drug Concentrations
Blood samples were collected for HT and NT PK: before and 0.5 h, 1 h, 11.5 h after first (HT) and tenth (NT) NAC/NVD doses, and for steady-state trough concentration (Cminss) prior to sixth (HT) and thirteenth doses (NT). Blood was collected in sodium EDTA (NAC) and plain tubes (vitamin D), and plasma/serum was aliquoted and frozen at −80 °C until assay. CSF obtained at 24 h with the peak NVD blood sample was frozen at −80 °C until assay. Total plasma NAC concentrations were determined using a modified, sensitive and specific HPLC method with a limit of detection of 0.15 mmol/L [56]. Serum 25(OH)D & 1,25(OH)2D concentrations were measured for 23 infants by RIA with detection limits of 2.5 mol/L for 25(OH)D and 36 pmol/L for 1,25(OH)2D [57]. Frozen aliquots of serum for 20 infants were shipped on dry ice for analysis of isoprostanoids markers of oxidative stress by LC-MS, as previously reported [18].
2.3.2. PK Analyses
Non-compartmental modeling methods (PK Solutions 2.0; Summit Research Services, Montrose, Colorado) generated PK parameters for NAC and 1,25(OH)2D: terminal elimination half-life (t1/2), volume of distribution (Vd), total body clearance (CL) and area under the concentration curve (AUC). Statistical comparisons between doses or HT and NT were conducted using a paired or unpaired 2-sided Student t test, with significant p-value < 0.05. (Graphpad Software 5.00, San Diego, CA, USA).
2.3.3. Developmental Follow-Up Testing
We performed standard developmental testing in high-risk follow-up or developmental clinics for most participants between 18–36 months of age. This battery of tests includes the Peabody Developmental Motor Scales, which have a high correlation with the Bayley III motor scores (r = 0.79–0.88 for fine, and gross/total motor scores, respectively [58]; Cognitive adaptive test (CAT) and Clinical linguistics and auditory milestone scale (CLAMS), which are both sensitive and specific for cognitive delays defined as the Bayley cognitive scaled score < 70 [59] and the Modified Checklist for Autism in Toddlers (MCHAT). Parental reports of development by phone were also obtained at 4 years of age to discern any intervening issues with language or speech. Two families moved out of the area and only provided parental reports of development and the use of special services.
2.3.4. Statistical Analysis
For 24 subjects with CNS metabolite concentrations regardless of completion of NVD infusion (intent-to-treat), two-tailed paired t-tests compared changes in metabolite concentrations in HIE neonates pre- and post-infusion with significance p < 0.05 (IBM SPSS® v.25, Armonk, NY, USA). ANOVAs were used to compare repeated measures of non-linear MRS metabolite concentrations for three time points within a subset of 10 subjects, with pairwise comparisons and Bonferroni correction. Partial eta squared values are reported for attributing the variance in metabolite concentration to time of scan around NVD infusion. Independent variables of NAC dose and sex were included in analyses. We performed both intent-to-treat analyses of CNS metabolites and efficacy analysis (infants who received full dosing) to account for infusion problems and lack of reliable dose delivery during some MR scans. Pearson’s or Spearman’s correlation coefficients were generated for comparisons of plasma NAC and lipid peroxidation products, and CNS metabolite concentrations, as appropriate.
3. Results
3.1. Clinical Characteristics
We enrolled 30 neonates with moderate to severe HIE receiving hypothermia in this IRB-approved open-label, early phase study (Figure 1). Study drugs were administered within 4–9 h after birth and continued through 10 days of life through a central or peripheral IV line.
Clinical demographic data of the neonatal HIE cohort are presented in Table 1. There were twice as many males as females. Infants exhibited neurologic signs of moderate to severe encephalopathy prior to enrollment and were hypothermic at first study drug administration. Out of the 19 placentas sent to pathology we demonstrated acute chorioamnionitis with funisitis in one third of HIE infants. One placenta showed fetal vasculopathy with thrombosis and many avascular villi. The numbers of infants in the worst quartiles for pH (6.5–6.8) and base deficit (>−20) are also given.

Table 1.
Demographics of HIE infants. Mean (SD) or number of subjects with specific conditions.
Six infants had PPHN prior to enrollment and four were treated with inhaled nitric oxide. Two of these infants required prolonged and complicated courses of extracorporeal membrane oxygenation (ECMO): one was placed on veno-venous by-pass and deteriorated over the next 24 h requiring conversion to veno-arterial bypass with overwhelming sepsis and pneumonia. Study drugs were held for 41 h during these events. The second infant was placed on ECMO within a few hours of birth and did not receive the first dose of study drug until blood pressure was stable on bypass. This infant later suffered an emergent circuit change due to circuit thrombosis with subsequent major pulmonary and CNS hemorrhages with hypoxia (1). Two genetic disorders were diagnosed after treatment completion (Prader Willi and congenital myasthenia gravis).
Resistive indices on Doppler ultrasound (n = 28) within 24 h of HIE birth were mean RI = 0.72 ± 0.11(0.53–0.94) in the anterior cerebral artery, 0.73 ± 0.11 (0.53–0.90) in the middle cerebral artery, and 0.74 ± 0.10 (0.54–1.0) in the basilar artery. Abnormal RI (<0.65 or >0.8) were noted in 13 infants in the middle cerebral and basilar arteries and 15 infants in the anterior cerebral artery [60,61].
MRI brain parenchymal signal abnormalities were present in 10 infants, largely demonstrating small foci of periventricular signal abnormality characterized by subcentimeter foci of T1 and T2 shortening with associated restricted diffusion (Table 1). Other imaging abnormalities included one patient with right sided subcentimeter cortical hemorrhages, one patient with left subinsular white matter injury, one patient with subcentimeter focus of T2 hyperintensity in the right basal ganglia, one patient with a subcentimeter right cerebellar hemorrhage, and one patient with left middle cerebral artery and additional multifocal small bilateral cortical infarctions. Among the 10 infants with minor abnormal parenchymal findings, four had small volume intraventricular hemorrhage. Among the patients with no brain parenchymal signal abnormalities, one patient had trace intraventricular hemorrhage. Seventeen infants had no identifiable abnormalities on their conventional MRIs.
3.2. NVD Safety and Tolerability
NAC 25 and 40 mg/kg/dose q12h were well tolerated without serious adverse events. We held NAC and calcitriol doses for urgent cannulation for ECMO per IRB-approved protocol. Patients on ECMO received an NAC loading dose to account for increased Vd of the ECMO circuit. Calcitriol dose was not altered.
We held 26 calcitriol doses for elevated iCa++ (mean iCa++ = 1.42 ± 0.06 mM), which were not related to dose or interval. iCa++ was elevated in five out of ten infants receiving calcitriol 0.05 mcg/kg q12h (1.46 ± 0.02 mM), and 18 out of 20 infants receiving calcitriol 0.03 mcg/kg q24h (iCa++ 1.41 ± 0.07 mM). Many of the infants had calcitriol doses held while on full feeds, when ionized calcium concentrations generally increased. Therefore, the mean duration of calcitriol dosing was 5.7 ± 2.1 days. We observed no clinical effects of mildly elevated ionized calcium, which was managed by withholding calcitriol dosing and/or decreasing calcium in parenteral nutrition. Elevated iCa++ were not associated with elevated total serum calcium concentrations (all < 12 mg/dL).
3.3. NAC and Vitamin D Pharmacokinetics
3.3.1. NAC PK
We found significant differences in NAC PK parameters between HT and NT periods, with lower clearance and longer half-life during hypothermia (Table 2, Supplementary Table S1, Figure 2A–D). Steady-state NAC trough (Cminss) concentrations were low during both periods with q12h dosing. NAC PK did not significantly differ between calcitriol dosing groups or when ECMO patients were excluded from analysis.
Table 2.
NAC and 1,25(OH)2D PK during HT and NT.
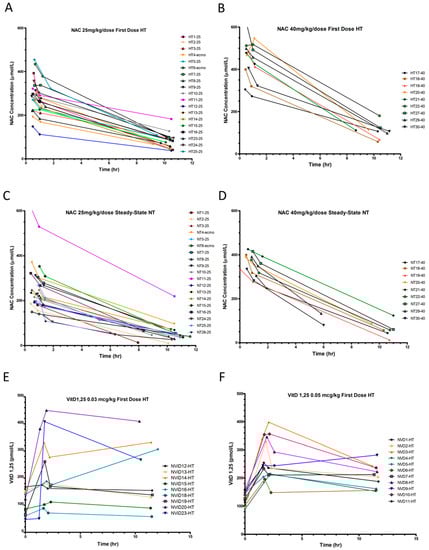
Figure 2.
Plasma NAC and serum 1,25(OH)2D concentrations and pharmacokinetics. (A,B) Plasma NAC concentrations during hypothermia (HT) and (C,D) normothermia (NT), with NAC (A,C) 25 mg/kg/dose and (B,D) 40 mg/kg/dose. (E,F) 1,25(OH)2D serum concentrations during HT with calcitriol (E) 0.03 mcg/kg/dose, (F) 0.05 mcg/kg/dose.
3.3.2. 25(OH)D and 1,25(OH)2D Serum Concentrations at Birth and Pharmacokinetics
At birth, 78% of 23 HIE neonates sampled were vitamin D insufficient [25(OH)D < 75 nmol/L], 61% were vitamin D deficient [<50 nmol/L], and 30% were severely deficient [<25 nmol/L], similar to our previous HIE cohort [57]. There were significant differences in 25(OH)D serum concentrations at birth by race but not by sex. Black and Hispanic infants had mean 25(OH)D 25 ± 10 nmol/L vs. white infants 62.5 ± 25 nmol/L (p = 0.00025). Furthermore, all black/Hispanic infants were 25(OH)D deficient at birth, range (12.5–45 nmol/L). Among white infants, 31% were deficient, 31% were insufficient, and 38% were 25(OH)D sufficient. 25(OH)D serum concentrations did not increase with 400IU vitamin D3 added to daily parenteral nutrition or enteral feeds.
Mean 1,25(OH)2D serum concentrations were 48 ± 16 pg/mL shortly after birth and did not vary by race or sex. Serum [1,25(OH)2D] increased with the first calcitriol dose by 80.6 ± 25.2 pmol/L (0.03 mcg/kg) and 143.5 ± 62.2 pmol/L (0.05 mcg/kg), but show considerable variability in PK, particularly with the 0.03 mcg/dose (Figure 2E,F). Many patients had concentrations at 60 min that were higher than “peak” concentrations at 30 min, precluding PK estimate calculations. This may have been due to the small dose volume being administered, continued release from vitamin D binding protein [62], or a prolonged equilibration phase. Calcitriol was frequently held during normothermia for elevated iCa++. Therefore, we report calcitriol PK for only six patients receiving 0.05 mcg/kg during HT (Figure 2F, Table S2), which prevented any meaningful comparisons between doses, or HT and NT periods.
3.3.3. NAC and Vitamin D concentrations in CSF
We measured NAC concentration in the CSF in five infants (mean 17.2 ± 23.9 mmol/L, range: 6.1–61.3 mmol/L) within 7–25 min after the second NAC dose (Supplementary Table S1). Compared with the plasma obtained at the same time as CSF, secretion of NAC into CSF was between 1–21% of peak plasma [NAC]. 1,25(OH)2D was not detectable in any CSF sample.
3.4. MRS Metabolite Changes with NVD Infusion
NVD was infused during the routine MRI on DOL 5–6, and MRS scans were performed at 0 h before infusion, at 0.5 h, and 2–6 h after infusion to study the PD time course of [GSH] change in CNS. We obtained adequate MRS spectra and metabolite data in 23–24 neonates at two time points depending on metabolites, and in 10 patients at three time points. For efficacy analyses we excluded MRS if there were problems with the IV or infusion pump resulting in incomplete infusion of NVD prior to second scan (n = 5), and significant delay outside of dosing windows by emergent clinical cases (n = 1). As previously reported, three infants had no NAC infused prior to the second scan and had no increase in [GSH] [15]. One infant had left parietal perinatal stroke, and a voxel was placed in the diffusion-restricted stroke area in addition to the BG.
3.4.1. Dose Responsive Increase in [GSH] with NVD Infusion in Basal Ganglia
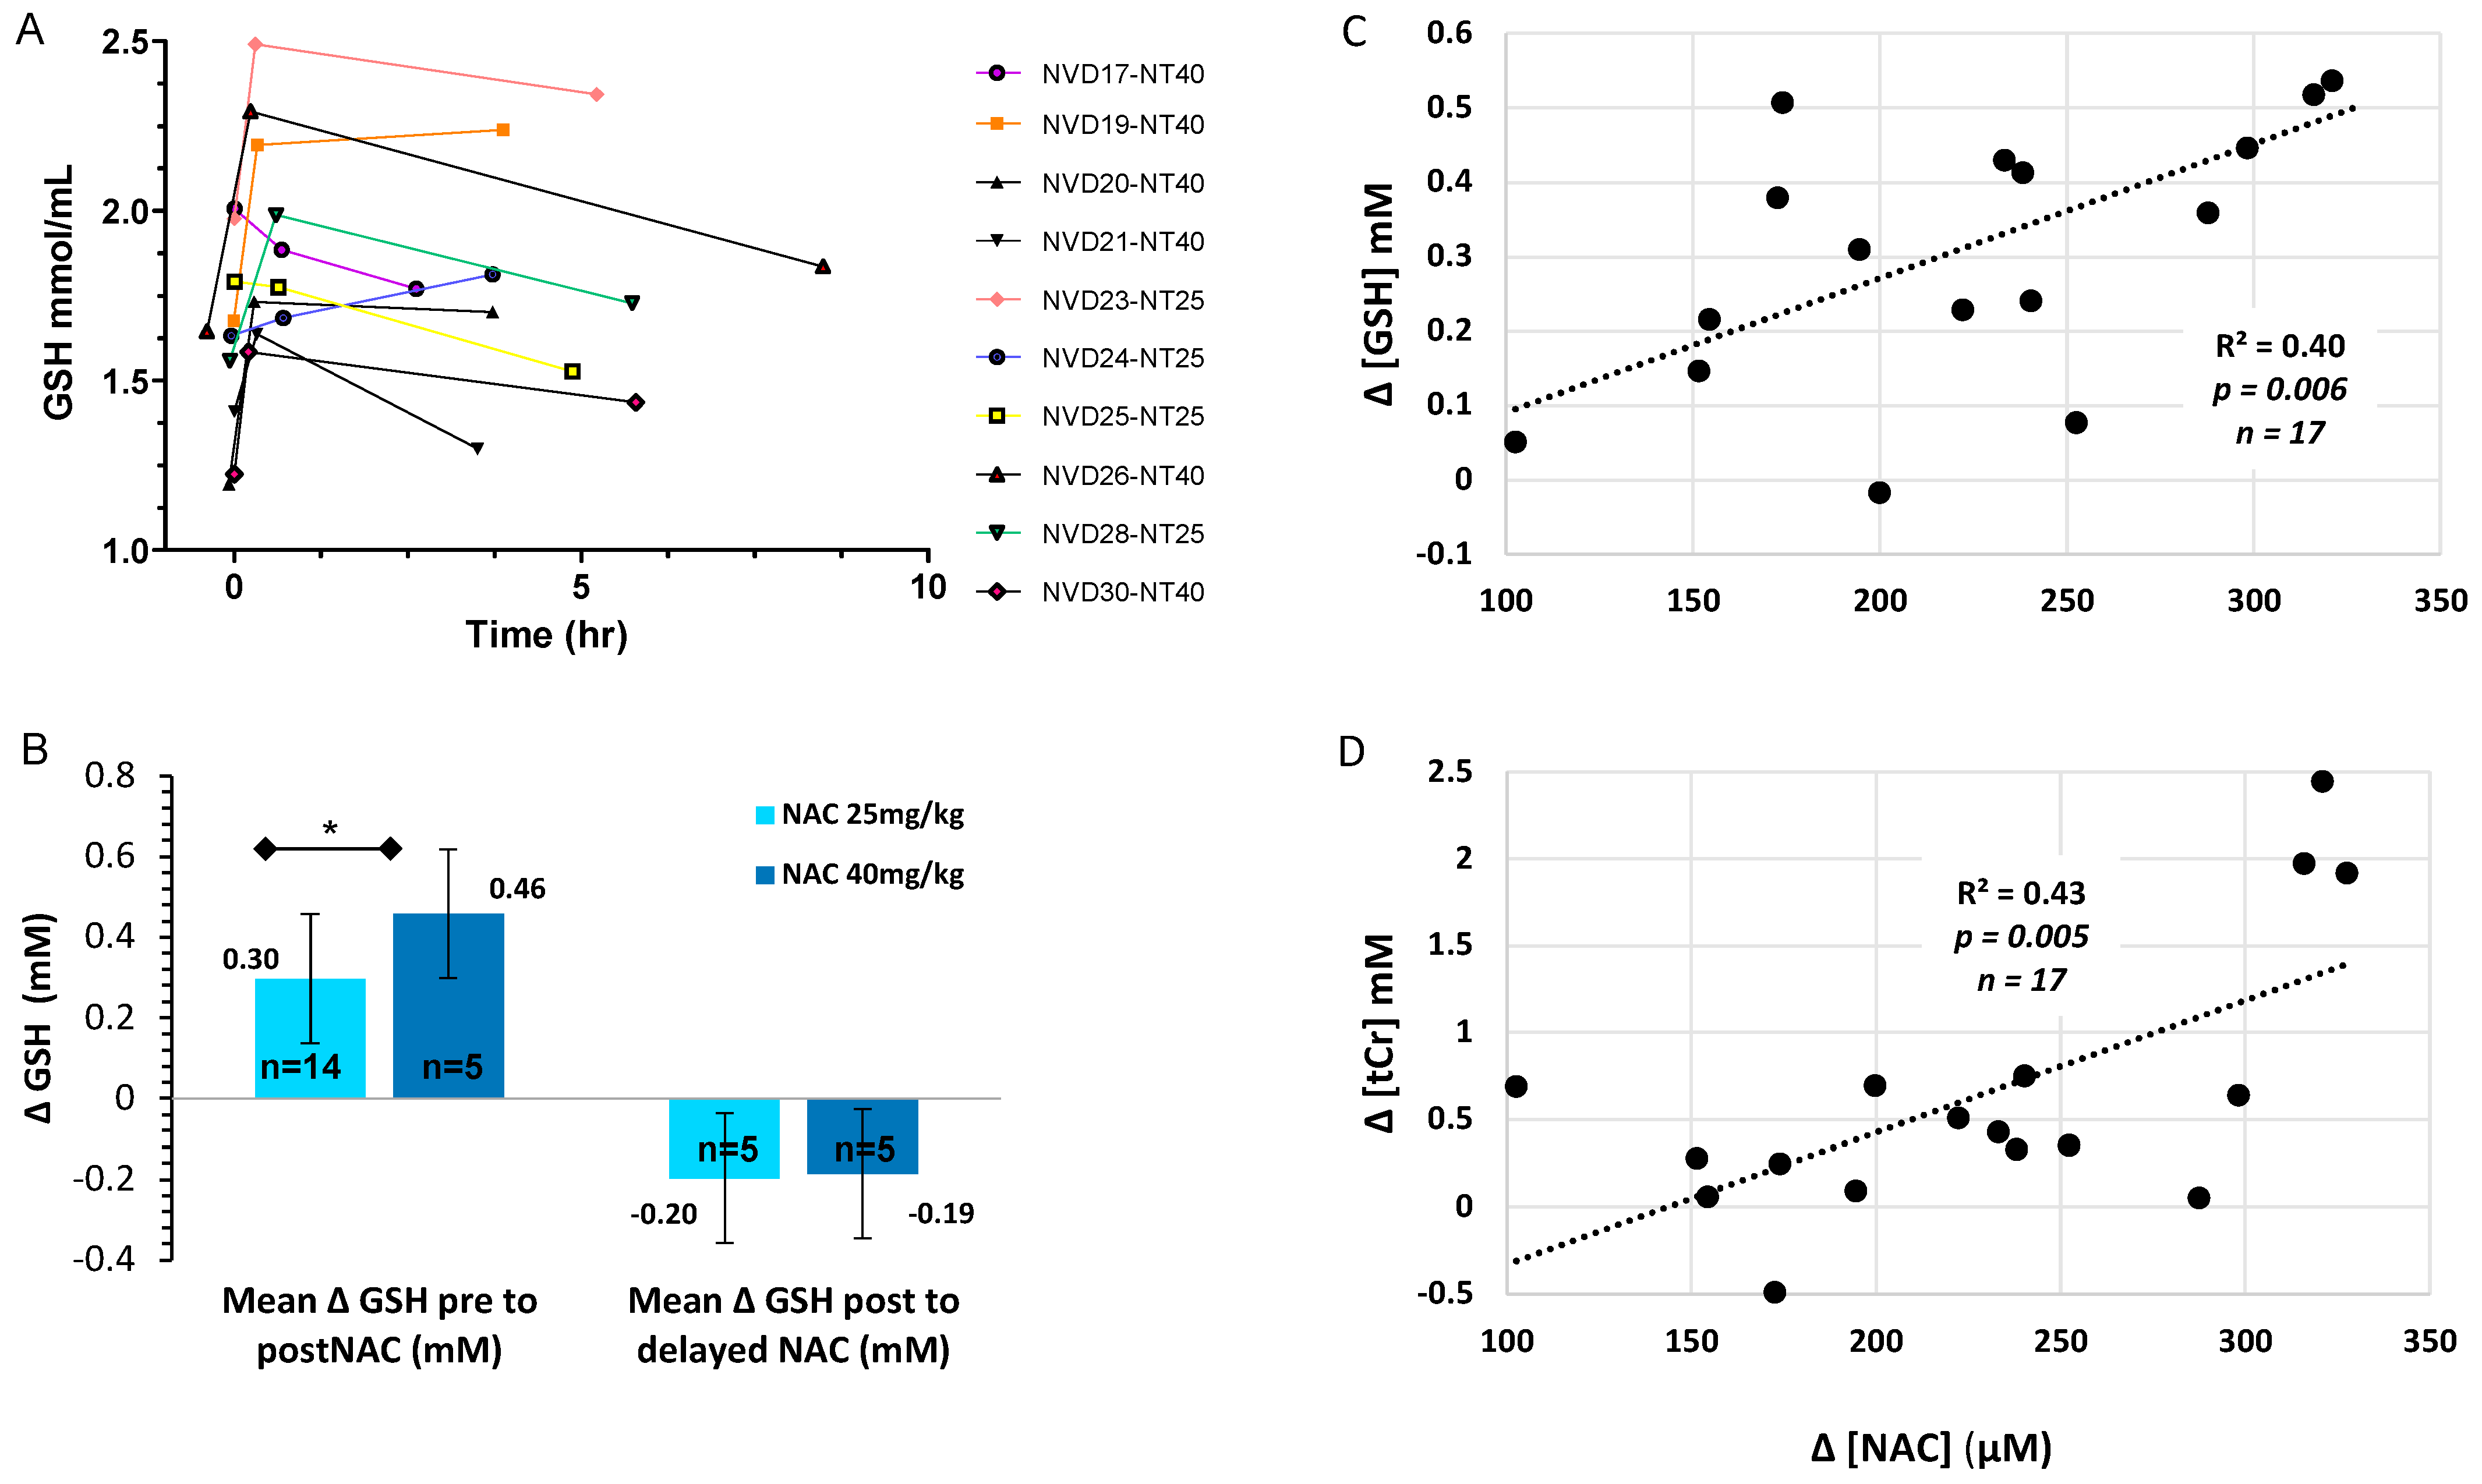
For the 10 infants with three scans, [GSH] showed a significant increase acutely and over time (F = 8.2, p = 0.012, partial eta sq = 0.67). Seven out of 10 infants maintained improved [GSH] in BG for four to six hours (Figure 3A). We observed a CNS dose response with a significantly greater increase in BG [GSH] with NAC 40 mg/kg (+32%) versus 25 mg/kg (+18%, p < 0.05, efficacy analysis, Figure 3B). Importantly, peak [GSH] in BG did not exceed the normal range in healthy term neonates with either NAC dose [52]. We previously reported CNS [GSH] in the BG increased significantly 12–30 min after NAC/NVD (p < 0.0001, n = 23, all doses, intent-to-treat, paired t-test), which was not significantly different between NAC alone (n = 9) vs. NVD (n = 14) [15]. Coefficients of variance were ≤8% for [GSH] with LCModel processing of STEAM sequences at TE20ms on Siemens 3T MRI.
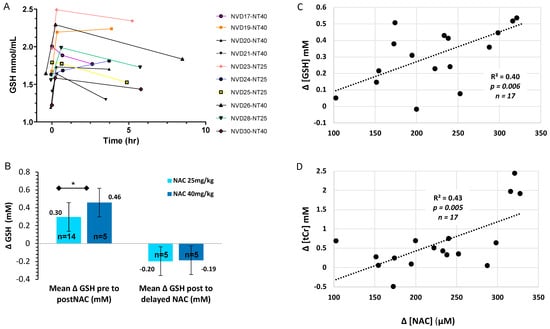
Figure 3.
CNS GSH changes over time and by NAC dose. (A) [GSH] in BG of the 10 HIE infants with serial MRS on DOL 5–6 immediately before (trough = 0 h), and after NVD (peak = 12–30 min) and delayed (post-peak = 2–6 h), with NAC alone (n = 5) or NVD infusion (n = 5). (B) [GSH] change with NAC 25 mg/kg/dose or 40 mg/kg/dose from trough to peak [GSH] or peak to post-peak (2–6 h) after NAC/NVD infusion (* p < 0.05). We included all patients who had the entire dose reliably delivered prior to second scan (efficacy analysis). (C,D) Trough to peak increase in plasma [NAC] plotted with the simultaneous increase in basal ganglia metabolites (C) [GSH] and (D) [tCR] for the 17 subjects with adequate MRS and [NAC] plasma data.
3.4.2. Total Creatine and Choline Change Acutely with NVD Dosing
NVD (all doses) significantly increased tCr, tCho, and mIns within 12–30 min of infusion by paired t-test (n = 23–24 depending on metabolite, intent to treat, Table 3). Mean NAA increased from pre- to immediately post-NVD (n = 24, intent to treat, p = 0.051, paired t-test), which was significant when infants with infusion problems were excluded (n = 18, p = 0.042). There was a trend to a dose response for [tCr] and [tCho] in the BG, with greater increase with NAC 40 mg/kg versus 25 mg/kg (both p = 0.07).
Table 3.
MRS metabolite concentrations for all subjects, Mean (SD).
For the 10 subjects with three scans, other metabolite concentrations were significantly different over the three scans: tCr (F = 10.9, p = 0.005, partial eta sq = 0.73); tCho (F = 20.9, p = 0.001, partial eta sq = 0.83); mIns (F = 9.1, p = 0.009, partial eta sq = 0.7). There were no significant differences in [NAA] or [GLX] within these 10 subjects by repeated measures ANOVA.
3.4.3. Sex Differences in CNS Metabolites
[GSH] in BG before NVD infusion showed a strong tendency to be lower in HIE males (1.59 ± 0.19 mM, n = 17) than in females (1.74 ± 0.18 mM, n = 6, p = 0.06), but [GSH] increase with NVD was not different by sex. There were no sex differences in mean metabolite concentrations for other metabolites, but there were too few females for meaningful repeated measures comparisons.
3.5. Plasma NAC and Lipid Peroxides Correlate with CNS Markers of Oxidative Stress and Energetics
NAC plasma concentrations strongly correlated with the simultaneous increase in CNS [GSH] and [tCr] from trough to peak, before and after the NVD infusion (Figure 3C,D). The absolute change in [ΔGSH] also positively correlated with the absolute change in [ΔtCr] from trough to peak (Figure 4A), demonstrating that CNS energetics improved in conjunction with antioxidant concentrations. Moreover, the lower the baseline [GSH] and [tCr] before dosing (trough), the greater the increase with NAC/NVD (Figure 4B,C). Conversely, the higher the trough [GSH] and [tCr] in BG before NAC/NVD, the less the absolute increase in [GSH] and [tCr].
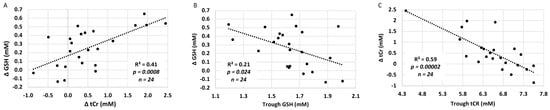
Figure 4.
Comparison of GSH and tCr in BG (intent to treat analysis). (A) The increase in [GSH] is plotted against the change in [tCR] trough to peak, across all infants with NAC/NVD infusion, including those with only partial infusions. (B,C) The increase in (B) [GSH] and (C) [tCr] are strongly dependent upon the trough concentrations in the BG. There was a significantly greater increase in [GSH] and [tCR] in those with lower CNS GSH and tCr on DOL 5 before dosing (trough).
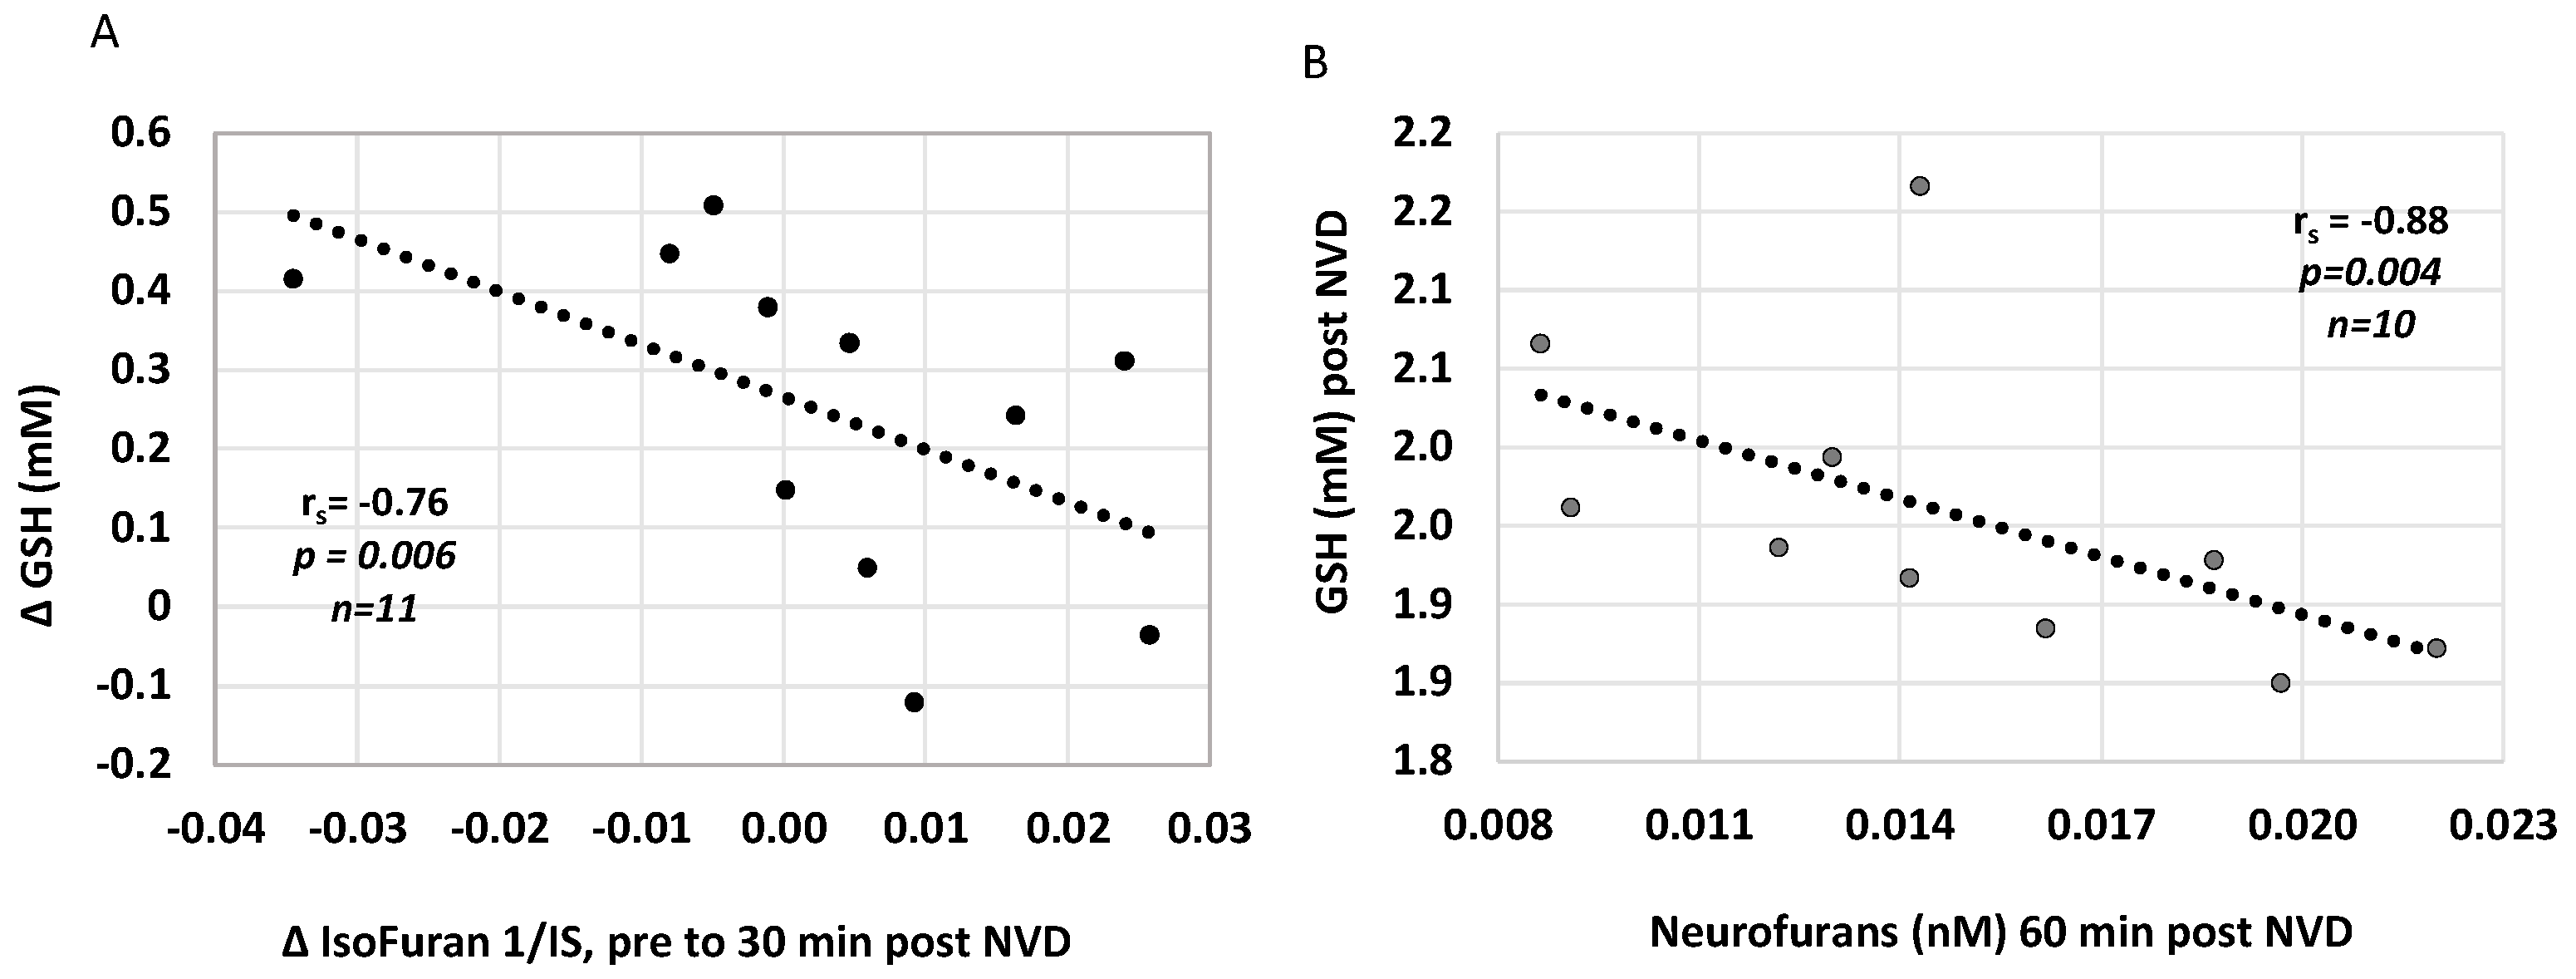
We also investigated whether plasma concentrations of lipid peroxidation markers, isoprostanoids, were associated with CNS oxidative stress and acutely changed with NAC/NVD infusion in paired plasma samples around DOL 5 MRS. The decrease in Isofuran concentrations from before to immediately after NAC/NVD infusion correlated with simultaneous increase in CNS [GSH], from trough to 30 min peak (r = −0.76, p = 0.006, n = 11, Figure 5A). Several plasma oxidative stress markers were inversely correlated with CNS [GSH] post NVD. Higher CNS [GSH] correlated with lower plasma Neurofurans at one hour post NVD (rs= −0.88, p = 0.0038, n = 10, Figure 5B); Other correlations were limited due to small numbers of samples but include 5IPF2a-VI concentrations at 30 min after NVD dosing (r= −0.78, p = 0.0022, n = 8). Neither 25- or 1,25(OH)2 plasma concentrations correlated with plasma iso- or neurofurans.

Figure 5.
Plasma oxidative stress markers Isofurans and Neurofurans correlate with CNS [GSH] after NVD. (A) The increase in [GSH] is strongly correlated with a decrease in Isofurans from pre to post NVD dosing. (B) [GSH] after NVD infusion is strongly negatively correlated with Neurofurans at 60 min post infusion. (Spearman’s rank correlation).
3.6. Death and Neurodevelopmental Outcomes
The mean days to discharge for 26 HIE infants (excluding prolonged ECMO or genetic syndromes) was 16 ± 12 d. There were no deaths during initial hospitalization. One infant suffered a roll-over accidental death at three months during co-bedding. The two infants with a history of ECMO and one infant with a genetic syndrome were the only participants to require gastrostomy tubes for feeding. The ECMO and genetic syndrome patients had abnormal development with spastic diplegic cerebral palsy (1), global developmental delay (4), and autism (1). One infant was lost to follow-up.
The remaining 24 infants with HIE treated with NVD and hypothermia show normal gross motor, fine motor, and cognitive development at 24–48 months of age, without evidence of cerebral palsy or autism. These 24 infants include 10 infants either exposed to chorioamnionitis or diagnosed with clinical sepsis and pneumonia. Twenty-two had formal developmental assessments at developmental follow-up clinics: the mean Peabody gross motor developmental quotient was 102 ± 9.5, the Cognitive adaptive test (CAT) was 95 ± 9.3, the Clinical linguistics and auditory milestone scale (CLAMS) was 98.9 ± 11.1, and the mean MCHAT was 0.4 ± 0.5, at 33 ± 14 months of age. In the severe HIE group (n = 13), the Peabody gross motor developmental quotient was 103 ± 8, CAT 101 ± 10, CLAMs 95 ± 11, MCHAT 0.14 ± 0.4 at 29 ± 12 months of age. Three male infants were receiving therapy for speech delay, and one made significant improvement after myringotomy tube placement. Parents of two infants who moved out of the area reported normal development and no special services.
4. Discussion
In neonates with moderate and severe HIE, oxidative stress continues for days after completion of therapeutic hypothermia, as reflected in low concentrations of reduced glutathione in the basal ganglia before NVD dosing on DOL 5–6. NAC crossed the blood–brain barrier quickly and significantly increased [GSH] in the BG of HIE neonates on DOL 5–6, in a dose responsive manner, with a measurable effect for at least 6 h, while the serum NAC half-life during the same normothermic period was 4.5 h. Both NAC doses resulted in GSH increases, but the 40 mg/kg dose resulted in a 32% increase within 30 min of infusion. The 40 mg/kg dose of NAC appeared safe both systemically and in CNS, as we did not observe evidence of reductive stress [63], and GSH never exceeded reported normal values in term infants.
At the same time, NAC/NVD increased total creatine in the BG, which is strongly correlated with the increase in [GSH]. The simultaneous rapid improvement in tCr indicates that along with restoring CNS GSH reserves, NAC and or NVD improve mitochondrial and cellular creatine kinase and synthetic function [64] and increase important energy substrates in a vulnerable brain region. Further, the increases in GSH and tCr were greater in patients with lower total creatine and greater oxidative stress, and not as great in infants with higher GSH or tCr concentrations. Taken together, these data strongly suggest that NAC 25–40 mg/kg/dose and calcitriol result in rapid synthesis of GSH and increases in CNS energetics that are titrated based on level of CNS demand from oxidative stress in the BG.
This finding is immensely important for the safe clinical translation of these therapeutics. Under normal conditions, the production of intracellular GSH is tightly regulated by availability of the rate-limiting precursor cysteine and direct feedback inhibition of the major synthetic enzyme, glutamate-cysteine ligase [65]. In hypoxic-ischemic and reperfusion conditions, the feedback inhibition via phosphorylation may be impaired, leading to excess GSH and reductive stress even with low doses of NAC and vitamin D. Our MRS data on DOL 5 show that feedback inhibition is intact and there is tight regulation of GSH synthesis to a normal intracellular concentration. Therefore, infants with the greatest oxidative stress can benefit from NVD, without exposing less affected infants to harmful side effects.
Plasma isofurans, which are stable and peak more slowly than isoprostanes [66], were also reduced after NAC/NVD infusion on day five, which strongly correlated with the simultaneous increase in CNS [GSH]. The combined data on CNS and plasma oxidative stress markers indicate that infants are still not metabolically stable during the subacute phase of HIE despite hypothermia treatment, and that NAC rapidly corrects both systemic and CNS oxidative stress and metabolomics. Even infants with severe HIE by neurologic exam, cord pH ≤ 6.8, and MRI lesions seemed to benefit, as motor and cognitive outcomes for this group were within the normal range. The fact that significant structural MRI lesions were found on DOL 5 in one perinatal arterial stroke patient and yet functional outcomes at 24 months of age were favorable without hemiparesis, suggests that this metabolic recovery is very important to functional outcome.
NAC and vitamin D pharmacokinetics differ by hypothermic and normothermic phases of recovery. Similar to findings of other PK trials in neonatal therapeutic hypothermia [67,68], we found longer t1/2 and decreased CL of NAC during hypothermia when compared to normothermia. Based on this data, NAC dose and dosing interval need to be adjusted to increase NAC trough steady state concentrations during both HT and NT. NAC 30 mg/kg every eight hours and 40 mg/kg every eight hours during HT and NT, respectively, will maintain troughs above 61 mm/L (10 mcg/mL) and peaks below 613.5 mm/L (100 mcg/mL). The pairing of blood samples with MRS scans provides a unique dataset that directly links intravenous administration of NVD to target effects in a critical CNS region and identify NAC doses and plasma levels that alleviate a key mechanism of oxidative stress and compromised CNS energetics after HIE birth. These data provide important dosing information for future clinical trial design.
We were not as successful in identifying a direct CNS target of 1,25(OH)2D effect, as vitamin D’s effect did not manifest as acute changes by serial MRS. However, we again demonstrate that the majority of HIE neonates are vitamin D insufficient and the standard 400IU supplemental dose of 25(OH)D is inadequate to correct this insufficiency, as we described in our previous RCT trial of hypothermia [57]. Our studies and other studies of vitamin D deficiency in HIE highlight a significant unmet need for these critically ill infants with neuro- and systemic inflammation [69,70]. Severe vitamin D deficiency is well described to impart a significant risk for worse outcomes after stroke in adult humans and animal models [71,72,73]. Additionally, in neonatal HIE, lower 25(OH)D concentrations in the first 48 h inversely correlated with MRI evidence of brain injury [70]. Conversely, stroke results in lower vitamin D levels through inflammation-triggered degradation of vitamin D [16,74]. Vitamin D has been shown to be neuroprotective when given primarily before and, in one study, after ischemia reperfusion injury [38,47,75,76]. 1,25(OH)2D may act by regulating NMDA receptors and protecting against glutamate excitotoxicity [42,76], reducing inflammatory cytokines, modulating regulatory T cells [16,77], or chronically upregulating GSH synthetic enzymes and increasing GSH production [42,43,44]. While the evidence in general suggests that vitamin D deficiency appears to be detrimental for adult brain after stroke, vitamin D deficiency after global stroke in neonates may be particularly impactful, given vitamin D’s important effects on plasticity, cognition and memory during brain development [16,38,39,40,78,79]. Based on our finding and those of others we suggest that all HIE patients have their vitamin status determined on admission and treated appropriately to achieve a serum 25(OH)D > 50 nmol/L.
Our study revealed mildly elevated ionized calcium even with q24h calcitriol dosing, which was managed by decreasing intravenous calcium or holding calcitriol doses. While we saw no clinical adverse effects from this biochemical finding, we were only able to complete an average of six out of ten days of calcitriol dosing per our safety protocol. As 25(OH)D serum concentrations had not reached sufficiency by the end of the study, increased 25(OH)D supplementation should be considered upon reaching seven days, full oral feeds, or discharge from the hospital.
We used much lower doses of NAC than employed in acetaminophen toxicity protocols or in maternal inflammation animal models of neonatal brain injury (200–300 mg/kg) [8,9,25,80,81]. Results from our trial confirm our NAC dose selection based on our preclinical studies [14,16,37,82], and demonstrate desired effects on CNS and systemic oxidative stress with NAC 25–40 mg/kg in HIE neonates without significant side effects. NAC appears to be safe in critically ill HIE neonates, just as we demonstrated in neonates of all gestational ages exposed to maternal intrauterine inflammation in our trial of NAC in maternal chorioamnionitis [83,84]. In addition to our clinical study, two other preclinical studies have demonstrated inhibition of peroxynitrite and reduction of oxidative stress with NAC 20–40 mg/kg [25,80].
We observed no significant motor, cognitive or behavioral deficits in the 24 HIE infants in pediatric follow-up, particularly impressive considering six infants had cord pH 6.5–6.8, one with no detectable heart rate until 25 min of life. Based on historical and more recent studies of hypothermia outcomes, we would expect between 8–12 infants in our cohort to have significant disability at two to four years of age [85,86]. This clinical trial extends our preclinical studies of the neuroprotective effects of NVD and demonstrates a likely neuroprotective effect in HIE neonates with severe HIE (53%) and chorioamnionitis (42%) [14,16]. We have previously shown that oxidative stress is still increasing after two hours of hypothermia in a lipopolysaccharide-HI animal model, indicating that hypothermia acts too slowly to affect this severe injury [14]. In contrast, NAC and 1,25(OH)2D rapidly corrected glutathione and suppressed glutamate in these hypothermic LPS-HI rat pups. Taken together, these preclinical and clinical studies indicate that NAC and vitamin D can mitigate overwhelming oxidative stress, treating gaps in hypothermic neuroprotection that occur both early during severe HI injury and later in the convalescent phase.
We describe a strong trend to lower [GSH] in males than in females on DOL 5, but we note that sexes were unbalanced in our cohort, with twice as many males as females, reducing our ability to accurately evaluate sex differences. However, other investigators have noted sex differences with greater oxidative stress and neural damage in males or male neurons after HI than in females, as we observed in our preclinical studies, in which low dose NAC alone did not neuroprotect males [30,87,88,89].
This study adds to other work demonstrating that MRS is a quantitative translational method for measuring neural injury (NAA, tCr) and antioxidant status (GSH) in HIE neonates and adults with stroke and demonstrates the unique ability to assess direct therapeutic response in a highly susceptible area of the CNS in clinical trials [15,86,90]. MRS with NAA, lactate, choline and creatine metabolite ratios are less reliable as pharmacodynamic markers, as both numerator and denominator change rapidly after stroke with their own time courses [19,90,91]. We demonstrate that serial [GSH] by MRS generates a CNS-specific, quantitative, PD time-course of treatment effect, informs effective dosing of antioxidants for a target CNS tissue/tract, and increases the likelihood of attaining the primary endpoint in subsequent clinical trials. As MRS measurements of NAA provide the best prognostic biomarker for prediction of disability early after HI injury [86,92,93], a simplified MRS protocol with a single voxel in the BG at low TE captures both GSH and NAA and would be feasible for phase II clinical trial endpoints.
This work has several limitations, chiefly the smaller sample size in some groups. We could not draw normothermia blood samples for 1,25(OH)2D PK when calcitriol doses were held or were timed differently (q24h) than NAC doses, and did not coincide with the MRI scans, which had to be conducted at night. This resulted in fewer samples for 1,25(OH)2D PK. We also had 1,25(OH)2D serum concentrations that fluctuated and prevented PK estimate calculations and comparisons between dosing groups. We did not have MRS data immediately after HIE birth, and thus cannot quantify CNS oxidative stress in the earliest phase of injury. Our MRS scans were not optimized for lactate, but rather for GSH, and showed large coefficients of variation on LC Model spectral fitting of lactate, indicating poor confidence in isolation of lactate peaks from overlapping macromolecular and lipid peaks. We did not have funding for Bayley developmental testing and relied on other validated tests that are strongly correlated with the Bayley and are routinely performed in our high-risk clinic, as well as parent responses for two infants who had moved from the area.
5. Conclusions
In summary, in this prospective trial of NAC and 1,25(OH)2D in hypothermic HIE neonates, we provide rigorous data demonstrating that CNS oxidative stress and compromised CNS energetics persist during the first week after hypoxia ischemic birth, and that NAC 25–40 mg/kg/dose and calcitriol result in rapid synthesis of GSH and increases in CNS energetics that are titrated based on the level of CNS demand from oxidative stress in the BG. With the favorable neurodevelopmental outcomes in this human trial and our preclinical animal studies, these data provide important dosing information for future clinical trial design and a strong basis for a randomized trial of NAC and 1,25(OH)2D in HIE neonates.
Supplementary Materials
The following are available online at https://www.mdpi.com/article/10.3390/antiox10091344/s1, Table S1. NAC PK (25 & 40 mg/kg/dose) for individual participants; Table S2. 1,25(OH)2D (0.05 mcg/kg/dose) PK for individual participants.
Author Contributions
Conceptualization, D.D.J., D.B.W. and T.R.B.; methodology, D.D.J., D.B.W., H.G.M., T.R.B., B.W.H., M.V., J.K., S.T. and M.Y.; software, H.G.M.; validation, H.G.M., T.R.B., B.W.H. and D.B.W.; formal analysis, D.D.J., B.W.H., D.B.W., H.G.M., T.R.B., M.V. and J.K.; investigation, D.D.J., C.W., B.W.H., D.B.W. and H.G.M.; resources, D.D.J., S.T., M.V. and J.K.; data curation, D.D.J., H.G.M., D.B.W., B.W.H., M.V., J.K., P.M. and M.Y.; writing—original draft preparation, D.D.J.; writing—review and editing, D.D.J., D.B.W., H.G.M., T.R.B., S.T., M.V., J.K., M.Y., C.W., B.W.H. and P.M.; visualization, D.D.J., D.B.W. and T.R.B.; supervision, D.D.J., T.R.B., M.V., S.T. and J.K.; project administration, D.D.J.; funding acquisition, D.D.J., S.T., M.V. and J.K. All authors have read and agreed to the published version of the manuscript.
Funding
This work was supported by a grant from the Medical University of South Carolina’s Neuroscience Institute (Jenkins, D); NIH NINDS F31NS108623 (Moss, H); the Instituto Carlos III (FISPI14/0433), Spanish Ministry of Health, Social Services and Equality (EC11-246) (Vento, M and Kuligowski, J); and Institute of Translational Medicine & Therapeutics (ITMAT), National Institute for Health Research (NIHR) Biomedical Research Centre (BRC), Imperial College London (P60743) (Thayyil, S).
Institutional Review Board Statement
The study was conducted according to the guidelines of the Declaration of Helsinki and approved by the Medical University of South Carolina’s Institutional Review Board (protocol # 31254, approval date 4 July 2014).
Informed Consent Statement
Informed consent was obtained from all subjects involved in the study.
Data Availability Statement
Individual NAC and vitamin D PK data are available in Supplemental data. Raw MRS data were generated at MUSC. Derived MRS data supporting the findings of this study are available with reasonable request.
Acknowledgments
We wish to acknowledge Donnie Beason and James Purl for their dedication and expertise in performing all the MR scans.
Conflicts of Interest
The authors declare no conflict of interest. The funders had no role in the design of the study; in the collection, analyses, or interpretation of data; in the writing of the manuscript, or in the decision to publish the results.
Abbreviations
AUC = area under the curve; BG = basal ganglia; CL = clearance; Cmaxss = concentration maximum at steady state; Cminss = concentration minimum at steady state; DOL = day of life; ECMO = extracorporeal membrane oxygenation; FAS-FAS cell surface death receptor; GC-MS = gas chromatography-mass spectrometry; GSH = reduced glutathione; GLX = glutamate + glutamine; HI = hypoxia ischemia; HIE = hypoxic ischemic encephalopathy; HPLC = high pressure liquid chromatography; HT = hypothermia; IRB = Institutional Review Board; IVH = intraventricular hemorrhage; mIns = myoinositol; MRS = magnetic resonance spectroscopy; NAA = N-acetylaspartate + N-acetylaspartylglutamate; NAC = N-acetylcysteine; NMDA = N-methyl-D-Aspartate; NT = normothermia; NVD = NAC + vitamin D (calcitriol); PD = pharmacodynamic; PK = pharmacokinetic; PPHN = persistent pulmonary hypertension; PRESS = single point resolved spectroscopy; RIA = radioimmunoassay; ROS = reactive oxygen species; STEAM = stimulation echo acquisition mode; t1/2 = half-life; TE = echo time; tCho = glycerophosphocholine + phosphocholine; tCr = creatine + phosphocreatine; Vd = volume of distribution.
References
- Osredkar, D.; Sabir, H.; Falck, M.; Wood, T.; Maes, E.; Flatebo, T.; Puchades, M.; Thoresen, M. Hypothermia Does Not Reverse Cellular Responses Caused by Lipopolysaccharide in Neonatal Hypoxic-Ischaemic Brain Injury. Dev. Neurosci. 2015, 37, 390–397. [Google Scholar] [CrossRef] [PubMed]
- Osredkar, D.; Thoresen, M.; Maes, E.; Flatebo, T.; Elstad, M.; Sabir, H. Hypothermia is not neuroprotective after infection-sensitized neonatal hypoxic-ischemic brain injury. Resuscitation 2013, 85, 567–572. [Google Scholar] [CrossRef] [PubMed]
- Jacobs, S.E.; Berg, M.; Hunt, R.; Tarnow-Mordi, W.O.; Inder, T.E.; Davis, P.G. Cooling for newborns with hypoxic ischaemic encephalopathy. Cochrane Database Syst. Rev. 2013, 126, CD003311. [Google Scholar] [CrossRef]
- Falck, M.; Osredkar, D.; Maes, E.; Flatebo, T.; Wood, T.R.; Sabir, H.; Thoresen, M. Hypothermic Neuronal Rescue from Infection-Sensitised Hypoxic-Ischaemic Brain Injury Is Pathogen Dependent. Dev. Neurosci. 2017, 39, 238–247. [Google Scholar] [CrossRef] [Green Version]
- Sabir, H.; Scull-Brown, E.; Liu, X.; Thoresen, M. Immediate hypothermia is not neuroprotective after severe hypoxia-ischemia and is deleterious when delayed by 12 hours in neonatal rats. Stroke 2012, 43, 3364–3370. [Google Scholar] [CrossRef]
- Barks, J.D.; Liu, Y.Q.; Shangguan, Y.; Li, J.; Pfau, J.; Silverstein, F.S. Impact of indolent inflammation on neonatal hypoxic-ischemic brain injury in mice. Int. J. Dev. Neurosci. 2008, 26, 57–65. [Google Scholar] [CrossRef] [Green Version]
- Lante, F.; Meunier, J.; Guiramand, J.; De Jesus Ferreira, M.C.; Cambonie, G.; Aimar, R.; Cohen-Solal, C.; Maurice, T.; Vignes, M.; Barbanel, G. Late N-acetylcysteine treatment prevents the deficits induced in the offspring of dams exposed to an immune stress during gestation. Hippocampus 2008, 18, 602–609. [Google Scholar] [CrossRef]
- Awad, N.; Khatib, N.; Ginsberg, Y.; Weiner, Z.; Maravi, N.; Thaler, I.; Ross, M.G.; Itsokovitz-Eldor, J.; Beloosesky, R. N-acetyl-cysteine (NAC) attenuates LPS-induced maternal and amniotic fluid oxidative stress and inflammatory responses in the preterm gestation. Am. J. Obstet. Gynecol. 2011, 204, 450.e15–450.e20. [Google Scholar] [CrossRef] [PubMed]
- Wang, X.; Svedin, P.; Nie, C.; Lapatto, R.; Zhu, C.; Gustavsson, M.; Sandberg, M.; Karlsson, J.O.; Romero, R.; Hagberg, H.; et al. N-acetylcysteine reduces lipopolysaccharide-sensitized hypoxic-ischemic brain injury. Ann. Neurol. 2007, 61, 263–271. [Google Scholar] [CrossRef]
- Liu, J.Q.; Lee, T.F.; Chen, C.; Bagim, D.L.; Cheung, P.Y. N-acetylcysteine improves hemodynamics and reduces oxidative stress in the brains of newborn piglets with hypoxia-reoxygenation injury. J. Neurotrauma 2010, 27, 1865–1873. [Google Scholar] [CrossRef]
- Vento, M.; Asensi, M.; Sastre, J.; Lloret, A.; Garcia-Sala, F.; Vina, J. Oxidative stress in asphyxiated term infants resuscitated with 100% oxygen. J. Pediatr. 2003, 142, 240–246. [Google Scholar] [CrossRef] [PubMed]
- Armstrong, J.S.; Steinauer, K.K.; Hornung, B.; Irish, J.M.; Lecane, P.; Birrell, G.W.; Peehl, D.M.; Knox, S.J. Role of glutathione depletion and reactive oxygen species generation in apoptotic signaling in a human B lymphoma cell line. Cell Death Differ. 2002, 9, 252–263. [Google Scholar] [CrossRef] [Green Version]
- Rae, C.D.; Williams, S.R. Glutathione in the human brain: Review of its roles and measurement by magnetic resonance spectroscopy. Anal. Biochem. 2017, 529, 127–143. [Google Scholar] [CrossRef] [PubMed]
- Adams, L.E.; Moss, H.G.; Lowe, D.W.; Brown, T.; Wiest, D.B.; Hollis, B.W.; Singh, I.; Jenkins, D.D. NAC and Vitamin D Restore CNS Glutathione in Endotoxin-Sensitized Neonatal Hypoxic-Ischemic Rats. Antioxidants 2021, 10, 489. [Google Scholar] [CrossRef] [PubMed]
- Moss, H.G.; Brown, T.R.; Wiest, D.B.; Jenkins, D.D. N-Acetylcysteine rapidly replenishes central nervous system glutathione measured via magnetic resonance spectroscopy in human neonates with hypoxic-ischemic encephalopathy. J. Cereb. Blood Flow Metab. 2018, 38, 950–958. [Google Scholar] [CrossRef]
- Lowe, D.W.; Fraser, J.L.; Rollins, L.G.; Bentzley, J.; Nie, X.; Martin, R.; Singh, I.; Jenkins, D. Vitamin D improves functional outcomes in neonatal hypoxic ischemic male rats treated with N-acetylcysteine and hypothermia. Neuropharmacology 2017, 123, 186–200. [Google Scholar] [CrossRef]
- Selakovic, V.; Korenic, A.; Radenovic, L. Spatial and temporal patterns of oxidative stress in the brain of gerbils submitted to different duration of global cerebral ischemia. Int. J. Dev. Neurosci. 2011, 29, 645–654. [Google Scholar] [CrossRef]
- Sanchez-Illana, A.; Thayyil, S.; Montaldo, P.; Jenkins, D.; Quintas, G.; Oger, C.; Galano, J.M.; Vigor, C.; Durand, T.; Vento, M.; et al. Novel free-radical mediated lipid peroxidation biomarkers in newborn plasma. Anal. Chim. Acta 2017, 996, 88–97. [Google Scholar] [CrossRef]
- Munoz Maniega, S.; Cvoro, V.; Chappell, F.M.; Armitage, P.A.; Marshall, I.; Bastin, M.E.; Wardlaw, J.M. Changes in NAA and lactate following ischemic stroke: A serial MR spectroscopic imaging study. Neurology 2008, 71, 1993–1999. [Google Scholar] [CrossRef]
- Franco, R.; Bortner, C.D.; Schmitz, I.; Cidlowski, J.A. Glutathione depletion regulates both extrinsic and intrinsic apoptotic signaling cascades independent from multidrug resistance protein 1. Apoptosis 2014, 19, 117–134. [Google Scholar] [CrossRef] [Green Version]
- Ibi, M.; Sawada, H.; Kume, T.; Katsuki, H.; Kaneko, S.; Shimohama, S.; Akaike, A. Depletion of intracellular glutathione increases susceptibility to nitric oxide in mesencephalic dopaminergic neurons. J. Neurochem. 1999, 73, 1696–1703. [Google Scholar] [CrossRef] [Green Version]
- Quintana-Cabrera, R.; Bolanos, J.P. Glutathione and gamma-glutamylcysteine in the antioxidant and survival functions of mitochondria. Biochem. Soc. Trans. 2013, 41, 106–110. [Google Scholar] [CrossRef] [Green Version]
- Ceccon, M.; Giusti, P.; Facci, L.; Borin, G.; Imbesi, M.; Floreani, M.; Skaper, S.D. Intracellular glutathione levels determine cerebellar granule neuron sensitivity to excitotoxic injury by kainic acid. Brain Res. 2000, 862, 83–89. [Google Scholar] [CrossRef]
- Shih, A.Y.; Johnson, D.A.; Wong, G.; Kraft, A.D.; Jiang, L.; Erb, H.; Johnson, J.A.; Murphy, T.H. Coordinate regulation of glutathione biosynthesis and release by Nrf2-expressing glia potently protects neurons from oxidative stress. J. Neurosci. 2003, 23, 3394–3406. [Google Scholar] [CrossRef]
- Cuzzocrea, S.; Mazzon, E.; Costantino, G.; Serraino, I.; Dugo, L.; Calabro, G.; Cucinotta, G.; De Sarro, A.; Caputi, A.P. Beneficial effects of n-acetylcysteine on ischaemic brain injury. Br. J. Pharmacol. 2000, 130, 1219–1226. [Google Scholar] [CrossRef] [Green Version]
- Victor, V.M.; Rocha, M.; De la Fuente, M. N-acetylcysteine protects mice from lethal endotoxemia by regulating the redox state of immune cells. Free Radic. Res. 2003, 37, 919–929. [Google Scholar] [CrossRef]
- Katz, M.; Won, S.J.; Park, Y.; Orr, A.; Jones, D.P.; Swanson, R.A.; Glass, G.A. Cerebrospinal fluid concentrations of N-acetylcysteine after oral administration in Parkinson’s disease. Parkinsonism Relat. Disord. 2015, 21, 500–503. [Google Scholar] [CrossRef] [Green Version]
- Neuwelt, E.A.; Pagel, M.A.; Hasler, B.P.; Deloughery, T.G.; Muldoon, L.L. Therapeutic efficacy of aortic administration of N-acetylcysteine as a chemoprotectant against bone marrow toxicity after intracarotid administration of alkylators, with or without glutathione depletion in a rat model. Cancer Res. 2001, 61, 7868–7874. [Google Scholar] [PubMed]
- Holmay, M.J.; Terpstra, M.; Coles, L.D.; Mishra, U.; Ahlskog, M.; Oz, G.; Cloyd, J.C.; Tuite, P.J. N-Acetylcysteine boosts brain and blood glutathione in Gaucher and Parkinson diseases. Clin. Neuropharmacol. 2013, 36, 103–106. [Google Scholar] [CrossRef] [Green Version]
- Du, L.; Empey, P.E.; Ji, J.; Chao, H.; Kochanek, P.M.; Bayir, H.; Clark, R.S. Probenecid and N-Acetylcysteine Prevent Loss of Intracellular Glutathione and Inhibit Neuronal Death after Mechanical Stretch Injury In Vitro. J. Neurotrauma 2016, 33, 1913–1917. [Google Scholar] [CrossRef] [PubMed] [Green Version]
- Choy, K.H.; Dean, O.; Berk, M.; Bush, A.I.; van den Buuse, M. Effects of N-acetyl-cysteine treatment on glutathione depletion and a short-term spatial memory deficit in 2-cyclohexene-1-one-treated rats. Eur. J. Pharmacol. 2010, 649, 224–228. [Google Scholar] [CrossRef]
- Mahmoud, S.M.; Abdel Moneim, A.E.; Qayed, M.M.; El-Yamany, N.A. Potential role of N-acetylcysteine on chlorpyrifos-induced neurotoxicity in rats. Environ. Sci. Pollut. Res. Int. 2019, 26, 20731–20741. [Google Scholar] [CrossRef] [PubMed]
- Farr, S.A.; Poon, H.F.; Dogrukol-Ak, D.; Drake, J.; Banks, W.A.; Eyerman, E.; Butterfield, D.A.; Morley, J.E. The antioxidants alpha-lipoic acid and N-acetylcysteine reverse memory impairment and brain oxidative stress in aged SAMP8 mice. J. Neurochem. 2003, 84, 1173–1183. [Google Scholar] [CrossRef] [Green Version]
- Khan, M.; Sekhon, B.; Jatana, M.; Giri, S.; Gilg, A.G.; Sekhon, C.; Singh, I.; Singh, A.K. Administration of N-acetylcysteine after focal cerebral ischemia protects brain and reduces inflammation in a rat model of experimental stroke. J. Neurosci. Res. 2004, 76, 519–527. [Google Scholar] [CrossRef]
- Lee, T.F.; Jantzie, L.L.; Todd, K.G.; Cheung, P.Y. Postresuscitation N-acetylcysteine treatment reduces cerebral hydrogen peroxide in the hypoxic piglet brain. Intensive Care Med. 2008, 34, 190–197. [Google Scholar] [CrossRef]
- Park, D.; Shin, K.; Choi, E.K.; Choi, Y.; Jang, J.Y.; Kim, J.; Jeong, H.S.; Lee, W.; Lee, Y.B.; Kim, S.U.; et al. Protective effects of N-acetyl-L-cysteine in human oligodendrocyte progenitor cells and restoration of motor function in neonatal rats with hypoxic-ischemic encephalopathy. Evid. Based Complement. Alternat. Med. 2015, 2015, 764251. [Google Scholar] [CrossRef] [Green Version]
- Nie, X.; Lowe, D.W.; Rollins, L.G.; Bentzley, J.; Fraser, J.L.; Martin, R.; Singh, I.; Jenkins, D. Sex-specific effects of N-Acetylcysteine in neonatal rats treated with hypothermia after severe hypoxia-ischemia. Neurosci. Res. 2016, 108, 24–33. [Google Scholar] [CrossRef] [Green Version]
- Gomez-Pinedo, U.; Cuevas, J.A.; Benito-Martin, M.S.; Moreno-Jimenez, L.; Esteban-Garcia, N.; Torre-Fuentes, L.; Matias-Guiu, J.A.; Pytel, V.; Montero, P.; Matias-Guiu, J. Vitamin D increases remyelination by promoting oligodendrocyte lineage differentiation. Brain Behav. 2020, 10, e01498. [Google Scholar] [CrossRef] [Green Version]
- Eyles, D.; Almeras, L.; Benech, P.; Patatian, A.; Mackay-Sim, A.; McGrath, J.; Feron, F. Developmental vitamin D deficiency alters the expression of genes encoding mitochondrial, cytoskeletal and synaptic proteins in the adult rat brain. J. Steroid Biochem. Mol. Biol. 2007, 103, 538–545. [Google Scholar] [CrossRef]
- Cui, X.; McGrath, J.J.; Burne, T.H.; Mackay-Sim, A.; Eyles, D.W. Maternal vitamin D depletion alters neurogenesis in the developing rat brain. Int. J. Dev. Neurosci. 2007, 25, 227–232. [Google Scholar] [CrossRef]
- George, N.; Kumar, T.P.; Antony, S.; Jayanarayanan, S.; Paulose, C.S. Effect of vitamin D3 in reducing metabolic and oxidative stress in the liver of streptozotocin-induced diabetic rats. Br. J. Nutr. 2012, 108, 1410–1418. [Google Scholar] [CrossRef] [Green Version]
- Ibi, M.; Sawada, H.; Nakanishi, M.; Kume, T.; Katsuki, H.; Kaneko, S.; Shimohama, S.; Akaike, A. Protective effects of 1 alpha,25-(OH)(2)D(3) against the neurotoxicity of glutamate and reactive oxygen species in mesencephalic culture. Neuropharmacology 2001, 40, 761–771. [Google Scholar] [CrossRef]
- Jain, S.K.; Micinski, D. Vitamin D upregulates glutamate cysteine ligase and glutathione reductase, and GSH formation, and decreases ROS and MCP-1 and IL-8 secretion in high-glucose exposed U937 monocytes. Biochem. Biophys. Res. Commun. 2013, 437, 7–11. [Google Scholar] [CrossRef] [Green Version]
- Garcion, E.; Sindji, L.; Leblondel, G.; Brachet, P.; Darcy, F. 1.25-dihydroxyvitamin D3 regulates the synthesis of gamma-glutamyl transpeptidase and glutathione levels in rat primary astrocytes. J. Neurochem. 1999, 73, 859–866. [Google Scholar] [CrossRef]
- Jain, S.K.; Micinski, D.; Huning, L.; Kahlon, G.; Bass, P.F.; Levine, S.N. Vitamin D and L-cysteine levels correlate positively with GSH and negatively with insulin resistance levels in the blood of type 2 diabetic patients. Eur J. Clin. Nutr. 2014, 68, 1148–1153. [Google Scholar] [CrossRef] [PubMed] [Green Version]
- Kajta, M.; Makarewicz, D.; Zieminska, E.; Jantas, D.; Domin, H.; Lason, W.; Kutner, A.; Lazarewicz, J.W. Neuroprotection by co-treatment and post-treating with calcitriol following the ischemic and excitotoxic insult in vivo and in vitro. Neurochem. Int. 2009, 55, 265–274. [Google Scholar] [CrossRef]
- Wang, Y.; Chiang, Y.H.; Su, T.P.; Hayashi, T.; Morales, M.; Hoffer, B.J.; Lin, S.Z. Vitamin D(3) attenuates cortical infarction induced by middle cerebral arterial ligation in rats. Neuropharmacology 2000, 39, 873–880. [Google Scholar] [CrossRef]
- Wijtenburg, S.A.; Gaston, F.E.; Spieker, E.A.; Korenic, S.A.; Kochunov, P.; Hong, L.E.; Rowland, L.M. Reproducibility of phase rotation STEAM at 3T: Focus on glutathione. Magn. Reson. Med. 2014, 72, 603–609. [Google Scholar] [CrossRef] [Green Version]
- Wijtenburg, S.A.; Near, J.; Korenic, S.A.; Gaston, F.E.; Chen, H.; Mikkelsen, M.; Chen, S.; Kochunov, P.; Hong, L.E.; Rowland, L.M. Comparing the reproducibility of commonly used magnetic resonance spectroscopy techniques to quantify cerebral glutathione. J. Magn. Reson. Imaging 2019, 49, 176–183. [Google Scholar] [CrossRef] [PubMed] [Green Version]
- Tkac, I.; Oz, G.; Adriany, G.; Ugurbil, K.; Gruetter, R. In vivo 1H NMR spectroscopy of the human brain at high magnetic fields: Metabolite quantification at 4T vs. 7T. Magn. Reson. Med. 2009, 62, 868–879. [Google Scholar] [CrossRef] [PubMed] [Green Version]
- Coles, L.D.; Tuite, P.J.; Oz, G.; Mishra, U.R.; Kartha, R.V.; Sullivan, K.M.; Cloyd, J.C.; Terpstra, M. Repeated-Dose Oral N-Acetylcysteine in Parkinson’s Disease: Pharmacokinetics and Effect on Brain Glutathione and Oxidative Stress. J. Clin. Pharmacol. 2018, 58, 158–167. [Google Scholar] [CrossRef]
- Kreis, R.; Hofmann, L.; Kuhlmann, B.; Boesch, C.; Bossi, E.; Huppi, P.S. Brain metabolite composition during early human brain development as measured by quantitative in vivo 1H magnetic resonance spectroscopy. Magn. Reson. Med. 2002, 48, 949–958. [Google Scholar] [CrossRef] [PubMed]
- Sarnat, H.B.; Sarnat, M.S. Neonatal encephalopathy following fetal distress. A clinical and electroencephalographic study. Arch. Neurol. 1976, 33, 696–705. [Google Scholar] [CrossRef]
- Sarnat, H.B.; Flores-Sarnat, L.; Fajardo, C.; Leijser, L.M.; Wusthoff, C.; Mohammad, K. Sarnat Grading Scale for Neonatal Encephalopathy after 45 Years: An Update Proposal. Pediatr. Neurol. 2020, 113, 75–79. [Google Scholar] [CrossRef] [PubMed]
- Eicher, D.J.; Wagner, C.L.; Katikaneni, L.P.; Hulsey, T.C.; Bass, W.T.; Kaufman, D.A.; Horgan, M.J.; Languani, S.; Bhatia, J.J.; Givelichian, L.M.; et al. Moderate hypothermia in neonatal encephalopathy: Safety outcomes. Pediatr. Neurol. 2005, 32, 18–24. [Google Scholar] [CrossRef] [PubMed]
- Ercal, N.; Oztezcan, S.; Hammond, T.C.; Matthews, R.H.; Spitz, D.R. High-performance liquid chromatography assay for N-acetylcysteine in biological samples following derivatization with N-(1-pyrenyl)maleimide. J. Chromatogr. B Biomed. Appl. 1996, 685, 329–334. [Google Scholar] [CrossRef]
- Lowe, D.W.; Hollis, B.W.; Wagner, C.L.; Bass, T.; Kaufman, D.A.; Horgan, M.J.; Givelichian, L.M.; Sankaran, K.; Yager, J.Y.; Katikaneni, L.D.; et al. Vitamin D Insufficiency in Neonatal Hypoxic-Ischemic Encephalopathy. Pediatr. Res. 2017, 82, 55–62. [Google Scholar] [CrossRef] [Green Version]
- Gill, K.; Osiovich, A.; Synnes, A.; Agnew, J.A.; Grunau, R.E.; Miller, S.P.; Zwicker, J.G. Concurrent Validity of the Bayley-III and the Peabody Developmental Motor Scales-2 at 18 Months. Phys. Occup. Ther. Pediatr. 2019, 39, 514–524. [Google Scholar] [CrossRef]
- Hoon, A.H., Jr.; Pulsifer, M.B.; Gopalan, R.; Palmer, F.B.; Capute, A.J. Clinical Adaptive Test/Clinical Linguistic Auditory Milestone Scale in early cognitive assessment. J. Pediatr. 1993, 123, S1–S8. [Google Scholar] [CrossRef]
- Zamora, C.; Tekes, A.; Alqahtani, E.; Kalayci, O.T.; Northington, F.; Huisman, T.A. Variability of resistive indices in the anterior cerebral artery during fontanel compression in preterm and term neonates measured by transcranial duplex sonography. J. Perinatol. Off. J. Calif. Perinat. Assoc. 2014, 34, 306–310. [Google Scholar] [CrossRef]
- Allison, J.W.; Faddis, L.A.; Kinder, D.L.; Roberson, P.K.; Glasier, C.M.; Seibert, J.J. Intracranial resistive index (RI) values in normal term infants during the first day of life. Pediatr. Radiol. 2000, 30, 618–620. [Google Scholar] [CrossRef] [PubMed]
- Zella, L.A.; Shevde, N.K.; Hollis, B.W.; Cooke, N.E.; Pike, J.W. Vitamin D-binding protein influences total circulating levels of 1,25-dihydroxyvitamin D3 but does not directly modulate the bioactive levels of the hormone in vivo. Endocrinology 2008, 149, 3656–3667. [Google Scholar] [CrossRef] [PubMed] [Green Version]
- Zhang, H.; Limphong, P.; Pieper, J.; Liu, Q.; Rodesch, C.K.; Christians, E.; Benjamin, I.J. Glutathione-dependent reductive stress triggers mitochondrial oxidation and cytotoxicity. FASEB J. 2012, 26, 1442–1451. [Google Scholar] [CrossRef] [PubMed] [Green Version]
- Andres, R.H.; Ducray, A.D.; Schlattner, U.; Wallimann, T.; Widmer, H.R. Functions and effects of creatine in the central nervous system. Brain Res. Bull. 2008, 76, 329–343. [Google Scholar] [CrossRef] [PubMed]
- Lu, S.C. Glutathione synthesis. Biochim Biophys. Acta 2013, 1830, 3143–3153. [Google Scholar] [CrossRef] [Green Version]
- Cuyamendous, C.; de la Torre, A.; Lee, Y.Y.; Leung, K.S.; Guy, A.; Bultel-Ponce, V.; Galano, J.M.; Lee, J.C.; Oger, C.; Durand, T. The novelty of phytofurans, isofurans, dihomo-isofurans and neurofurans: Discovery, synthesis and potential application. Biochimie 2016, 130, 49–62. [Google Scholar] [CrossRef]
- Roka, A.; Melinda, K.T.; Vasarhelyi, B.; Machay, T.; Azzopardi, D.; Szabo, M. Elevated morphine concentrations in neonates treated with morphine and prolonged hypothermia for hypoxic ischemic encephalopathy. Pediatrics 2008, 121, e844–e849. [Google Scholar] [CrossRef] [PubMed]
- Filippi, L.; la Marca, G.; Cavallaro, G.; Fiorini, P.; Favelli, F.; Malvagia, S.; Donzelli, G.; Guerrini, R. Phenobarbital for neonatal seizures in hypoxic ischemic encephalopathy: A pharmacokinetic study during whole body hypothermia. Epilepsia 2011, 52, 794–801. [Google Scholar] [CrossRef]
- Mutlu, M.; Sariaydin, M.; Aslan, Y.; Kader, S.; Dereci, S.; Kart, C.; Yaman, S.O.; Kural, B. Status of vitamin D, antioxidant enzymes, and antioxidant substances in neonates with neonatal hypoxic-ischemic encephalopathy. J. Matern.-Fetal Neonatal Med. 2016, 29, 2259–2263. [Google Scholar] [CrossRef]
- McGinn, E.A.; Powers, A.; Galas, M.; Lyden, E.; Peeples, E.S. Neonatal Vitamin D Status Is Associated with the Severity of Brain Injury in Neonatal Hypoxic-Ischemic Encephalopathy: A Pilot Study. Neuropediatrics 2020, 51, 251–258. [Google Scholar] [CrossRef] [PubMed]
- Balden, R.; Selvamani, A.; Sohrabji, F. Vitamin D deficiency exacerbates experimental stroke injury and dysregulates ischemia-induced inflammation in adult rats. Endocrinology 2012, 153, 2420–2435. [Google Scholar] [CrossRef] [Green Version]
- Park, K.Y.; Chung, P.W.; Kim, Y.B.; Moon, H.S.; Suh, B.C.; Won, Y.S.; Kim, J.M.; Youn, Y.C.; Kwon, O.S. Serum Vitamin D Status as a Predictor of Prognosis in Patients with Acute Ischemic Stroke. Cerebrovasc. Dis. 2015, 40, 73–80. [Google Scholar] [CrossRef]
- Turetsky, A.; Goddeau, R.P., Jr.; Henninger, N. Low Serum Vitamin D Is Independently Associated with Larger Lesion Volumes after Ischemic Stroke. J. Stroke Cerebrovasc. Dis. Off. J. Natl. Stroke Assoc. 2015, 24, 1555–1563. [Google Scholar] [CrossRef] [PubMed]
- Berghout, B.P.; Fani, L.; Heshmatollah, A.; Koudstaal, P.J.; Ikram, M.A.; Zillikens, M.C.; Ikram, M.K. Vitamin D Status and Risk of Stroke: The Rotterdam Study. Stroke 2019, 50, 2293–2298. [Google Scholar] [CrossRef] [PubMed]
- Brewer, L.D.; Thibault, V.; Chen, K.C.; Langub, M.C.; Landfield, P.W.; Porter, N.M. Vitamin D hormone confers neuroprotection in parallel with downregulation of L-type calcium channel expression in hippocampal neurons. J. Neurosci. 2001, 21, 98–108. [Google Scholar] [CrossRef] [PubMed]
- Fu, J.; Xue, R.; Gu, J.; Xiao, Y.; Zhong, H.; Pan, X.; Ran, R. Neuroprotective effect of calcitriol on ischemic/reperfusion injury through the NR3A/CREB pathways in the rat hippocampus. Mol. Med. Rep. 2013, 8, 1708–1714. [Google Scholar] [CrossRef] [PubMed] [Green Version]
- Evans, M.A.; Kim, H.A.; Ling, Y.H.; Uong, S.; Vinh, A.; De Silva, T.M.; Arumugam, T.V.; Clarkson, A.N.; Zosky, G.R.; Drummond, G.R.; et al. Vitamin D3 Supplementation Reduces Subsequent Brain Injury and Inflammation Associated with Ischemic Stroke. Neuromol. Med. 2018, 20, 147–159. [Google Scholar] [CrossRef] [Green Version]
- Becker, A.; Eyles, D.W.; McGrath, J.J.; Grecksch, G. Transient prenatal vitamin D deficiency is associated with subtle alterations in learning and memory functions in adult rats. Behav. Brain Res. 2005, 161, 306–312. [Google Scholar] [CrossRef]
- Groves, N.J.; McGrath, J.J.; Burne, T.H. Vitamin D as a neurosteroid affecting the developing and adult brain. Annu Rev. Nutr. 2014, 34, 117–141. [Google Scholar] [CrossRef]
- Cuzzocrea, S.; Costantino, G.; Caputi, A.P. Protective effect of N-acetylcysteine on cellular energy depletion in a non-septic shock model induced by zymosan in the rat. Shock 1999, 11, 143–148. [Google Scholar] [CrossRef]
- Sharabi, H.; Khatib, N.; Ginsberg, Y.; Weiner, Z.; Ross, M.G.; Tamar, B.K.; Efrat, S.; Mordechai, H.; Beloosesky, R. Therapeutic N-Acetyl-Cysteine (Nac) Following Initiation of Maternal Inflammation Attenuates Long-Term Offspring Cerebral Injury, as Evident in Magnetic Resonance Imaging (MRI). Neuroscience 2019, 403, 118–124. [Google Scholar] [CrossRef]
- Jatana, M.; Singh, I.; Singh, A.K.; Jenkins, D. Combination of systemic hypothermia and N-acetylcysteine attenuates hypoxic-ischemic brain injury in neonatal rats. Pediatr. Res. 2006, 59, 684–689. [Google Scholar] [CrossRef] [Green Version]
- Jenkins, D.D.; Wiest, D.B.; Mulvihill, D.M.; Hlavacek, A.M.; Majstoravich, S.J.; Brown, T.R.; Taylor, J.J.; Buckley, J.R.; Turner, R.P.; Rollins, L.G.; et al. Fetal and Neonatal Effects of N-Acetylcysteine When Used for Neuroprotection in Maternal Chorioamnionitis. J. Pediatr. 2016, 168, 67–76. [Google Scholar] [CrossRef] [Green Version]
- Wiest, D.B.; Chang, E.; Fanning, D.; Garner, S.; Cox, T.; Jenkins, D.D. Antenatal pharmacokinetics and placental transfer of N-acetylcysteine in chorioamnionitis for fetal neuroprotection. J. Pediatr. 2014, 165, 672–677. [Google Scholar] [CrossRef] [PubMed] [Green Version]
- Edwards, A.D.; Brocklehurst, P.; Gunn, A.J.; Halliday, H.; Juszczak, E.; Levene, M.; Strohm, B.; Thoresen, M.; Whitelaw, A.; Azzopardi, D. Neurological outcomes at 18 months of age after moderate hypothermia for perinatal hypoxic ischaemic encephalopathy: Synthesis and meta-analysis of trial data. BMJ 2010, 340, c363. [Google Scholar] [CrossRef] [Green Version]
- Lally, P.J.; Montaldo, P.; Oliveira, V.; Soe, A.; Swamy, R.; Bassett, P.; Mendoza, J.; Atreja, G.; Kariholu, U.; Pattnayak, S.; et al. Magnetic resonance spectroscopy assessment of brain injury after moderate hypothermia in neonatal encephalopathy: A prospective multicentre cohort study. Lancet Neurol. 2019, 18, 35–45. [Google Scholar] [CrossRef] [Green Version]
- Demarest, T.G.; Schuh, R.A.; Waddell, J.; McKenna, M.C.; Fiskum, G. Sex-dependent mitochondrial respiratory impairment and oxidative stress in a rat model of neonatal hypoxic-ischemic encephalopathy. J. Neurochem. 2016, 137, 714–729. [Google Scholar] [CrossRef] [Green Version]
- Demarest, T.G.; Schuh, R.A.; Waite, E.L.; Waddell, J.; McKenna, M.C.; Fiskum, G. Sex dependent alterations in mitochondrial electron transport chain proteins following neonatal rat cerebral hypoxic-ischemia. J. Bioenerg. Biomembr. 2016, 48, 591–598. [Google Scholar] [CrossRef] [PubMed]
- Nijboer, C.H.; Groenendaal, F.; Kavelaars, A.; Hagberg, H.H.; van Bel, F.; Heijnen, C.J. Gender-specific neuroprotection by 2-iminobiotin after hypoxia-ischemia in the neonatal rat via a nitric oxide independent pathway. J. Cereb. Blood Flow Metab. 2007, 27, 282–292. [Google Scholar] [CrossRef] [Green Version]
- Gideon, P.; Henriksen, O.; Sperling, B.; Christiansen, P.; Olsen, T.S.; Jorgensen, H.S.; Arlien-Soborg, P. Early time course of N-acetylaspartate, creatine and phosphocreatine, and compounds containing choline in the brain after acute stroke. A proton magnetic resonance spectroscopy study. Stroke 1992, 23, 1566–1572. [Google Scholar] [CrossRef] [Green Version]
- Munoz Maniega, S.; Cvoro, V.; Armitage, P.A.; Marshall, I.; Bastin, M.E.; Wardlaw, J.M. Choline and creatine are not reliable denominators for calculating metabolite ratios in acute ischemic stroke. Stroke 2008, 39, 2467–2469. [Google Scholar] [CrossRef] [PubMed] [Green Version]
- Robertson, N.J.; Thayyil, S.; Cady, E.B.; Raivich, G. Magnetic resonance spectroscopy biomarkers in term perinatal asphyxial encephalopathy: From neuropathological correlates to future clinical applications. Curr Pediatr. Rev. 2014, 10, 37–47. [Google Scholar] [CrossRef] [PubMed]
- Thayyil, S.; Chandrasekaran, M.; Taylor, A.; Bainbridge, A.; Cady, E.B.; Chong, W.K.; Murad, S.; Omar, R.Z.; Robertson, N.J. Cerebral magnetic resonance biomarkers in neonatal encephalopathy: A meta-analysis. Pediatrics 2010, 125, e382–e395. [Google Scholar] [CrossRef] [PubMed]


Publisher’s Note: MDPI stays neutral with regard to jurisdictional claims in published maps and institutional affiliations. |
© 2021 by the authors. Licensee MDPI, Basel, Switzerland. This article is an open access article distributed under the terms and conditions of the Creative Commons Attribution (CC BY) license (https://creativecommons.org/licenses/by/4.0/).