Abstract
The use of oxidizing agents is one of the most favorable approaches to kill bacteria in daily life. However, bacteria have been evolving to survive in the presence of different oxidizing agents. In this study, we aimed to obtain a comprehensive list of genes whose expression can make Escherichia coli cells resistant to different oxidizing agents. For this purpose, we utilized the ASKA library and performed a genome-wide screening of ~4200 E. coli genes. Hydrogen peroxide (H2O2) and hypochlorite (HOCl) were tested as representative oxidizing agents in this study. To further validate our screening results, we used different E. coli strains as host cells to express or inactivate selected resistance genes individually. More than 100 genes obtained in this screening were not known to associate with oxidative stress responses before. Thus, this study is expected to facilitate both basic studies on oxidative stress and the development of antibacterial agents.
1. Introduction
In nature, bacteria live under various environmental stresses such as oxidative stress, which is one of the most common challenges for bacteria living in aerobic conditions. Reactive oxygen species (ROSs), reactive nitrogen species (RNSs), and reactive chlorine species (RCSs) are three major sources of oxidative stress [1]. In bacteria, ROSs including superoxide anions (O2•−), hydrogen peroxide (H2O2), and hydroxyl radicals (•OH) can be formed not only endogenously during electron transfer in the respiratory chain [2], but also exogenously under different conditions such as UV exposure [3]. Although ROSs at certain low concentrations have been demonstrated to be essential for several physiological processes and the cellular redox balance [4], a high level of ROSs has been proven to cause damages to nucleic acids, proteins, fatty acids, and other cellular components [2,3,5]. Different from free radicals such as O2•− and •OH, the non-radical ROS H2O2 is a strong oxidant and has high activation energy, which makes it reactive with transition metal centers, selenoproteins, and selected thiol proteins [6]. An excess presence of H2O2 has been implicated in the interruption of iron homeostasis in cells [7]. For instance, a high level of H2O2 can inactivate the Escherichia coli Isc iron–sulfur assembly system [8]. Oxidative stress caused by H2O2 can also induce DNA degradation in bacteria and then inhibit bacterial growth [9]. Differently, hypochlorite (HOCl) mainly targets proteins which contain sulfur, aromatic rings, and primary amines, resulting in protein aggregation and degradation [10]. Due to their disinfecting effects on bacteria, H2O2 and HOCl, have been commonly used to kill bacteria in daily life. Moreover, antibiotics such as landomycin E, which can induce a rapid generation of H2O2, have been applied to treat bacterial infections [11,12].
To protect themselves from H2O2 damages, bacteria have evolved various defense pathways. Besides enzymatic scavengers such as catalase, superoxide dismutase, and peroxidase [13], the stress-induced regulon OxyR is one of the most well-studied approaches used by bacteria to fight against H2O2 damages [8,14]. As a peroxide sensor and a transcriptional regulator, OxyR can be activated by oxidization at the conserved cysteine residue and trigger the transcription of genes for direct antioxidants such as the kat family (catalases), sodA (superoxide dismutase), and ahpCF (alkyl hydroperoxide reductase), as well as other proteins involved in amino acid biosynthesis and cell wall synthesis [15,16]. For HOCl, bacteria have developed different defense mechanisms, such as converting Hsp33, RidA, and CnoX into highly active chaperones to prevent proteins from aggregation and degradation caused by HOCl [17,18]. HOCl-responsive transcriptional factors such as HypT, RclR, and NemR can also help to alleviate HOCl damages [19]. For instance, HypT can be activated by oxidation of its methionine residues and then upregulate the transcription of genes participating in the biosynthesis of amino acids such as methionine (metB, metK, and metN), while downregulating intracellular iron levels [20]. Interestingly, recent studies have demonstrated that noncoding RNAs and small proteins are also involved in oxidative stress responses, which has never been recognized before [13]. Therefore, it is necessary to explore unknown mechanisms of oxidative stress responses in bacteria to provide new information for antibacterial agent development.
Previous studies on oxidative stress responses have mostly focused on analyzing gene expression and regulation in cells after exposure to oxidizing agents. Some genes associated with oxidative stress responses might not be expressed under experimental conditions. Thus, we aimed to obtain a comprehensive list of genes whose expression can make cells resistant to oxidizing agents. In this study, we used E. coli as the representative bacterium, while H2O2 and HOCl were selected as oxidizing agents. The ASKA collection, which is a complete set of E. coli strains for overexpressing individual E. coli K-12 genes, was screened to identify oxidizing agent resistance genes. Different from most screening studies with the ASKA library which used either pooled strains or plasmids [21,22], we tested all the strains individually to avoid potential interferences by pooling them together. Additionally, we further validated candidate genes from the screening in the common E. coli K-12 MG1655 strain to avoid potential impacts of the host strain of the ASKA library, the AG1 strain, which has been engineered for high transformation efficiency. In our list of genes, there are several genes which were known for their functions or association with oxidative-stress responses. Further studies are ongoing to explore their specific mechanisms.
2. Materials and Methods
2.1. Chemicals and Bacterial Strains
All the chemicals, reagents, bacterial growth media such as H2O2 and NaOCl solution, LB medium, M9 medium, chloramphenicol, β-D-1-thiogalactopyranoside (IPTG) were purchased from VWR International (Radnor, PA, USA). The ASKA library and Keio collection were originally from the Coli Genetic Stock Center at Yale University. The no-insert control of pCA24N was from our previous study [23]. The plasmids with candidate genes were purified from candidate strains individually by Qiagen Miniprep plasmid purification kits (Hilden, Germany) and transformed into MG1655 cells by Bio-Rad Pulser™ Transformation Apparatus (Hercules, CA, USA).
2.2. ASKA Library Screening and Minimal Inhibitory Concentration (MIC) Determination
Individual plates of the ASKA library were replicated by inoculating 5 µL stock culture into 200 µL fresh LB medium with 50 µg/mL chloramphenicol in each well of the new plates and incubating them at 37 °C overnight. The absorbance at 600 nm of each well was read by a microplate reader. On the next day, the overnight culture in each well was diluted to OD600 nm = 0.15 with a total volume of 200 µL fresh LB medium, 50 µg/mL chloramphenicol, 0.1 mM IPTG, and corresponding concentrations of H2O2 or NaOCl. Each plate had three biological replicates. The 96-well plates were sealed with oxygen-permeable membranes (Sigma-Aldrich, St. Louis, MO, USA). Cell growth was monitored by reading the absorbance at 600 nm with microplate readers at 37 °C, continuously. MIC determination was performed by using varying concentrations of oxidizing agents with 1 mM increments from 1 to 20 mM, or 0.25 mM increments from 0 to 1 mM in LB or M9 minimal medium. The lowest concentration at which bacteria could not grow was recorded as the corresponding MICs.
2.3. Bioinformatical Analyses
The subcellular localization of proteins was obtained from the EcoCyc E. coli Database by typing individual gene names into the database [24]. The identified proteins were classified into functional categories according to their annotated functions in the UniProt-GOA Database [25] and analyzed by DAVID Bioinformatics Resources by typing individual gene names into the database [26]. Protein–protein functional interaction networks were analyzed with the STRING database [27], in which active interaction sources from experiments, databases, co-expression, neighborhood, gene fusion, and co-occurrence were selected. The minimum required interaction score of medium confidence was chosen.
3. Results
3.1. Genome-Wide Screening of Resistance Genes against H2O2
First, we determined the MIC of H2O2 for the no-insert control strain of the ASKA library (the AG1 strain with pCA24N empty vector). MIC was 2 mM. Then, we used a 2-fold MIC (4 mM H2O2) to screen the complete ASKA library for H2O2 resistance genes. Each strain was tested three times. Only those growing in all three replicates were recorded as candidates for further analyses. There were 217 candidate genes after the screening. We listed them into categories based on their biological functions (Table 1).

Table 1.
List of H2O2-resistance genes from the genome-wide screening.
Bioinformatical analyses of these candidate genes were performed (Figure 1). About two-thirds of the gene products are in the cytoplasm, leaving the other one-third associated with membranes. The functions of these genes cover a wide range of biological processes and are enriched in four major categories: stress responses, membrane functions (mostly transporters), metabolism, and gene expression and regulation. The protein–protein interaction network showed four major clusters: (1) metabolic enzymes including pflD (formate acetyltransferase), ttdB (tartrate dehydratase), dmlA (malate dehydrogenase), ybiW (formate acetyltransferase), sucC (succinyl-CoA ligase), sucA (2-oxoglutarate dehydrogenase), leuA (2-isopropylmalate synthase), and prpE (propionyl-CoA ligase); (2) flagellar biosynthesis and mobility including flhD, flgE, flgK, fliS, motB, cheW, and cheA; (3) protein synthesis including thrA (threonine synthesis), hisB (histidine synthesis), ilvA (threonine synthesis), guaA (GMP synthase), rho (transcription termination), yidC (ATP synthase), and rpmG (50S ribosomal protein L33); (4) oxidative stress responses including sodB (superoxide dismutase), katE (catalase), btuE (Thioredoxin/glutathione peroxidase), katG (catalase-peroxidase), tpx (thiol peroxidase), and galU (UTP-glucose-1-phosphate uridylyltransferase).
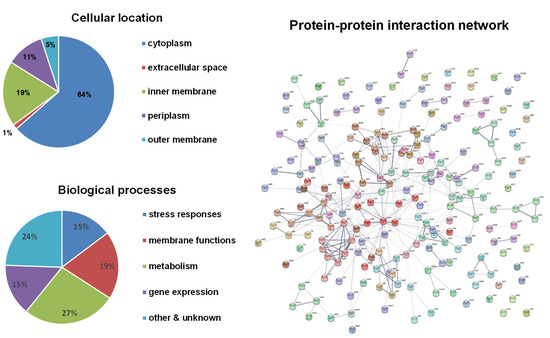
Figure 1.
Bioinformatical analyses of H2O2-resistance genes. The subcellular localization of proteins was obtained from the EcoCyc E. coli Database. The identified proteins were classified into functional categories according to their annotated functions in the UniProt-GOA Database and analyzed by DAVID Bioinformatics Resources. Protein–protein functional interaction networks were analyzed with the STRING database. A high-resolution interaction map is shown in Figure S1.
To identify genes which mediate stronger resistance to H2O2, we used a 3-fold MIC for the wild-type strain (6 mM H2O2) to screen those 217 candidate genes. Only 20 strains could grow, including appY, citG, damX, ilvA, katE, katG, kefC, leuA, metN, prpE, rho, sapC, yajQ, ybhC, ydhL, yhjJ, yncC, yncG, yqhA, and yrbB, which were selected for further validation. A summary of the current knowledge about these genes is shown in Table 2. Besides katE, katG, and yncG, which are oxidative stress response genes, most genes play roles in either membrane transport or gene expression and regulation. More details are described in the Discussion section.
Table 2.
List of genes mediating stronger H2O2 resistance.
3.2. Genome-Wide Screening of Resistance Genes against HOCl
Similar screenings were performed with HOCl (in the form of NaOCl) as the oxidizing agent. The MIC was 1 mM for the no-insert control strain. Then, we used a 2-fold MIC (2 mM NaOCl) to screen the whole ASKA library. Compared to H2O2, there were fewer resistance genes for HOCl. Only 114 strains could grow in 2 mM NaOCl. We divided them into categories based on their biological functions (Table 3).
Table 3.
List of HOCl-resistance genes from the genome-wide screening.
Bioinformatical analyses were performed on these candidate genes (Figure 2). Compared to the H2O2 results, a higher number of inner membrane-associated proteins appeared to be coded by HOCl-resistance genes. Similar to H2O2-resistance genes, the functions of these candidate genes also cover a wide range of biological processes and focus on stress responses, membrane functions, metabolism, and gene expression. A little higher proportion of genes involved in membrane functions were identified for HOCl-resistance. The protein–protein interaction network only showed two clusters: (1) the respiration chain including hydrogenase (hyaA, hyaC, hyaE, hyaF) and ubiquinol oxidase (cbdA); (2) flagellar biosynthesis and mobility including fliP, fliS, motB, cheW, and tap, which was found also in H2O2-resistance genes.
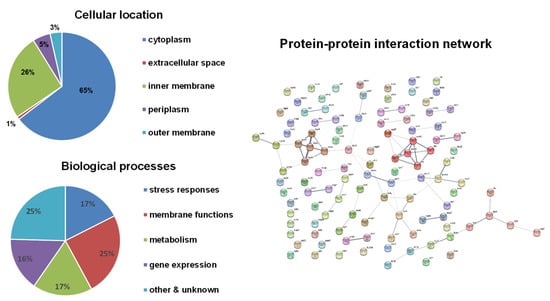
Figure 2.
Bioinformatical analyses of HOCl-resistance genes. The subcellular localization of proteins was obtained from the EcoCyc E. coli Database. The identified proteins were classified into functional categories according to their annotated functions in the UniProt-GOA Database and analyzed by DAVID Bioinformatics Resources. Protein–protein functional interaction networks were analyzed with the STRING database. A high-resolution interaction map is shown in Figure S2.
To identify genes which mediate stronger resistance to HOCl, we used a 3-fold MIC for the wide-type strain (3 mM NaOCl) to screen the identified 114 candidate genes. Only 23 strains could grow, which expressed elaA, exbD, frmB, hyaC, hyaE, ilvA, marC, motB, prpE, rnc, rsuA, sanA, sucC, tap, ybhR, ycbB, yccJ, ycdK, yedQ, yfdY, yhdJ, yoaE, and ytfI. They were selected for further validation. A summary of the current knowledge about these genes is presented in Table 4. Similar to the H2O2 results, membrane transport and gene expression are also two important functions of HOCl-resistance genes. Furthermore, cellular redox balances and DNA damage responses are two unique processes of HOCl-resistance genes. More details are described in the Discussion section.
Table 4.
List of genes mediating stronger HOCl-resistance.
3.3. Effects of Overexpressing Selected Resistance Genes in the MG1655 Strain
The host strain for the ASKA library is AG1, which was engineered for high transformation efficiency. Therefore, the AG1 strain may have potential inferences for the screening. To validate the effects of selected candidate genes which made cells resistant to concentrations that were 3-fold the MICs for wild-type cells in the first screening, we overexpressed each of them (20 genes for H2O2 reported in Table 2 and 23 genes for HOCl reported in Table 4) in the K-12 strain MG1655, which is commonly used for E. coli physiology studies. The LB medium is a rich medium containing amino acids that react with oxidizing agents to potentially affect cellular responses. Therefore, we used both the LB medium and the M9 minimal medium (0.2% glucose) to determine MICs in the validation experiments. MICs of H2O2 and NaOCl for the no-insert control strain (MG1655 with pCA24N empty vector) were 2 mM for H2O2 and 2 mM for NaOCl. Then, we determined the MICs of H2O2 or NaOCl for each resistance gene overexpressed in MG1655 cells (Figure 3). All the genes did not show significant differences in the MICs using the LB medium and the M9 minimal medium. The results were consistent with those of the ASKA library screening. All candidate resistance genes allowed MG1655 cells to grow at concentrations at least 3-fold the MICs for the control strain. For H2O2, there were 10 genes that allowed cells to grow in the presence of even higher concentrations. Besides katE and katG, which encode two known catalases, overexpression of rho made cells resistant to 12 mM H2O2, while overexpression of appY, mcbR, or yncG increased the MIC to 5-fold (10 mM H2O2) of the MIC for the control strain. On the other hand, overexpression of only one gene (yoaE) required a slightly higher MIC (8 mM NaOCl) for HOCl resistance.
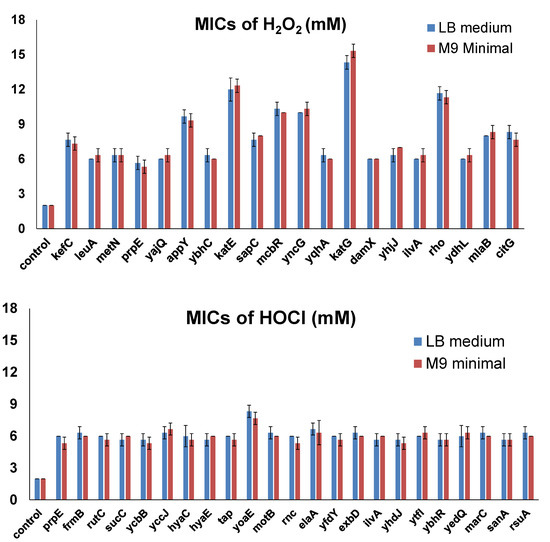
Figure 3.
MICs of selected genes overexpressed in MG1655. MIC determination was performed by varying the concentration of the oxidizing agents, with 1 mM increments from 1 to 20 mM in the LB medium or the M9 minimal medium. The lowest concentration at which bacteria could not grow was recorded as the corresponding MIC. Each strain was tested in three biological replicates. All the differences between MICs of the candidate genes and those of the control were highly significant (p < 0.001).
3.4. Effects of Inactivating Selected Resistance Genes in the E. coli Genome
To further confirm the resistance induced by the selected genes in MG1655 overexpression tests, we determined the MICs of H2O2 or NaOCl in E. coli cells by inactivating each individual gene. For this purpose, we utilized the Keio collection, which contains strains with each non-essential E. coli gene inactivated. Firstly, we determined the MICs of H2O2 or NaOCl for the wild-type control of the Keio collection, i.e., the BW25113 strain. The MICs of BW25113 cells were 5 mM for H2O2 and 6 mM for NaOCl. Then, we determined the MICs of H2O2 or NaOCl for each resistance gene inactivated in BW25113 cells (Figure 4). As shown, inactivation of most candidate genes (except for prpE for HOCl resistance) made E. coli cells more sensitive to H2O2 or NaOCl compared to the wild-type strain, confirming that resistance genes identified from the ASKA library could help cells survive in the presence of oxidizing agents. Compared to gene overexpression testing, in which all the candidates showed highly significant effects (Figure 3), gene inactivation testing did not produce highly significant effects (except for ∆katE). This observation indicates that there are other defense mechanisms which can compensate for the inactivated resistance genes.
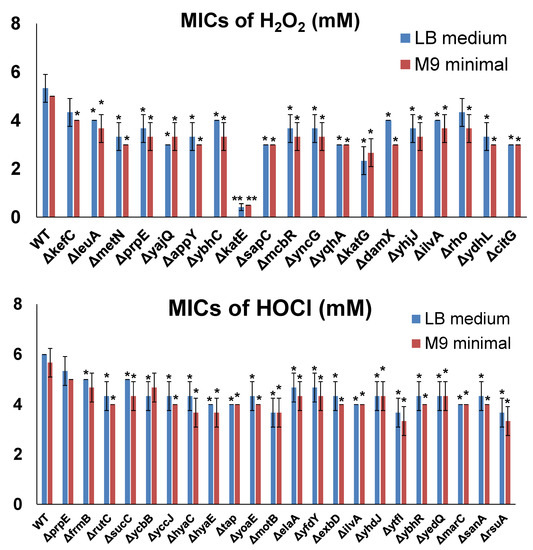
Figure 4.
MICs of selected genes inactivated in BW25113 cells from the Keio collection. MIC determination was performed by varying the concentration of the oxidizing agents, with 1 mM increments from 1 to 10 mM for both H2O2 and HOCl and 0.25 mM increments from 0 to 1 mM (if MICs were lower than 1 mM) in LB medium or M9 minimal medium. The lowest concentration at which bacteria could not grow was recorded as the corresponding MIC. Each strain was tested in three biological replicates. Significant differences (p < 0.05) are marked with *, and highly significant differences (p < 0.001) are marked with **.
4. Discussion
4.1. Summary of the Study
Aiming to identify genes in the whole genome of E. coli cells whose expression can induce resistance to H2O2 or HOCl, this study utilized the ASKA library and further validated candidate genes in common E. coli K-12 strains. In total, ~4200 ORFs from the ASKA library were tested individually. Besides some well-known genes such as katG and katE for oxidative stress responses, this study identified a number of genes (105 genes for H2O2 and 63 genes for HOCl) which had not been shown to associate with oxidative stress responses before. On the other hand, some well-known response genes such as oxyR for H2O2 responses and hypT for HOCl responses were not identified in our study. To confirm this result, we determined the MICs of MG1655 cells expressing oxyR or hypT individually using the same protocol as that for candidate genes. The results showed that the engineered cells had the same MICs as those of WT MG1655 cells. One possible reason is that these response proteins are activated upon oxidation by oxidizing agents [20,62] and, when they were overexpressed in our screening, the average oxidation stoichiometry decreased below the level necessary for their activation. Thus, our study nicely complements previous oxidative stress studies, providing new information in this field.
We identified 217 candidate genes for H2O2 resistance and 114 candidate genes for HOCl resistance from our genome-wide screening. Only 27 genes were identified in both sets of candidate genes, including agar, agaS, cheW, exbD, fliS, gloA, hyaA, ilvA, leuA, motB, nrfC, prpE, sbmC, slyB, sucC, ubiD, upp, yagM, ybhC, ydeQ, ydfB, ydfD, ydhL, yhaJ, yodA, yoeE, and yrbB. A summary of the current knowledge of these genes is presented in Table 5. Most of them are involved in stress responses, gene expression, membrane transport, and cell mobility. These overlaps indicate shared mechanisms in oxidative stress responses. However, we also found a large number of genes specific for H2O2 or HOCl, indicating distinct mechanisms in oxidative stress responses. Further studies will be implemented to explore the mechanisms of the genes associated with oxidative stress responses.
Table 5.
List of identified genes mediating both H2O2 and HOCl-resistance.
4.2. H2O2-Resistance Genes
Twenty genes were identified to mediate stronger H2O2 resistance (Table 2). Among them, 13 genes encode proteins which function in the cytosol, while the others encode proteins located in cell membranes. Most of these genes have been functionally studied. Besides two well-known catalase genes katG and katE, the functions of other genes are diverse. For instance, appY and mcbR function as transcriptional regulators; leuA, prpE, ilvA, and citG encode enzymes involved in cell metabolism; kefC, metN, sapC, yqhA, and mlaB encode membrane proteins.
Unsurprisingly, katG and katE in E. coli induce stronger H2O2 resistance than other genes. Interestingly, although the strain with katG overexpression showed a higher MIC (15 mM) than the one overexpressing katE (12 mM), the ΔkatE strain (MIC 0.5 mM) apeared more sensitive to H2O2 than the ΔkatG strain (MIC 2 mM). One possible explanation for this paradox is that a threshold concentration of H2O2 is required for katG expression [76]. Moreover, the katG gene is regulated by the OxyR regulon [77], while the expression of the katE gene is permanently induced in aerobic environment [78]. Thus, katE can quickly protect cells when katG is inactivated.
The gene rho encodes the transcription termination factor Rho, which is responsible for the termination of over half of the transcripts [79] and is related to several important physiological processes in E. coli [42]. It mediates a strong H2O2 resistance (MIC 12 mM) when overexpressed but is not very sensitive to H2O2 when inactivated. This could be explained by the previous finding that the activity of Rho in bacteria could be altered under stressful conditions [80]. Overexpression of rho could compensate the negative effects brought by a dysfunctional Rho under stress conditions.
The transcriptional regulator OxyR has been known as the major regulon for responses to H2O2 stress [14]. In this study, two more transcriptional regulators, AppY and McbR, were also identified. The overexpression of appY and mcbR allowed E. coli cells to grow in 10 mM H2O2. AppY was found to function as a transcriptional activator of energy metabolism genes under stressful conditions such as anaerobiosis and phosphate starvation [33]. It was reported that a AppY-defective E. coli strain was more sensitive to H2O2 than the wild-type strain [81], which is consistent with our result. On the other hand, McbR has been demonstrated to be involved in H2O2 responses in avian pathogenic E. coli by downregulating the expression of the stress response genes yciF and yciE [82].
In addition to the genes discussed above, yncG, a gene for a putative glutathione S-transferase, was also shown to induce obvious H2O2 resistance in our tests. Although one previous study demonstrated that YncG does not exhibit GSH activity when expressed in cell-free systems [38], YncG may have a different function in vivo, i.e., a GSH-dependent peroxidase activity similar to that of another putative glutathione S-transferase, GST B1-1 [83].
4.3. HOCl-Resistance Genes
Twenty-three genes were identified to mediate stronger HOCl resistance (Table 4). Among these genes, 12 genes encode proteins functioning in the cytosol, while the others encode proteins located in membranes. Surprisingly, all of these 23 genes have not been mentioned as parts of any known HOCl response mechanisms. Some of them have been indicated to be activated under stress conditions. For example, ycbB encodes the L,D-transpeptidase with a role in protecting outer membranes during cell envelope stress [48]; The yedQ gene encodes a probable inner membrane protein with predicted diguanylate cyclase activity [59]. Expression of sanA is implicated in strengthening membrane permeability in stationary-phase stress responses [60]. It is reasonable that these three genes encode proteins in membrane systems, as HOCl has been found to damage the cell envelope system of bacteria [19]. Besides them, we also identified eight genes (marC, ybhR, exbD, yfdY, motB, yoaE, hyaC, and tap), which encode proteins in membrane systems. Among them, yfdY was indicated as a participant in biofilm formation, which is a defense mechanism against HOCl in E. coli [55].
In addition to genes coding for membrane-associated proteins, we also identified genes involved in other biological processes such as metabolism (sucC in the citric acid cycle; prpE in propionate metabolism) [31], amino acid synthesis (ilvA in isoleucine biosynthesis) [41], DNA and RNA modifications (yhdJ for methylation of genomic DNA; rsuA for pseudouridylation of 16S rRNA) [57,61], and rRNA processing (rnc) [54]. One possible mechanism is that overexpression of these proteins could compensate for their corresponding native proteins which are inactivated by oxidation.
Different from the results for H2O2, MIC determination tests showed no significant differences among the 23 candidate genes for HOCl. Only yoaE, which encodes a putative transport protein, induced slightly stronger HOCl resistance than other genes. Although there is no previous report indicating the role of YoaE in E. coli stress responses, a recent study demonstrated that the expression of the yoaE gene in Salmonella enterica could be upregulated by CpxR, which plays an important role in repairing bacterial envelope damages [84].
5. Conclusions
In this study, we performed genome-wide screening of the E. coli ASKA collection and identified 217 candidate genes for H2O2 resistance and 114 candidate genes for HOCl resistance. Among them, 105 genes for H2O2 and 63 genes for HOCl were not shown to associate with oxidative stress responses before. Further studies are necessary to validate the genes here identified, which appear as promising new candidates for oxidative stress studies. Furthermore, because the disinfecting mechanisms of many antibiotics are related to oxidative stress, this study is expected to facilitate antibiotic development.
Supplementary Materials
The following are available online at https://www.mdpi.com/article/10.3390/antiox10060861/s1, Figure S1: High-resolution image of the protein–protein interaction map for H2O2 resistance genes; Figure S2: High-resolution image of the protein–protein interaction map for HOCl resistance genes.
Author Contributions
Conceptualization, C.F.; data analysis, H.C. and C.F.; data curation, H.C., J.W., C.E., H.S., Q.G., and C.F.; writing—original draft preparation, H.C. and C.F.; writing—review and editing, H.C., J.W., C.E., H.S., Q.G., and C.F. All authors have read and agreed to the published version of the manuscript.
Funding
This research was funded by the National Institutes of Health (R15GM140433 and P20GM139768) and a Honors College Research Grant from University of Arkansas. The APC was funded by the National Institutes of Health.
Institutional Review Board Statement
Not applicable.
Informed Consent Statement
Not applicable.
Data Availability Statement
Data is contained within the article and supplementary material.
Conflicts of Interest
The authors declare no conflict of interest.
References
- Ezraty, B.; Gennaris, A.; Barras, F.; Collet, J.-F. Oxidative stress, protein damage and repair in bacteria. Nat. Rev. Microbiol. 2017, 15, 385–396. [Google Scholar] [CrossRef] [PubMed]
- Imlay, J.A. The molecular mechanisms and physiological consequences of oxidative stress: Lessons from a model bacterium. Nat. Rev. Microbiol. 2013, 11, 443–454. [Google Scholar] [CrossRef] [PubMed]
- Dixon, S.J.; Stockwell, B.R. The role of iron and reactive oxygen species in cell death. Nat. Chem. Biol. 2014, 10, 9–17. [Google Scholar] [CrossRef] [PubMed]
- Redza-Dutordoir, M.; Averill-Bates, D.A. Activation of apoptosis signalling pathways by reactive oxygen species. Biochim. Et Biophys. Acta Mol. Cell Res. 2016, 1863, 2977–2992. [Google Scholar] [CrossRef] [PubMed]
- Imlay, J.A. Where in the world do bacteria experience oxidative stress? Environ. Microbiol. 2019, 21, 521–530. [Google Scholar] [CrossRef]
- Winterbourn, C.C. Biological production, detection, and fate of hydrogen peroxide. Antioxid. Redox Signal. 2018, 29, 541–551. [Google Scholar] [CrossRef]
- Cornelis, P.; Wei, Q.; Andrews, S.C.; Vinckx, T. Iron homeostasis and management of oxidative stress response in bacteria. Metallomics 2011, 3, 540–549. [Google Scholar] [CrossRef]
- Jang, S.; Imlay, J.A. Hydrogen peroxide inactivates the Escherichia coli Isc iron-sulphur assembly system, and OxyR induces the Suf system to compensate. Mol. Microbiol. 2010, 78, 1448–1467. [Google Scholar] [CrossRef]
- Brudzynski, K.; Abubaker, K.; Miotto, D. Unraveling a mechanism of honey antibacterial action: Polyphenol/H2O2-induced oxidative effect on bacterial cell growth and on DNA degradation. Food Chem. 2012, 133, 329–336. [Google Scholar] [CrossRef]
- Dahl, J.-U.; Gray, M.J.; Jakob, U. Protein quality control under oxidative stress conditions. J. Mol. Biol. 2015, 427, 1549–1563. [Google Scholar] [CrossRef] [PubMed]
- Panchuk, R.R.; Lehka, L.V.; Terenzi, A.; Matselyukh, B.P.; Rohr, J.; Jha, A.K.; Downey, T.; Kril, I.J.; Herbacek, I.; van Schoonhoven, S. Rapid generation of hydrogen peroxide contributes to the complex cell death induction by the angucycline antibiotic landomycin E. Free Radic. Biol. Med. 2017, 106, 134–147. [Google Scholar] [CrossRef] [PubMed]
- Van Acker, H.; Coenye, T. The role of reactive oxygen species in antibiotic-mediated killing of bacteria. Trends Microbiol. 2017, 25, 456–466. [Google Scholar] [CrossRef]
- Imlay, J.A. Diagnosing oxidative stress in bacteria: Not as easy as you might think. Curr. Opin. Microbiol. 2015, 24, 124–131. [Google Scholar] [CrossRef] [PubMed]
- Jo, I.; Chung, I.-Y.; Bae, H.-W.; Kim, J.-S.; Song, S.; Cho, Y.-H.; Ha, N.-C. Structural details of the OxyR peroxide-sensing mechanism. Proc. Natl. Acad. Sci. USA 2015, 112, 6443–6448. [Google Scholar] [CrossRef] [PubMed]
- Seo, S.W.; Kim, D.; Szubin, R.; Palsson, B.O. Genome-wide Reconstruction of OxyR and SoxRS Transcriptional Regulatory Networks under Oxidative Stress in Escherichia coli K-12 MG1655. Cell Rep. 2015, 12, 1289–1299. [Google Scholar] [CrossRef]
- Niu, W.; Zhang, Y.; Liu, J.; Wen, T.; Miao, T.; Basit, A.; Jiang, W. OxyR controls magnetosome formation by regulating magnetosome island (MAI) genes, iron metabolism, and redox state. Free Radic. Biol. Med. 2020, 161, 272–282. [Google Scholar] [CrossRef]
- Sultana, S.; Foti, A.; Dahl, J.-U. Bacterial Defense Systems against the Neutrophilic Oxidant Hypochlorous Acid. Infect. Immun. 2020, 88, e00964-19. [Google Scholar] [CrossRef]
- Goemans, C.V.; Collet, J.F. Stress-induced chaperones: A first line of defense against the powerful oxidant hypochlorous acid. F1000Res 2019, 8, 1678. [Google Scholar] [CrossRef] [PubMed]
- da Cruz Nizer, W.S.; Inkovskiy, V.; Overhage, J. Surviving reactive chlorine stress: Responses of gram-negative bacteria to hypochlorous acid. Microorganisms 2020, 8, 1220. [Google Scholar] [CrossRef] [PubMed]
- Drazic, A.; Miura, H.; Peschek, J.; Le, Y.; Bach, N.C.; Kriehuber, T.; Winter, J. Methionine oxidation activates a transcription factor in response to oxidative stress. Proc. Natl. Acad. Sci. USA 2013, 110, 9493–9498. [Google Scholar] [CrossRef]
- Soo, V.W.; Hanson-Manful, P.; Patrick, W.M. Artificial gene amplification reveals an abundance of promiscuous resistance determinants in Escherichia coli. Proc. Natl. Acad. Sci. USA 2011, 108, 1484–1489. [Google Scholar] [CrossRef] [PubMed]
- Qimron, U.; Marintcheva, B.; Tabor, S.; Richardson, C.C. Genomewide screens for Escherichia coli genes affecting growth of T7 bacteriophage. Proc. Natl. Acad. Sci. USA 2006, 103, 19039–19044. [Google Scholar] [CrossRef]
- Chen, H.; Venkat, S.; Wilson, J.; McGuire, P.; Chang, A.L.; Gan, Q.; Fan, C. Genome-wide quantification of the effect of gene overexpression on Escherichia coli growth. Genes 2018, 9, 414. [Google Scholar] [CrossRef] [PubMed]
- Keseler, I.M.; Mackie, A.; Santos-Zavaleta, A.; Billington, R.; Bonavides-Martinez, C.; Caspi, R.; Fulcher, C.; Gama-Castro, S.; Kothari, A.; Krummenacker, M.; et al. The EcoCyc database: Reflecting new knowledge about Escherichia coli K-12. Nucleic Acids Res. 2017, 45, D543–D550. [Google Scholar] [CrossRef]
- Huntley, R.P.; Sawford, T.; Mutowo-Meullenet, P.; Shypitsyna, A.; Bonilla, C.; Martin, M.J.; O’Donovan, C. The GOA database: Gene Ontology annotation updates for 2015. Nucleic Acids Res. 2015, 43, D1057–D1063. [Google Scholar] [CrossRef]
- Huang da, W.; Sherman, B.T.; Lempicki, R.A. Bioinformatics enrichment tools: Paths toward the comprehensive functional analysis of large gene lists. Nucleic Acids Res. 2009, 37, 1–13. [Google Scholar] [CrossRef] [PubMed]
- von Mering, C.; Jensen, L.J.; Snel, B.; Hooper, S.D.; Krupp, M.; Foglierini, M.; Jouffre, N.; Huynen, M.A.; Bork, P. String: Known and predicted protein-protein associations, integrated and transferred across organisms. Nucleic Acids Res. 2005, 33, D433–D437. [Google Scholar] [CrossRef]
- Ferguson, G.P.; Nikolaev, Y.; McLaggan, D.; Maclean, M.; Booth, I.R. Survival during exposure to the electrophilic reagent N-ethylmaleimide in Escherichia coli: Role of KefB and KefC potassium channels. J. Bacteriol. 1997, 179, 1007–1012. [Google Scholar] [CrossRef] [PubMed]
- Stieglitz, B.I.; Calvo, J.M. Distribution of the isopropylmalate pathway to leucine among diverse bacteria. J. Bacteriol. 1974, 118, 935–941. [Google Scholar] [CrossRef]
- Kadaba, N.S.; Kaiser, J.T.; Johnson, E.; Lee, A.; Rees, D.C. The high-affinity E. coli methionine ABC transporter: Structure and allosteric regulation. Science 2008, 321, 250–253. [Google Scholar] [CrossRef]
- Brock, M.; Maerker, C.; Schütz, A.; Völker, U.; Buckel, W. Oxidation of propionate to pyruvate in Escherichia coli: Involvement of methylcitrate dehydratase and aconitase. Eur. J. Biochem. 2002, 269, 6184–6194. [Google Scholar] [CrossRef] [PubMed]
- Saveanu, C.; Miron, S.; Borza, T.; Craescu, C.T.; Labesse, G.; Gagyi, C.; Popescu, A.; Schaeffer, F.; Namane, A.; Laurent-Winter, C. Structural and nucleotide-binding properties of YajQ and YnaF, two Escherichia coli proteins of unknown function. Protein Sci. 2002, 11, 2551–2560. [Google Scholar] [CrossRef] [PubMed]
- Atlung, T.; Brøndsted, L. Role of the transcriptional activator AppY in regulation of the cyx appA operon of Escherichia coli by anaerobiosis, phosphate starvation, and growth phase. J. Bacteriol. 1994, 176, 5414–5422. [Google Scholar] [CrossRef]
- Molloy, M.P.; Herbert, B.R.; Slade, M.B.; Rabilloud, T.; Nouwens, A.S.; Williams, K.L.; Gooley, A.A. Proteomic analysis of the Escherichia coli outer membrane. Eur. J. Biochem. 2000, 267, 2871–2881. [Google Scholar] [CrossRef]
- Loewen, P.C.; Switala, J. Purification and characterization of catalase HPII from Escherichia coli K12. Biochem. Cell Biol. 1986, 64, 638–646. [Google Scholar] [CrossRef] [PubMed]
- Sugiyama, Y.; Nakamura, A.; Matsumoto, M.; Kanbe, A.; Sakanaka, M.; Higashi, K.; Igarashi, K.; Katayama, T.; Suzuki, H.; Kurihara, S. A novel putrescine exporter SapBCDF of Escherichia coli. J. Biol. Chem. 2016, 291, 26343–26351. [Google Scholar] [CrossRef] [PubMed]
- Lord, D.M.; Uzgoren Baran, A.; Soo, V.W.C.; Wood, T.K.; Peti, W.; Page, R. McbR/YncC: Implications for the mechanism of ligand and DNA binding by a bacterial GntR transcriptional regulator involved in biofilm formation. Biochemistry 2014, 53, 7223–7231. [Google Scholar] [CrossRef]
- Kanai, T.; Takahashi, K.; Inoue, H. Three distinct-type glutathione S-transferases from Escherichia coli important for defense against oxidative stress. J. Biochem. 2006, 140, 703–711. [Google Scholar] [CrossRef]
- Loewen, P.C.; Triggs, B.L.; George, C.S.; Hrabarchuk, B.E. Genetic mapping of katG, a locus that affects synthesis of the bifunctional catalase-peroxidase hydroperoxidase I in Escherichia coli. J. Bacteriol. 1985, 162, 661–667. [Google Scholar] [CrossRef]
- Yahashiri, A.; Jorgenson, M.A.; Weiss, D.S. Bacterial SPOR domains are recruited to septal peptidoglycan by binding to glycan strands that lack stem peptides. Proc. Natl. Acad. Sci. USA 2015, 112, 11347–11352. [Google Scholar] [CrossRef]
- Grimminger, H.; Rahimi-Laridjani, I.; Koerner, K.; Lingens, F. Purification of threonine deaminase from Escherichia coli. Febs Lett. 1973, 35, 273–275. [Google Scholar] [CrossRef]
- Mitra, P.; Ghosh, G.; Hafeezunnisa, M.; Sen, R. Rho protein: Roles and mechanisms. Annu. Rev. Microbiol. 2017, 71, 687–709. [Google Scholar] [CrossRef] [PubMed]
- Hughes, G.W.; Hall, S.C.L.; Laxton, C.S.; Sridhar, P.; Mahadi, A.H.; Hatton, C.; Piggot, T.J.; Wotherspoon, P.J.; Leney, A.C.; Ward, D.G. Evidence for phospholipid export from the bacterial inner membrane by the Mla ABC transport system. Nat. Microbiol. 2019, 4, 1692–1705. [Google Scholar] [CrossRef] [PubMed]
- Schneider, K.; Dimroth, P.; Bott, M. Identification of triphosphoribosyl-dephospho-CoA as precursor of the citrate lyase prosthetic group. Febs Lett. 2000, 483, 165–168. [Google Scholar] [CrossRef]
- Gonzalez, C.F.; Proudfoot, M.; Brown, G.; Korniyenko, Y.; Mori, H.; Savchenko, A.V.; Yakunin, A.F. Molecular basis of formaldehyde detoxification: Characterization of two S-formylglutathione hydrolases from Escherichia coli, FrmB and YeiG. J. Biol. Chem. 2006, 281, 14514–14522. [Google Scholar] [CrossRef]
- Knapik, A.A.; Petkowski, J.J.; Otwinowski, Z.; Cymborowski, M.T.; Cooper, D.R.; Chruszcz, M.; Krajewska, W.M.; Minor, W. Structure of Escherichia coli RutC, a member of the YjgF family and putative aminoacrylate peracid reductase of the rut operon. Acta Crystallogr. Sect. F Struct. Biol. Cryst. Commun. 2012, 68, 1294–1299. [Google Scholar] [CrossRef]
- Buck, D.; Guest, J.R. Overexpression and site-directed mutagenesis of the succinyl-CoA synthetase of Escherichia coli and nucleotide sequence of a gene (g30) that is adjacent to the suc operon. Biochem. J. 1989, 260, 737–747. [Google Scholar] [CrossRef] [PubMed]
- Morè, N.; Martorana, A.M.; Biboy, J.; Otten, C.; Winkle, M.; Serrano, C.K.G.; Silva, A.M.; Atkinson, L.; Yau, H.; Breukink, E. Peptidoglycan remodeling enables Escherichia coli to survive severe outer membrane assembly defect. mBio 2019, 10, e02729-18. [Google Scholar] [CrossRef] [PubMed]
- Volbeda, A.; Darnault, C.; Parkin, A.; Sargent, F.; Armstrong, F.A.; Fontecilla-Camps, J.C. Crystal structure of the O2-tolerant membrane-bound hydrogenase 1 from Escherichia coli in complex with its cognate cytochrome b. Structure 2013, 21, 184–190. [Google Scholar] [CrossRef] [PubMed]
- Dubini, A.; Sargent, F. Assembly of Tat-dependent [NiFe] hydrogenases: Identification of precursor-binding accessory proteins. Febs Lett. 2003, 549, 141–146. [Google Scholar] [CrossRef]
- Manson, M.D.; Blank, V.; Brade, G.; Higgins, C.F. Peptide chemotaxis in E. coli involves the Tap signal transducer and the dipeptide permease. Nature 1986, 321, 253–256. [Google Scholar] [CrossRef]
- Daley, D.O.; Rapp, M.; Granseth, E.; Melén, K.; Drew, D.; Von Heijne, G. Global topology analysis of the Escherichia coli inner membrane proteome. Science 2005, 308, 1321–1323. [Google Scholar] [CrossRef]
- Ridgway, H.G.; Silverman, M.; Simon, M.I. Localization of proteins controlling motility and chemotaxis in Escherichia coli. J. Bacteriol. 1977, 132, 657–665. [Google Scholar] [CrossRef]
- Robertson, H.D.; Dunn, J.J. Ribonucleic acid processing activity of Escherichia coli ribonuclease III. J. Biol. Chem. 1975, 250, 3050–3056. [Google Scholar] [CrossRef]
- Ren, D.; Bedzyk, L.A.; Thomas, S.M.; Ye, R.W.; Wood, T.K. Gene expression in Escherichia coli biofilms. Appl. Microbiol. Biotechnol. 2004, 64, 515–524. [Google Scholar] [CrossRef]
- Ollis, A.A.; Manning, M.; Held, K.G.; Postle, K. Cytoplasmic membrane protonmotive force energizes periplasmic interactions between ExbD and TonB. Mol. Microbiol. 2009, 73, 466–481. [Google Scholar] [CrossRef] [PubMed]
- Broadbent, S.E.; Balbontin, R.; Casadesus, J.; Marinus, M.G.; van der Woude, M. YhdJ, a nonessential CcrM-like DNA methyltransferase of Escherichia coli and Salmonella enterica. J. Bacteriol. 2007, 189, 4325–4327. [Google Scholar] [CrossRef]
- Yamanaka, Y.; Shimada, T.; Yamamoto, K.; Ishihama, A. Transcription factor CecR (YbiH) regulates a set of genes affecting the sensitivity of Escherichia coli against cefoperazone and chloramphenicol. Microbiology 2016, 162, 1253–1264. [Google Scholar] [CrossRef] [PubMed]
- Hengge, R.; Galperin, M.Y.; Ghigo, J.-M.; Gomelsky, M.; Green, J.; Hughes, K.T.; Jenal, U.; Landini, P. Systematic nomenclature for GGDEF and EAL domain-containing cyclic di-GMP turnover proteins of Escherichia coli. J. Bacteriol. 2016, 198, 7–11. [Google Scholar] [CrossRef] [PubMed]
- Mitchell, A.M.; Wang, W.; Silhavy, T.J. Novel RpoS-dependent mechanisms strengthen the envelope permeability barrier during stationary phase. J. Bacteriol. 2017, 199, e00708-16. [Google Scholar] [CrossRef]
- Conrad, J.; Niu, L.; Rudd, K.; Lane, B.G.; Ofengand, J. 16S ribosomal RNA pseudouridine synthase RsuA of Escherichia coli: Deletion, mutation of the conserved Asp102 residue, and sequence comparison among all other pseudouridine synthases. RNA 1999, 5, 751–763. [Google Scholar] [CrossRef]
- Zheng, M.; Aslund, F.; Storz, G. Activation of the OxyR transcription factor by reversible disulfide bond formation. Science 1998, 279, 1718–1721. [Google Scholar] [CrossRef] [PubMed]
- Volbeda, A.; Amara, P.; Darnault, C.; Mouesca, J.-M.; Parkin, A.; Roessler, M.M.; Armstrong, F.A.; Fontecilla-Camps, J.C. X-ray crystallographic and computational studies of the O2-tolerant [NiFe]-hydrogenase 1 from Escherichia coli. Proc. Natl. Acad. Sci. USA 2012, 109, 5305–5310. [Google Scholar] [CrossRef] [PubMed]
- Gegner, J.A.; Dahlquist, F.W. Signal transduction in bacteria: CheW forms a reversible complex with the protein kinase CheA. Proc. Natl. Acad. Sci. USA 1991, 88, 750–754. [Google Scholar] [CrossRef]
- Hantke, K. Bacterial zinc uptake and regulators. Curr. Opin. Microbiol. 2005, 8, 196–202. [Google Scholar] [CrossRef] [PubMed]
- Kutsukake, K. Excretion of the anti-sigma factor through a flagellar substructure couples flagellar gene expression with flagellar assembly in Salmonella typhimurium. Mol. Gen. Genet. MGG 1994, 243, 605–612. [Google Scholar] [CrossRef] [PubMed]
- Clugston, S.L.; Barnard, J.F.J.; Kinach, R.; Miedema, D.; Ruman, R.; Daub, E.; Honek, J.F. Overproduction and characterization of a dimeric non-zinc glyoxalase I from Escherichia coli: Evidence for optimal activation by nickel ions. Biochemistry 1998, 37, 8754–8763. [Google Scholar] [CrossRef]
- Masuda, H.; Awano, N.; Inouye, M. ydfD encodes a novel lytic protein in Escherichia coli. Fems Microbiol. Lett. 2016, 363, fnw039. [Google Scholar] [CrossRef][Green Version]
- Maddalo, G.; Stenberg-Bruzell, F.; Götzke, H.R.; Toddo, S.; Björkholm, P.; Eriksson, H.; Chovanec, P.; Genevaux, P.; Lehtiö, J.; Ilag, L.L. Systematic analysis of native membrane protein complexes in Escherichia coli. J. Proteome Res. 2011, 10, 1848–1859. [Google Scholar] [CrossRef]
- Panina, E.M.; Mironov, A.A.; Gelfand, M.S. Comparative analysis of FUR regulons in gamma-proteobacteria. Nucleic Acids Res. 2001, 29, 5195–5206. [Google Scholar] [CrossRef]
- Chatterji, M.; Nagaraja, V. GyrI: A counter-defensive strategy against proteinaceous inhibitors of DNA gyrase. Embo Rep. 2002, 3, 261–267. [Google Scholar] [CrossRef]
- Andersen, P.S.; Smith, J.M.; Mygind, B. Characterization of the upp gene encoding uracil phosphoribosyltransferase of Escherichia coli K12. Eur. J. Biochem. 1992, 204, 51–56. [Google Scholar] [CrossRef]
- Palevsky, N.; Shemer, B.; Connolly, J.P.R.; Belkin, S. The highly conserved Escherichia coli transcription factor yhaJ regulates aromatic compound degradation. Front. Microbiol. 2016, 7, 1490. [Google Scholar] [CrossRef]
- Ray, W.K.; Larson, T.J. Application of AgaR repressor and dominant repressor variants for verification of a gene cluster involved in N-acetylgalactosamine metabolism in Escherichia coli K-12. Mol. Microbiol. 2004, 51, 813–826. [Google Scholar] [CrossRef]
- Leppik, R.A.; Young, I.G.; Gibson, F. Membrane-associated reactions in ubiquinone biosynthesis in Escherichia coli. 3-Octaprenyl-4-hydroxybenzoate carboxy-lyase. Biochim. Et Biophys. Acta Biomembr. 1976, 436, 800–810. [Google Scholar] [CrossRef]
- Hui, D.; Khaiat, S.; Uy, T.; Xu, H. Partial confirmation of single katG and katE knockouts and double katG/katE knockouts created from isogenic background of Escherichia coli K-12 strains. J. Exp. Microbiol. Immunol. 2014, 18, 139–145. [Google Scholar]
- Ivanova, A.; Miller, C.; Glinsky, G.; Eisenstark, A. Role of rpoS (katF) in oxyR-independent regulation of hydroperoxidase I in Escherichia coli. Mol. Microbiol. 1994, 12, 571–578. [Google Scholar] [CrossRef] [PubMed]
- Schellhorn, H.E.; Hassan, H.M. Transcriptional regulation of katE in Escherichia coli K-12. J. Bacteriol. 1988, 170, 4286–4292. [Google Scholar] [CrossRef]
- Wang, M.; Herrmann, C.J.; Simonovic, M.; Szklarczyk, D.; von Mering, C. Version 4.0 of PaxDb: Protein abundance data, integrated across model organisms, tissues, and cell-lines. Proteomics 2015, 15, 3163–3168. [Google Scholar] [CrossRef]
- Bidnenko, E.; Bidnenko, V. Transcription termination factor Rho and microbial phenotypic heterogeneity. Curr. Genet. 2018, 64, 541–546. [Google Scholar] [CrossRef]
- Lindqvist, A.; Membrillo-Hernández, J.; Poole, R.K.; Cook, G.M. Roles of respiratory oxidases in protecting Escherichia coli K12 from oxidative stress. Antonie Van Leeuwenhoek 2000, 78, 23–31. [Google Scholar] [CrossRef] [PubMed]
- Yu, L.; Li, W.; Qi, K.; Wang, S.; Chen, X.; Ni, J.; Deng, R.; Shang, F.; Xue, T. McbR is involved in biofilm formation and H2O2 stress response in avian pathogenic Escherichia coli X40. Poult. Sci. 2019, 98, 4094–4103. [Google Scholar] [CrossRef] [PubMed]
- Allocati, N.; Favaloro, B.; Masulli, M.; Alexeyev, M.F.; Di Ilio, C. Proteus mirabilis glutathione S-transferase B1-1 is involved in protective mechanisms against oxidative and chemical stresses. Biochem. J. 2003, 373, 305–311. [Google Scholar] [CrossRef] [PubMed]
- Huang, X.; Hu, M.; Zhou, X.; Liu, Y.; Shi, C.; Shi, X. Role of yoaE Gene Regulated by CpxR in the Survival of Salmonella enterica Serovar Enteritidis in Antibacterial Egg White. Msphere 2020, 5, e00638-19. [Google Scholar] [CrossRef]


Publisher’s Note: MDPI stays neutral with regard to jurisdictional claims in published maps and institutional affiliations. |
© 2021 by the authors. Licensee MDPI, Basel, Switzerland. This article is an open access article distributed under the terms and conditions of the Creative Commons Attribution (CC BY) license (https://creativecommons.org/licenses/by/4.0/).