Review

Protein Engineering of Electron Transfer Components from Electroactive Geobacter Bacteria

by
Tomás M. Fernandes
1,
Leonor Morgado
1,
David L. Turner
2 and
Carlos A. Salgueiro
1,*
1
UCIBIO, Chemistry Department, NOVA School of Science and Technology, Universidade NOVA de Lisboa, Campus Caparica, 2829-516 Caparica, Portugal
2
Instituto de Tecnologia Química e Biológica António Xavier, Universidade NOVA de Lisboa, Avenida da República (EAN), 2780-157 Oeiras, Portugal
*
Author to whom correspondence should be addressed.
Antioxidants 2021, 10(6), 844; https://doi.org/10.3390/antiox10060844
Submission received: 2 April 2021 / Revised: 2 May 2021 / Accepted: 20 May 2021 / Published: 25 May 2021
(This article belongs to the Special Issue Redox Biology in Microorganisms)

Abstract

:
Electrogenic microorganisms possess unique redox biological features, being capable of transferring electrons to the cell exterior and converting highly toxic compounds into nonhazardous forms. These microorganisms have led to the development of Microbial Electrochemical Technologies (METs), which include applications in the fields of bioremediation and bioenergy production. The optimization of these technologies involves efforts from several different disciplines, ranging from microbiology to materials science. Geobacter bacteria have served as a model for understanding the mechanisms underlying the phenomenon of extracellular electron transfer, which is highly dependent on a multitude of multiheme cytochromes (MCs). MCs are, therefore, logical targets for rational protein engineering to improve the extracellular electron transfer rates of these bacteria. However, the presence of several heme groups complicates the detailed redox characterization of MCs. In this Review, the main characteristics of electroactive Geobacter bacteria, their potential to develop microbial electrochemical technologies and the main features of MCs are initially highlighted. This is followed by a detailed description of the current methodologies that assist the characterization of the functional redox networks in MCs. Finally, it is discussed how this information can be explored to design optimal Geobacter-mutated strains with improved capabilities in METs.

1. Introduction

Electroactive microorganisms have been extensively studied since their discovery more than a century ago [1] and are defined by their ability to exchange electrons between intracellular donors and extracellular acceptors [2], a phenomenon designated Extracellular Electron Transfer (EET). These microorganisms span all three domains of life (Archaea, Bacteria and Eukarya) and are capable of producing electrical current and transferring electrons to different electrode surfaces in a multitude of bioelectrochemical devices [2]. Electroactive microorganisms have developed metabolic features that allow them to thrive in extreme environments, using toxic and radioactive compounds as terminal electron acceptors [3]. These features make them interesting targets for Microbial Electrochemical Technologies (METs), ranging from bioenergy production [4,5] and bioremediation applications [3,6], to the fields of bioelectronics [7,8] and bionanotechnology [9].
In the last 15 years, METs have been intensively studied as flexible and practical platforms for the mentioned applications, which include electricity production [10], wastewater treatment and pollutant removal [11], desalination [12], production of H2 [13], biomethane [14] and biofuels [15], among other commodities. However, due to the low current production levels, METs are still limited to lab-scale setups, except for a few pilot-scale microbial fuel cells [16] and U(VI) bioremediation stations [17].
The development of METs depends on a better understanding of their abiotic and biotic components, which include the electrode materials [18], the reactor design and operating conditions [19], the medium or electrolyte composition [20,21] and the type of microbial catalyst [22]. From the biotic point of view, the efficacy of the electron transfer processes of the selected microbial catalysts can be optimized through several strategies that include selective adaptation [23], synthetic biology (for a review see [24,25]) and protein engineering, particularly of multiheme cytochromes (MCs), which will be the main focus of this Review.
The highest current densities recorded to date in METs come from mixed cultures that are usually dominated by Deltaproteobacteria of the genus Geobacter [2], such as G. sulfurreducens, making them the most often selected microbial catalyst for such applications. G. sulfurreducens was firstly classified as a strict anaerobe naturally found in a variety of soils and sediments. Later, it was discovered that it could withstand low levels of molecular oxygen, providing an explanation for its abundance in oxic subsurface environments [26]. This bacterium is able to reduce a large variety of extracellular compounds, including Fe(III), U(VI) and Mn(IV) oxides, as well as many toxic organic substances that contaminate soils and wastewaters [27] and for this reason, Geobacter is being explored in bioremediation technologies (Figure 1).
The genome of G. sulfurreducens codes for over 100 putative c-type cytochromes that form electron transfer networks with high flexibility and apparent redundancy [29], thus allowing the reduction of diverse terminal electron acceptors. Up to date, extensive proteomic and gene deletion studies identified different proteins as essential for the reduction of each electron acceptor [30,31,32,33,34,35,36,37,38,39,40,41,42,43,44,45,46,47,48,49,50,51].
The cytochromes from G. sulfurreducens are localized at the bacterium’s inner membrane, periplasm and outer membrane, allowing the transfer of electrons from intracellular carriers, such as NADH, to extracellular acceptors. The current model for EET in this bacterium (Figure 1) states that electrons from NADH are transferred to the menaquinone pool via the NADH dehydrogenase located in the inner membrane. Then, depending on the redox potential of the final electron acceptor, different proteins are involved in the quinone regeneration: the CbcL-dependent pathway operates with acceptors at or below redox potentials of 100 mV (versus the normal hydrogen electrode, NHE), whereas the ImcH-dependent pathway operates above this redox potential [41,51]. In either case, electrons are supplied to periplasmic cytochromes. The most abundant periplasmic cytochromes belong to the PeriPlasmic Cytochrome A (PpcA)-family. This family is composed of five triheme cytochromes (PpcA-E) that are responsible for traversing electrons across the periplasmic space into the outer membrane components. These outer membrane components are porin-cytochrome trans-outer membrane complexes, which are responsible for the reduction of the final extracellular terminal acceptors [35,42].
The suggested model highlights the importance of MCs in the EET mechanisms of G. sulfurreducens. They are logical targets for rational protein engineering focusing on the tuning of their redox properties, resulting in improved forms of these electron transfer components. Rational-mutated Geobacter strain, containing several optimized EET components and increased respiratory rates, can putatively contribute to more efficient METs.
Cytochromes c are proteins containing one or several c-type heme groups that often function as electron carriers in biological systems (Figure 2) [52,53]. They were also shown to work as electron biocapacitors, contributing to the enhancement of the electron-storage capacity of several bacteria [54]. The polypeptide chain of cytochromes is covalently bound to the heme groups through thioether linkages established with the sulfhydryl groups of two cysteine residues in a conserved binding motif sequence CXXCH, where X represents any amino acid.
MCs can receive or donate multiple electrons and protons in a cooperative way, depending on the properties of the neighboring hemes or heme surrounding protonatable centers [58,59]. Typically, the distances between the iron atoms of adjacent hemes do not exceed 15 Å, allowing fast and efficient electron exchange between the redox centers [60]. The several heme groups extend the protein’s global working redox potential ranges because of the contribution of each individual heme redox potential. The redox potential values of the hemes in MCs are affected by several factors, namely, the (i) molecular interactions that differently affect the free energy between the oxidized and reduced states; (ii) electrostatic interactions within the protein or with the solvent; (iii) heme solvent exposure; (iv) heme puckering; (v) ionization state of the heme propionate groups and (vi) nature and/or orientation of the heme axial ligands [53,61,62,63,64,65,66,67,68]. Furthermore, MCs have a lower amino acid to heme ratio compared to monoheme cytochromes, and, consequently, the heme groups are more solvent-exposed (Figure 2). The high solvent exposure and the typical His-His axial heme coordination strongly contribute to the lower redox potentials values generally observed in MCs.
Several strategies have been developed to characterize MCs, both functionally and structurally [69,70,71,72,73,74]. These strategies have been useful to reveal the functional mechanisms and key residues involved in the redox reactions of these proteins. In this Review, a description of the methodologies that allow the detailed redox characterization of the functional electron and proton networks in MCs is presented. The triheme cytochrome PpcA from G. sulfurreducens is used as a model to illustrate these methodologies. The knowledge obtained from such studies is currently being explored to design Geobacter strains with higher EET efficiency, to improve Geobacter-based biotechnological applications.

2. Thermodynamic Characterization of MCs

The characterization of the properties of the redox centers in MCs, and the concomitant elucidation of their functional mechanisms, is especially challenging due to the co-existence of several microstates in solution.

2.1. Redox Titrations Followed by Visible Spectroscopy

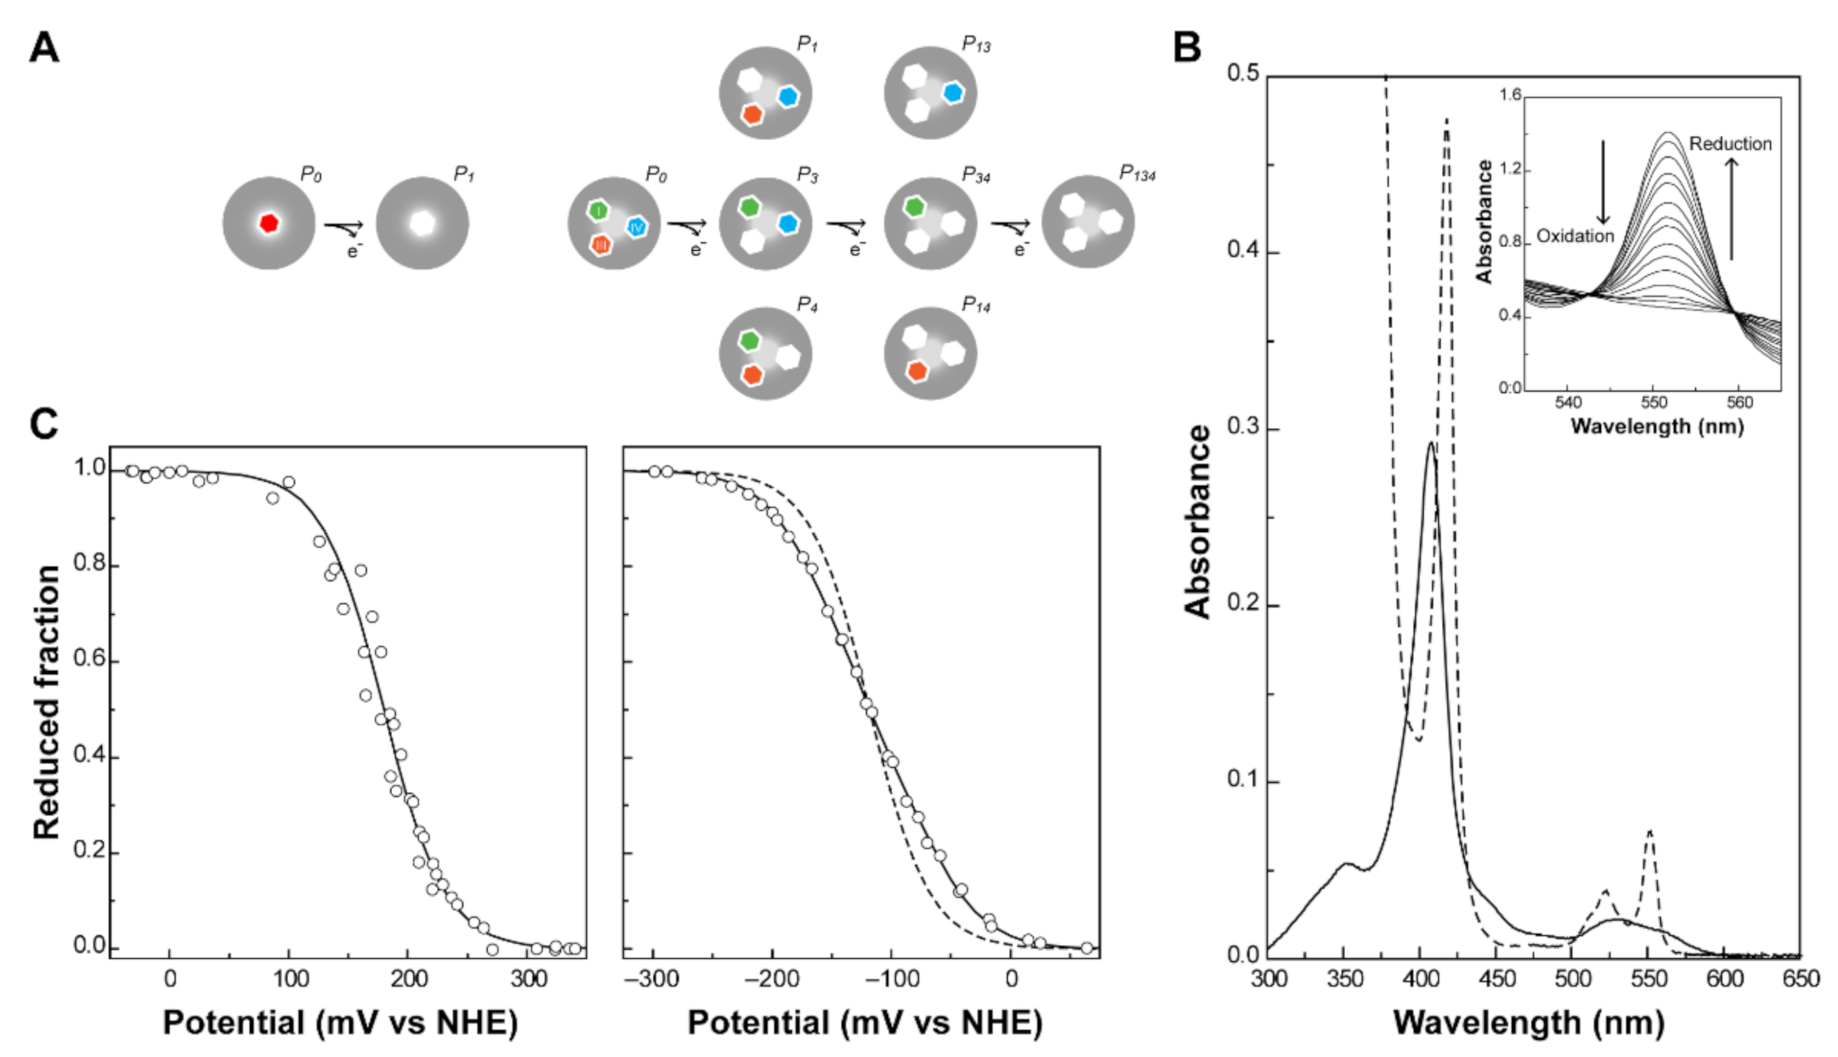
The number of heme groups defines the complexity of the redox network of a cytochrome. In the simplest case, a monoheme cytochrome, one reversible step of one-electron transfer, converts the fully reduced state (P0) into the fully oxidized state (P1). Therefore, only two redox stages are defined (Figure 3A, left panel) and any technique that allows monitoring of the heme oxidation can be explored to determine the redox potential of the heme group.
UV-visible spectroscopy is widely used to explore the different spectral features of heme groups. In fact, cytochromes can exist in a variety of electronic states, and the different transitions between them can be monitored by this technique. The most relevant molecular orbitals for the UV-visible spectral features of cytochromes are the π-bonding and π*-antibonding orbitals of the porphyrin. The typical spectra of a low-spin hexacoordinated c-type cytochrome are shown in Figure 3B. The absorption of the heme groups dominates the spectrum in both redox states. Due to π-π* transitions, the hemes originate bands at ~410 nm (Soret band, common to both redox states) and between 500 and 600 nm (β and α bands, typical of the reduced state spectrum) [53]. The β and/or α bands can be used to monitor the oxidation of the protein in UV-visible potentiometric redox titrations and hence, to study the variation of the reduced fraction of the protein with the solution potential (Figure 3C). For monoheme cytochromes, the heme reduction potential value ( E 1 0 ) can be directly obtained from the fitting of a Nernst equation (Equation (1)), at the point at which the oxidized and reduced fractions are equal.
E = E 1 0 + R T n F   ln P i P 0
In this equation, E corresponds to the solution potential; E 1 0   to the midpoint reduction potential of the cytochrome (also known as Eapp); Pi and P0 correspond to oxidized and reduced fractions of the cytochrome. The reduced fraction can be obtained through a relationship between the number of reduced molecules and the total number of molecules in solution (Equation (2)).
R e d u c e d   f r a c t i o n = P 0 P 0 + P i
By replacing Pi (from Equation (1)) in Equation (2), the reduced fraction can be described as a function of E and E 1 0 (Equation (3)), which is used to fit to the experimental data obtained from a redox titration:
R e d u c e d   f r a c t i o n = 1 1 + e E E 1 0 F R T
Experimentally, in a redox titration followed by UV-visible spectroscopy, the redox potential of the solution is measured after each addition of reducing or oxidizing agents, and, simultaneously, the redox state of the protein center(s) is monitored by the UV-visible spectrum (as shown in the inset of Figure 3B). There are several experimental details to consider in order to obtain reliable and reproducible redox titration curves. The solution potential must be sufficiently stable to assure that the recorded spectrum corresponds exactly to the measured potential, and a rapid and complete equilibration between the protein redox centers and the working electrode must be obtained. This can be achieved by the use of small organic or inorganic redox agents, known as redox mediators, that work as shuttles between the electrode and the redox centers [76]. These molecules must (i) be chemically stable and react efficiently and reversibly both with the electrode and with the protein and (ii) not form complexes or interact with the target proteins to a point where they affect their electrochemical behavior. Therefore, to properly cover the entire redox window of the target proteins, one must use a combination of several redox mediators. The appropriate concentration of mediators is a compromise between the amount necessary to ensure good equilibrium between the protein and the electrode and the optical interference caused by their UV-visible signatures. Notwithstanding, the absorbance measurements must always be corrected for the contribution of the mediators. This is achieved by simply integrating the area of the α-peak above the line connecting the respective flanking isosbestic points. Additionally, an efficient stirring of the protein solution inside the spectrophotometer cell must be maintained without perturbing the measurements. To check for hysteresis, the redox titration must be performed in the oxidative and reductive directions. In the case of proteins with expected very negative redox potentials, which are readily oxidized by molecular oxygen, the redox titrations must be acquired under strict anaerobic conditions inside a glove box.
In MCs, the number of electron transfer steps and microstates in solution increase with the number of heme groups (N). In fact, the number of microstates and oxidation stages are given by 2N and N + 1, respectively. In the case of a triheme cytochrome, three one-electron transfer steps convert the fully reduced state (P0) into the fully oxidized state (Pijk), thus defining four different redox stages (Figure 3A, right panel). In these cytochromes, data obtained by UV-visible potentiometric redox titrations usually do not discriminate the individual heme redox potentials. A typical redox titration curve for a triheme cytochrome is given in Figure 3C. As depicted in Figure 3A, three macroscopic redox potentials ( E 1 0 E 3 0 ) describe the electron transfer from the fully reduced to the fully oxidized state. However, in most cases, these potentials cannot be formally assigned to any specific heme in the protein. Few exceptions have been described in the literature, as in the case of the diheme cytochrome DHC2 from G. sulfurreducens [77]. In this cytochrome, the redox potentials of the two heme groups are sufficiently different (more than 60 mV) to be determined by UV-visible potentiometric redox titrations [77]. This is very unusual in MCs since most examples within this group of proteins have multiple hemes with the same type of coordination, identical optical properties and redox potential values. However, macroscopic reduction potential values can be obtained for MCs from the Nernst equations defined for each one-electron transfer step (Equations (4)–(6)).
E = E 1 0 + R T F   l n P i + P j + P k P 0
E = E 2 0 + R T F   l n P i j + P i k + P j k P i + P j + P k
E = E 3 0 + R T F   l n P i j k P i j + P i k + P j k
Using a similar approach to the one above shown for monoheme cytochromes, it is possible to describe the reduced fraction of a triheme cytochrome as a function of the solution potential (E) and the three macroscopic reduction potentials ( E 1 0 , E 2 0   and E 3 0 , see Equation (7)).
R e d u c e d   f r a c t i o n = 3 + 2 e E E 1 0 F R T + e 2 E E 1 0 E 2 0 F R T 3 ( 1 + e E E 1 0 F R T + e 2 E E 1 0 E 2 0 F R T + e 3 E E 1 0 E 2 0 E 3 0 F R T )
The three macroscopic redox potentials can then be obtained from the fitting of the experimental data from a visible redox titration (Figure 3C, right panel).

2.2. Redox Titrations Followed by NMR Spectroscopy

The macroscopic redox potential values contain information on the working functional ranges of MCs but are insufficient to characterize the microscopic behavior of these proteins, as well as to provide mechanistic information on their electron transfer pathways. Such data can only be obtained if the redox profile of each heme is monitored independently. In MCs displaying identical optical properties, the stepwise oxidation of the hemes from the fully reduced to the fully oxidized protein can be obtained by EXchange SpectroscopY (EXSY) Nuclear Magnetic Resonance (NMR) [73,78]. These experiments allow the observation of signals that experience chemical exchange [79]. In NMR, chemical exchange refers to any process in which a nucleus exchanges between two or more environments, yielding, for example, a change in chemical shift. In an MC, if the interconversion between microstates within the same oxidation stage (intramolecular electron exchange) is fast, and the interconversion between microstates belonging to different oxidation stages (intermolecular electron exchange) is slow on the NMR time scale, the individual heme signals can be discriminated. Several experimental conditions can be optimized to meet these requirements, namely the magnetic field strength, protein concentration, temperature and ionic strength [75,80,81].
The assignment of the heme substituents resonances, particularly the heme methyl groups, in both the reduced and oxidized states, is a crucial step in the characterization of the redox behavior of an MC since they will constitute the starting or ending point (depending on the approach) of the EXSY NMR spectra analysis. The strategies underlying this assignment are presented in the next sections.

2.2.1. NMR Spectral Features of c-Type Cytochromes

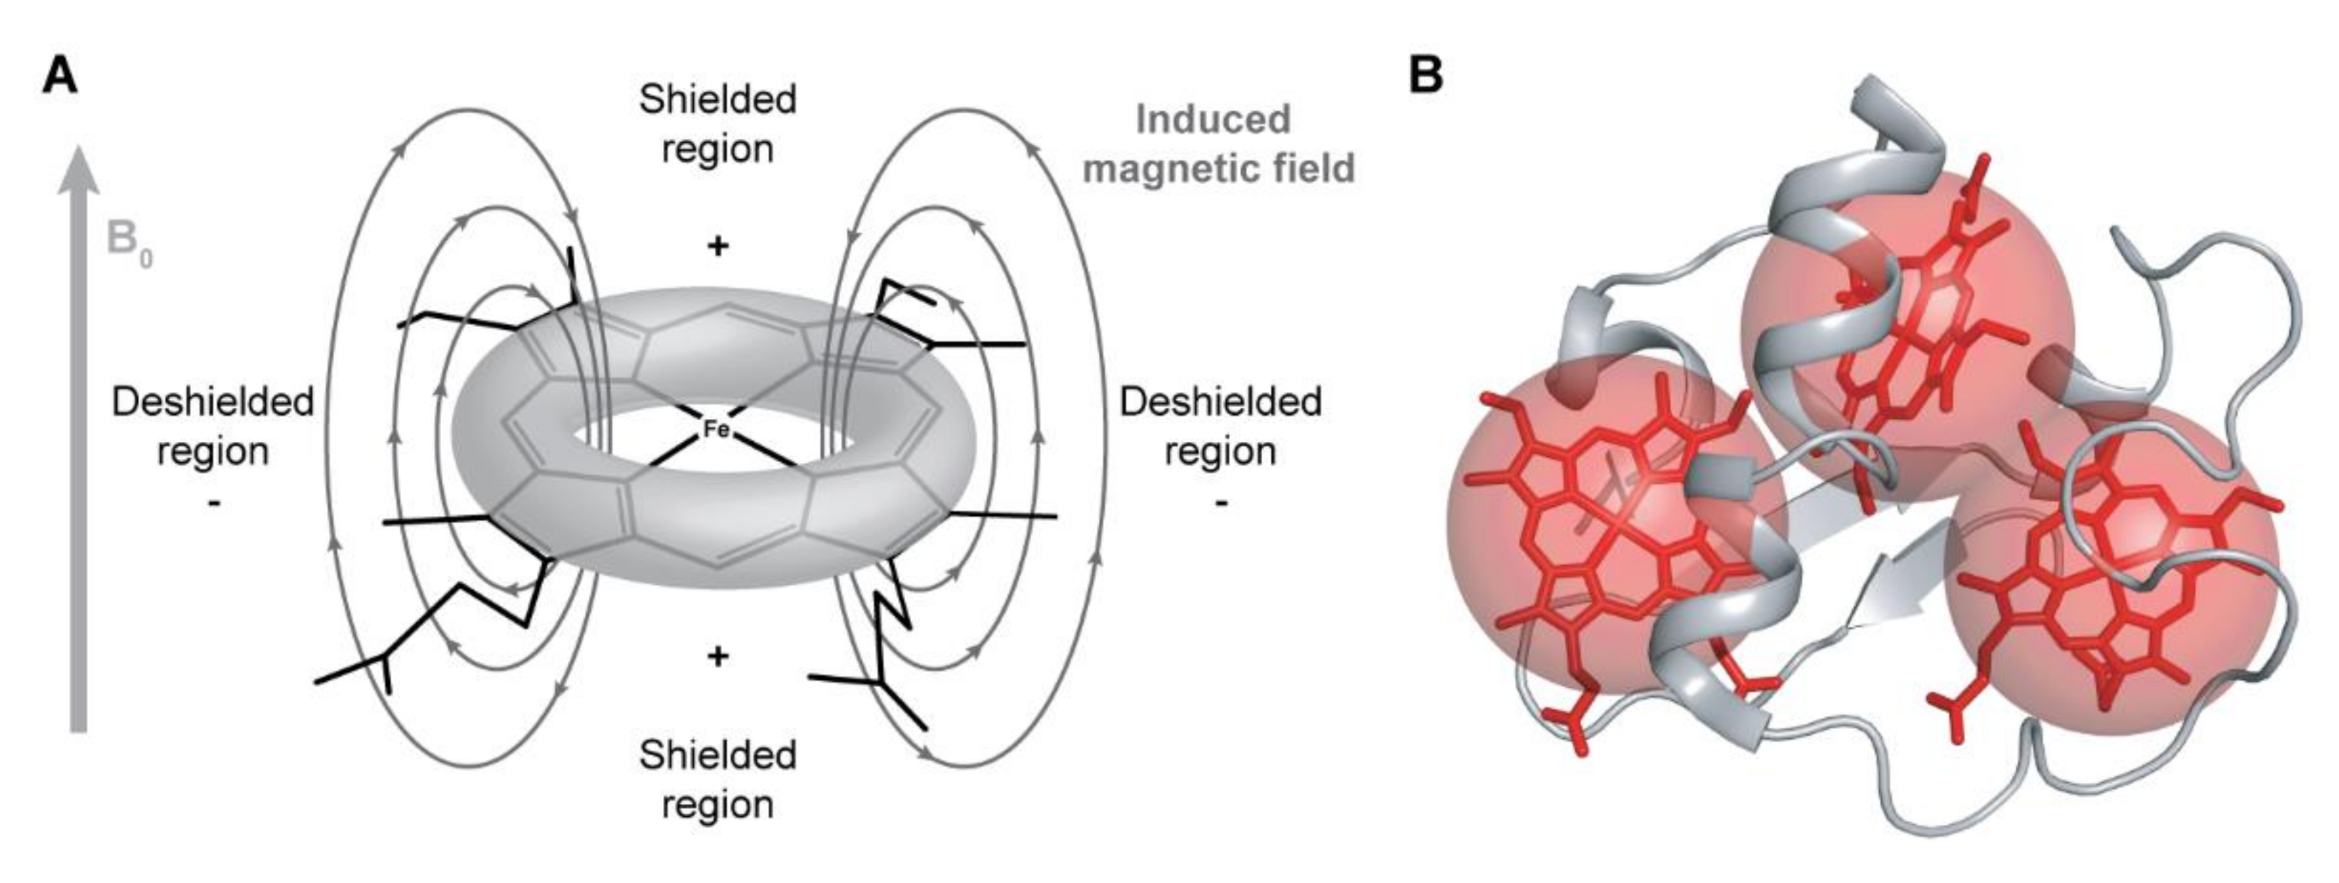
The NMR signals of the heme substituents are highly dependent on the ring-current and paramagnetic effects caused by the heme groups. The heme ring-current effects are caused by the circular movement of electrons around the pyrrole rings, which create local magnetic fields responsible for the typical positions observed for these signals [82]. Nuclei sensing a local magnetic field with less intensity than the applied magnetic field B0 (shielded regions represented in Figure 4A) are displaced to lower chemical shift values in the NMR spectrum, whereas nuclei sensing a local magnetic field with higher intensity than B0 (deshielded regions represented in Figure 4A) will be displaced to higher chemical shift values.
The ring-current effect is always present regardless of the oxidation state of the heme group. However, in the oxidized state, in addition to this effect, the paramagnetic contributions caused by the presence of unpaired electrons on the heme irons strongly affect the heme substituents (Figure 4B). Consequently, the same type of signals is differently affected by the paramagnetic center(s), spreading over a larger spectral window and showing different levels of broadness, making their assignment even more complex in the fully oxidized state.
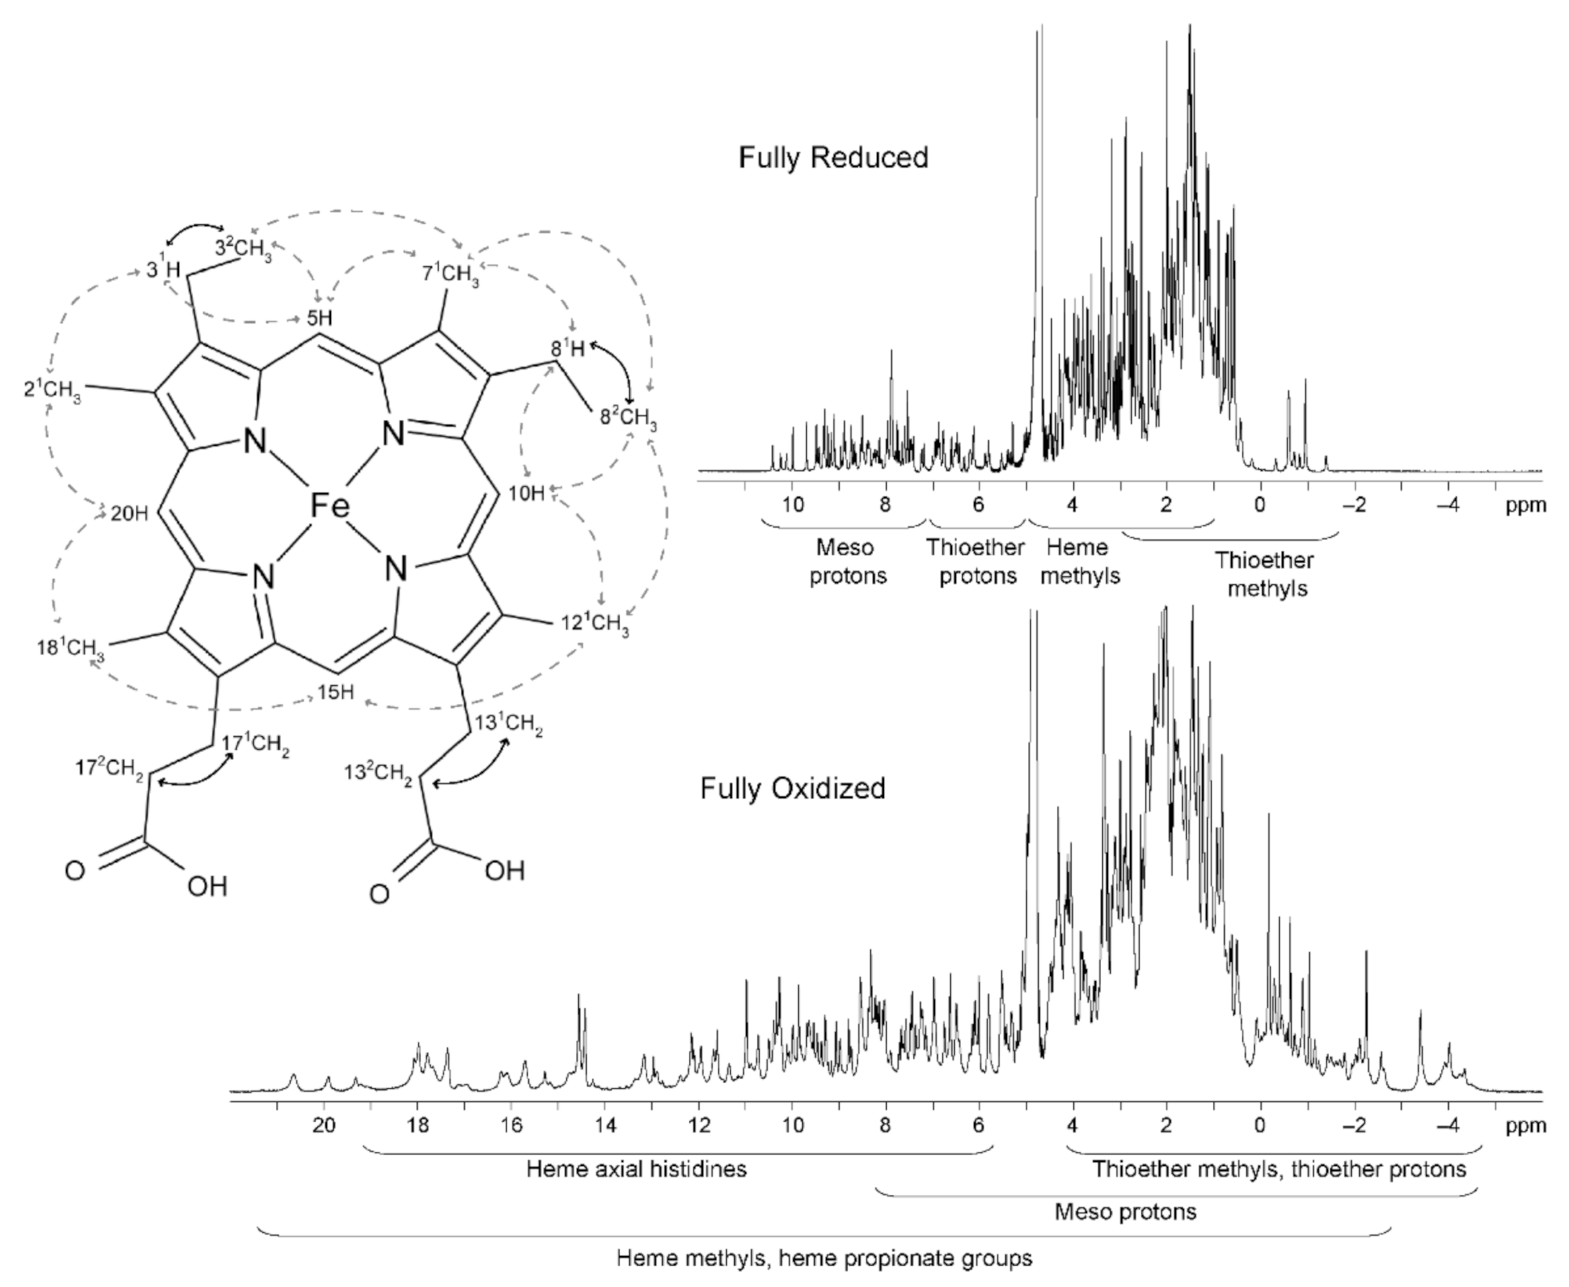
The typical regions of the heme substituents of a low-spin triheme cytochrome in the reduced (diamagnetic, S = 0) and oxidized (paramagnetic, S = ½) states are illustrated in Figure 5.
In the reduced state, the signals of the heme substituents can be identified in a straightforward manner: 8–10 ppm—meso protons (5H, 10H, 15H and 20H); 6–8 ppm—thioether methines (31H and 81H); 2.5–5 ppm—methyl groups (21CH3, 71CH3, 121CH3 and 181CH3); and −1 to 3 ppm—thioether methyls (32CH3 and 82CH3). However, in the oxidized state, there are wider regions for the different heme substituents.
The heme methyl substituents are the most suitable to follow through the NMR redox titration because as the reoxidation of an MC proceeds, the resonances of these substituents become very shifted from their diamagnetic region of the spectra (Figure 5). Furthermore, the superior intensity of the heme methyl signals also simplifies their assignment.
In the next section, the different strategies that can be used to assign the heme methyl substituents of a triheme cytochrome in both redox states are introduced.

2.2.2. Heme Substituents Assignment

In the reduced state, the first step of the assignment is the analysis of a 2D 1H-TOCSY NMR spectrum. In this experiment, scalar couplings (through bond nuclear interactions) within a spin system are observable [84], allowing the identification of the connectivities between the thioether methines (31H or 81H) and the thioether methyl groups (32CH3 and 82CH3). 2D 1H-NOESY NMR experiments allow the detection of spatial correlation between nuclei that are typically closer than 5 Å [84]. Meso protons have several short-range intraheme connectivities with other heme substituents (Figure 5), thus possessing distinctive patterns. Protons 20H connect with two heme methyls (21CH3 and 181CH3), and their identification is straightforward. Protons 5H and 10H have connectivities with a methyl group (71CH3 or 121CH3, respectively), a thioether methyl (32CH3 or 82CH3, respectively) and a thioether methine (31H or 81H, respectively). Consequently, their discrimination can only be achieved by observing the connectivities between the heme methyl 21CH3 with the closest thioether groups (31H or 32CH3), which are unequivocally assigned in the 2D 1H-TOCSY spectrum. This allows the connection between the 20H and 5H edges of each heme. The heme methyls 71CH3, part of the 5H edges of the hemes, show connectivities with thioether groups (81H and 82CH3), which are in 10H edges. After the identification of these three heme edges, 15H protons can be identified by observing the connectivities between cross-peaks that connect 15H and 121CH3 or 181CH3 protons. This strategy of assignment was applied to MCs by Turner and co-workers [85], based on the original work performed on the monoheme horse heart cytochrome c [86]. In the case of MCs, structural data provide information on the expected interheme NOE connectivities, which can be explored to discriminate the different heme edges and unequivocally assign the heme substituents.
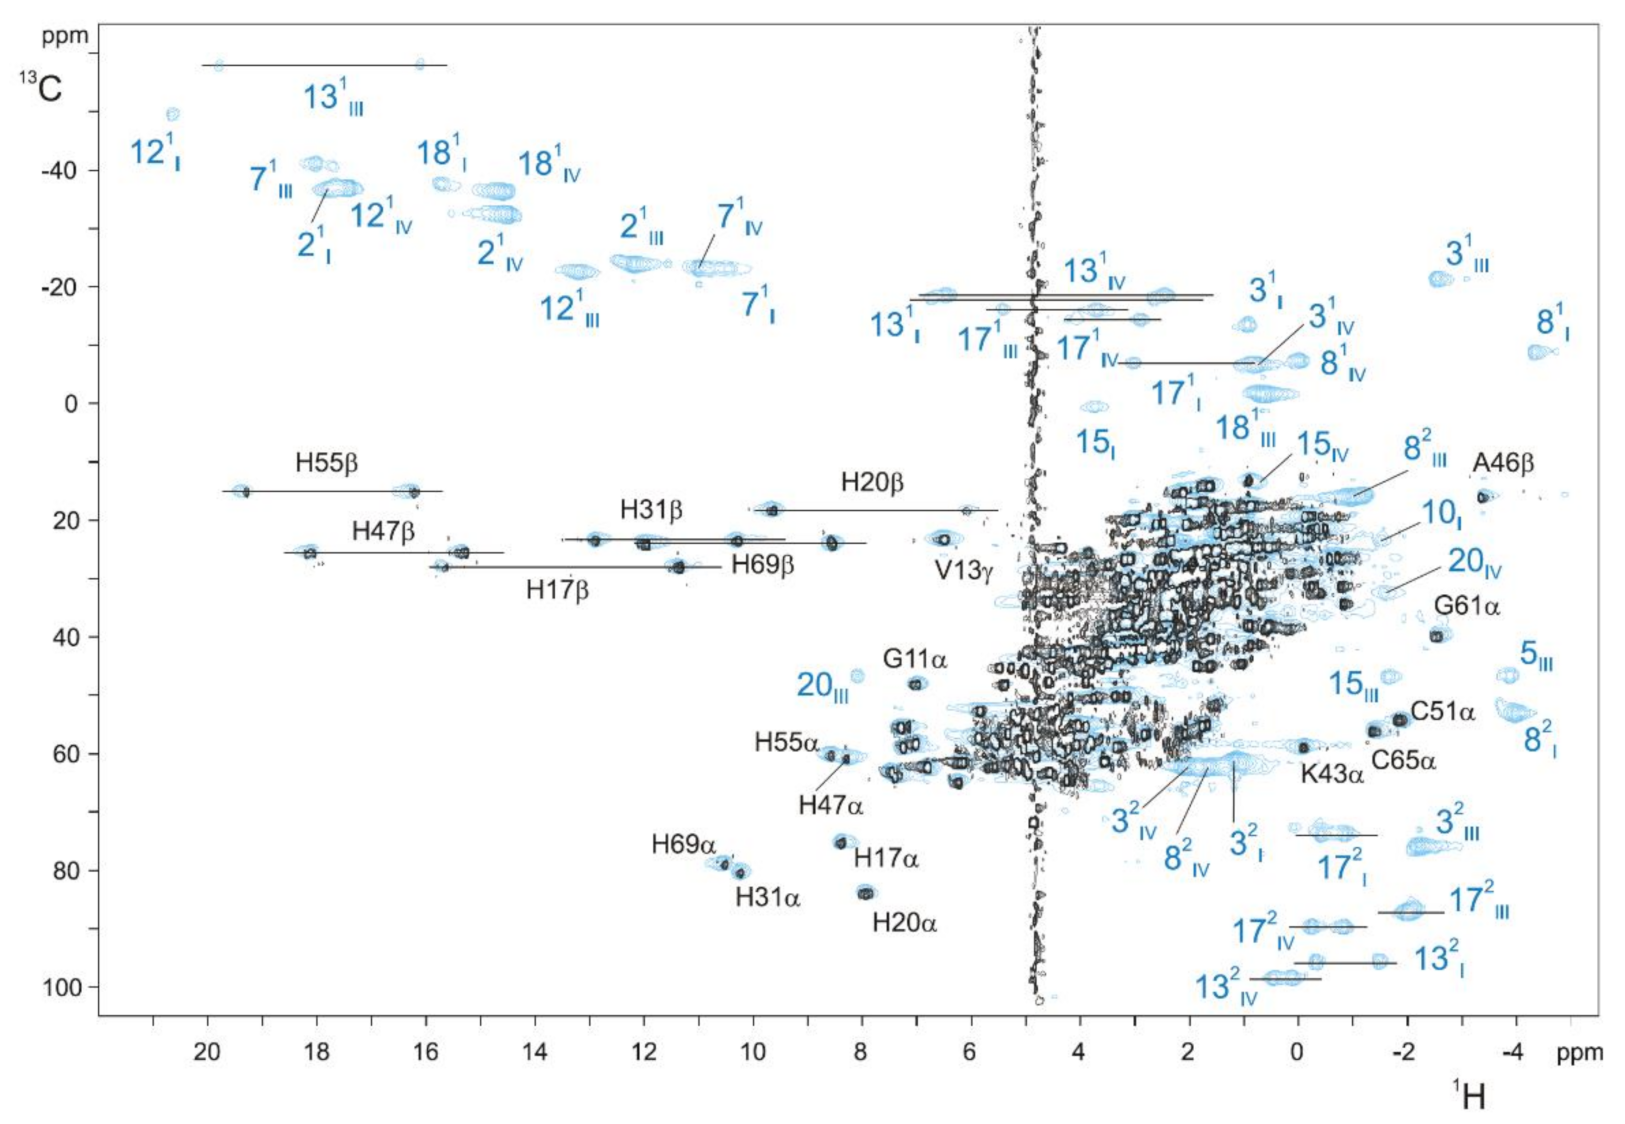
To facilitate the assignment procedure of the heme substituents in the oxidized state, a strategy based on the combined analysis of 2D 1H,13C-HSQC NMR spectra acquired for 13C isotopically labeled and 13C natural abundance (unlabeled) samples was established, allowing for direct discrimination between the heme substituents and polypeptide chain signals [72]. Since the heme precursor (δ-aminolevulinic acid) added into the minimal media is not labeled (for more details on isotopic labeling of MCs, see [70]), the heme signals are not observable in spectra acquired with a relatively small number of accumulations in 13C labeled samples. Therefore, through a simple comparison of the two NMR spectra, the heme substituents signals and those of the polypeptide chain can be identified (Figure 6). After this, the specific assignment of the heme signals is obtained using the 2D 1H-TOCSY and 2D 1H-NOESY NMR spectra, as described for the reduced state [74,87,88].

2.2.3. Probing the Heme Oxidation Profiles by EXSY NMR

In NMR redox titrations, samples must be in specific experimental conditions (protein and salt concentrations are the most relevant) that place the chemical exchange events of the protein at the necessary regimes. Protein samples are prepared in 2H2O to reduce the number of protein amino acid signals and placed in NMR tubes sealed with a gas-tight serum cap, from which the air is flushed out. The protein is fully reduced by the addition of catalytic amounts of the enzyme hydrogenase in the presence of gaseous hydrogen. The partially oxidized samples are obtained by the addition of controlled amounts of air in the NMR tube with a gas-tight syringe.
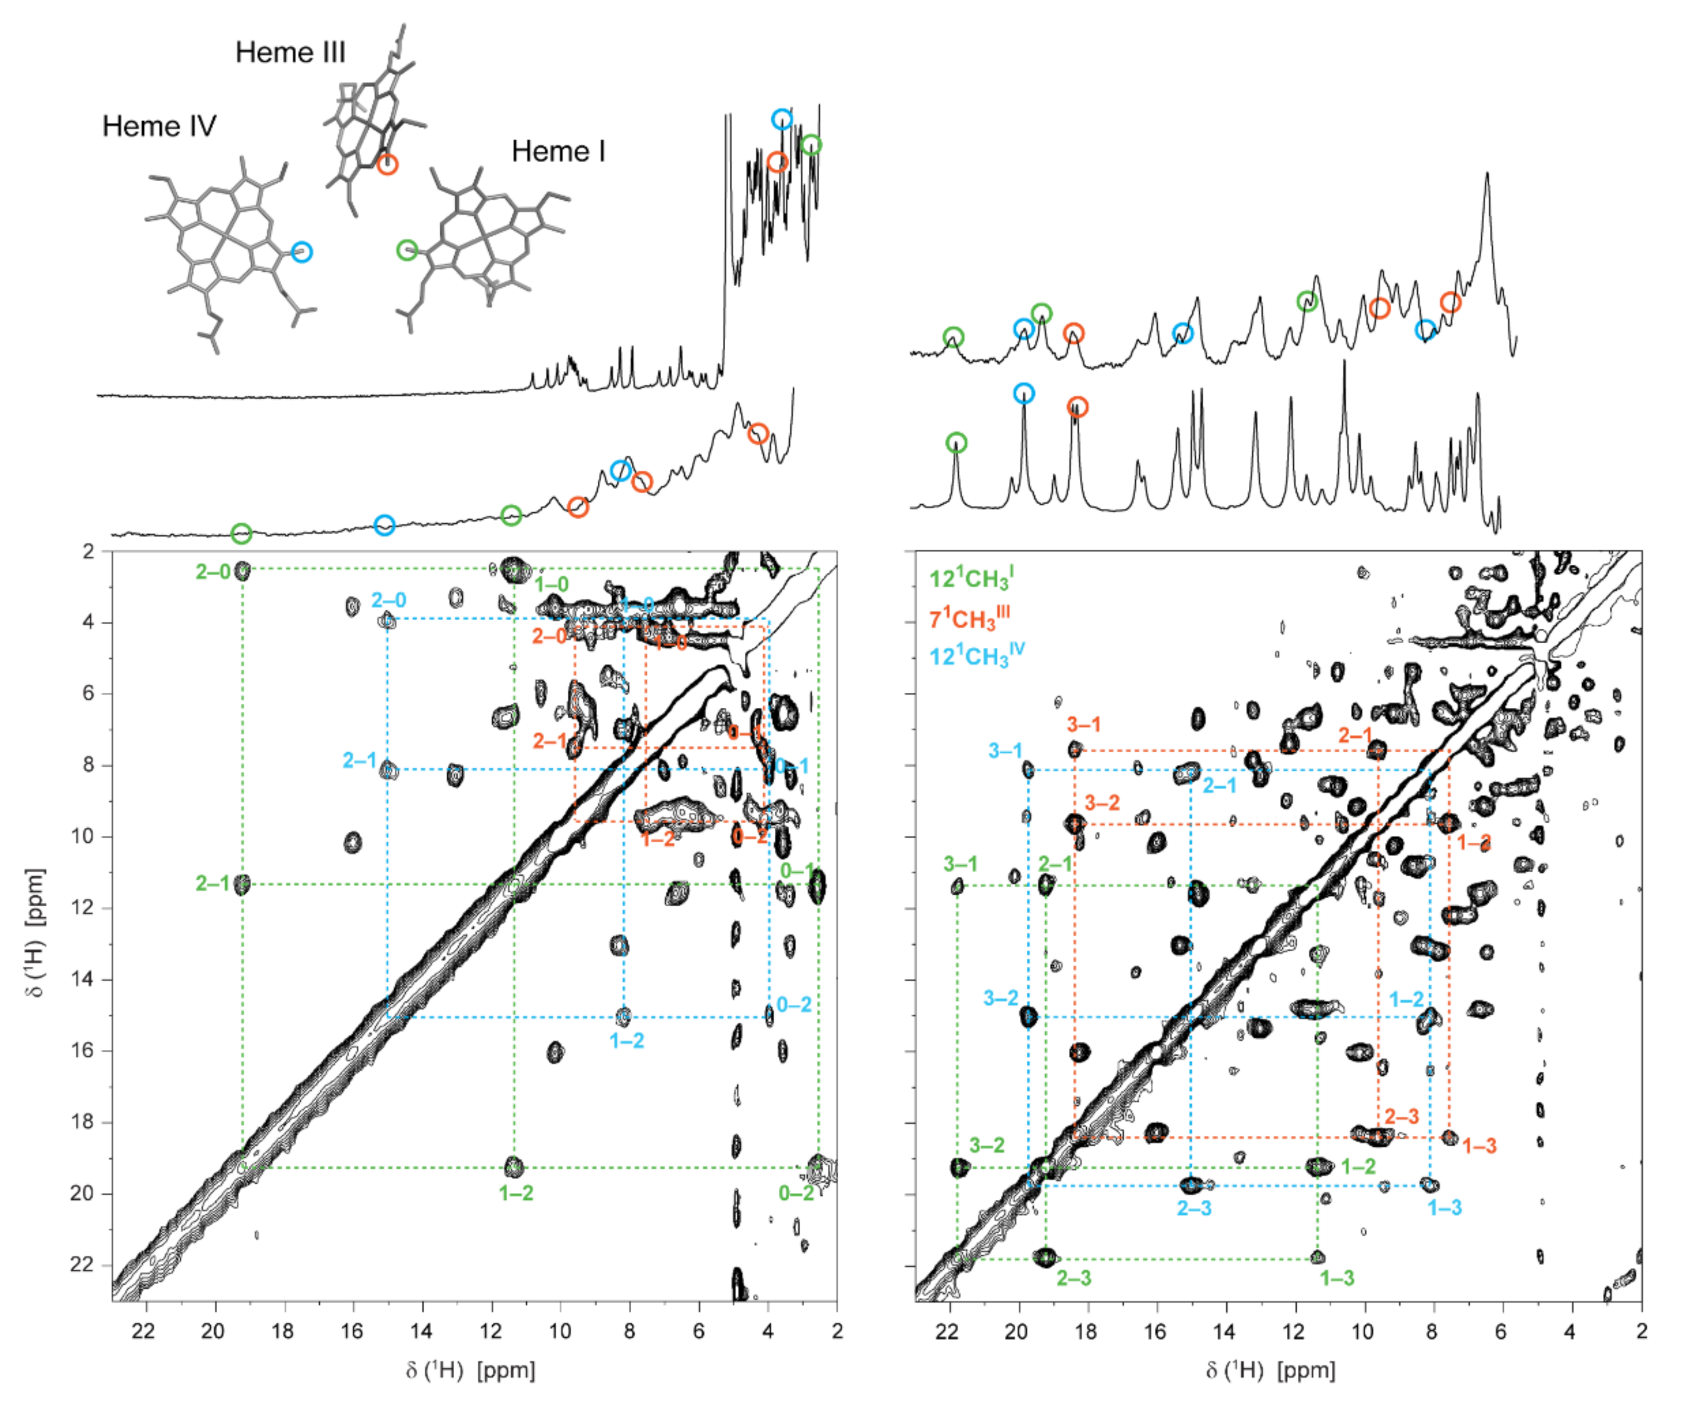
The stepwise oxidation of each heme in the triheme cytochrome PpcA from G. sulfurreducens is illustrated in Figure 7.
The chemical shift of each heme methyl in each oxidation stage depends on the relative microscopic reduction potentials of the heme groups and thus provides information on the relative order of oxidation of the hemes [78]. The oxidation fraction of each heme m, in each stage of oxidation S, can be obtained as described in Equation (8):
Σ m = 1 3 ( δ o b s m , S δ o b s m , 0 ) ( δ o b s m , 3 δ o b s m , 0 ) = S
In this equation, δ o b s m , S corresponds to the observed chemical shift of a heme methyl m in the oxidation stage S; δ o b s m , 0 corresponds to the observed chemical shift of a heme methyl m in the oxidation stage 0 (reduced state); δ o b s m , 3 corresponds to the observed chemical shift of a heme methyl m in the oxidation stage 3 (oxidized state).
The oxidation fractions of PpcA at pH 8 and pH 6 are shown in Table 1. In MCs, considering the close spatial disposition of the heme groups, the paramagnetic contributions of the unpaired electrons of each heme can be intrinsic (from its own heme) or extrinsic (from neighboring hemes). The paramagnetic shifts of the heme methyls are proportional to the degree of oxidation of its heme group if the extrinsic paramagnetic shifts are negligible, as is the case of the selected heme methyls (121CH3I, 71CH3III and 121CH3IV), which are illustrated on the heme core of PpcA (Figure 7).

2.3. Redox Network

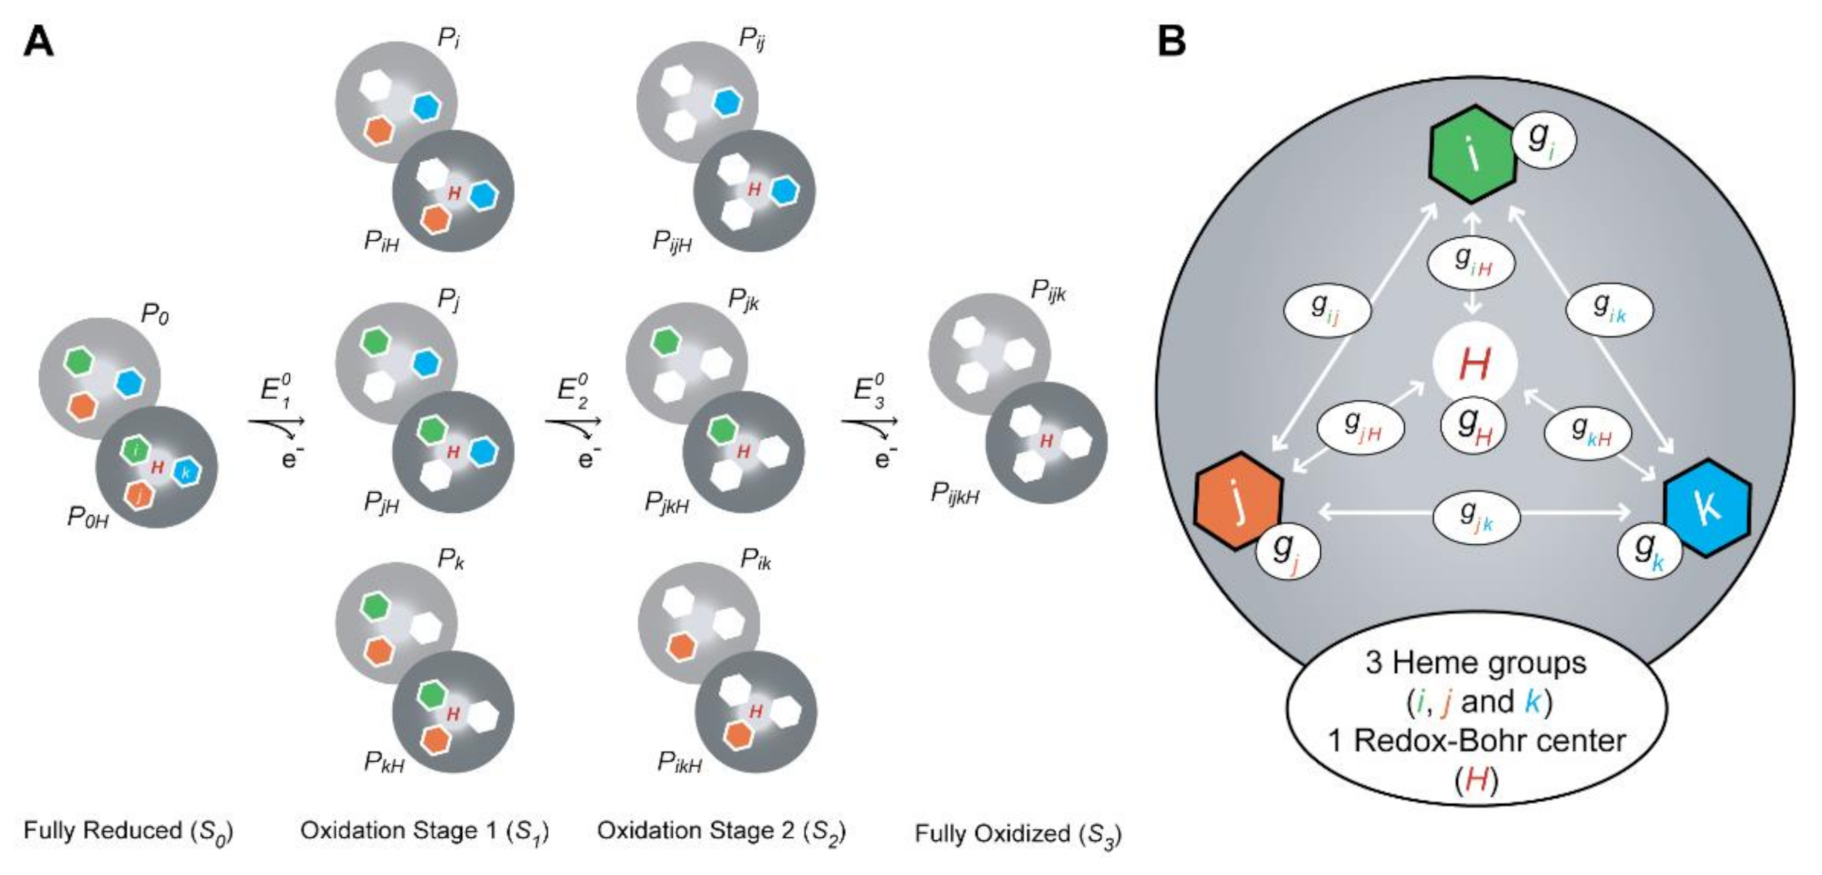
The stepwise oxidation profiles of the hemes are often modulated by the solution pH, as illustrated for PpcA in Table 1. Considering this, at each pH, a methyl group of any heme, in the oxidation stage S, has a single peak with a determined chemical shift ( δ o b s i , S ). The position of this signal is modulated by the populations of the microstates with that heme oxidized, weight-averaged according to the deprotonated and protonated populations, as represented in Equation (9).
δ o b s i , S = ( δ i , 3 δ i , 0 )   P i , S + ( δ H i , 3 δ i , 0 )   P i , S H P S + δ i , 0
In this equation, δ i , 0 is the observed chemical shift of the methyl i in the reduced state, and δ i , 3 and δ H i , 3 correspond to the chemical shifts in the fully oxidized deprotonated and protonated protein, respectively. The chemical shifts of the heme methyls in the fully reduced form are essentially unaffected by the pH and, therefore, are pH-independent (see Table 1). P i , S   and P i , S H are the sums over all the populations with heme i oxidized in stage S, with the protonatable center being deprotonated and protonated, respectively, whereas P S   is the sum over all the populations (either protonated or deprotonated) for each stage S (see Figure 8A).
The redox-Bohr effect tunes the heme redox potential values by changes in the protonation state of the redox-Bohr center in the vicinity of the hemes [90]. Its magnitude is determined by redox-Bohr interactions (giH). Considering pure electrostatics, negative redox-Bohr interaction values indicate that deprotonation of the redox-Bohr center (removal of a positive charge) stabilizes the oxidized state (lower reduction potential values) and vice-versa. The addition of a redox-Bohr center into the thermodynamic model of an MC further complicates the redox network of the protein (Figure 8B). Furthermore, due to the close proximity of the heme groups in MCs, their redox potentials are mutually affected by the oxidation state of their neighbors (redox interactions, gij). Considering pure electrostatics, the positive redox interaction values between the heme groups indicate that the oxidation of one heme hinders the oxidation of its neighbor. Therefore, with the progressive oxidation of an MC, the hemes’ redox potentials increase, and their reduced form is stabilized. The magnitude of the redox and redox-Bohr interactions correlates to the spatial distance between the interacting centers.
In conclusion, the dependence of the molar fractions of the 16 microstates (Figure 8A) across the full range of pH and solution potential can be determined by 10 thermodynamic parameters: three heme oxidation energies (reduction potential values), three interaction energies between each pair of hemes (redox interactions), three interaction energies between each heme and the redox-Bohr center (redox-Bohr interactions) and the pKa (redox-Bohr center deprotonation energy) of the redox-Bohr center (Figure 8B).
The energy of each microstate relative to the reference microstate (fully reduced with the redox-Bohr center protonated) is then given by a simple sum of the appropriate energy terms amongst the four independent centers (the three heme groups and the redox-Bohr center), the six possible two-center interactions (three redox interactions and three redox-Bohr interactions), one term that accounts for the effect of the solution potential (SFE) in the oxidation stage S (Equation (10)) and another for the proton chemical potential (2.3RTpH) added for the deprotonated forms (Equation (11)):
G i H = Σ g i + Σ g i j S F E
G i = G i H + g H + Σ g i H 2.3 R T p H
In these equations, i and j represent any pair of hemes; iH designates a particular protonated microstate with oxidized heme(s) group(s) i; gi is the energy of oxidation of heme i; gij is the interaction energy between each pair of hemes i and j; gH is the deprotonation energy of the fully reduced protein; giH is the energy of interaction between the hemes and the redox-Bohr center; S is the oxidation stage (equivalent to the number of oxidized hemes); F is the Faraday constant (96,485 C mol−1); E is the redox potential of the solution; R is the molar gas constant (8.314 J K−1 mol−1); T is the absolute temperature (K).
The referred energy values can be converted to reduction potentials, which further facilitates data interpretation, using the Nernst equation (Equation (12)):
Δ G = n F Δ E
In this equation, ∆G and ∆E designate the Gibbs free energy and the redox potential of a certain microstate, respectively, and n is the number of electrons, and F is the Faraday constant.
The contribution of each microstate (Pi) can be determined by the Boltzmann equation (Equation (13)):
P i = e G i / R T
The total reduced fraction can be represented as a function of the solution potential for each pH value, by accounting the relative populations weighted by the number of reduced hemes (Equation (14)):
R e d u c e d   f r a c t i o n = 3   P S , 0 + 2   P S , 1 + P S , 2   3   P S
In this equation, ∑PS,0, ∑PS,1 and ∑PS,2 are the sums over all the populations in stages 0, 1 and 2, respectively; P S is the sum over all the populations in solution.
The NMR data obtained with redox titrations only defines the relative heme reduction potentials, redox and redox-Bohr interactions. Therefore, to determine the absolute potentials, the total reduced protein fractions (Equation (14)) need to be measured through redox titrations followed by UV-visible spectroscopy, as described in Section 2.1. The data obtained from both redox titrations are fitted to the presented thermodynamic model using the Marquardt method [91].

2.4. The Example of the Triheme Cytochrome PpcA

The redox behavior of the triheme cytochrome PpcA from G. sulfurreducens was thoroughly studied [75,80,92], and its detailed thermodynamic characterization is presented in this section.
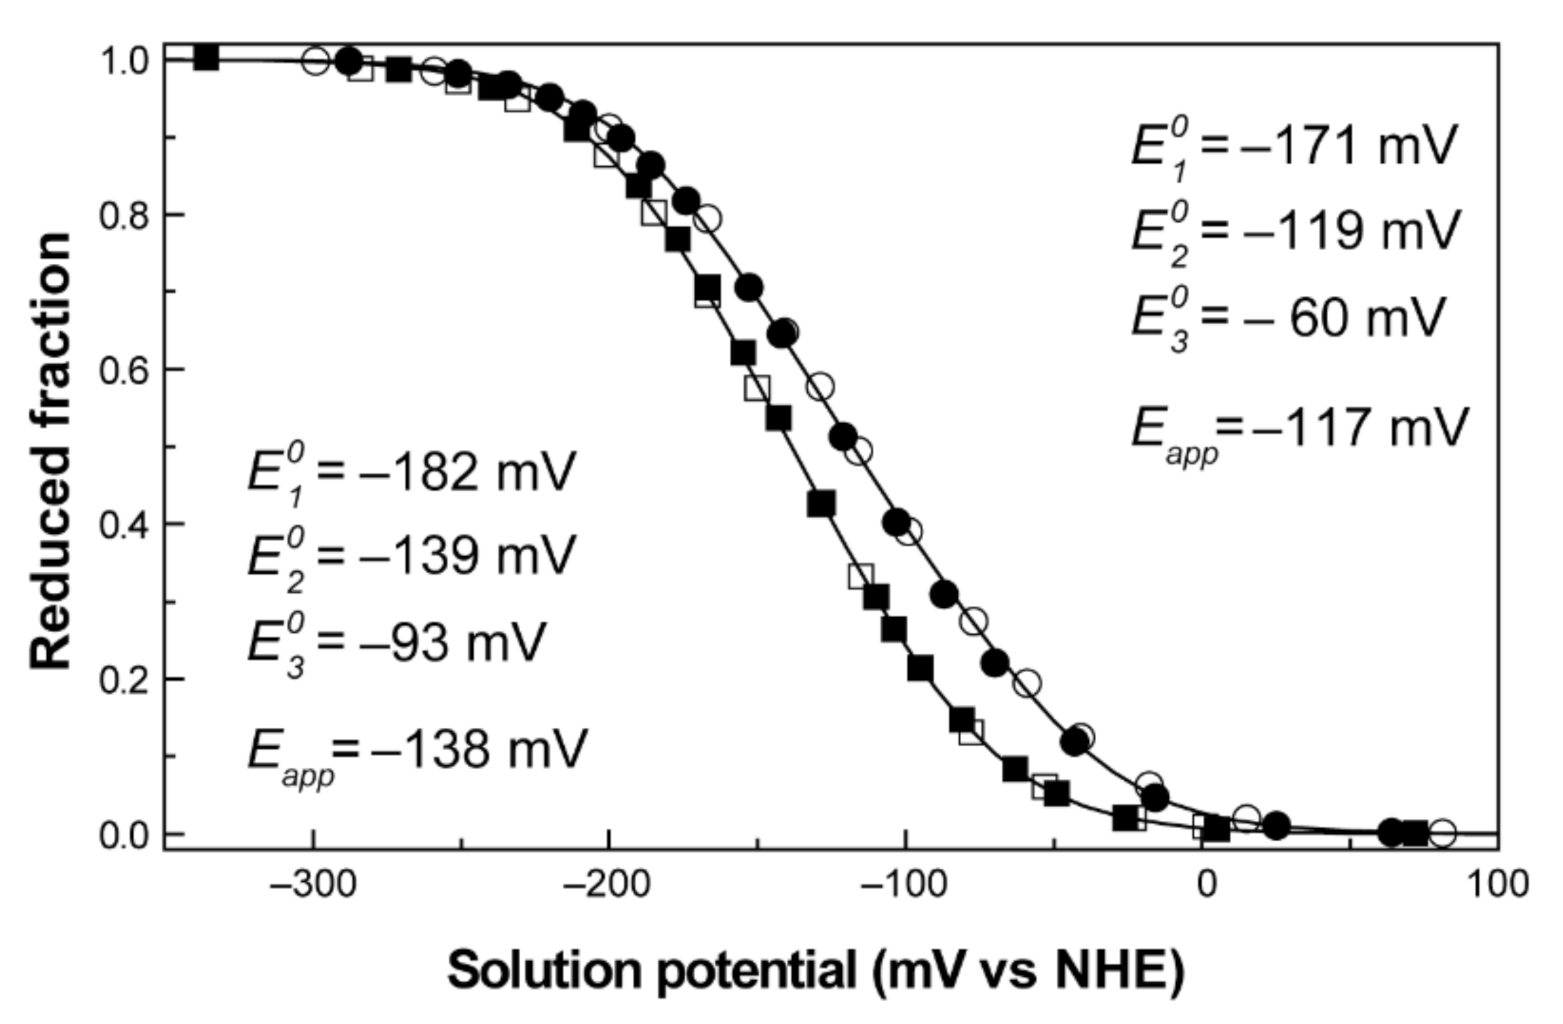
The redox titrations were followed by UV-visible spectroscopy at 15 °C, inside an anaerobic glove box with 02 levels kept under 1 ppm, with argon circulation. The visible spectra were recorded using a spectrophotometer placed inside the anaerobic glovebox. Protein solutions were prepared with ~20 μM concentration in 80 mM sodium phosphate buffer with NaCl (250 mM final ionic strength) at pH 7 and 8. The titrations were performed at different pH values to check for pH-dependent redox behaviors (redox-Bohr effect). The solution potentials were measured using a combined Pt/Ag/AgCl electrode, calibrated with quinhydrone saturated solutions at pH 4 and pH 7. A mixture of redox mediators (gallocyanine (E0′ = +21 mV), methylene blue (E0′ = +11 mV), indigo tetrasulfonate (E0′ = −30 mV), indigo trisulfonate (E0′ = −70 mV), indigo disulfonate (E0′ = −110 mV), 2-hydroxy-1,4-naphthoquinone (E0′ = −152 mV), anthraquinone-2,6-disulfonate (E0′ = −184 mV), anthraquinone-2-sulfonate (E0′ = −225 mV), safranine O (E0′ = −280 mV), neutral red (E0′ = −325 mV), benzyl viologen (E0′ = −345 mV), diquat (E0′ = −350 mV) and methyl viologen (E0′ = −440 mV)) was added to the solution with a final concentration of ~2 μM to ensure equilibrium between the redox centers of the protein and the working electrode, while covering the entire redox window of the protein [75]. Furthermore, to check for hysteresis and reproducibility, each redox titration was performed in both oxidative and reductive directions, using sodium dithionite as a reducing agent and potassium ferricyanide as an oxidizing agent. The experiments were performed two times, and the reduction potentials (relative to the NHE) were found to be reproducible within ±5 mV. Each measured solution redox potential value was corrected to the NHE reference by the addition of 214 mV. The reduced fraction of PpcA was determined by integrating the area of the α-peak (552 nm) above the line connecting the flanking isosbestic points (543 and 558 nm) to subtract the optical contribution of the redox mediators. The redox titrations curves obtained for PpcA at pH 7 and pH 8 are presented in Figure 9.
No hysteresis was observed in the titration process, as the reductive and oxidative curves are superimposable, indicating that the redox process is fully reversible (Figure 9). The Eapp values obtained at pH 7 and 8 were −117 and −138 mV, respectively. The decrease in the reduction potential values with pH leads to a progressive stabilization of the oxidized form because of the redox-Bohr effect. These preliminary data give information on several important thermodynamic parameters, such as the working functional range of the cytochrome and the existence of the redox-Bohr effect. To obtain full mechanistic information, these data were complemented with redox titrations followed by EXSY NMR.
PpcA samples for NMR redox titrations were prepared in a concentration of 70 μM in 80 mM sodium phosphate buffer with NaCl (250 mM final ionic strength) in deuterium oxide (2H2O). Partially oxidized samples were obtained using the procedure described in Section 2.2.3.
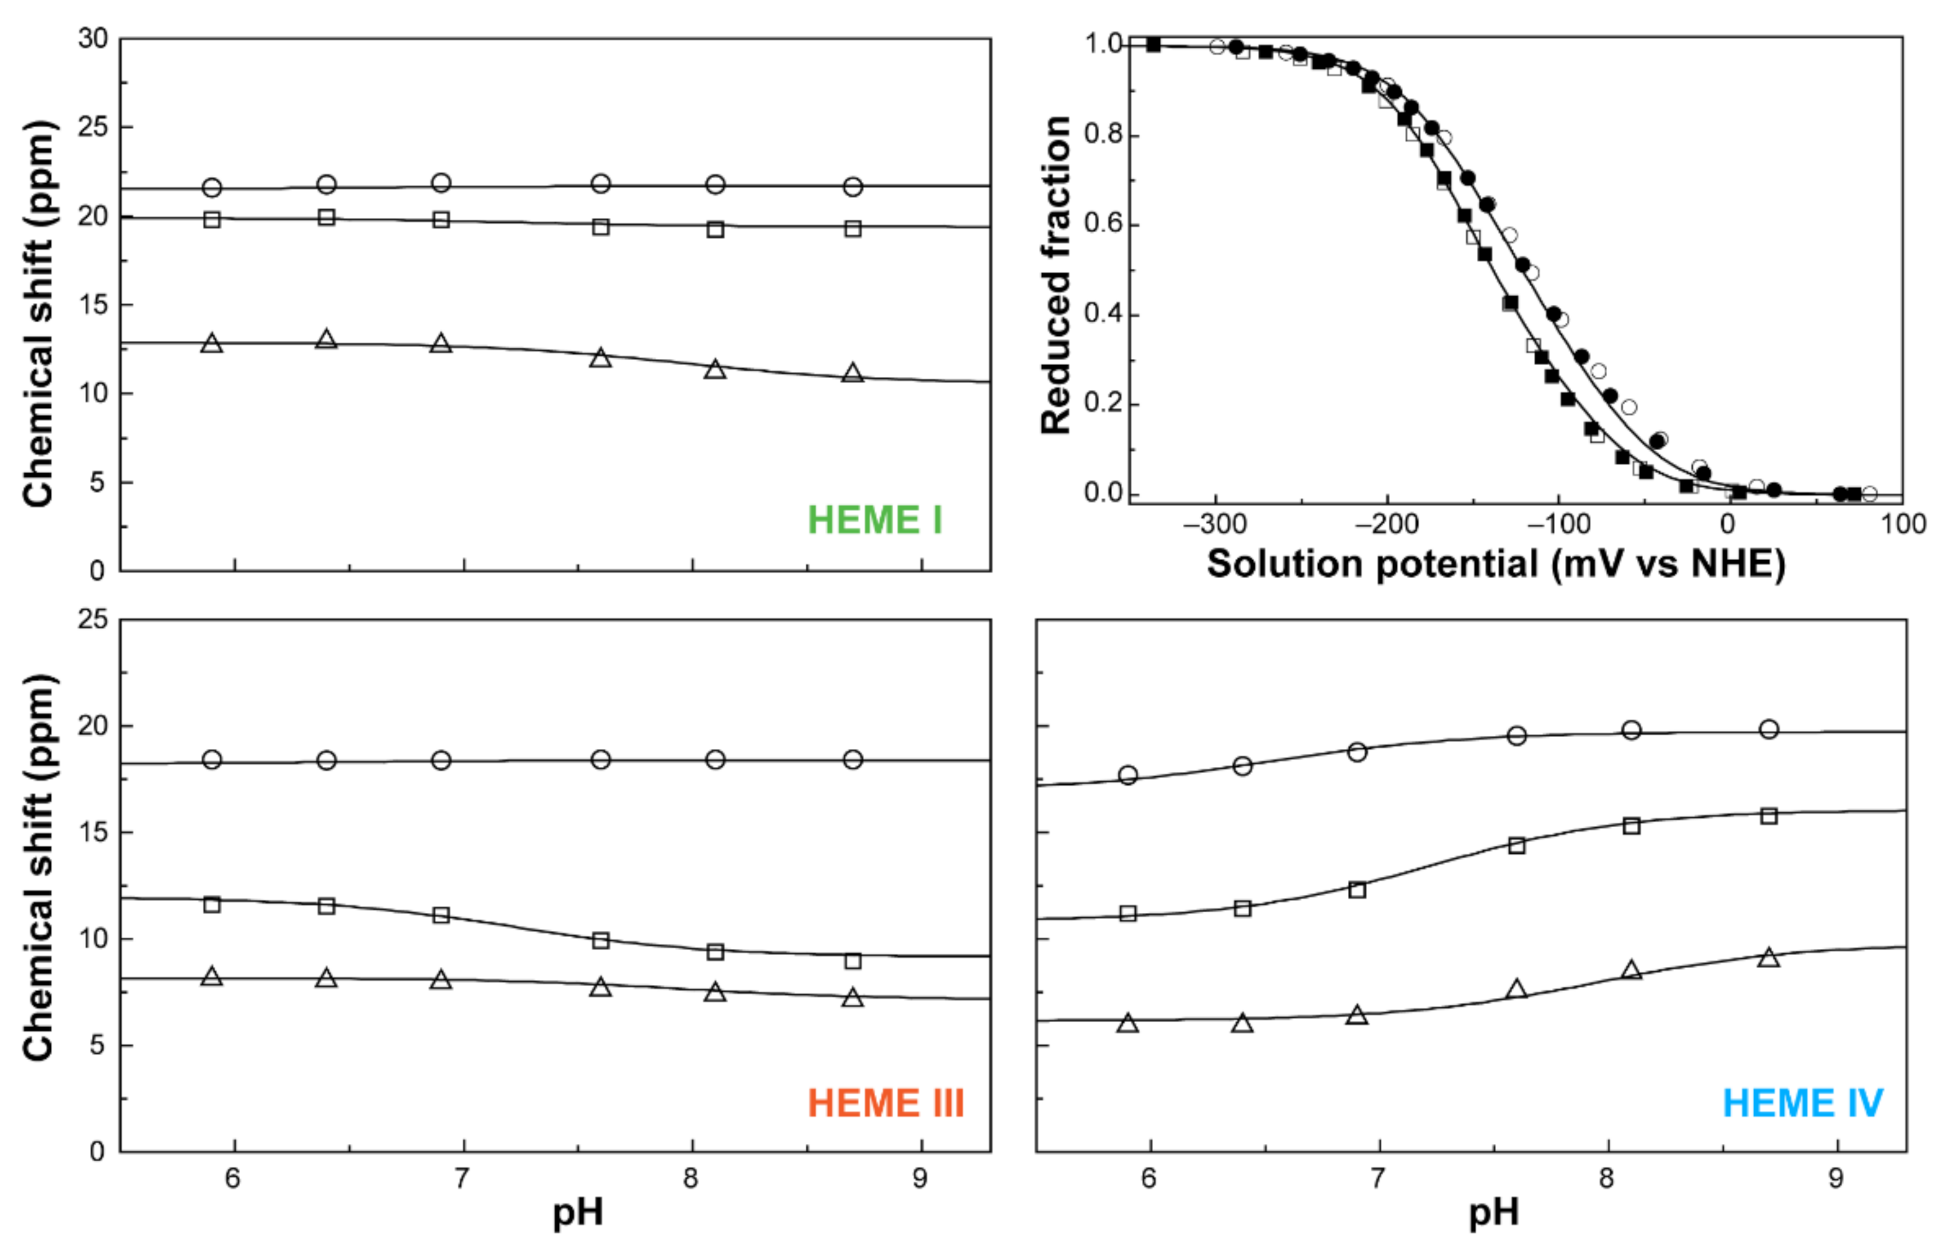
The oxidation profiles of PpcA were studied by NMR in the pH range 5.9–8.7 [75]. At the experimental conditions used, namely 800MHz magnetic field, 15 °C and 250 mM ionic strength, it was possible to obtain well-resolved EXSY spectra and to observe and assign discrete NMR signals connecting the different oxidation stages for the heme methyl groups 121CH3I, 71CH3III, and 121CH3IV (Figure 6). The chemical shifts of each heme methyl at different pH values in the different oxidation stages were fitted together with the data from redox titrations, followed by visible spectroscopy to the thermodynamic model described above (Figure 10).
The thermodynamic parameters obtained from the fitting, together with the macroscopic pKa values associated with the four stages of oxidation, are presented in Table 2.
In the fully reduced and protonated form, the heme microscopic potentials are all negative. The redox interactions are positive, showing that the oxidation of one heme hampers the oxidation of the neighboring hemes.
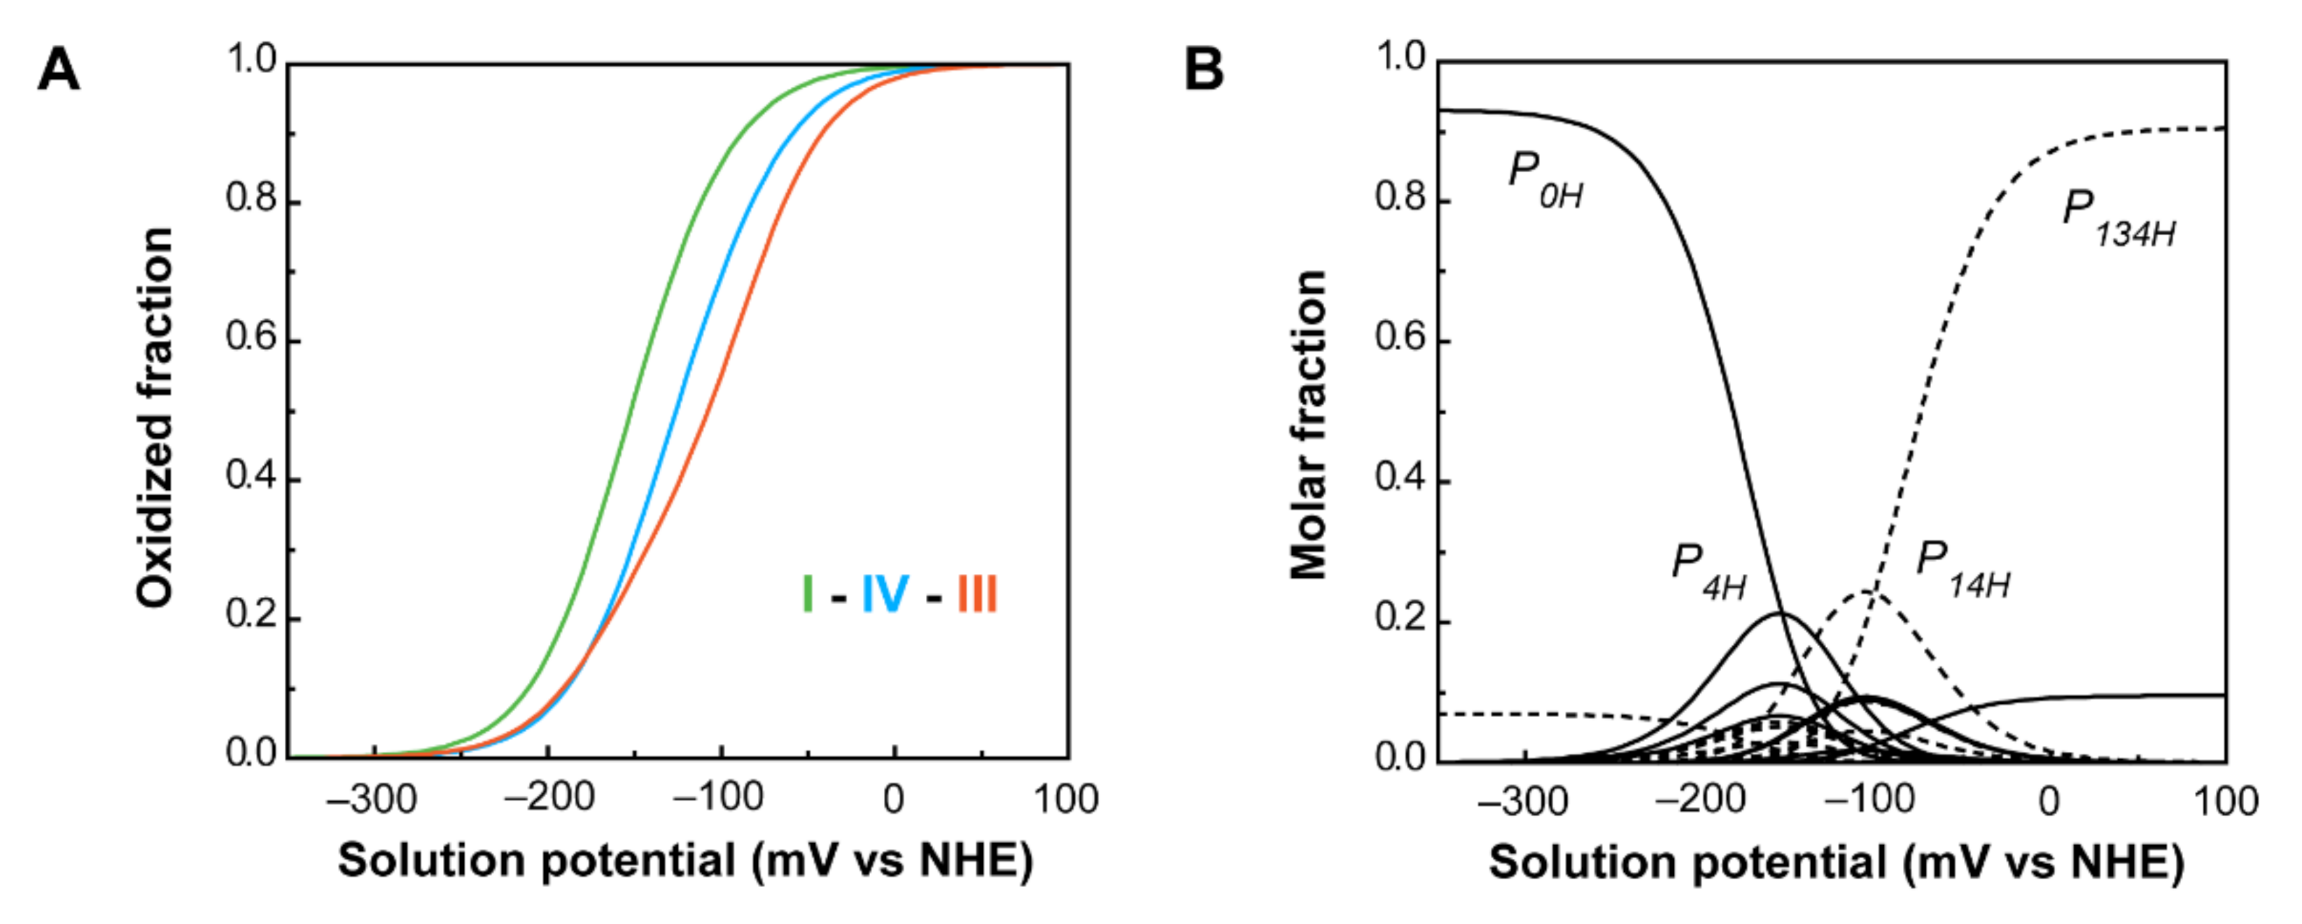
The interactions with the redox-Bohr center are negative, showing that the oxidation of the hemes favors the deprotonation of the protonatable center. From these parameters, the individual heme oxidation profiles, as well as the individual microstates contributions, can be determined at any pH value (Figure 11).
As a consequence of the redox and redox-Bohr interactions, at physiological pH (pH 7.5), the heme oxidation order is I-IV-III, in contrast with the potentials in the fully reduced and protonated state (I-III-IV). Moreover, the analysis of the molar fraction of the microstates in solution provides hints on the functional mechanism of the protein (Figure 11B). The forms P0H and P1H dominate PpcA oxidation stages 0 and 1, while stages 2 and 3 are dominated by the deprotonated forms P14 and P134. Therefore, a preferential pathway for electron transfer is established, and e/H+ coupled transfer is observed between oxidation stages 1 and 2. Metabolic modelling studies in G. sulfurreducens showed that the cells needed additional membrane potential for ATP production when growing in the presence of insoluble electron acceptors, such as Fe(III) and Mn(IV) oxides [94]. The results obtained for PpcA showed that this protein has the necessary properties to contribute to this gradient [75].

3. Modulation of the Redox Properties of MC for Optimized Geobacter Strains

The methodology presented in the previous sections can be used for the thermodynamic characterization of key MCs of G. sulfurreducens. The data obtained for the wild-type proteins can then be conjugated with structural information and explored to rationally design mutated forms with optimal functional properties. In this section, an overview of MCs’ protein engineering is presented, together with a discussion on how certain mutations can be further explored in in vivo studies.

3.1. Enginnering of MCs—The Example of PpcA Mutants

The engineering of MCs is one of the strategies that may contribute to improve current production by electrogenic bacteria, either by increasing the bacterium’s biomass formation or by optimizing the bacterium’s electron transfer mechanisms. In the first case, mutants with enhanced e/H+ mechanism, contributing to increased membrane potential and ATP production, can be envisaged. In the second case, the design of periplasmic proteins, with enhanced electron-transfer driving force for either upstream or downstream partners, will contribute to the creation of Geobacter cells with improved electron transfer capabilities.
The redox properties of the heme groups of MCs can be modulated considering different structural aspects, including intrinsic properties of the heme cofactors and those of the neighbor residues. Mutations can be designed to explore different chemical properties, including the heme’s solvent exposure and network of interactions, such as surrounding hydrogen bonds and ionizable residues. Therefore, depending on the location and nature of the targeted residue, different strategies can be applied. In this section, a summary of the different properties that have been explored to design PpcA mutants by site-directed mutagenesis is presented, together with a discussion regarding their impact on the protein’s functional behavior.
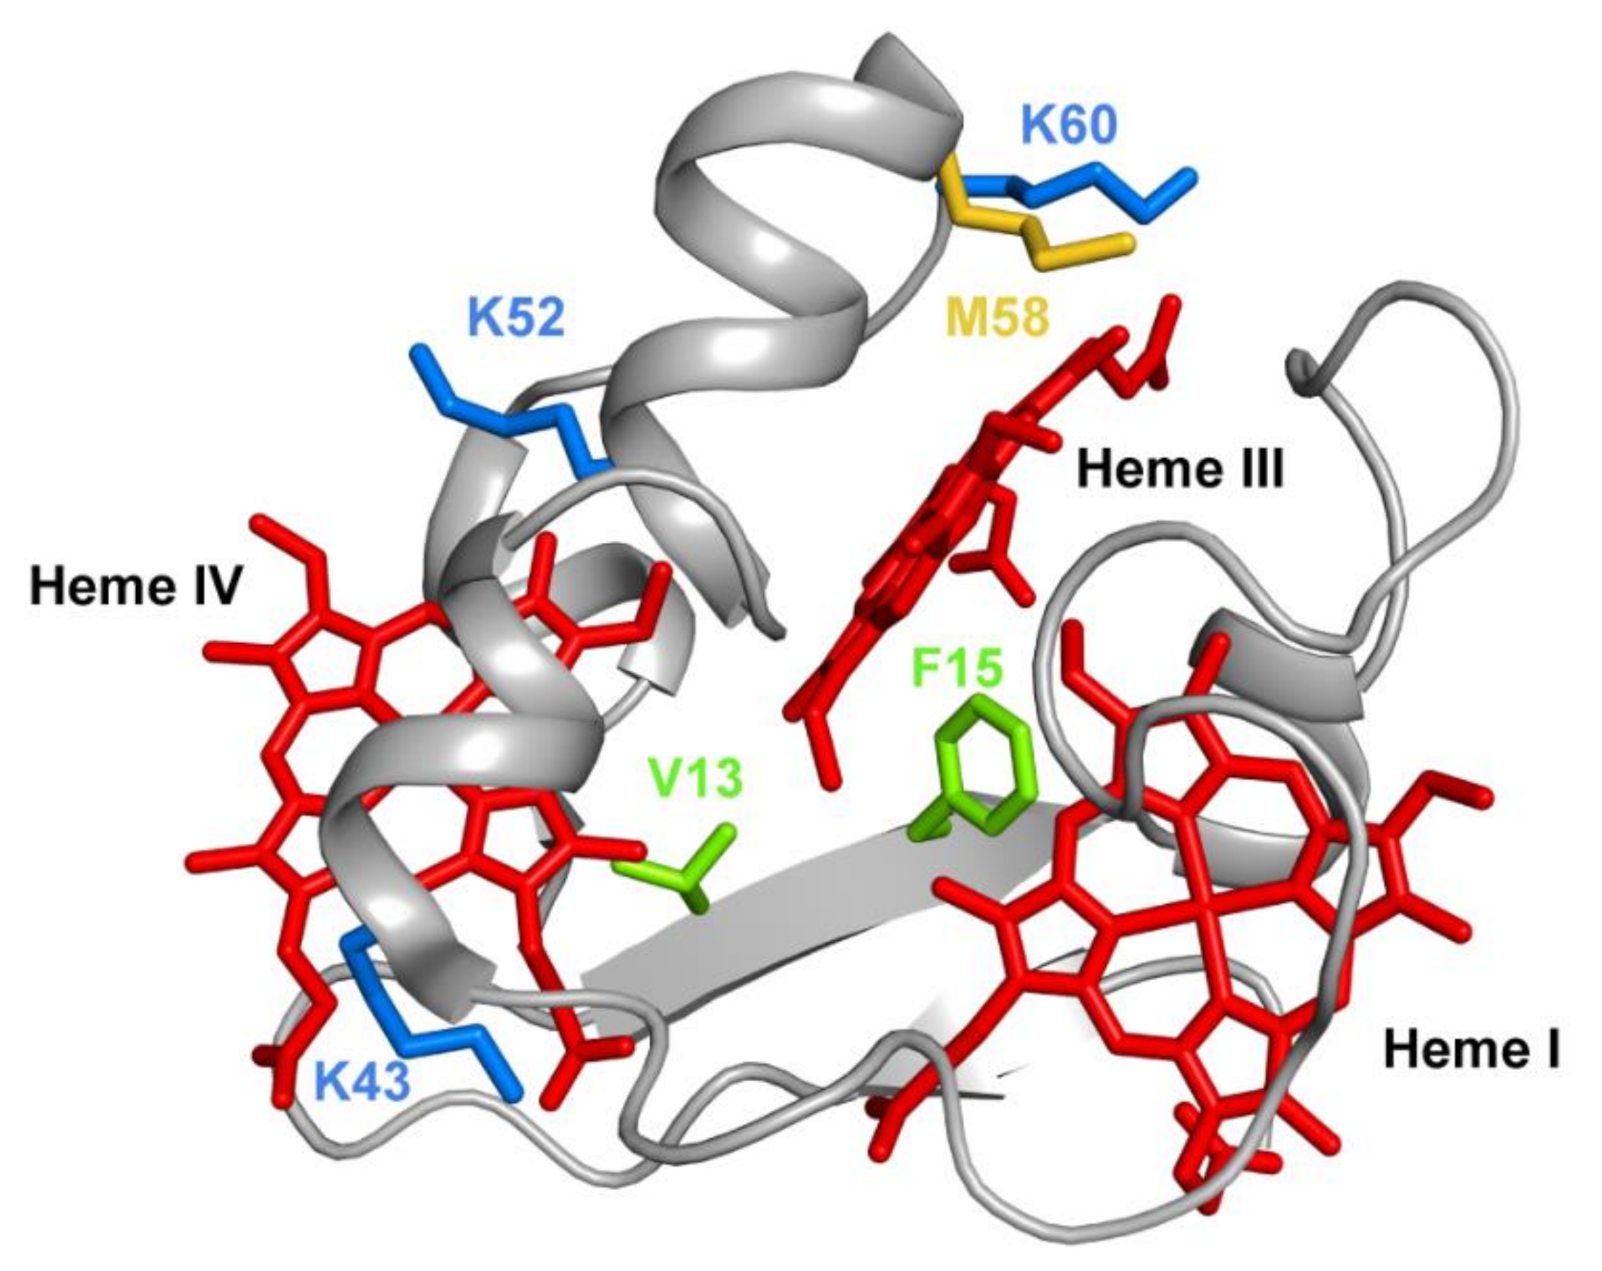
Several mutations were carried out in strategic regions of the protein (Figure 12) and included replacements in (i) conserved residues found in the PpcA-family of cytochromes (V13 and F15), (ii) a residue that controls heme III’s solvent accessibility (M58) and (iii) positively charged lysine residues in the vicinity of the hemes (K43, K52 and K60).
For each mutant, the conservation of the protein’s global fold, including the spatial arrangement of the heme groups, was checked using 2D 1H-NOESY and 2D 1H,15N-HSQC experiments, respectively [80].
Phenylalanine 15 (F15) is an aromatic, hydrophobic residue, with a volume of 190 Å3, located between hemes I and III (Figure 12) and was replaced by a leucine, which is also hydrophobic but contains a smaller volume of 167 Å3. The results obtained showed that in the mutant, the smaller volume of the leucine’s side chain increased the solvent exposure of the nearby heme group (heme III), with the concomitant decrease of its reduction potential. The decrease of the reduction potential of heme III altered the heme oxidation order, which goes from I-IV-III in the wild-type protein to I-III-IV in the F15L mutant (Table 3), while disrupting the preferential pathway for electron transfer at physiological pH observed in the wild-type protein (Table 3).
The conserved valine residue (V13), located within van der Waals contact of hemes III and IV, was replaced by nonpolar (alanine and isoleucine) and polar (serine and threonine) residues to probe the effects of the side-chain volume and polarity [95]. Except for V13A, in all other mutants, the architecture of the heme core was significantly perturbed, indicating that V13 was naturally selected to assure a unique conformation of the protein and the order of oxidation of the hemes. Overall, the results obtained by the replacement of conserved residues at the hydrophobic heme core (V13 and F15) are not relevant for eventual mutants, since the functional properties of the wild-type cytochrome necessary to assure effectiveness in the EET respiratory pathways of G. sulfurreducens were no longer observed.
Methionine 58 (M58), a hydrophobic residue with a volume of 163 Å3, was hypothesized to control the solvent accessibility of heme III (Figure 12). To probe the influence of the local charge and heme solvent exposure in the reduction potential of this heme, different mutants were studied, including M58D, M58K and M58S. M58D contains an aspartic acid in position 58, which is negatively charged and has a smaller volume of 111 Å3. The presence of an extra negative charge near heme III, together with the higher solvent accessibility caused by the smaller side chain of the aspartic acid residue, lowered the reduction potential of heme III, as expected (Table 3). Overall, the mutation affected the heme III reduction potential and affected both the heme oxidation order and the e/H+ preferential pathway for electron transfer at physiological pH (Table 3). On the other hand, in the M58K mutant, the positively charged lysine has a similar volume compared to the original residue in the wild-type cytochrome (167 Å3 versus 163 Å3). As expected, the effect on the heme III reduction potential value is opposite to the one observed in the M58D mutant (Table 3). In this case, the order of oxidation of the hemes is maintained, the protein is still able to couple e/H+ transfer, and its heme’s functional redox window is larger compared to the wild-type cytochrome (−91 to −159 mV versus −108 to −152 mV).
The last mutant in position 58 (M58S) illustrates the replacement of a polar residue with a smaller side chain (89 Å3). In this case, a decrease in the heme reduction potential is expected, not only due to the neutral, hydrophilic intrinsic character of the serine residue, but also due to an increase in the heme solvent exposure. In fact, the heme reduction potentials are, indeed, slightly more negative when compared with the wild-type protein (Table 3), while keeping the heme oxidation order and preferential pathway for electron transfer at physiological pH.
The final example on the analysis of PpcA mutants refers to lysine residues, particularly for K43 and K52 (located near heme IV) and K60 (near heme III) (Figure 12). In each case, the positively charged lysines (with a volume of 169 Å3) were replaced by negatively charged (glutamic acid) and noncharged (glutamine) residues. Glutamic acid possesses a smaller negatively charged side chain (138 Å3), whereas glutamine is a polar, hydrophilic amino acid with a total volume of 144 Å3. As expected, the replacement of a positive charge by a neutral residue (glutamine) decreased the redox potential of the nearby heme, an effect that was even larger with the inclusion of a negative charge (glutamic acid) in the same position (Table 3). For both K43 mutants (K43E and K43Q), the mutations significantly affect the heme reduction potential of heme IV but with different extents. The reduction potential of the heme decreases; however, the larger variation is observed for the K43E mutant: 54 mV and 24 mV difference for K43E and K43Q, respectively. Similarly, for K52 residue, also located close to heme IV (Figure 12), the impact of the substitutions (K52E and K52Q) affected the heme IV reduction potential (Table 3). Notwithstanding, in this case, the decrease in the redox potential value in K52E (−51 mV) is not considerably higher compared to the K52Q mutant (−49 mV). The similar impact observed for these two mutants on the reduction potential of heme IV may be explained by structural interactions between the inserted glutamine and other nearby residues, including the formation of H-bonds. This is a perfect example of how rational engineering of proteins may not be completely straightforward and how particular structural rearrangements may require further optimization of nearby residues. Similar results were obtained for K60 mutants, but with a higher impact on the redox properties of heme III, the closest heme to this residue (Figure 12 and Table 3). In all lysine mutants, the working functional redox range was increased compared to the wild-type, but only the K43 and K52 mutants maintain a preferential e/H+ transfer pathway.
In summary, the studies performed on the PpcA mutants showed that the replacement of residues that alter the heme solvent exposure might be explored to modify the working functional range of the proteins. Nevertheless, the most promising substitutions are indeed those involving charge alteration in the vicinity of the heme groups. Figure 13 summarizes the effect on the midpoint redox potential values (Eapp) of the mutants listed in Table 3.
In addition to the above-discussed effects on the properties of the individual hemes (Table 3), the analysis of Figure 13 clearly shows that all mutants have their working functional ranges shifted to more negative values and, consequently, the necessary properties to increase the electron transfer driving force towards electron acceptors in the cell exterior. The knowledge outcome from the studies carried out on PpcA cytochrome mutants [80,95,96,97,98,99] can now assist future rational optimizations of other MCs targets of G. sulfurreducens.

3.2. In Vivo Testing of the Impact of the Selected Mutations of PpcA

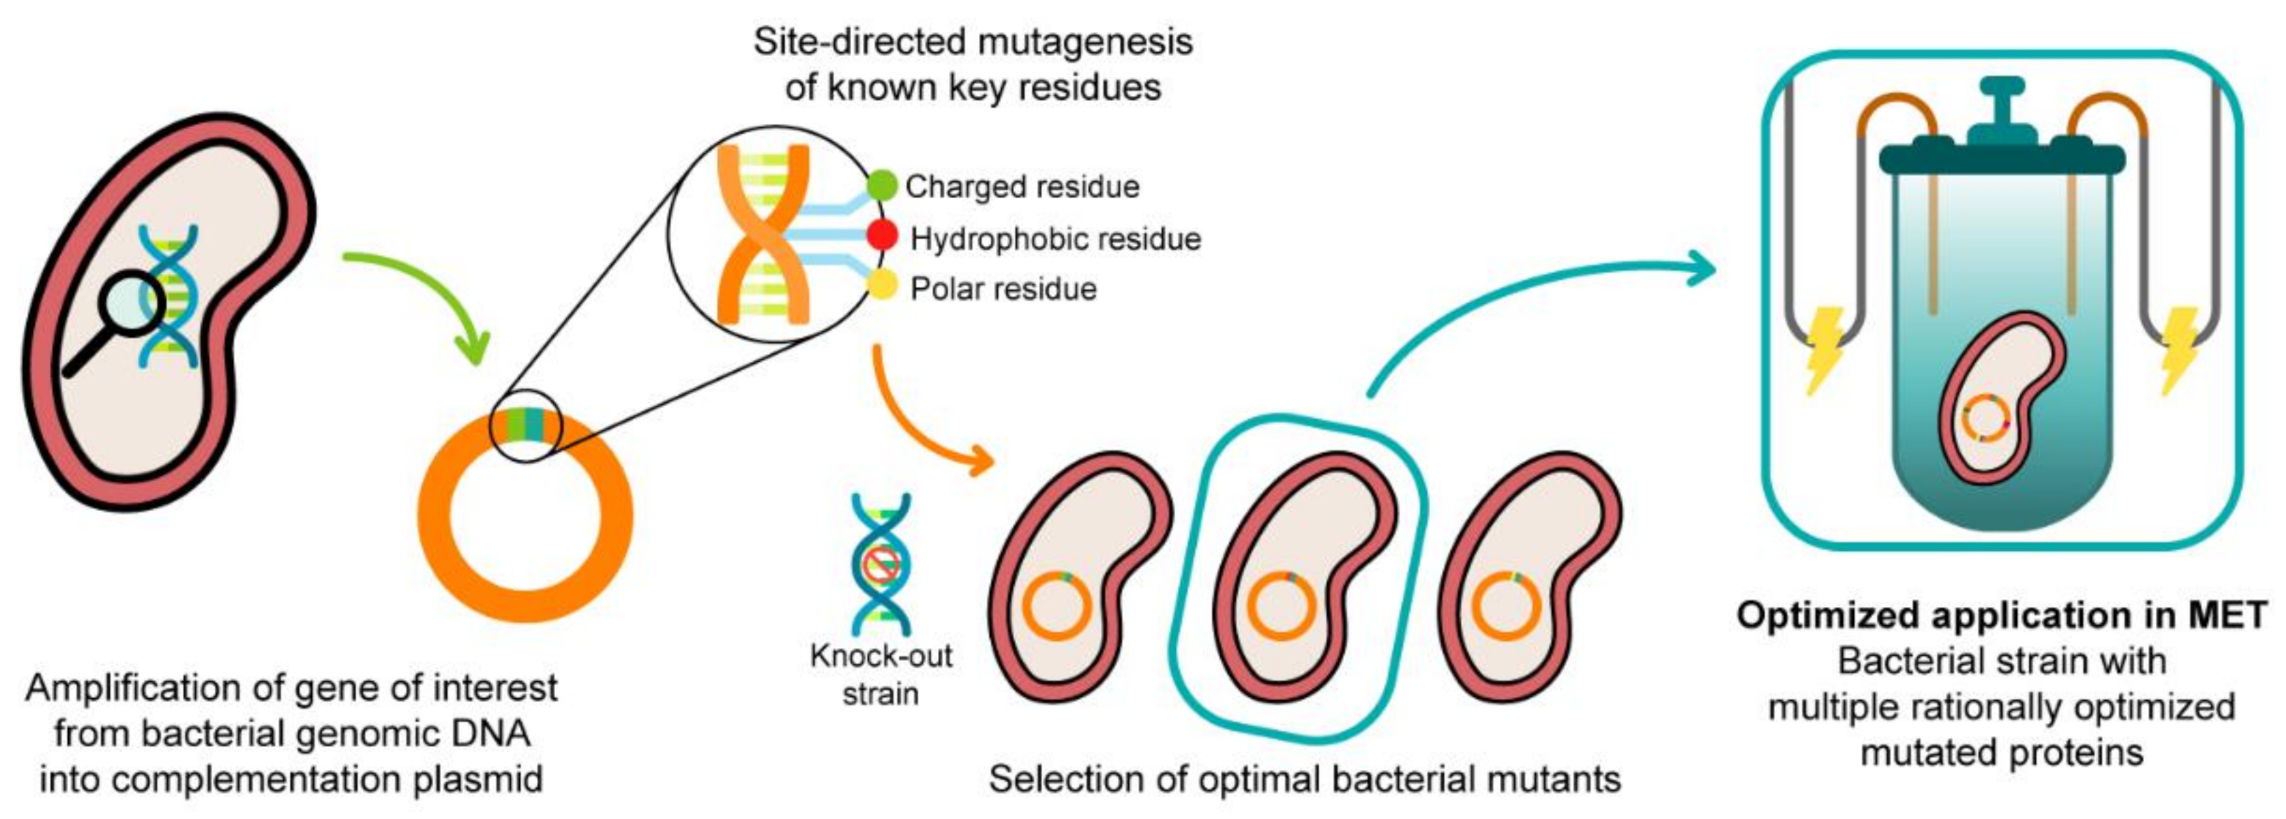
The functional characterization of different PpcA mutants revealed functional features that can be tuned by single amino acid mutations, namely the ability to couple electron and proton transfer, as well as the protein redox functional ranges. These mutants might be explored in the future for increased biomass production or optimization of the electron transfer between the electron donors and acceptors. This constitutes the first step towards the rational engineering of optimized Geobacter-mutated strains, with optimal applicability in METs. The second step is to realistically evaluate the effect of these mutated proteins in the electron transfer capabilities of G. sulfurreducens when incorporated in the bacterium. In 2003, Lloyd and co-workers [100] used a G. sulfurreducens strain with the ppcA gene knocked out to show that the bacterial growth with fumarate as an electron acceptor is not affected, while the growth rate significantly decreased when Fe(III) citrate was used as an electron acceptor. The ability of the bacterium to grow with Fe (III) citrate was restored when PpcA was expressed in trans from a complementation plasmid inserted by electroporation [100]. A similar strategy (Figure 14) can be envisaged to probe the effects of the PpcA mutants [36,100], using either the G. sulfurreducens strain with the ppcA gene knocked out [100] or, ideally, a G. sulfurreducens strain with all five cytochromes from the PpcA-family knocked out [101], to allow a more straightforward interpretation of results caused by the expression of the mutated forms of PpcA.
After the production of the mutated strains, their viability must be evaluated by analyzing the growth curves in the recommended standard bacterial media for G. sulfurreducens (NBAF [102]), so they can later be studied in media with different electron acceptors and their mutations evaluated in terms of electron transfer efficiency and current production. However, a single mutation in a single cytochrome should not cause significant changes per se in the electron transfer efficiency of the bacterium.
Therefore, after the impact and viability of a certain mutation are evaluated, other mutated forms of cytochromes belonging to the same EET pathway must be inserted using a similar methodology in order to improve the directionality of the electron transfer.

3.3. Ongoing Biotic Strategies to Improve Extracellular Electron Transfer

The protein engineering of cytochromes can be explored as such or to complement other biotic approaches that already led to an increase in the electron transfer efficiency of electroactive microorganisms. Yi and co-workers [23] showed that appropriate selective pressures in these microorganisms could lead to the development of new strains with enhanced capacity for current production in MFC’s. In their work, a wild-type strain of G. sulfurreducens was inoculated in a system in which a graphite anode was poised at −400 mV (versus Ag/AgCl) for 5 months, from which an isolate, designated strain KN400, was later recovered. This strain possessed several phenotypic changes in the outer surface of the cell, namely a higher abundance of protein nanowires, pili and flagella, which resulted in higher current and power densities than the wild-type strain. Jensen and co-workers [103] used a synthetic-biology approach to engineer a microorganism to increase its EET properties. By inserting the porin-cytochrome outer membrane MtrCAB complex of Shewanella oneidensis MR-1 into Escherichia coli, they were able to significantly increase the capacity of the latter to reduce metal ions and solid metal oxides. More recently, Ueki and co-workers [101] trimmed the redundancy of G. sulfurreducens EET pathways by creating a strain with minimal requirements. This “stripped-down” strain, with well-defined EET pathways, constitutes an excellent vehicle to implement the protein-engineering strategies described in this Review, allowing the design of strains with optimal EET mechanisms.

4. Conclusions

METs are rapidly growing environmental technologies, bringing together several research areas, including microbiology, electrochemistry, materials science and engineering. These technologies rely on the metabolic activity of electroactive microorganisms, which oxidize and/or reduce certain compounds that could lead to the synthesis of chemicals, bioremediation of polluted matrices, treatment of contaminants of interest, as well as the recovery of energy. Despite the increasing research efforts performed in the last 20 years, these technologies are not yet available on the market, mostly because of their low conversion efficiency, limited reliability, and complex scalability. However, the knowledge obtained from model organisms such as Geobacter and Shewanella has provided details of how these microorganisms perform EET and interact with electrodes, paving the way for the usage of protein engineering as a tool to improve the electron transfer efficiency of these systems. The main protein components taking part in the EET phenomenon in G. sulfurreducens are MCs. The experimental and technological advances in the past decade intensified the research on MCs by facilitating the structural and functional characterization of these proteins. In this Review, the theoretical basis and state-of-the-art techniques that allow the functional redox characterization of MCs were presented, which, together with structural information, can be used to rationally design mutants and improve bioremediation and bioenergy production capabilities of the host bacteria. Indeed, several mutants obtained through site-directed mutagenesis on targeted residues located in the vicinity of the heme groups of PpcA were presented, and their impact was described in detail. Some of these mutants may be suitable to engineer optimized bacterial strains targeted to work in different functional redox ranges while keeping the same functional features. A combination of different mutated targets participating on the same EET pathways in G. sulfurreducens is suggested, since it may result in a bacterial strain with higher electron transfer directionality to electrodes, thus increasing the current production and the overall efficiency of METs.

Author Contributions

This work was conceptualized by C.A.S. The original draft was prepared by T.M.F. The manuscript was reviewed and edited by all authors. All authors have read and agreed to the published version of the manuscript.

Funding

This work was supported by Fundação para a Ciência e Tecnologia (FCT) through the following grants: SFRH/BD/145039/2019 (to TMF), SFRH/BPD/114848/2016 (to LM) and PTDC/BIA-BQM/31981/2017 (to CAS). This work was supported by the Applied Molecular Biosciences Unit—UCIBIO, which is financed by national funds from FCT (UIDP/04378/2020 and UIDB/04378/2020).

Conflicts of Interest

The authors declare no conflict of interest.

Abbreviations

EETExtracellular electron transfer
METsMicrobial electrochemical technologies
MC(s)Multiheme cytochrome(s)

References

  1. Potter, M.C. Electrical effects accompanying the decomposition of organic compounds. Proc. R. Soc. Lond. Ser. B Contain. Pap. Biol. Character 1911, 84, 260–276. [Google Scholar]
  2. Logan, B.E.; Rossi, R.; Saikaly, P.E. Electroactive microorganisms in bioelectrochemical systems. Nat. Rev. Microbiol. 2019, 17, 307–319. [Google Scholar] [CrossRef] [PubMed]
  3. Wang, X.; Aulenta, F.; Puig, S.; Esteve-Núñez, A.; He, Y.; Mu, Y.; Rabaey, K. Microbial electrochemistry for bioremediation. Environ. Sci. Ecotechnol. 2020, 1, 100013. [Google Scholar] [CrossRef]
  4. Arends, J.B.A.; Verstraete, W. 100 years of microbial electricity production: Three concepts for the future. Microb. Biotechnol. 2012, 5, 333–346. [Google Scholar] [CrossRef] [Green Version]
  5. Lovley, D.R. Microbial fuel cells: Novel microbial physiologies and engineering approaches. Curr. Opin. Biotechnol. 2006, 17, 327–332. [Google Scholar] [CrossRef]
  6. Lovley, D.R. Cleaning up with genomics: Applying molecular biology to bioremediation. Nat. Rev. Microbiol. 2003, 1, 35–44. [Google Scholar] [CrossRef]
  7. Ing, N.L.; El-Naggar, M.Y.; Hochbaum, A.I. Going the distance: Long-range conductivity in protein and peptide bioelectronic materials. J. Phys. Chem. B 2018, 122, 10403–10423. [Google Scholar] [CrossRef] [Green Version]
  8. Lovley, D.R. e-Biologics: Fabrication of sustainable electronics with “green” biological materials. mBio 2017, 8, e00695-17. [Google Scholar] [CrossRef] [Green Version]
  9. Smith, A.F.; Liu, X.; Woodard, T.L.; Fu, T.; Emrick, T.; Jiménez, J.M.; Lovley, D.R.; Yao, J. Bioelectronic protein nanowire sensors for ammonia detection. Nano Res. 2020, 13, 1479–1484. [Google Scholar] [CrossRef]
  10. Mohan, Y.; Kumar, S.M.M.; Das, D. Electricity generation using microbial fuel cells. Int. J. Hydrogen Energy 2008, 33, 423–426. [Google Scholar] [CrossRef]
  11. Rani, N.; Sangwan, P.; Joshi, M.; Sagar, A.; Bala, K. Chapter 5—Microbes: A key player in industrial wastewater treatment. In Microbial Wastewater Treatment; Elsevier: Amsterdam, The Netherlands, 2019; pp. 83–102. [Google Scholar]
  12. Saeed, H.M.; Husseini, G.A.; Yousef, S.; Saif, J.; Al-Asheh, S.; Fara, A.A.; Azzam, S.; Khawaga, R.; Aidan, A. Microbial desalination cell technology: A review and a case study. Desalination 2015, 359, 1–13. [Google Scholar] [CrossRef]
  13. Nandi, R.; Sengupta, S. Microbial production of hydrogen: An overview. Crit. Rev. Microbiol. 1998, 24, 61–84. [Google Scholar] [CrossRef]
  14. Schnürer, A. Biogas Production: Microbiology and technology, Anaerobes in Biotechnology; Springer International Publishing: Cham, Switzerland, 2016; pp. 195–234. [Google Scholar]
  15. Liao, J.C.; Mi, L.; Pontrelli, S.; Luo, S. Fuelling the future: Microbial engineering for the production of sustainable biofuels. Nat. Rev. Microbiol. 2016, 14, 288–304. [Google Scholar] [CrossRef]
  16. Wu, S.; Li, H.; Zhou, X.; Liang, P.; Zhang, X.; Jiang, Y.; Huang, X. A novel pilot-scale stacked microbial fuel cell for efficient electricity generation and wastewater treatment. Water Res. 2016, 98, 396–403. [Google Scholar] [CrossRef]
  17. Anderson, R.T.; Vrionis, H.A.; Ortiz-Bernad, I.; Resch, C.T.; Long, P.E.; Dayvault, R.; Karp, K.; Marutzky, S.; Metzler, D.R.; Peacock, A.; et al. Stimulating the in situ activity of Geobacter species to remove uranium from the groundwater of a uranium-contaminated aquifer. Appl. Environ. Microbiol. 2003, 69, 5884–5891. [Google Scholar] [CrossRef] [Green Version]
  18. Mathuriya, A.S.; Jadhav, D.A.; Ghangrekar, M.M. Architectural adaptations of microbial fuel cells. Appl. Microbiol. Biot. 2018, 102, 9419–9432. [Google Scholar] [CrossRef]
  19. Zhou, M.; Chi, M.; Luo, J.; He, H.; Jin, T. An overview of electrode materials in microbial fuel cells. J. Power Sources 2011, 196, 4427–4435. [Google Scholar] [CrossRef]
  20. Jiang, D.; Li, B.; Jia, W.; Lei, Y. Effect of inoculum types on bacterial adhesion and power production in microbial fuel cells. Appl. Biochem. Biotechnol. 2009, 160, 182. [Google Scholar] [CrossRef]
  21. Li, F.; Sharma, Y.; Lei, Y.; Li, B.; Zhou, Q. Microbial fuel cells: The effects of configurations, electrolyte solutions, and electrode materials on power generation. Appl. Biochem. Biotechnol. 2009, 160, 168. [Google Scholar] [CrossRef]
  22. Schaetzle, O.; Barrière, F.; Baronian, K. Bacteria and yeasts as catalysts in microbial fuel cells: Electron transfer from micro-organisms to electrodes for green electricity. Energy Environ. Sci. 2008, 1, 607–620. [Google Scholar] [CrossRef]
  23. Yi, H.; Nevin, K.P.; Kim, B.-C.; Franks, A.E.; Klimes, A.; Tender, L.M.; Lovley, D.R. Selection of a variant of Geobacter sulfurreducens with enhanced capacity for current production in microbial fuel cells. Biosens. Bioelectron. 2009, 24, 3498–3503. [Google Scholar] [CrossRef]
  24. Hirose, A.; Kasai, T.; Koga, R.; Suzuki, Y.; Kouzuma, A.; Watanabe, K. Understanding and engineering electrochemically active bacteria for sustainable biotechnology. Bioresour. Bioprocess. 2019, 6, 10. [Google Scholar] [CrossRef] [Green Version]
  25. Zhao, J.; Li, F.; Cao, Y.; Zhang, X.; Chen, T.; Song, H.; Wang, Z. Microbial extracellular electron transfer and strategies for engineering electroactive microorganisms. Biotechnol. Adv. 2020, 107682. [Google Scholar] [CrossRef]
  26. Lin, W.C.; Coppi, M.V.; Lovley, D.R. Geobacter sulfurreducens can grow with oxygen as a terminal electron acceptor. Appl. Environ. Microbiol. 2004, 70, 2525–2528. [Google Scholar] [CrossRef] [Green Version]
  27. Lovley, D.R. Dissimilatory metal reduction. Annu. Rev. Microbiol. 1993, 47, 263–290. [Google Scholar] [CrossRef]
  28. Williams, K.H.; Bargar, J.R.; Lloyd, J.R.; Lovley, D.R. Bioremediation of uranium-contaminated groundwater: A systems approach to subsurface biogeochemistry. Curr. Opin. Biotechnol. 2013, 24, 489–497. [Google Scholar] [CrossRef]
  29. Methé, B.A.; Nelson, K.E.; Eisen, J.A.; Paulsen, I.T.; Nelson, W.; Heidelberg, J.F.; Wu, D.; Wu, M.; Ward, N.; Beanan, M.J.; et al. Genome of Geobacter sulfurreducens: Metal reduction in subsurface environments. Science 2003, 302, 1967–1969. [Google Scholar] [CrossRef] [Green Version]
  30. Aklujkar, M.; Coppi, M.V.; Leang, C.; Kim, B.C.; Chavan, M.A.; Perpetua, L.A.; Giloteaux, L.; Liu, A.; Holmes, D.E. Proteins involved in electron transfer to Fe(III) and Mn(IV) oxides by Geobacter sulfurreducens and Geobacter uraniireducens. Microbiology 2013, 159, 515–535. [Google Scholar] [CrossRef] [Green Version]
  31. Ding, Y.H.; Hixson, K.K.; Aklujkar, M.A.; Lipton, M.S.; Smith, R.D.; Lovley, D.R.; Mester, T. Proteome of Geobacter sulfurreducens grown with Fe(III) oxide or Fe(III) citrate as the electron acceptor. BBA Proteins Proteom. 2008, 1784, 1935–1941. [Google Scholar] [CrossRef]
  32. Ding, Y.H.; Hixson, K.K.; Giometti, C.S.; Stanley, A.; Esteve-Núñez, A.; Khare, T.; Tollaksen, S.L.; Zhu, W.; Adkins, J.N.; Lipton, M.S.; et al. The proteome of dissimilatory metal-reducing microorganism Geobacter sulfurreducens under various growth conditions. Biochim. Biophys. Acta 2006, 1764, 1198–1206. [Google Scholar] [CrossRef]
  33. Hernández-Eligio, A.; Pat-Espadas, A.M.; Vega-Alvarado, L.; Huerta-Amparán, M.; Cervantes, F.J.; Juárez, K. Global transcriptional analysis of Geobacter sulfurreducens under palladium reducing conditions reveals new key cytochromes involved. Appl. Microbiol. Biot. 2020, 104, 4059–4069. [Google Scholar] [CrossRef] [PubMed]
  34. Holmes, D.E.; Chaudhuri, S.K.; Nevin, K.P.; Mehta, T.; Methé, B.A.; Liu, A.; Ward, J.E.; Woodard, T.L.; Webster, J.; Lovley, D.R. Microarray and genetic analysis of electron transfer to electrodes in Geobacter sulfurreducens. Environ. Microbiol. 2006, 8, 1805–1815. [Google Scholar] [CrossRef]
  35. Otero, F.J.; Chan, C.H.; Bond, D.R. Identification of different putative outer membrane electron conduits necessary for Fe(III) citrate, Fe(III) oxide, Mn(IV) oxide, or electrode reduction by Geobacter sulfurreducens. J. Bacteriol. 2018, 200, e00347-18. [Google Scholar]
  36. Kim, B.C.; Leang, C.; Ding, Y.H.; Glaven, R.H.; Coppi, M.V.; Lovley, D.R. OmcF, a putative c-type monoheme outer membrane cytochrome required for the expression of other outer membrane cytochromes in Geobacter sulfurreducens. J. Bacteriol. 2005, 187, 4505–4513. [Google Scholar] [CrossRef] [PubMed] [Green Version]
  37. Kim, B.C.; Lovley, D.R. Investigation of direct vs indirect involvement of the c-type cytochrome MacA in Fe(III) reduction by Geobacter sulfurreducens. FEMS Microbiol. Lett. 2008, 286, 39–44. [Google Scholar] [CrossRef] [PubMed] [Green Version]
  38. Kim, B.C.; Postier, B.L.; DiDonato, R.J.; Chaudhuri, S.K.; Nevin, K.P.; Lovley, D.R. Insights into genes involved in electricity generation in Geobacter sulfurreducens via whole genome microarray analysis of the OmcF-deficient mutant. Bioelectrochemistry 2008, 73, 70–75. [Google Scholar] [CrossRef]
  39. Kim, B.-C.; Qian, X.; Leang, C.; Coppi, M.V.; Lovley, D.R. Two putative c-type multiheme cytochromes required for the expression of OmcB, an outer membrane protein essential for optimal Fe(III) reduction in Geobacter sulfurreducens. J. Bacteriol. 2006, 188, 3138. [Google Scholar] [CrossRef] [Green Version]
  40. Leang, C.; Coppi, M.V.; Lovley, D.R. OmcB, a c-type polyheme cytochrome, involved in Fe(III) reduction in Geobacter sulfurreducens. J. Bacteriol. 2003, 185, 2096–2103. [Google Scholar] [CrossRef] [Green Version]
  41. Levar, C.E.; Chan, C.H.; Mehta-Kolte, M.G.; Bond, D.R. An inner membrane cytochrome required only for reduction of high redox potential extracellular electron acceptors. mBio 2014, 5, e02034. [Google Scholar] [CrossRef] [Green Version]
  42. Liu, Y.; Fredrickson, J.K.; Zachara, J.M.; Shi, L. Direct involvement of ombB, omaB, and omcB genes in extracellular reduction of Fe(III) by Geobacter sulfurreducens PCA. Front. Microbiol. 2015, 6, 1075. [Google Scholar] [CrossRef] [Green Version]
  43. Mehta, T.; Coppi, M.V.; Childers, S.E.; Lovley, D.R. Outer membrane c-type cytochromes required for Fe(III) and Mn(IV) oxide reduction in Geobacter sulfurreducens. Appl. Environ. Microbiol. 2005, 71, 8634–8641. [Google Scholar] [CrossRef] [Green Version]
  44. Mollaei, M.; Timmers, P.H.A.; Suarez-Diez, M.; Boeren, S.; van Gelder, A.H.; Stams, A.J.M.; Plugge, C.M. Comparative proteomics of Geobacter sulfurreducens PCAT in response to acetate, formate and/or hydrogen as electron donor. Environ. Microbiol. 2021, 23, 299–315. [Google Scholar] [CrossRef]
  45. Nevin, K.P.; Kim, B.C.; Glaven, R.H.; Johnson, J.P.; Woodard, T.L.; Methe, B.A.; Didonato, R.J.; Covalla, S.F.; Franks, A.E.; Liu, A.; et al. Anode biofilm transcriptomics reveals outer surface components essential for high density current production in Geobacter sulfurreducens fuel cells. PLoS ONE 2009, 4, e5628. [Google Scholar] [CrossRef]
  46. Orellana, R.; Hixson, K.K.; Murphy, S.; Mester, T.; Sharma, M.L.; Lipton, M.S.; Lovley, D.R. Proteome of Geobacter sulfurreducens in the presence of U(VI). Microbiology 2014, 160, 2607–2617. [Google Scholar] [CrossRef]
  47. Rollefson, J.B.; Levar, C.E.; Bond, D.R. Identification of genes involved in biofilm formation and respiration via mini-Himar transposon mutagenesis of Geobacter sulfurreducens. J. Bacteriol. 2009, 191, 4207–4217. [Google Scholar] [CrossRef] [Green Version]
  48. Shelobolina, E.S.; Coppi, M.V.; Korenevsky, A.A.; DiDonato, L.N.; Sullivan, S.A.; Konishi, H.; Xu, H.; Leang, C.; Butler, J.E.; Kim, B.C.; et al. Importance of c-type cytochromes for U(VI) reduction by Geobacter sulfurreducens. BMC Microbiol. 2007, 7, 16. [Google Scholar] [CrossRef] [Green Version]
  49. Tremblay, P.L.; Summers, Z.M.; Glaven, R.H.; Nevin, K.P.; Zengler, K.; Barrett, C.L.; Qiu, Y.; Palsson, B.O.; Lovley, D.R. A c-type cytochrome and a transcriptional regulator responsible for enhanced extracellular electron transfer in Geobacter sulfurreducens revealed by adaptive evolution. Environ. Microbiol. 2011, 13, 13–23. [Google Scholar] [CrossRef]
  50. Voordeckers, J.W.; Kim, B.C.; Izallalen, M.; Lovley, D.R. Role of Geobacter sulfurreducens outer surface c-type cytochromes in reduction of soil humic acid and anthraquinone-2,6-disulfonate. Appl. Environ. Microbiol. 2010, 76, 2371–2375. [Google Scholar] [CrossRef] [Green Version]
  51. Zacharoff, L.; Chan, C.H.; Bond, D.R. Reduction of low potential electron acceptors requires the CbcL inner membrane cytochrome of Geobacter sulfurreducens. Bioelectrochemistry 2016, 107, 7–13. [Google Scholar] [CrossRef] [Green Version]
  52. Bowman, S.E.; Bren, K.L. The chemistry and biochemistry of heme c: Functional bases for covalent attachment. Nat. Prod. Rep. 2008, 25, 1118–1130. [Google Scholar] [CrossRef] [Green Version]
  53. Moore, G.R.; Pettigrew, G.W. Cytochromes c: Evolutionary, structural and physicochemical aspects. In Molecular Biology; Springer: Berlin/Heidelberg, Germany, 1990. [Google Scholar]
  54. Esteve-Núñez, A.; Sosnik, J.; Visconti, P.; Lovley, D.R. Fluorescent properties of c-type cytochromes reveal their potential role as an extracytoplasmic electron sink in Geobacter sulfurreducens. Environ. Microbiol. 2008, 10, 497–505. [Google Scholar] [CrossRef] [PubMed]
  55. Pokkuluri, P.R.; Londer, Y.Y.; Wood, S.J.; Duke, N.E.; Morgado, L.; Salgueiro, C.A.; Schiffer, M. Outer membrane cytochrome c, OmcF, from Geobacter sulfurreducens: High structural similarity to an algal cytochrome c6. Proteins 2009, 74, 266–270. [Google Scholar] [CrossRef] [PubMed]
  56. Morgado, L.; Bruix, M.; Pokkuluri, P.R.; Salgueiro, C.A.; Turner, D.L. Redox- and pH-linked conformational changes in triheme cytochrome PpcA from Geobacter sulfurreducens. Biochem. J. 2017, 474, 231–246. [Google Scholar] [CrossRef] [PubMed]
  57. Pokkuluri, P.R.; Londer, Y.Y.; Duke, N.E.; Pessanha, M.; Yang, X.; Orshonsky, V.; Orshonsky, L.; Erickson, J.; Zagyansky, Y.; Salgueiro, C.A.; et al. Structure of a novel dodecaheme cytochrome c from Geobacter sulfurreducens reveals an extended 12 nm protein with interacting hemes. J. Struct. Biol. 2011, 174, 223–233. [Google Scholar] [CrossRef]
  58. Rogers, N.K.; Moore, G.R. On the energetics of conformational changes and pH dependent redox behaviour of electron transfer proteins. FEBS Lett. 1988, 228, 69–73. [Google Scholar] [CrossRef] [Green Version]
  59. Xavier, A.V. Energy transduction coupling mechanisms in multiredox center proteins. J. Inorg. Biochem. 1986, 28, 239–243. [Google Scholar] [CrossRef]
  60. Page, C.C.; Moser, C.C.; Chen, X.; Dutton, P.L. Natural engineering principles of electron tunnelling in biological oxidation-reduction. Nature 1999, 402, 47–52. [Google Scholar] [CrossRef]
  61. Armstrong, F.A. Evaluations of reduction potential data in relation to coupling, kinetics and function. J. Biol. Inorg. Chem. 1997, 2, 139–142. [Google Scholar] [CrossRef]
  62. Das, D.K.; Medhi, O.K. The role of heme propionate in controlling the redox potential of heme: Square wave voltammetry of protoporphyrinato IX iron (III) in aqueous surfactant micelles. J. Inorg. Biochem. 1998, 70, 83–90. [Google Scholar] [CrossRef]
  63. de Lavalette, A.d.; Barucq, L.; Alric, J.; Rappaport, F.; Zito, F. Is the redox state of the ci heme of the cytochrome b6f complex dependent on the occupation and structure of the Qi site and vice-versa? J. Biol. Chem. 2009, 284, 20822–20829. [Google Scholar] [CrossRef] [Green Version]
  64. Gunner, M.R.; Alexov, E.; Torres, E.; Lipovaca, S. The importance of the protein in controlling the electrochemistry of heme metalloproteins: Methods of calculation and analysis. J. Biol. Inorg. Chem. 1997, 2, 126–134. [Google Scholar] [CrossRef]
  65. Liu, Y.; Moenne-Loccoz, P.; Hildebrand, D.P.; Wilks, A.; Loehr, T.M.; Mauk, A.G.; de Montellano, P.R.O. Replacement of the proximal histidine iron ligand by a cysteine or tyrosine converts heme oxygenase to an oxidase. Biochemistry 1999, 38, 3733–3743. [Google Scholar] [CrossRef]
  66. Ma, J.G.; Zhang, J.; Franco, R.; Jia, S.L.; Moura, I.; Moura, J.J.; Kroneck, P.M.; Shelnutt, J.A. The structural origin of nonplanar heme distortions in tetraheme ferricytochromes c3. Biochemistry 1998, 37, 12431–12442. [Google Scholar] [CrossRef]
  67. Sarma, S.; DiGate, R.J.; Goodin, D.B.; Miller, C.J.; Guiles, R.D. Effect of axial ligand plane reorientation on electronic and electrochemical properties observed in the A67V mutant of rat cytochrome b5. Biochemistry 1997, 36, 5658–5668. [Google Scholar] [CrossRef]
  68. Tezcan, F.A.; Winkler, J.R.; Gray, H.B. Effects of ligation and folding on reduction potentials of heme proteins. J. Am. Chem. Soc. 1998, 120, 13383–13388. [Google Scholar] [CrossRef]
  69. Assfalg, M.; Banci, L.; Bertini, I.; Bruschi, M.; Turano, P. 800 MHz 1H NMR solution structure refinement of oxidized cytochrome c7 from Desulfuromonas acetoxidans. Eur. J. Biochem. 1998, 256, 261–270. [Google Scholar] [CrossRef] [Green Version]
  70. Fernandes, A.P.; Couto, I.; Morgado, L.; Londer, Y.Y.; Salgueiro, C.A. Isotopic labeling of c-type multiheme cytochromes overexpressed in E. coli. Prot. Expr. Purif. 2008, 59, 182–188. [Google Scholar] [CrossRef]
  71. Messias, A.C.; Kastrau, D.H.; Costa, H.S.; LeGall, J.; Turner, D.L.; Santos, H.; Xavier, A.V. Solution structure of Desulfovibrio vulgaris (Hildenborough) ferrocytochrome c3: Structural basis for functional cooperativity. J. Mol. Biol. 1998, 281, 719–739. [Google Scholar] [CrossRef] [Green Version]
  72. Morgado, L.; Fernandes, A.P.; Londer, Y.Y.; Bruix, M.; Salgueiro, C.A. One simple step in the identification of the cofactors signals, one giant leap for the solution structure determination of multiheme proteins. Biochem. Biophys. Res. Commun. 2010, 393, 466–470. [Google Scholar] [CrossRef]
  73. Santos, H.; Turner, D.L.; Xavier, A.V.; le Gall, J. Two-dimensional NMR studies of electron transfer in cytochrome c3. J. Magn. Reson. 1984, 59, 177–180. [Google Scholar] [CrossRef]
  74. Turner, D.L.; Salgueiro, C.A.; Schenkels, P.; le Gall, J.; Xavier, A.V. Carbon-13 NMR studies of the influence of axial ligand orientation on haem electronic structure. Biochim. Biophys. Acta 1995, 1246, 24–28. [Google Scholar] [CrossRef]
  75. Morgado, L.; Bruix, M.; Pessanha, M.; Londer, Y.Y.; Salgueiro, C.A. Thermodynamic characterization of a triheme cytochrome family from Geobacter sulfurreducens reveals mechanistic and functional diversity. Biophys. J. 2010, 99, 293–301. [Google Scholar] [CrossRef] [Green Version]
  76. Wilson, G.S. Determination of Oxidation-Reduction Potentials, Methods in Enzymology; Academic Press: Cambridge, MA, USA, 1978; pp. 396–410. [Google Scholar]
  77. Heitmann, D.; Einsle, O. Structural and biochemical characterization of DHC2, a novel diheme cytochrome c from Geobacter sulfurreducens. Biochemistry 2005, 44, 12411–12419. [Google Scholar] [CrossRef] [PubMed]
  78. Santos, H.; Moura, J.J.; Moura, I.; le Gall, J.; Xavier, A.V. NMR studies of electron transfer mechanisms in a protein with interacting redox centres: Desulfovibrio gigas cytochrome c3. Eur. J. Biochem. 1984, 141, 283–296. [Google Scholar] [CrossRef] [PubMed]
  79. Jeener, J.; Meier, B.H.; Bachmann, P.; Ernst, R.R. Investigation of exchange processes by two-dimensional NMR spectroscopy. J. Chem. Phys. 1979, 71, 4546–4553. [Google Scholar] [CrossRef]
  80. Dantas, J.M.; Morgado, L.; Aklujkar, M.; Bruix, M.; Londer, Y.Y.; Schiffer, M.; Pokkuluri, P.R.; Salgueiro, C.A. Rational engineering of Geobacter sulfurreducens electron transfer components: A foundation for building improved Geobacter-based bioelectrochemical technologies. Front. Microbiol. 2015, 6, 752. [Google Scholar] [CrossRef] [PubMed] [Green Version]
  81. Perrin, C.L.; Dwyer, T.J. Application of two-dimensional NMR to kinetics of chemical exchange. Chem. Rev. 1990, 90, 935–967. [Google Scholar] [CrossRef]
  82. Johnson, C.E.; Bovey, F.A. Calculation of nuclear magnetic resonance spectra of aromatic hydrocarbons. J. Chem. Phys. 1958, 29, 1012–1014. [Google Scholar] [CrossRef]
  83. Moss, G.P. Nomenclature of tetrapyrroles. Recommendations 1986 IUPAC-IUB joint commission on biochemical nomenclature (JCBN). Eur. J. Biochem. 1988, 178, 277–328. [Google Scholar] [CrossRef]
  84. Rule, G.S.; Hitchens, T.K. Fundamentals of Protein NMR Spectroscopy, 1st ed.; Springer: Dordrecht, The Netherlands, 2006. [Google Scholar]
  85. Turner, D.L.; Salgueiro, C.A.; le Gall, J.; Xavier, A.V. Structural studies of Desulfovibrio vulgaris ferrocytochrome c3 by two-dimensional NMR. Eur. J. Biochem. 1992, 210, 931–936. [Google Scholar] [CrossRef]
  86. Keller, R.M.; Wüthrich, K. Assignment of the heme c resonances in the 360 MHz 1H NMR spectra of cytochrome c. Biochim. Biophys. Acta Protein Struct. 1978, 533, 195–208. [Google Scholar] [CrossRef]
  87. Turner, D.L.; Costa, H.S.; Coutinho, I.B.; Legall, J.; Xavier, A.V. Assignment of the ligand geometry and redox potentials of the trihaem ferricytochrome c3 from Desulfuromonas acetoxidans. Eur. J. Biochem. 1997, 243, 474–481. [Google Scholar] [CrossRef]
  88. Salgueiro, C.A.; Turner, D.L.; Xavier, A.V. Use of paramagnetic NMR probes for structural analysis in cytochrome c3 from Desulfovibrio vulgaris. Eur. J. Biochem. 1997, 244, 721–734. [Google Scholar] [CrossRef]
  89. Fernandes, T.M.; Morgado, L.; Salgueiro, C.A. Thermodynamic and functional characterization of the periplasmic triheme cytochrome PpcA from Geobacter metallireducens. Biochem. J. 2018, 475, 2861–2875. [Google Scholar] [CrossRef]
  90. Xavier, A.V. Thermodynamic and choreographic constraints for energy transduction by cytochrome c oxidase. BBA Bioenergy 2004, 1658, 23–30. [Google Scholar] [CrossRef] [Green Version]
  91. Marquardt, D.W. An algorithm for least-squares estimation of nonlinear parameters. J. Soc. Ind. Appl. Math. 1963, 11, 431–441. [Google Scholar] [CrossRef]
  92. Pessanha, M.; Morgado, L.; Louro, R.O.; Londer, Y.Y.; Pokkuluri, P.R.; Schiffer, M.; Salgueiro, C.A. Thermodynamic characterization of triheme cytochrome PpcA from Geobacter sulfurreducens: Evidence for a role played in e/H+ energy transduction. Biochemistry 2006, 45, 13910–13917. [Google Scholar] [CrossRef]
  93. Morgado, L.; Bruix, M.; Orshonsky, V.; Londer, Y.Y.; Duke, N.E.; Yang, X.; Pokkuluri, P.R.; Schiffer, M.; Salgueiro, C.A. Structural insights into the modulation of the redox properties of two Geobacter sulfurreducens homologous triheme cytochromes. BBA Bioenergy 2008, 1777, 1157–1165. [Google Scholar] [CrossRef] [Green Version]
  94. Mahadevan, R.; Bond, D.R.; Butler, J.E.; Esteve-Núñez, A.; Coppi, M.V.; Palsson, B.O.; Schilling, C.H.; Lovley, D.R. Characterization of metabolism in the Fe(III)-reducing organism Geobacter sulfurreducens by constraint-based modeling. Appl. Environ. Microbiol. 2006, 72, 1558–1568. [Google Scholar] [CrossRef] [Green Version]
  95. Dantas, J.M.; Portela, P.C.; Fernandes, A.P.; Londer, Y.Y.; Yang, X.; Duke, N.E.C.; Schiffer, M.; Pokkuluri, P.R.; Salgueiro, C.A. Structural and functional relevance of the conserved residue V13 in the triheme cytochrome PpcA from Geobacter sulfurreducens. J. Phys. Chem. B 2019, 123, 3050–3060. [Google Scholar] [CrossRef]
  96. Dantas, J.M.; Morgado, L.; Londer, Y.Y.; Fernandes, A.P.; Louro, R.O.; Pokkuluri, P.R.; Schiffer, M.; Salgueiro, C.A. Pivotal role of the strictly conserved aromatic residue F15 in the cytochrome c7 family. J. Biol. Inorg. Chem. 2012, 17, 11–24. [Google Scholar] [CrossRef] [PubMed]
  97. Dantas, J.M.; Simões, T.; Morgado, L.; Caciones, C.; Fernandes, A.P.; Silva, M.A.; Bruix, M.; Pokkuluri, P.R.; Salgueiro, C.A. Unveiling the structural basis that regulates the energy transduction properties within a family of triheme cytochromes from Geobacter sulfurreducens. J. Phys. Chem. B 2016, 120, 10221–10233. [Google Scholar] [CrossRef] [PubMed]
  98. Morgado, L.; Dantas, J.M.; Simões, T.; Londer, Y.Y.; Pokkuluri, P.R.; Salgueiro, C.A. Role of Met58 in the regulation of electron/proton transfer in trihaem cytochrome PpcA from Geobacter sulfurreducens. Biosci. Rep. 2013, 33, e00002. [Google Scholar] [CrossRef] [PubMed]
  99. Morgado, L.; Lourenço, S.; Londer, Y.Y.; Schiffer, M.; Pokkuluri, P.R.; Salgueiro, C.A. Dissecting the functional role of key residues in triheme cytochrome PpcA: A path to rational design of G. sulfurreducens strains with enhanced electron transfer capabilities. PLoS ONE 2014, 9, e105566. [Google Scholar] [CrossRef] [PubMed]
  100. Lloyd, J.R.; Leang, C.; Myerson, A.L.H.; Coppi, M.V.; Cuifo, S.; Methe, B.; Sandler, S.J.; Lovley, D.R. Biochemical and genetic characterization of PpcA, a periplasmic c-type cytochrome in Geobacter sulfurreducens. Biochem. J. 2003, 369, 153–161. [Google Scholar] [CrossRef] [PubMed] [Green Version]
  101. Ueki, T.; DiDonato, L.N.; Lovley, D.R. Toward establishing minimum requirements for extracellular electron transfer in Geobacter sulfurreducens. FEMS Microbiol. Lett. 2017, 364, fnx093. [Google Scholar] [CrossRef] [PubMed]
  102. Coppi, M.V.; Leang, C.; Sandler, S.J.; Lovley, D.R. Development of a genetic system for Geobacter sulfurreducens. Appl. Environ. Microbiol. 2001, 67, 3180–3187. [Google Scholar] [CrossRef] [Green Version]
  103. Jensen, H.M.; Albers, A.E.; Malley, K.R.; Londer, Y.Y.; Cohen, B.E.; Helms, B.A.; Weigele, P.; Groves, J.T.; Ajo-Franklin, C.M. Engineering of a synthetic electron conduit in living cells. Proc. Natl. Acad. Sci. USA 2010, 107, 19213. [Google Scholar] [CrossRef] [Green Version]
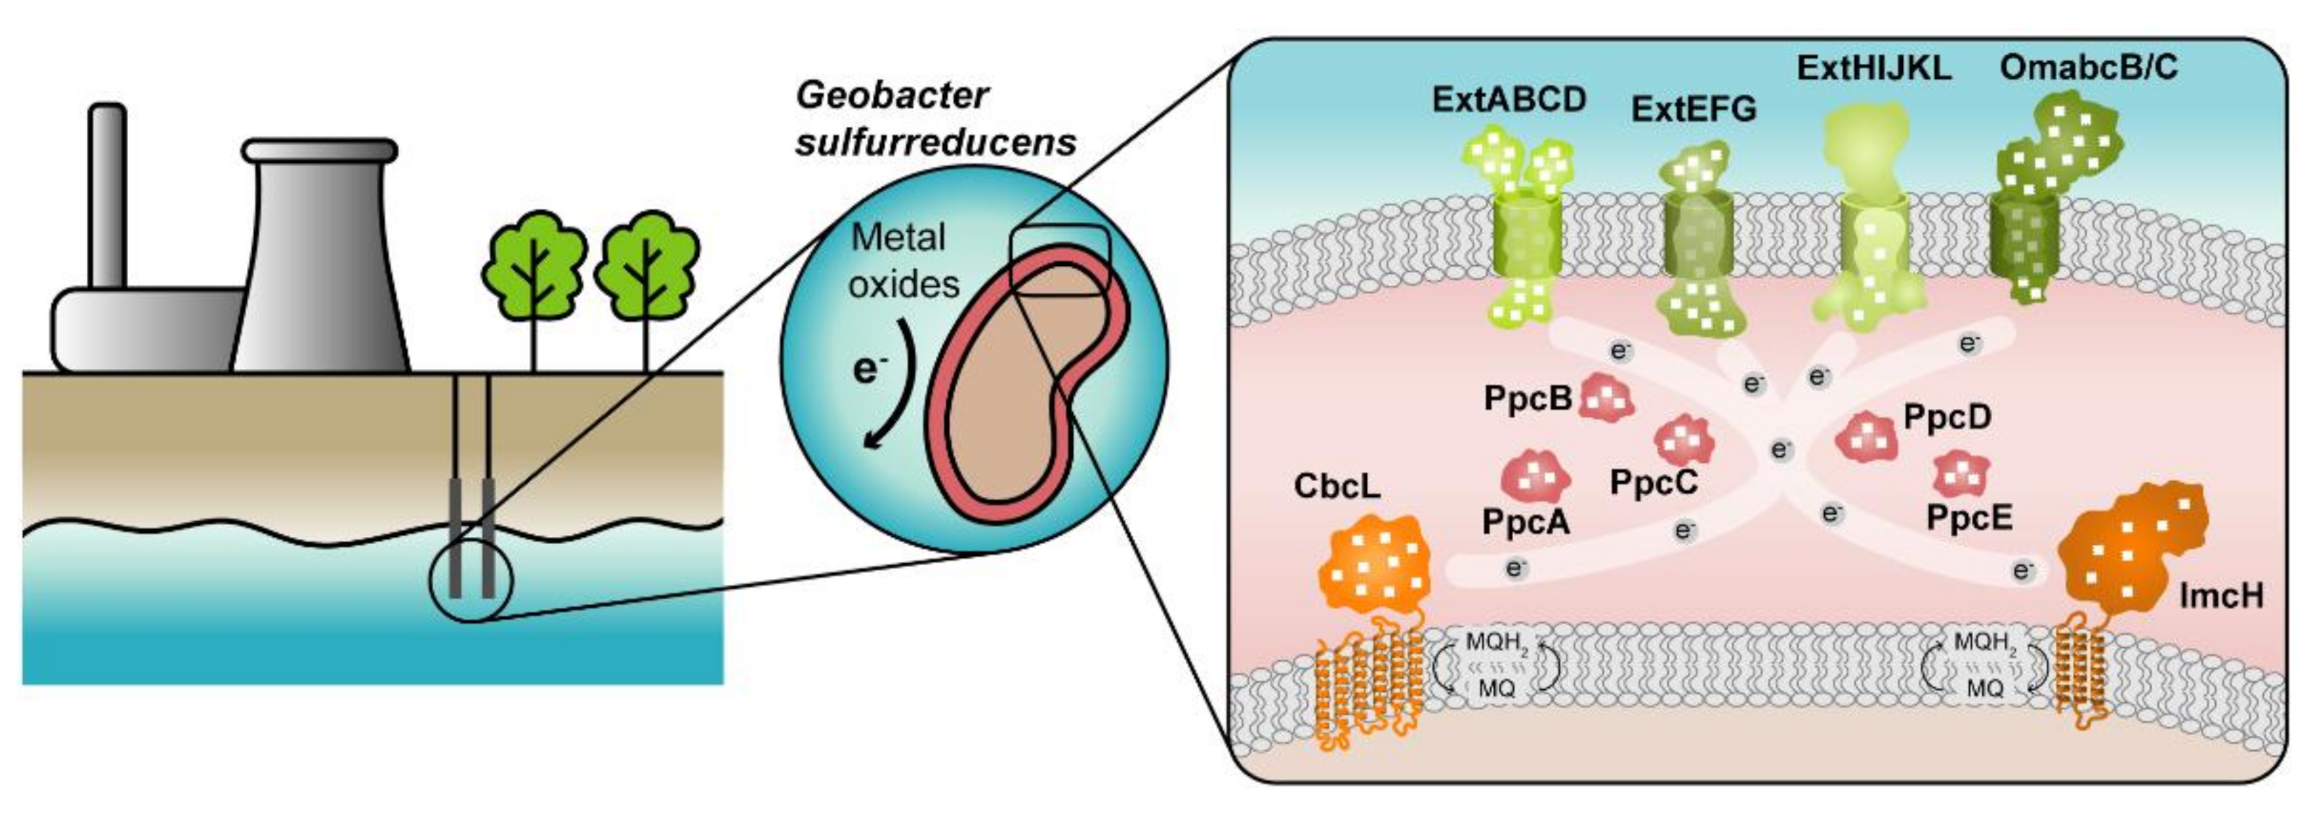
Figure 1. Geobacter-based bioremediation technologies and current model for EET in G. sulfurreducens. A conceptual bioremediation station installed near soils, sediments and groundwater contaminated by industrial activities is represented. In this station, organic carbon compounds are introduced to native microorganisms, such as G. sulfurreducens, through injection wells (see [28]). This bacterium couples the oxidation of those compounds with the reduction of different toxic or radioactive compounds, leading to their precipitation and thus facilitating their removal. On the right panel, a model for the EET pathways of G. sulfurreducens is presented. The different proteins that play a role in EET spread from the inner membrane (CbcL and ImcH in orange), through the periplasm (PpcA-family in pink), and to the outer membrane (porin-cytochrome complexes in green). Heme groups are represented in white.
Antioxidants 10 00844 g001
Figure 2. Structures of different c-type cytochromes from Geobacter sulfurreducens obtained in the oxidized state. Monoheme OmcF (PDB ID: 3CU4 [55]), triheme PpcA (lowest energy, PDB ID: 2MZ9 [56]) and dodecaheme GSU1996 (PDB ID: 3OV0 [57]). In all structures, the heme groups are represented in red.
Antioxidants 10 00844 g002
Figure 3. Redox features of monoheme and triheme cytochromes. (A) Electronic distribution scheme of a monoheme (left) and a triheme (right) cytochrome. The inner hexagons represent heme groups, which can either be reduced (colored hexagons) or oxidized (white hexagons). The microstates are grouped according to the number of oxidized hemes in each oxidation stage, connected by consecutive one-electron redox steps. P0 indicates the fully reduced state. Pijk indicates the microstates where hemes i, j and k are oxidized. (B) UV-visible spectra of a low-spin c-type cytochrome in the fully oxidized (solid line) and fully reduced (dashed line) states. The inset shows the α-band region of the visible spectra in the redox titration of PpcA [75]. (C) Redox titrations followed by visible spectroscopy of a monoheme (OmcF [55], left panel) and a triheme cytochrome (PpcA [75], right panel). Solid lines indicate the result of the fits for the Nernst equation (OmcF, see text) and for a model of three consecutive reversible redox steps between the different oxidation stages (PpcA, see text). The dashed line in the PpcA panel represents a standard n = 1 Nernst curve with an Eapp of −117 mV, illustrating the non-Nernstian redox behavior of a MC.
Antioxidants 10 00844 g003
Figure 4. Ring-current and paramagnetic effects of the heme groups. (A) Model for the ring-current effects in a c-type heme. Based on this model, the chemical shifts of the heme substituents will be affected depending on their location in relation to the heme plane. Consequently, methines (CH), methylenes (CH2) and methyls (CH3), whose resonances are usually located between 0.9 and 2 ppm, are found in a wide range of chemical shifts, varying from −1 to 10 ppm (see below). (B) Paramagnetic effects in a triheme cytochrome. The paramagnetic effects (represented by red spheres) caused by the unpaired electrons do not have a linear effect on the chemical shifts of the heme substituents, which can be shifted to lower or higher frequencies on the 1H NMR spectrum of the cytochrome.
Antioxidants 10 00844 g004
Figure 5. 1D 1H-NMR spectra of the triheme cytochrome PpcA and a diagram of heme c. The typical regions of the hemes substituents in both redox states are indicated. In the heme c diagram, the heme substituents are numbered according to the IUPAC-IUB nomenclature [83]. Dashed and solid lines indicate the connectivities observed in NOESY and TOCSY spectra, respectively. This figure was partially reproduced with the permission of Elsevier from the original work [72].
Antioxidants 10 00844 g005
Figure 6. 2D 1H,13C-HSQC NMR spectra of unlabeled (blue contours) and 13C labeled (black contours) PpcA obtained at 25 °C, with 640 and 80 scans, respectively. To not overcrowd the figure, only the resonances separated from the main signal envelope are indicated. Blue and black labels indicate the heme substituents and the polypeptide resonances, respectively. The peaks of the protons connected to the same carbon atom (CH2 groups) are linked by a straight line. In triheme cytochromes c7, the hemes are numbered I, III and IV [87]. This figure was reproduced with the permission of Elsevier from the original work [72].
Antioxidants 10 00844 g006
Figure 7. Illustration of the heme oxidation profiles of PpcA (pH 8, 15 °C). In the expansions of the 2D 1H-EXSY NMR spectra, the cross-peaks resulting from intermolecular electron transfer between the different oxidation stages (0–3) are indicated by dashed lines. 1D 1H-NMR spectra, acquired at different stages of oxidation and illustrating the redox titration of the cytochrome, are represented on top. The peaks corresponding to the heme methyls 121CH3I, 71CH3III and 121CH3IV are marked by green, orange and blue circles, respectively. These heme methyls are also highlighted with the same color code in the heme core of oxidized PpcA (PDB ID: 2MZ9 [56]). This figure was partially reproduced with the permission of Elsevier from the original work [75].
Antioxidants 10 00844 g007
Figure 8. Thermodynamic model for a triheme cytochrome with one redox-Bohr center. (A) Electronic distribution scheme for a triheme cytochrome with a proton-linked equilibrium, showing the 16 possible microstates. The light gray and dark gray circles correspond to the deprotonated and protonated microstates, respectively. The protonated microstates are also identified with a red “H,” which mimics the redox-Bohr center. The reduced hemes i, j and k are colored green, orange and blue, respectively. The oxidized hemes are colored white. P0H and P0 represent the reduced protonated and deprotonated microstates, respectively. PijkH and Pijk indicate, respectively, the protonated and deprotonated microstates, where i, j and k represent the heme(s) that are oxidized in that particular microstate. (B) Schematic representation of the interaction networks of a triheme cytochrome [inner hexagons, i (green), j (orange) and k (blue)] and one redox-Bohr center (red ‘H’). The terms gij and giH represent the interaction energies between the hemes (ij) and between the hemes and the redox-Bohr center (H), respectively. The individual heme oxidation energies are represented as gi, gj and gk for hemes i, j and k, respectively. This figure was partially reproduced with the permission of Portland Press from the original work [89].
Antioxidants 10 00844 g008
Figure 9. Redox titrations followed by visible spectroscopy for PpcA. The redox curves, determined at pH 7 (○) and pH 8 (□), are shown for the reductive (open symbols) and oxidative (filled symbols) titrations. The Eapp and E 1 0 E 3 0 values result from the fitting of the experimental results to Equation (7) (solid line). This figure was partially reproduced with the permission of Elsevier from the original work [93].
Antioxidants 10 00844 g009
Figure 10. The fitting of the thermodynamic model to the experimental data for PpcA. The solid lines are the result of the simultaneous fitting of NMR and visible data. The figure shows the pH dependence of the heme methyl chemical shifts at oxidation stages 1 (Δ), 2 (□) and 3 (○), and the reduced fractions of the cytochrome, determined by visible spectroscopy at pH 7 (○) and pH 8 (□). The chemical shift dependence of the heme methyl groups in the fully reduced stage (stage 0) is not plotted since they are unaffected by the pH. In the UV-visible redox titration panel, the open and filled symbols represent the data points in the reductive and oxidative titrations, respectively. The experimental uncertainty of the NMR data is evaluated from the line width of each NMR signal at half-height, whereas the uncertainty of the UV-visible data points is usually estimated to be 3% of the total optical signal. This figure was partially reproduced with the permission of Elsevier from the original work [75].
Antioxidants 10 00844 g010
Figure 11. PpcA individual heme oxidation fractions and molar fractions of the 16 individual microstates at pH 7.5. (A) Redox dependence of the heme oxidation fractions of PpcA. The curves for hemes I, III and IV are represented in green, orange and blue, respectively. The oxidation order of the hemes is indicated. (B) Redox dependence of the molar fractions of the 16 microstates of PpcA. Solid and dashed lines indicate the protonated and deprotonated microstates, respectively. For clarity, only the dominant microstates are labeled. In both panels, the curves were calculated as a function of the solution reduction potential (relative to the NHE) using the parameters listed in Table 2. This figure was partially reproduced with the permission of Elsevier from the original work [75].
Antioxidants 10 00844 g011
Figure 12. The spatial location of the residues mutated in the PpcA solution structure. The PpcA polypeptide chain (PDB code: 2MZ9 [56]) is shown as a Cα ribbon in gray, with the heme groups in red. The side chains of V13 and F15 are represented in green; K43, K52 and K60 in blue; and M58 in yellow, all in stick drawings.
Antioxidants 10 00844 g012
Figure 13. Midpoint reduction potentials (Eapp) of PpcA mutants. The mutants that retain the e/H+ transfer capability are labeled in green, while mutants for which the preferential pathway is disrupted are labeled in red. Wild-type PpcA is labeled in gray.
Antioxidants 10 00844 g013
Figure 14. A schematic representation of the preparation of G. sulfurreducens strains with mutated cytochromes. After the bacterial genome is extracted, the specific target gene is amplified and further inserted into a complementation plasmid. The gene is mutated in key residues through site-directed mutagenesis, and the resultant mutants are inserted into a bacterial knock-out strain. The EET capabilities of the engineered bacteria are then tested in media with different electron acceptors. This process is applied to different key EET components of the bacterium, and the optimized mutants are selected and conjugated. The resultant strain, with higher electron transfer driving force and current production, is finally applied in METs.
Antioxidants 10 00844 g014
Table 1. Heme methyl chemical shifts of PpcA at different stages of oxidation (S) at pH 8 and pH 6. The heme oxidation fractions were calculated according to Equation (8).
pH 8Chemical Shift (ppm)xi∑xi
S121CH3I71CH3III121CH3IV121CH3I71CH3III121CH3IV
02.554.143.950.000.000.000.00
111.227.388.440.450.230.280.96
219.259.4015.310.870.370.721.95
321.7918.4219.811.001.001.003.00
pH 6Chemical Shift (ppm)xi∑xi
S121CH3I71CH3III121CH3IV121CH3I71CH3III121CH3IV
02.554.143.950.000.000.000.00
112.708.135.920.530.280.140.95
219.7811.6111.190.900.520.531.95
321.6218.4217.691.001.001.003.00
Table 2. Thermodynamic parameters for PpcA in the fully reduced and protonated form (15 °C, 250 mM ionic strength). Diagonal values (in bold) correspond to the oxidation energies of the hemes and deprotonating energy of the redox-Bohr center. Off-diagonal values are the redox (heme-heme) and redox-Bohr (heme-proton) interaction energies. All energies are reported in meV, with standard errors given in parenthesis. The macroscopic pKa values of the redox-Bohr center in each stage of oxidation, calculated from the redox-Bohr center parameters, are the following: 8.6 (stage 0), 8.0 (stage 1), 6.9 (stage 2) and 6.5 (stage 3). The pKa of the reduced and oxidized protein is given by gHF/(2.3RT) and (gH + i = 1 3 g i H )F/(2.3RT), respectively.
Energy (meV)
Heme IHeme IIIHeme IVRedox-Bohr Center
Heme I−154 (5)27 (2)16 (3)−32 (4)
Heme III −138 (5)41 (3)−31 (4)
Heme IV −125 (5)−58 (4)
Redox-Bohr center 495 (8)
Table 3. Comparison of the thermodynamic properties of PpcA mutants at pH 7.5. The microscopic reduction potential values shown were calculated using the parameters listed in Table 2.
Proteineapp (mV)Order of Heme OxidationElectron Transfer Pathway
Heme IHeme IIIHeme IV
PpcA−152−108−126I-IV-IIIP0HP1HP14P134
F15L−155−146−125I-III-IVNo preferential pathway
M58D−160−139−140I-(III,IV)No preferential pathway
M58K−159−91−146I-IV-IIIP0HP14P134
M58S−159−110−139I-IV-IIIP0HP1HP14P134
K43E−165−117−180IV-I-IIIP0HP14P134
K43Q−162−117−150I-IV-IIIP0HP1HP14P134
K52E−156−116−177IV-I-IIIP0HP14P134
K52Q−157−111−175IV-I-IIIP0HP14P134
K60E−145−146−119(III,I)-IVNo preferential pathway
K60Q−161−143−134I-III-IVNo preferential pathway
Publisher’s Note: MDPI stays neutral with regard to jurisdictional claims in published maps and institutional affiliations.