
Recovery of Added-Value Compounds from Orange and Spinach Processing Residues: Green Extraction of Phenolic Compounds and Evaluation of Antioxidant Activity

 ,
,  ,
,  ,
,  , , and
Abstract
:1. Introduction
2. Materials and Methods
2.1. Reagents and Solvents
2.2. Fruit and Vegetable Samples
2.3. Instruments and Lab Equipment
2.4. Extraction of Phenolic Compounds
2.4.1. Mechanical Stirring Extraction (MSE)
2.4.2. Ultrasound-Assisted Extraction (UAE)
2.5. Antioxidant Activity Evaluation
2.5.1. DPPH
2.5.2. FRAP
2.5.3. ABTS
2.5.4. FC Assay
2.6. Polyphenolic Content Determination by HPLC-DAD
2.7. Design of Experiments (DoE)
3. Results and Discussion
3.1. Optimization of Phenolic Compounds Extraction from Orange and Spinach Wastes
3.1.1. Effect of Temperature and Contact Time on TPC
3.1.2. Effect of Solid/Solvent Ratio on TPC
3.1.3. Effect of pH on TPC
3.2. Total Phenolic Content and Antioxidant Activity of Orange and Spinach Wastes
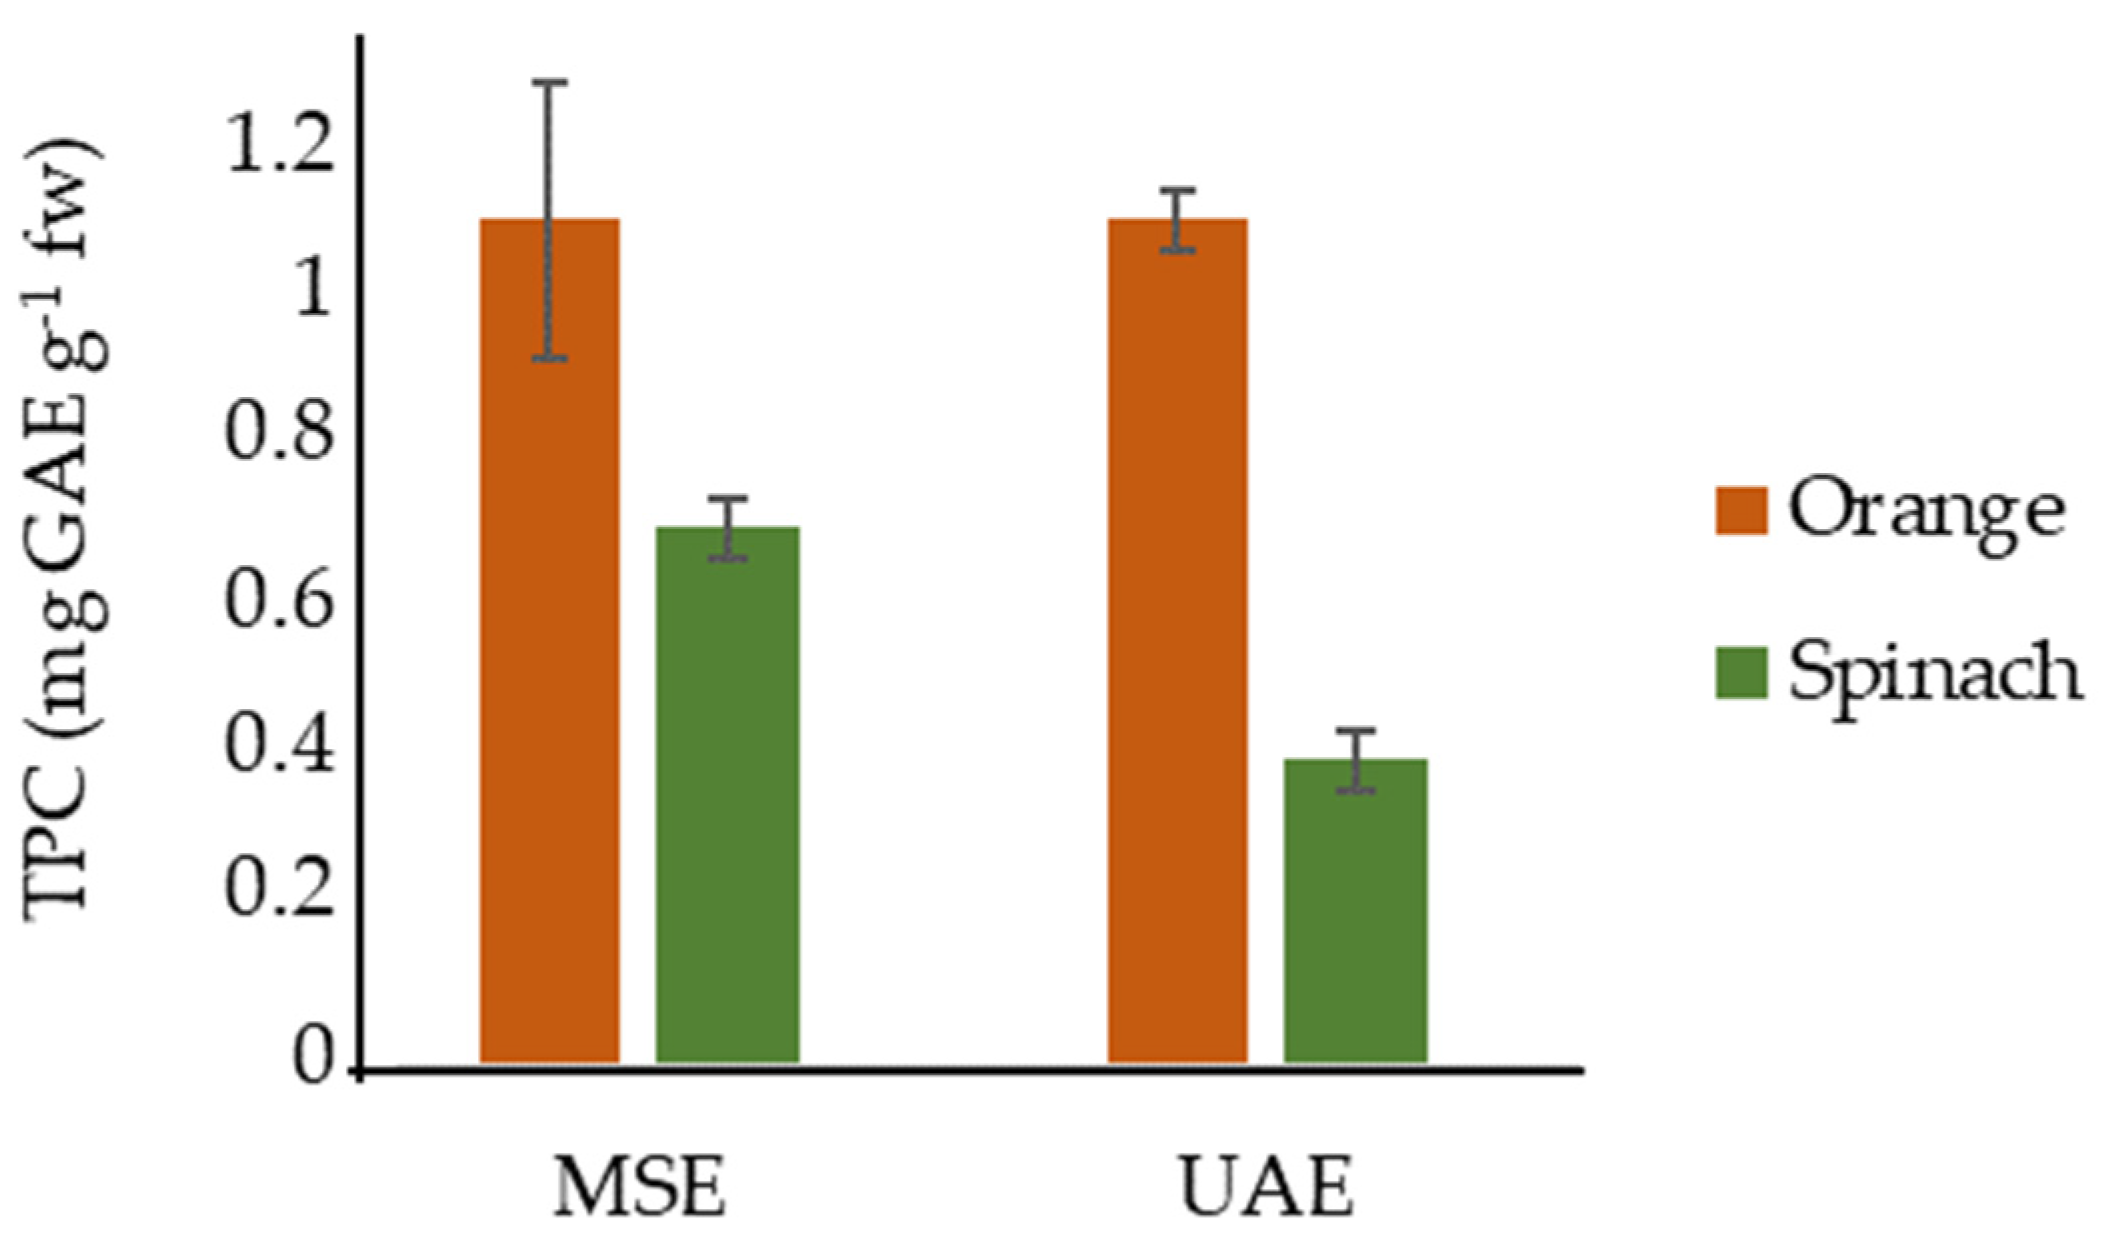
The Total Phenolic Content: MSE vs. UAE
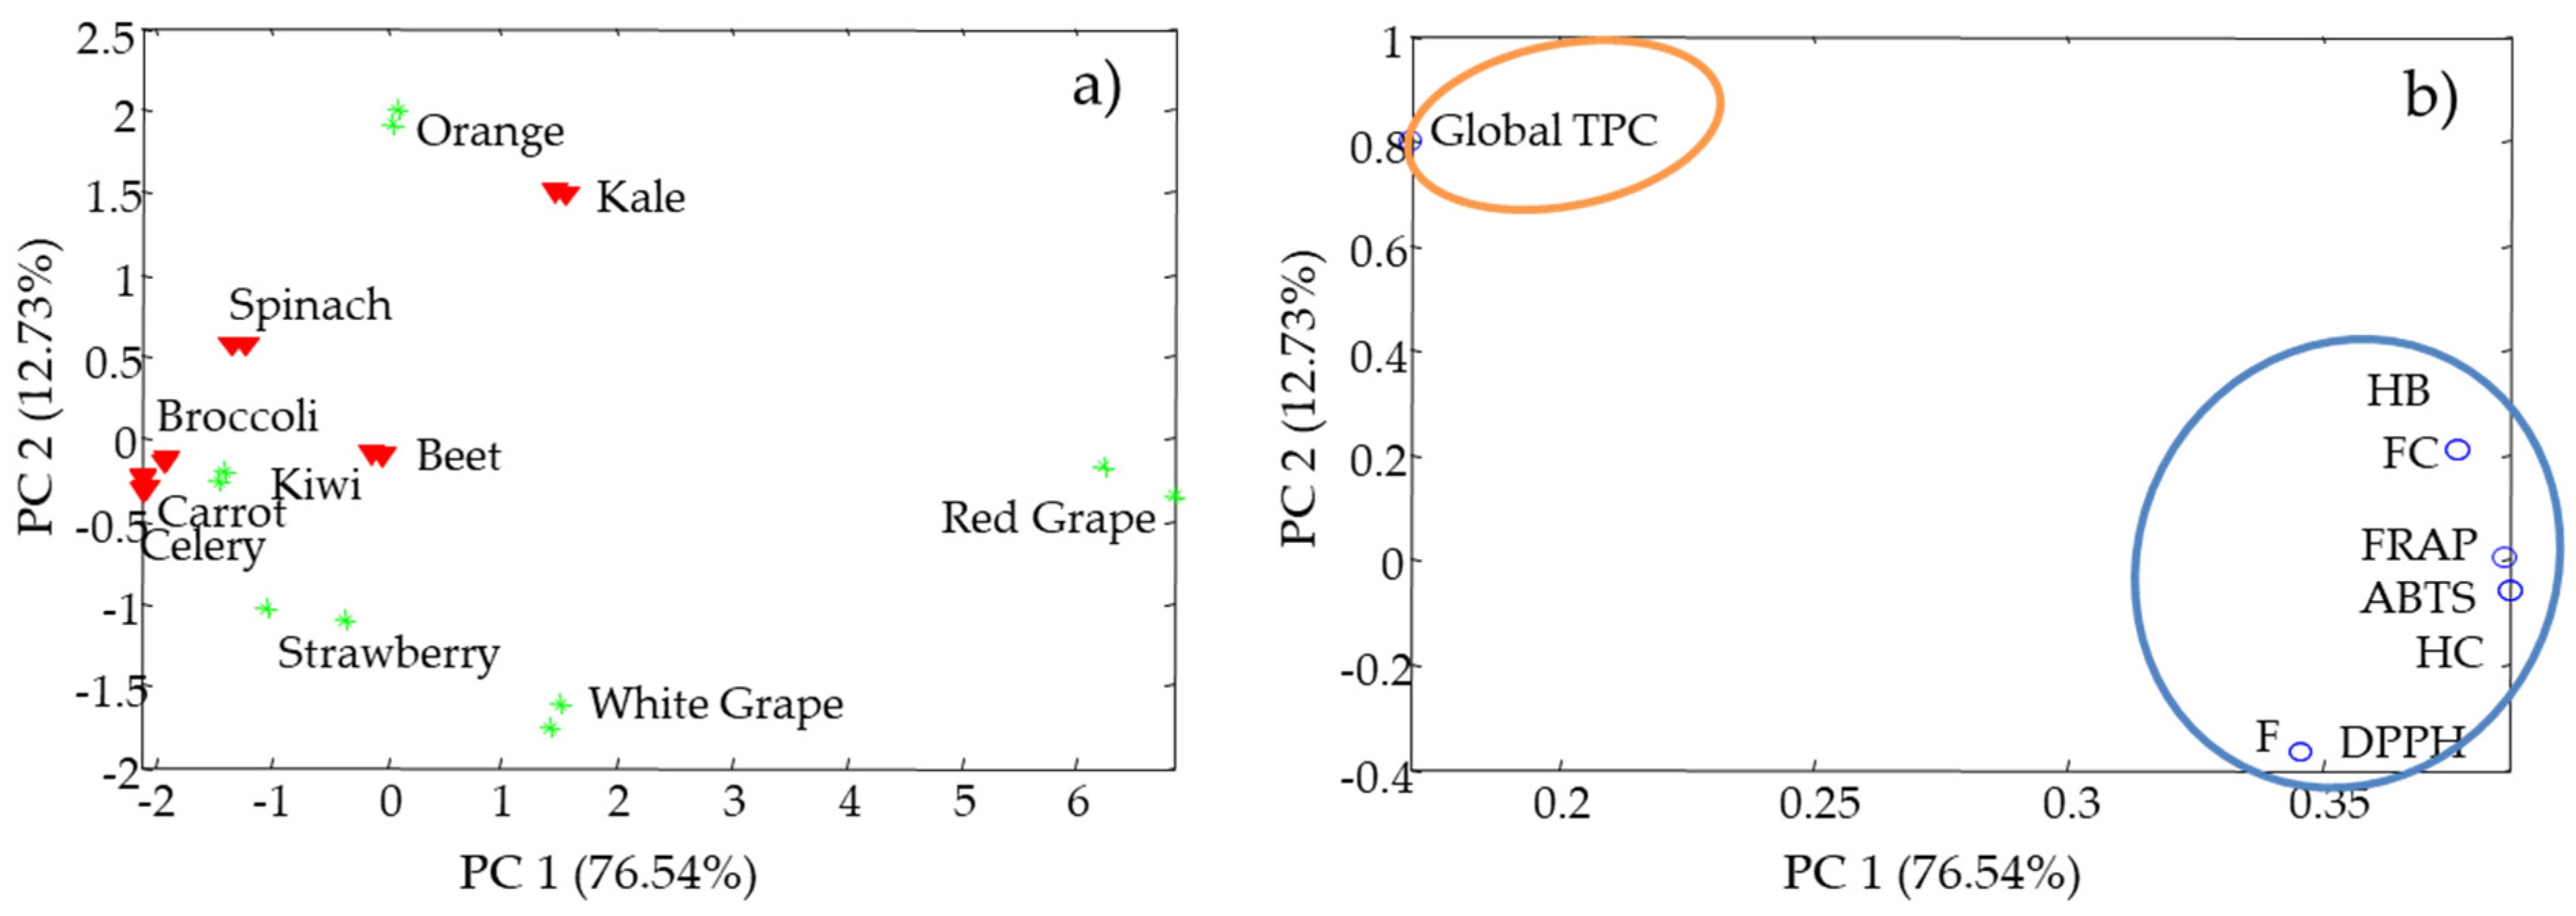
3.3. Characterization of Antioxidant Activity of Fruit and Vegetable By-Products Extracts
3.4. Characterization of the Phenolic Composition from Orange and Spinach Wastes
4. Conclusions
Supplementary Materials
Author Contributions
Funding
Institutional Review Board Statement
Informed Consent Statement
Data Availability Statement
Acknowledgments
Conflicts of Interest
References
- Hussain, P.R.; Suradkar, P.; Javaid, S.; Akram, H.; Parvez, S. Influence of Postharvest Gamma Irradiation Treatment on the Content of Bioactive Compounds and Antioxidant Activity of Fenugreek (Trigonella foenum-graceum L.) and Spinach (Spinacia oleracea L.) Leaves. Innov. Food Sci. Emerg. Technol. 2016, 33, 268–281. [Google Scholar] [CrossRef]
- De Ancos, B.; Cilla, A.; Barberá, R.; Sánchez-Moreno, C.; Cano, M.P. Influence of Orange Cultivar and Mandarin Postharvest Storage on Polyphenols, Ascorbic Acid and Antioxidant Activity during Gastrointestinal Digestion. Food Chem. 2017, 225, 114–124. [Google Scholar] [CrossRef] [Green Version]
- Ozturk, B.; Parkinson, C.; Gonzalez-Miquel, M. Extraction of Polyphenolic Antioxidants from Orange Peel Waste Using Deep Eutectic Solvents. Sep. Purif. Technol. 2018, 206, 1–13. [Google Scholar] [CrossRef]
- Zhao, C.F.; Li, S.; Li, S.J.; Song, G.H.; Yu, L.J.; Zhang, H. Extraction Optimization Approach to Improve Accessibility of Functional Fraction Based on Combination of Total Polyphenol, Chromatographic Profiling and Antioxidant Activity Evaluation: Pyracantha Fortuneana Fruit as an Example. J. Funct. Foods 2013, 5, 715–728. [Google Scholar] [CrossRef]
- Montenegro-Landívar, M.F.; Tapia-Quirós, P.; Vecino, X.; Reig, M.; Valderrama, C.; Granados, M.; Cortina, J.L.; Saurina, J. Polyphenols and Their Potential Role to Fight Viral Diseases: An Overview. Sci. Total Environ. 2021, 801, 149719. [Google Scholar] [CrossRef]
- Jovanović, A.A.; Đorđević, V.B.; Zdunić, G.M.; Pljevljakušić, D.S.; Šavikin, K.P.; Gođevac, D.M.; Bugarski, B.M. Optimization of the Extraction Process of Polyphenols from Thymus serpyllum L. Herb Using Maceration, Heat- and Ultrasound-Assisted Techniques. Sep. Purif. Technol. 2017, 179, 369–380. [Google Scholar] [CrossRef] [Green Version]
- Elfalleh, W. Total Phenolic Contents and Antioxidant Activities of Pomegranate Peel, Seed, Leaf and Flower. J. Med. Plants Res. 2012, 6, 4724–4730. [Google Scholar] [CrossRef]
- Derrien, M.; Badr, A.; Gosselin, A.; Desjardins, Y.; Angers, P. Optimization of a Green Process for the Extraction of Lutein and Chlorophyll from Spinach By-Products Using Response Surface Methodology (RSM). LWT—Food Sci. Technol. 2017, 79, 170–177. [Google Scholar] [CrossRef]
- Radojković, M.; Moreira, M.M.; Soares, C.; Fátima Barroso, M.; Cvetanović, A.; Švarc-Gajić, J.; Morais, S.; Delerue-Matos, C. Microwave-Assisted Extraction of Phenolic Compounds from Morus Nigra Leaves: Optimization and Characterization of the Antioxidant Activity and Phenolic Composition. J. Chem. Technol. Biotechnol. 2018, 93, 1684–1693. [Google Scholar] [CrossRef] [Green Version]
- Vázquez, E.; García-Risco, M.R.; Jaime, L.; Reglero, G.; Fornari, T. Simultaneous Extraction of Rosemary and Spinach Leaves and Its Effect on the Antioxidant Activity of Products. J. Supercrit. Fluids 2013, 82, 138–145. [Google Scholar] [CrossRef] [Green Version]
- Baenas, N.; Abellán, Á.; Rivera, S.; Moreno, D.A.; García-Viguera, C.; Domínguez-Perles, R. Foods and Supplements; Elsevier: Amsterdam, The Netherlands, 2018; ISBN 9780128135723. [Google Scholar]
- Boukroufa, M.; Boutekedjiret, C.; Petigny, L.; Rakotomanomana, N.; Chemat, F. Bio-Refinery of Orange Peels Waste: A New Concept Based on Integrated Green and Solvent Free Extraction Processes Using Ultrasound and Microwave Techniques to Obtain Essential Oil, Polyphenols and Pectin. Ultrason. Sonochem. 2015, 24, 72–79. [Google Scholar] [CrossRef]
- Ak, T.; Gülçin, I. Antioxidant and Radical Scavenging Properties of Curcumin. Chem. Biol. Interact. 2008, 174, 27–37. [Google Scholar] [CrossRef]
- Cassano, A.; De Luca, G.; Conidi, C.; Drioli, E. Effect of Polyphenols-Membrane Interactions on the Performance of Membrane-Based Processes. A Review. Coord. Chem. Rev. 2017, 351, 45–75. [Google Scholar] [CrossRef]
- Montenegro-Landívar, M.F.; Tapia-Quirós, P.; Vecino, X.; Reig, M.; Valderrama, C.; Granados, M.; Cortina, J.L.; Saurina, J. Fruit and Vegetable Processing Wastes as Natural Sources of Antioxidant-Rich Extracts: Evaluation of Advanced Extraction Technologies by Surface Response Methodology. J. Environ. Chem. Eng. 2021. [Google Scholar] [CrossRef]
- Al-Juhaimi, F.Y. Citrus Fruits By-Products as Sources of Bioactive Compounds with Antioxidant Potential. Pak. J. Bot. 2014, 46, 1459–1462. [Google Scholar]
- Altemimi, A.; Choudhary, R.; Watson, D.G.; Lightfoot, D.A. Effects of Ultrasonic Treatments on the Polyphenol and Antioxidant Content of Spinach Extracts. Ultrason. Sonochem. 2015, 24, 247–255. [Google Scholar] [CrossRef] [PubMed] [Green Version]
- Oboh, G.; Ademosun, A.O. Characterization of the Antioxidant Properties of Phenolic Extracts from Some Citrus Peels. J. Food Sci. Technol. 2012, 49, 729–736. [Google Scholar] [CrossRef] [Green Version]
- Osorio-Tobón, J.F. Recent Advances and Comparisons of Conventional and Alternative Extraction Techniques of Phenolic Compounds. J. Food Sci. Technol. 2020, 57, 4299–4315. [Google Scholar] [CrossRef] [PubMed]
- Curran, T.P.; Barros, L.; Ferreira, I.C.F.R. Fruits Using Maceration/Microwave/Ultrasound Extraction Techniques. Ind. Crops Prod. 2016. [Google Scholar] [CrossRef] [Green Version]
- Cai, Z.; Qu, Z.; Lan, Y.; Zhao, S.; Ma, X.; Wan, Q.; Jing, P.; Li, P. Conventional, Ultrasound-Assisted, and Accelerated-Solvent Extractions of Anthocyanins from Purple Sweet Potatoes. Food Chem. 2016, 197, 266–272. [Google Scholar] [CrossRef] [PubMed]
- Azmir, J.; Zaidul, I.S.M.; Rahman, M.M.; Sharif, K.M.; Mohamed, A.; Sahena, F.; Jahurul, M.H.A.; Ghafoor, K.; Norulaini, N.A.N.; Omar, A.K.M. Techniques for Extraction of Bioactive Compounds from Plant Materials: A Review. J. Food Eng. 2013, 117, 426–436. [Google Scholar] [CrossRef]
- Papoutsis, K.; Pristijono, P.; Golding, J.B.; Stathopoulos, C.E.; Scarlett, C.J.; Bowyer, M.C.; Vuong, Q. Van Impact of Different Solvents on the Recovery of Bioactive Compounds and Antioxidant Properties from Lemon (Citrus limon L.) Pomace Waste. Food Sci. Biotechnol. 2016, 25, 971–977. [Google Scholar] [CrossRef] [PubMed]
- Safdar, M.N.; Kausar, T.; Jabbar, S.; Mumtaz, A.; Ahad, K.; Saddozai, A.A. Extraction and Quantification of Polyphenols from Kinnow (Citrus reticulate L.) Peel Using Ultrasound and Maceration Techniques. J. Food Drug Anal. 2017, 25, 488–500. [Google Scholar] [CrossRef] [Green Version]
- Kumar, M.; Dahuja, A.; Tiwari, S.; Punia, S.; Tak, Y.; Amarowicz, R.; Bhoite, A.G.; Singh, S.; Joshi, S.; Panesar, P.S.; et al. Recent Trends in Extraction of Plant Bioactives Using Green Technologies: A Review. Food Chem. 2021, 353, 129431. [Google Scholar] [CrossRef]
- Gómez-Mejía, E.; Rosales-Conrado, N.; León-González, M.E.; Madrid, Y. Citrus Peels Waste as a Source of Value-Added Compounds: Extraction and Quantification of Bioactive Polyphenols. Food Chem. 2019, 295, 289–299. [Google Scholar] [CrossRef] [PubMed]
- Das, P.R.; Eun, J.B. A Comparative Study of Ultra-Sonication and Agitation Extraction Techniques on Bioactive Metabolites of Green Tea Extract. Food Chem. 2018, 253, 22–29. [Google Scholar] [CrossRef]
- Alcalde, B.; Granados, M.; Saurina, J. Exploring the Antioxidant Features of Polyphenols by Spectroscopic and Electrochemical Methods. Antioxidants 2019, 8, 523. [Google Scholar] [CrossRef] [PubMed] [Green Version]
- Jaime, L.; Vázquez, E.; Fornari, T.; del Carmen López-Hazas, M.; García-Risco, M.R.; Santoyo, S.; Reglero, G. Extraction of Functional Ingredients from Spinach (Spinacia oleracea L.) Using Liquid Solvent and Supercritical CO2 extraction. J. Sci. Food Agric. 2015, 95, 722–729. [Google Scholar] [CrossRef] [Green Version]
- Dzah, C.S.; Duan, Y.; Zhang, H.; Wen, C.; Zhang, J.; Chen, G.; Ma, H. The effects of ultrasound assisted extraction on yield, antioxidant, anticancer and antimicrobial activity of polyphenol extracts: A review. Food Biosci. 2020, 35, 100547. [Google Scholar] [CrossRef]
- Prakash Maran, J.; Manikandan, S.; Vigna Nivetha, C.; Dinesh, R. Ultrasound assisted extraction of bioactive compounds from Nephelium lappaceum L. fruit peel using central composite face centered response surface design. Arab. J. Chem. 2017, 10, S1145–S1157. [Google Scholar] [CrossRef] [Green Version]
- Tapia-Quirós, P.; Montenegro-Landívar, M.F.; Reig, M.; Vecino, X.; Alvarino, T.; Cortina, J.L.; Saurina, J.; Granados, M. Olive Mill and Winery Wastes as Viable Sources of Bioactive Compounds: A Study on Polyphenols Recovery. Antioxidants 2020, 9, 1074. [Google Scholar] [CrossRef]
- Zuorro, A.; Maffei, G.; Lavecchia, R. Reuse potential of artichoke (Cynara scolimus L.) waste for the recovery of phenolic compounds and bioenergy. J. Clean. Prod. 2016, 111, 279–284. [Google Scholar] [CrossRef]
- Bokov, D.O.; Sidorova, Y.S.; Mazo, V.K.; Bessonov, V.V. Prospects for the Use of Spinach (Spinacia oleracea L.) Containing Phytoecdysteroids and Polyphenols. Pharmacogn. J. 2020, 12, 246–250. [Google Scholar] [CrossRef] [Green Version]
- Fu, Z.F.; Tu, Z.C.; Zhang, L.; Wang, H.; Wen, Q.H.; Huang, T. Antioxidant activities and polyphenols of sweet potato (Ipomoea batatas L.) leaves extracted with solvents of various polarities. Food Biosci. 2016, 15, 11–18. [Google Scholar] [CrossRef]
- Li, X.; Huang, J.; Wang, Z.; Jiang, X.; Yu, W.; Zheng, Y.; Li, Q.; He, N. Alkaline extraction and acid precipitation of phenolic compounds from longan (Dimocarpus longan L.) seeds. Sep. Purif. Technol. 2014, 124, 201–206. [Google Scholar] [CrossRef]
- Li, X.; Yuan, J.P.; Xu, S.P.; Wang, J.H.; Liu, X. Separation and determination of secoisolariciresinol diglucoside oligomers and their hydrolysates in the flaxseed extract by high-performance liquid chromatography. J. Chromatogr. A 2008, 1185, 223–232. [Google Scholar] [CrossRef]
- Dahmoune, F.; Boulekbache, L.; Moussi, K.; Aoun, O.; Spigno, G.; Madani, K. Valorization of Citrus limon residues for the recovery of antioxidants: Evaluation and optimization of microwave and ultrasound application to solvent extraction. Ind. Crops Prod. 2013, 50, 77–87. [Google Scholar] [CrossRef]
- Senit, J.J.; Velasco, D.; Gomez Manrique, A.; Sanchez-Barba, M.; Toledo, J.M.; Santos, V.E.; Garcia-Ochoa, F.; Yustos, P.; Ladero, M. Orange peel waste upstream integrated processing to terpenes, phenolics, pectin and monosaccharides: Optimization approaches. Ind. Crops Prod. 2019, 134, 370–381. [Google Scholar] [CrossRef]
- Papillo, V.A.; Locatelli, M.; Travaglia, F.; Bordiga, M.; Garino, C.; Coïsson, J.D.; Arlorio, M. Cocoa hulls polyphenols stabilized by microencapsulation as functional ingredient for bakery applications. Food Res. Int. 2018. [Google Scholar] [CrossRef]
- Ajila, C.M.; Prasada Rao, U.J.S. Mango peel dietary fibre: Composition and associated bound phenolics. J. Funct. Foods 2013, 5, 444–450. [Google Scholar] [CrossRef]


| Series I | ||||
|---|---|---|---|---|
| Temperature (°C) | Time (min) | Solid/solvent ratio (w/v) | pH | TPC (mg GAE g−1 fw) |
| 25 | 5 | 1:20 | 4 | 0.51 ± 0.08 aA |
| 15 | 0.76 ± 0.05 bA | |||
| 30 | 0.91 ± 0.02 bA | |||
| 50 | 5 | 0.61 ± 0.04 aAB | ||
| 15 | 1.00 ± 0.07 bAB | |||
| 30 | 1.03 ± 0.04 bAB | |||
| 70 | 5 | 0.65 ± 0.07 aBC | ||
| 15 | 1.10 ± 0.20 bBC | |||
| 30 | 1.33 ± 0.09 bBC | |||
| 90 | 5 | 0.94 ± 0.07 aC | ||
| 15 | 1.40 ± 0.10 bC | |||
| 30 | 1.30 ± 0.10 bC | |||
| Series II | ||||
| Temperature (°C) | Time (min) | Solid/solvent ratio (w/v) | pH | TPC (mg GAE g−1 fw) |
| 70 | 15 | 1:10 | 4 | 0.68 ± 0.01 a |
| 1:30 | 0.83 ± 0.02 a | |||
| 1:50 | 0.81 ± 0.04 a | |||
| 1:100 | 0.84 ± 0.06 a | |||
| 1:200 | NQ | |||
| Series III | ||||
| Temperature (°C) | Time (min) | Solid/solvent ratio (w/v) | pH | TPC (mg GAE g−1 fw) |
| 70 | 15 | 1:100 | 3 | 0.94 ± 0.02 a |
| 4 | 1.02 ± 0.09 a | |||
| 10 | 0.98 ± 0.04 a |
| Series I | ||||
|---|---|---|---|---|
| Temperature (°C) | Time (min) | Solid/solvent ratio (w/v) | pH | TPC (mg GAE g−1 fw) |
| 25 | 5 | 1:20 | 6 | 0.65 ± 0.02 aAB |
| 15 | 0.58 ± 0.01 abAB | |||
| 30 | 0.47 ± 0.02 bAB | |||
| 50 | 5 | 0.75 ± 0.04 aA | ||
| 15 | 0.58 ± 0.02 abA | |||
| 30 | 0.51 ± 0.01 bA | |||
| 70 | 5 | 0.51 ± 0.03 aB | ||
| 15 | 0.48 ± 0.02 abB | |||
| 30 | 0.46 ± 0.00 bB | |||
| 90 | 5 | 0.40 ± 0.01 aC | ||
| 15 | 0.43 ± 0.01 abC | |||
| 30 | 0.30 ± 0.02 bC | |||
| Series II | ||||
| Temperature (°C) | Time (min) | Solid/solvent ratio (w/v) | pH | TPC (mg GAE g−1 fw) |
| 50 | 5 | 1:10 | 6 | 0.59 ± 0.09 a |
| 1:30 | 0.67 ± 0.07 a | |||
| 1:50 | 0.68 ± 0.04 a | |||
| 1:100 | 0.52 ± 0.04 a | |||
| 1:200 | NQ | |||
| Series III | ||||
| Temperature (°C) | Time (min) | Solid/solvent ratio (w/v) | pH | TPC (mg GAE g−1 fw) |
| 50 | 5 | 1:50 | 3 | 0.19 ± 0.01 a |
| 6 | 0.75 ± 0.01 b | |||
| 10 | 0.48 ± 0.01 c |
| Waste Extracts | DPPH (mg TE g−1 fw) | FRAP (mg TE g−1 fw) | ABTS (mg TE g−1 fw) | FC (mg GAE g−1 fw) |
|---|---|---|---|---|
| Orange | 1.31 ± 0.10 | 2.27 ± 0.25 | 0.36 ± 0.04 | 0.51 ± 0.02 |
| Kiwi | 0.58 ± 0.02 | 0.52 ± 0.02 | 0.28 ± 0.01 | 0.36 ± 0.04 |
| Strawberry | 2.02 ± 0.02 | 0.78 ± 0.01 | 0.40 ± 0.02 | 0.38 ± 0.05 |
| White grape | 3.06 ± 0.05 | 1.97 ± 0.14 | 1.47 ± 0.07 | 0.63 ± 0.11 |
| Red grape | 3.96 ± 0.16 | 8.18 ± 0.28 | 3.37 ± 0.35 | 2.24 ± 0.02 |
| Spinach | 0.70 ± 0.03 | 0.04 ± 0.00 | 0.07 ± 0.04 | 0.47 ± 0.03 |
| Carrot | 0.38 ± 0.01 | 0.09 ± 0.00 | 0.05 ± 0.00 | 0.08 ± 0.01 |
| Kale | 0.85 ± 0.06 | 1.57 ± 0.12 | 1.47 ± 0.03 | 1.63 ± 0.03 |
| Celery | 0.39 ± 0.02 | 0.04 ± 0.00 | 0.04 ± 0.00 | 0.07 ± 0.00 |
| Beet | 0.66 ± 0.01 | 2.28 ± 0.08 | 1.32 ± 0.06 | 0.52 ± 0.01 |
| Broccoli | 0.48 ± 0.00 | 0.07 ± 0.01 | 0.01 ± 0.00 | 0.20 ± 0.02 |
| Polyphenol Family | Structure | Residues | Concentration (mg g−1) |
|---|---|---|---|
| Hydroxybenzoic acids | 4-hydroxybenzoic acid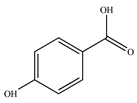 | Orange | 0.71 ± 0.03 |
| Hydroxycinnamic acids | Caffeic acid | Spinach | 0.04 ± 0.01 |
Ferulic acid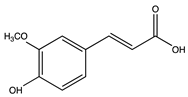 | Spinach | 0.04 ± 0.01 | |
| Flavonoids | Hesperidin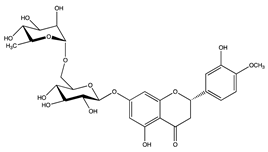 | Orange | 4.86 ± 0.09 |
Rutin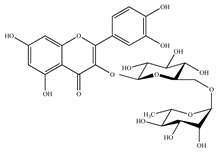 | Spinach | 0.08 ± 0.01 |
Publisher’s Note: MDPI stays neutral with regard to jurisdictional claims in published maps and institutional affiliations. |
© 2021 by the authors. Licensee MDPI, Basel, Switzerland. This article is an open access article distributed under the terms and conditions of the Creative Commons Attribution (CC BY) license (https://creativecommons.org/licenses/by/4.0/).
Share and Cite
Montenegro-Landívar, M.F.; Tapia-Quirós, P.; Vecino, X.; Reig, M.; Valderrama, C.; Granados, M.; Cortina, J.L.; Saurina, J. Recovery of Added-Value Compounds from Orange and Spinach Processing Residues: Green Extraction of Phenolic Compounds and Evaluation of Antioxidant Activity. Antioxidants 2021, 10, 1800. https://doi.org/10.3390/antiox10111800
Montenegro-Landívar MF, Tapia-Quirós P, Vecino X, Reig M, Valderrama C, Granados M, Cortina JL, Saurina J. Recovery of Added-Value Compounds from Orange and Spinach Processing Residues: Green Extraction of Phenolic Compounds and Evaluation of Antioxidant Activity. Antioxidants. 2021; 10(11):1800. https://doi.org/10.3390/antiox10111800
Chicago/Turabian StyleMontenegro-Landívar, María Fernanda, Paulina Tapia-Quirós, Xanel Vecino, Mònica Reig, César Valderrama, Mercè Granados, José Luis Cortina, and Javier Saurina. 2021. "Recovery of Added-Value Compounds from Orange and Spinach Processing Residues: Green Extraction of Phenolic Compounds and Evaluation of Antioxidant Activity" Antioxidants 10, no. 11: 1800. https://doi.org/10.3390/antiox10111800
APA StyleMontenegro-Landívar, M. F., Tapia-Quirós, P., Vecino, X., Reig, M., Valderrama, C., Granados, M., Cortina, J. L., & Saurina, J. (2021). Recovery of Added-Value Compounds from Orange and Spinach Processing Residues: Green Extraction of Phenolic Compounds and Evaluation of Antioxidant Activity. Antioxidants, 10(11), 1800. https://doi.org/10.3390/antiox10111800