Article

EEG Window Length Evaluation for the Detection of Alzheimer’s Disease over Different Brain Regions

by
Katerina D. Tzimourta
1,
Nikolaos Giannakeas
2,
Alexandros T. Tzallas
2,
Loukas G. Astrakas
1,
Theodora Afrantou
3,
Panagiotis Ioannidis
3,
Nikolaos Grigoriadis
3,
Pantelis Angelidis
4,
Dimitrios G. Tsalikakis
4 and
Markos G. Tsipouras
4,*
1
Department of Medical Physics, Medical School, University of Ioannina, GR45110 Ioannina, Greece
2
Department of Informatics and Telecommunications, School of Informatics and Telecommunications, University of Ioannina, GR47100 Arta, Greece
3
2nd Department of Neurology, AHEPA University Hospital, Aristotle University of Thessaloniki, GR54636 Thessaloniki, Greece
4
Department of Informatics and Telecommunications Engineering, University of Western Macedonia, GR50100 Kozani, Greece
*
Author to whom correspondence should be addressed.
Brain Sci. 2019, 9(4), 81; https://doi.org/10.3390/brainsci9040081
Submission received: 8 March 2019 / Revised: 10 April 2019 / Accepted: 10 April 2019 / Published: 14 April 2019
(This article belongs to the Special Issue Collection on Clinical Neuroscience)

Abstract

:
Alzheimer’s Disease (AD) is a neurogenerative disorder and the most common type of dementia with a rapidly increasing world prevalence. In this paper, the ability of several statistical and spectral features to detect AD from electroencephalographic (EEG) recordings is evaluated. For this purpose, clinical EEG recordings from 14 patients with AD (8 with mild AD and 6 with moderate AD) and 10 healthy, age-matched individuals are analyzed. The EEG signals are initially segmented in nonoverlapping epochs of different lengths ranging from 5 s to 12 s. Then, a group of statistical and spectral features calculated for each EEG rhythm (δ, θ, α, β, and γ) are extracted, forming the feature vector that trained and tested a Random Forests classifier. Six classification problems are addressed, including the discrimination from whole-brain dynamics and separately from specific brain regions in order to highlight any alterations of the cortical regions. The results indicated a high accuracy ranging from 88.79% to 96.78% for whole-brain classification. Also, the classification accuracy was higher at the posterior and central regions than at the frontal area and the right side of temporal lobe for all classification problems.

1. Introduction

Alzheimer’s Disease (AD) is neurogenerative disease of unknown etiology with a great prevalence in western countries [1]. Patients with AD are characterized with a loss of memory, sleeping problems, mood disorders, and general confusion, which are caused by structural irregularities or damage in the synaptic connections, due to amyloid-β plaques and neurofibrillary tangles [2]. In a recent Alzheimer’s report of 2018 [3], the worldwide AD prevalence was about 33 million patients out of 50 million people suffering from dementia, making AD the most common type of dementia.
A variety of diagnostics procedures are performed to evaluate the cognitive and neuropsychological state of patients with dementia, including neuronal and physical examination, brain imaging, and electroencephalographic (EEG) recording. The Mini-Mental State Examination (MMSE) [4] and the Clinical Dementia Rating (CDR) [5] score are a 30-point scale and a 5-point scale respectively, which are utilized by neurologists to evaluate the cognitive decline and functional performance of patients with AD. Higher values of the CDR score indicate a more severe condition, whereas higher values of the MMSE score shows very mild dementia and a healthy condition (MMSE above 28).
An analysis of the EEG recordings in AD patients is of significant importance, since information of the brain dynamics may shed light on the exact mechanisms of AD [6]. Research studies in AD over the past 40 years have indicated the alterations in EEG complexity, synchrony, and brain dynamics (the slowing of alpha rhythm and the diffuse dominance of theta or delta rhythm) [7]. Several studies have been proposed aimed at finding a correlation between the MMSE score and EEG features [7,8,9] or discriminating AD patients from patients with other neurological conditions through their EEG findings. In particular, methods have been proposed for the automated discrimination of AD patients from healthy elderly subjects [10,11,12,13,14,15,16], frontotemporal dementia [17], vascular dementia [18], Mild Cognitive Impairment (MCI) [19,20], or even epilepsy [21]. Generally, the EEG activity is analyzed from each electrode site [6,22] or from electrode clusters [7,8,23]. Studies concerning the structural and functional asymmetry have reported that an early onset of AD affects different lobes [24]. Thus, an analysis of the EEG based on electrode clusters that depict different cortical regions may reveal anatomical deficits or differences in the neuronal connection due to other mechanisms [8].
Concerning AD detection from EEG findings, researchers have suggested several different features, which represent EEG complexity, synchrony, and regularity. Relative band power [12,20,25], absolute band power [18], Lempel–Ziv complexity [12,20], Permutation entropy [10,22], Sample entropy [17,22], Spectral entropy [11,15,17,26], Fuzzy entropy [20], automutual information [17], mean frequency [17,27] amplitude modulation [10], central tendency [17], mean [12], variance [12], and zero-crossing [12] are the most frequently extracted EEG features for AD detection. The features are extracted directly from raw EEG segments [10,12,15,19,20] or after a signal decomposition with a Wavelet Analysis [25,27], Power Spectral Density using Berg’s method [28], Hilbert–Huang Transform [10], or Multivariate Multiscale Analysis [11]. Concerning the epoch duration in which the signal is segmented, there is no common agreement regarding the appropriate window length and there is a diversity among research studies [10,11,12,13,14,15,16,17,18,19,20,21,22,24,29]. According to the literature, the EEG window length is usually selected between 5 s to 12 s arbitrarily or based on literature survey.
In this study, a method for automated detection of Alzheimer’s Disease is proposed. EEG recordings from AD patients with moderate and mild AD are analyzed along with the EEG data from healthy, age-matched individuals in epochs of different length (ranging from 5 to 12 s). The features from both the time and frequency domains are extracted, forming the feature vector to train several classifiers. The evaluation of the window length shows that epochs of 12 s with Random Forests indicate the best classification performance for six classification problems and 5 different brain regions of interest. To the best of our knowledge, this is the first comprehensive study examining a variety of features over multiple window lengths and showing a high classification accuracy. The results of the methodology are presented below.
The paper is organized as follows: In Section 2, the methodology and the extracted linear and nonlinear EEG features are addressed. Section 3 presents the obtained results for six classification problems, and Section 4 discusses the obtained results compared to literature findings. Finally, in Section 5, the conclusion and the future directions of this study are presented.

2. Materials and Methods

The proposed AD detection method consists of three stages. The EEG signals acquired from 10 healthy individuals and 14 AD patients were initially segmented in nonoverlapping epochs of 8 different lengths. Then, 8 time-based and 30 spectral features were extracted from the EEG segments forming the feature vector. Finally, the resulting feature vector was used as input to train a Random Forests classifier.

2.1. Data Acquisition

The EEG signals used in the methodology were obtained from 24 subjects: 14 patients with AD and 10 age-matched, healthy individuals that formed the group “controls”. The evaluation of AD severity was performed with the international MMSE score and the CDR by an experienced neurologist. Thus, 8 out of 14 patients suffered from mild AD (MMSE scores 19–23), whereas 6 patients suffered from moderate AD (MMSE scores 10–18). Table 1 presents the demographic characteristics of the participants in the study in terms of the median value and IQR (Q1–Q3) range. A pairwise statistical significance analysis between the three groups (controls, mild AD, and moderate AD) was performed concerning age and the MMSE score. Thus, a Welch ANOVA (p-value = 0.124, F(2,21) = 2.473) was performed in order to show that there was not statistically significant difference between the 3 groups with respect to age. Also, concerning the MMSE score that was not normally distributed, a nonparametric Kruskal–Wallis test ( χ 2 = 21.913 , p-value < 0.001, with a mean rank MMSE of 19.5 for the controls, 10.5 for mild AD, and 3.5 for moderate AD) was performed, aimed at proving that the groups were significantly different in terms of the MMSE score. The statistical analysis was performed using the IBM SPSS Statistics [29].
The recordings were performed at the 2nd Department of Neurology of AHEPA General Hospital of Thessaloniki with the Nihon Kohden EEG 2100 device. The 19 electrodes (Fp1, Fp2, F7, F3, Fz, F4, F8, T3, C3, Cz, C4, T4, T5, P3, Pz, P4, T6, O1, and O2) were placed on the scalp according to the 10–20 International Reference System, and the 2 electrodes (A1 and A2) were placed on the subject’s earlobes (left and right, respectively) for a skin impedance check. Also, the electrodes were placed around the eyes to capture the electrooculogram (EOG). The recordings were performed with a bipolar anterior-posterior montage and referential (Cz) into the routine EEG. Then, the recordings were referenced to the common average value of the scalp EEG channels in the EEGLAB toolbox [30]. The parameters of the amplifier were a sensitivity at 10 μV/mm, a time constant equal to 0.3 s, and a high frequency filter at 70 Hz.
Written consent forms to participate in this study were obtained for all the participating subjects. The participants were asked to sit relaxed in an upright position with their eyes closed. Routine EEG recordings were sampled at 500 Hz, and the duration ranged from 11 to 17 min (13 min on average) for AD patients and from 20 to 23 min (21 min on average) for healthy subjects. In total, 179 min of EEG data from AD patients (116 min from mild AD and 63 min from moderate AD) and 187 min from healthy subjects were recorded.

2.2. Feature Extraction

The Nihon Kohden EEG 2100 device provides information about any possible artifacts during each EEG recording (electromyographic artifacts, blinking, and swallowing), which were marked and removed. The EEG signals are preprocessed using a high-pass FIR (Equiripple) digital filter with a cutoff frequency at 0.5 Hz to remove low frequencies around 0. Furthermore, a Butterworth notch filter was designed at 50 Hz to remove the 50 Hz power line noise interference from the EEG signals. The EEG recordings were filtered to the frequency range 0.5–60 Hz. In Figure 1, a plot of the O1 channel of three different subjects (control, mild AD patient, and moderate AD patient) is presented.
The EEG features were extracted from the filtered EEG segments and for each EEG rhythm. Specifically, the spectral and time-based features were extracted from the EEG segments of different window lengths for the entire spectrum, namely
  • Shannon entropy (ShanEN),
  • Multiscale entropy (MSE),
  • Mean,
  • Variance,
  • Standard deviation (STD),
  • Skewness,
  • Kurtosis, and
  • Interquartile Range (IQR).
Furthermore, the spectral features were calculated for each sub-band of interest, corresponding to the five EEG rhythms (δ, θ, α, β, and γ). Thus, five equiripple FIR filters were initially designed and applied to decompose the EEG segments to the specific sub-bands (0.5–4 Hz, 4–8 Hz, 8–13 Hz,13–30 Hz, and 30–60 Hz). Then, 6 spectral features were calculated for each band of the segment, namely
9.
Energy of the δ, θ, α, β, and γ bands,
10.
Relative band power (RBP) of the δ, θ, α, β, and γ bands,
11.
Approximate entropy (ApEN) of the δ, θ, α, β, and γ bands,
12.
Permutation entropy (PermEN) of the δ, θ, α, β, and γ bands,
13.
Tsallis entropy (TsalEN) of the δ, θ, α, β, and γ bands,
14.
Sample entropy (SamplEN) of the δ, θ, α, β, and γ bands,
The feature vector of 38 features (8 time-based and 6 × 5 spectral features) for each EEG channel (total 19), including the class attribute (thus, 38 × 19 + 1), was used to train a Random Forests [31] classifier. All calculations are implemented in MATLAB environment.

2.3. Classification

In order to find the optimal classification performance, a variety of classifiers (MultiLayer Perceptron, k-Nearest Neighbor, Support Vector Machines, Naïve Bayes, and Decision Trees [32]) were evaluated for whole-brain dynamics. In Table 2, the classification accuracy of the classifiers is presented. The Random Forests obtained the best classification results.
The Random Forests constructed multiple decorrelated decision trees using the bagging method. The decision trees were grown in binary partitioning, utilizing randomly selected features at each node to determine the split. Each decision tree was responsible for its own prediction, and in the end, they voted for the most popular class [31]. In the experiments, 100 decision trees were selected and the 10-fold cross-validation technique was employed.

3. Results

To evaluate the EEG window length and the proposed methodology, 6 classification problems are created. In the first problem, the group of 10 healthy subjects forms the class “controls” (CN), whereas the EEG features of all of the 14 AD patients are merged and forms the class “Alzheimer’s” (AD), resulting in the problem CN/AD. In the second problem (CN/mild/moderate), the AD group is further divided into the “mild” and “moderate” classes, corresponding to the groups of patients with mild AD (8 patients) and moderate AD (6 patients), respectively. The third problem is a 2-class problem between the controls and mild AD patients (CN/mild), whereas the forth problem consists of EEG features of the controls and moderate AD patients (CN/moderate). The fifth problem is a classification between two groups. The first group includes the moderate AD patients, and the second group consists of EEG data from the controls and patients with mild AD (CN-mild/moderate). Finally, the sixth problem corresponds to the classification among mild and moderate AD patients (mild/moderate).
The classifier’s performance is evaluated with Accuracy, Precision, F1-score, and kappa statistics. The accuracy of the classification shows the ability of the classifier to differentiate AD subjects from healthy subjects, healthy subjects from AD stages, and mild AD patients from moderate AD patients. The precision of the classification between AD patients and healthy subjects examines whether the correctly classified instances of AD patients are actual AD patients and whether the rest are healthy subjects incorrectly labeled as AD. On the other hand, the F1-score expresses the average of the precision and recall, wherein the recall shows whether the instances that should have been classified as AD are actually labeled as AD patients. The Kappa statistic evaluates the correctly classified instances and those that have been classified randomly owing to uncertainty [33]. The results for the six classification problems for 8 different window lengths (ranging from 5 to 12 s) are depicted in Table 3. For the 3-class problem (CN/mild/moderate), the average values are presented.
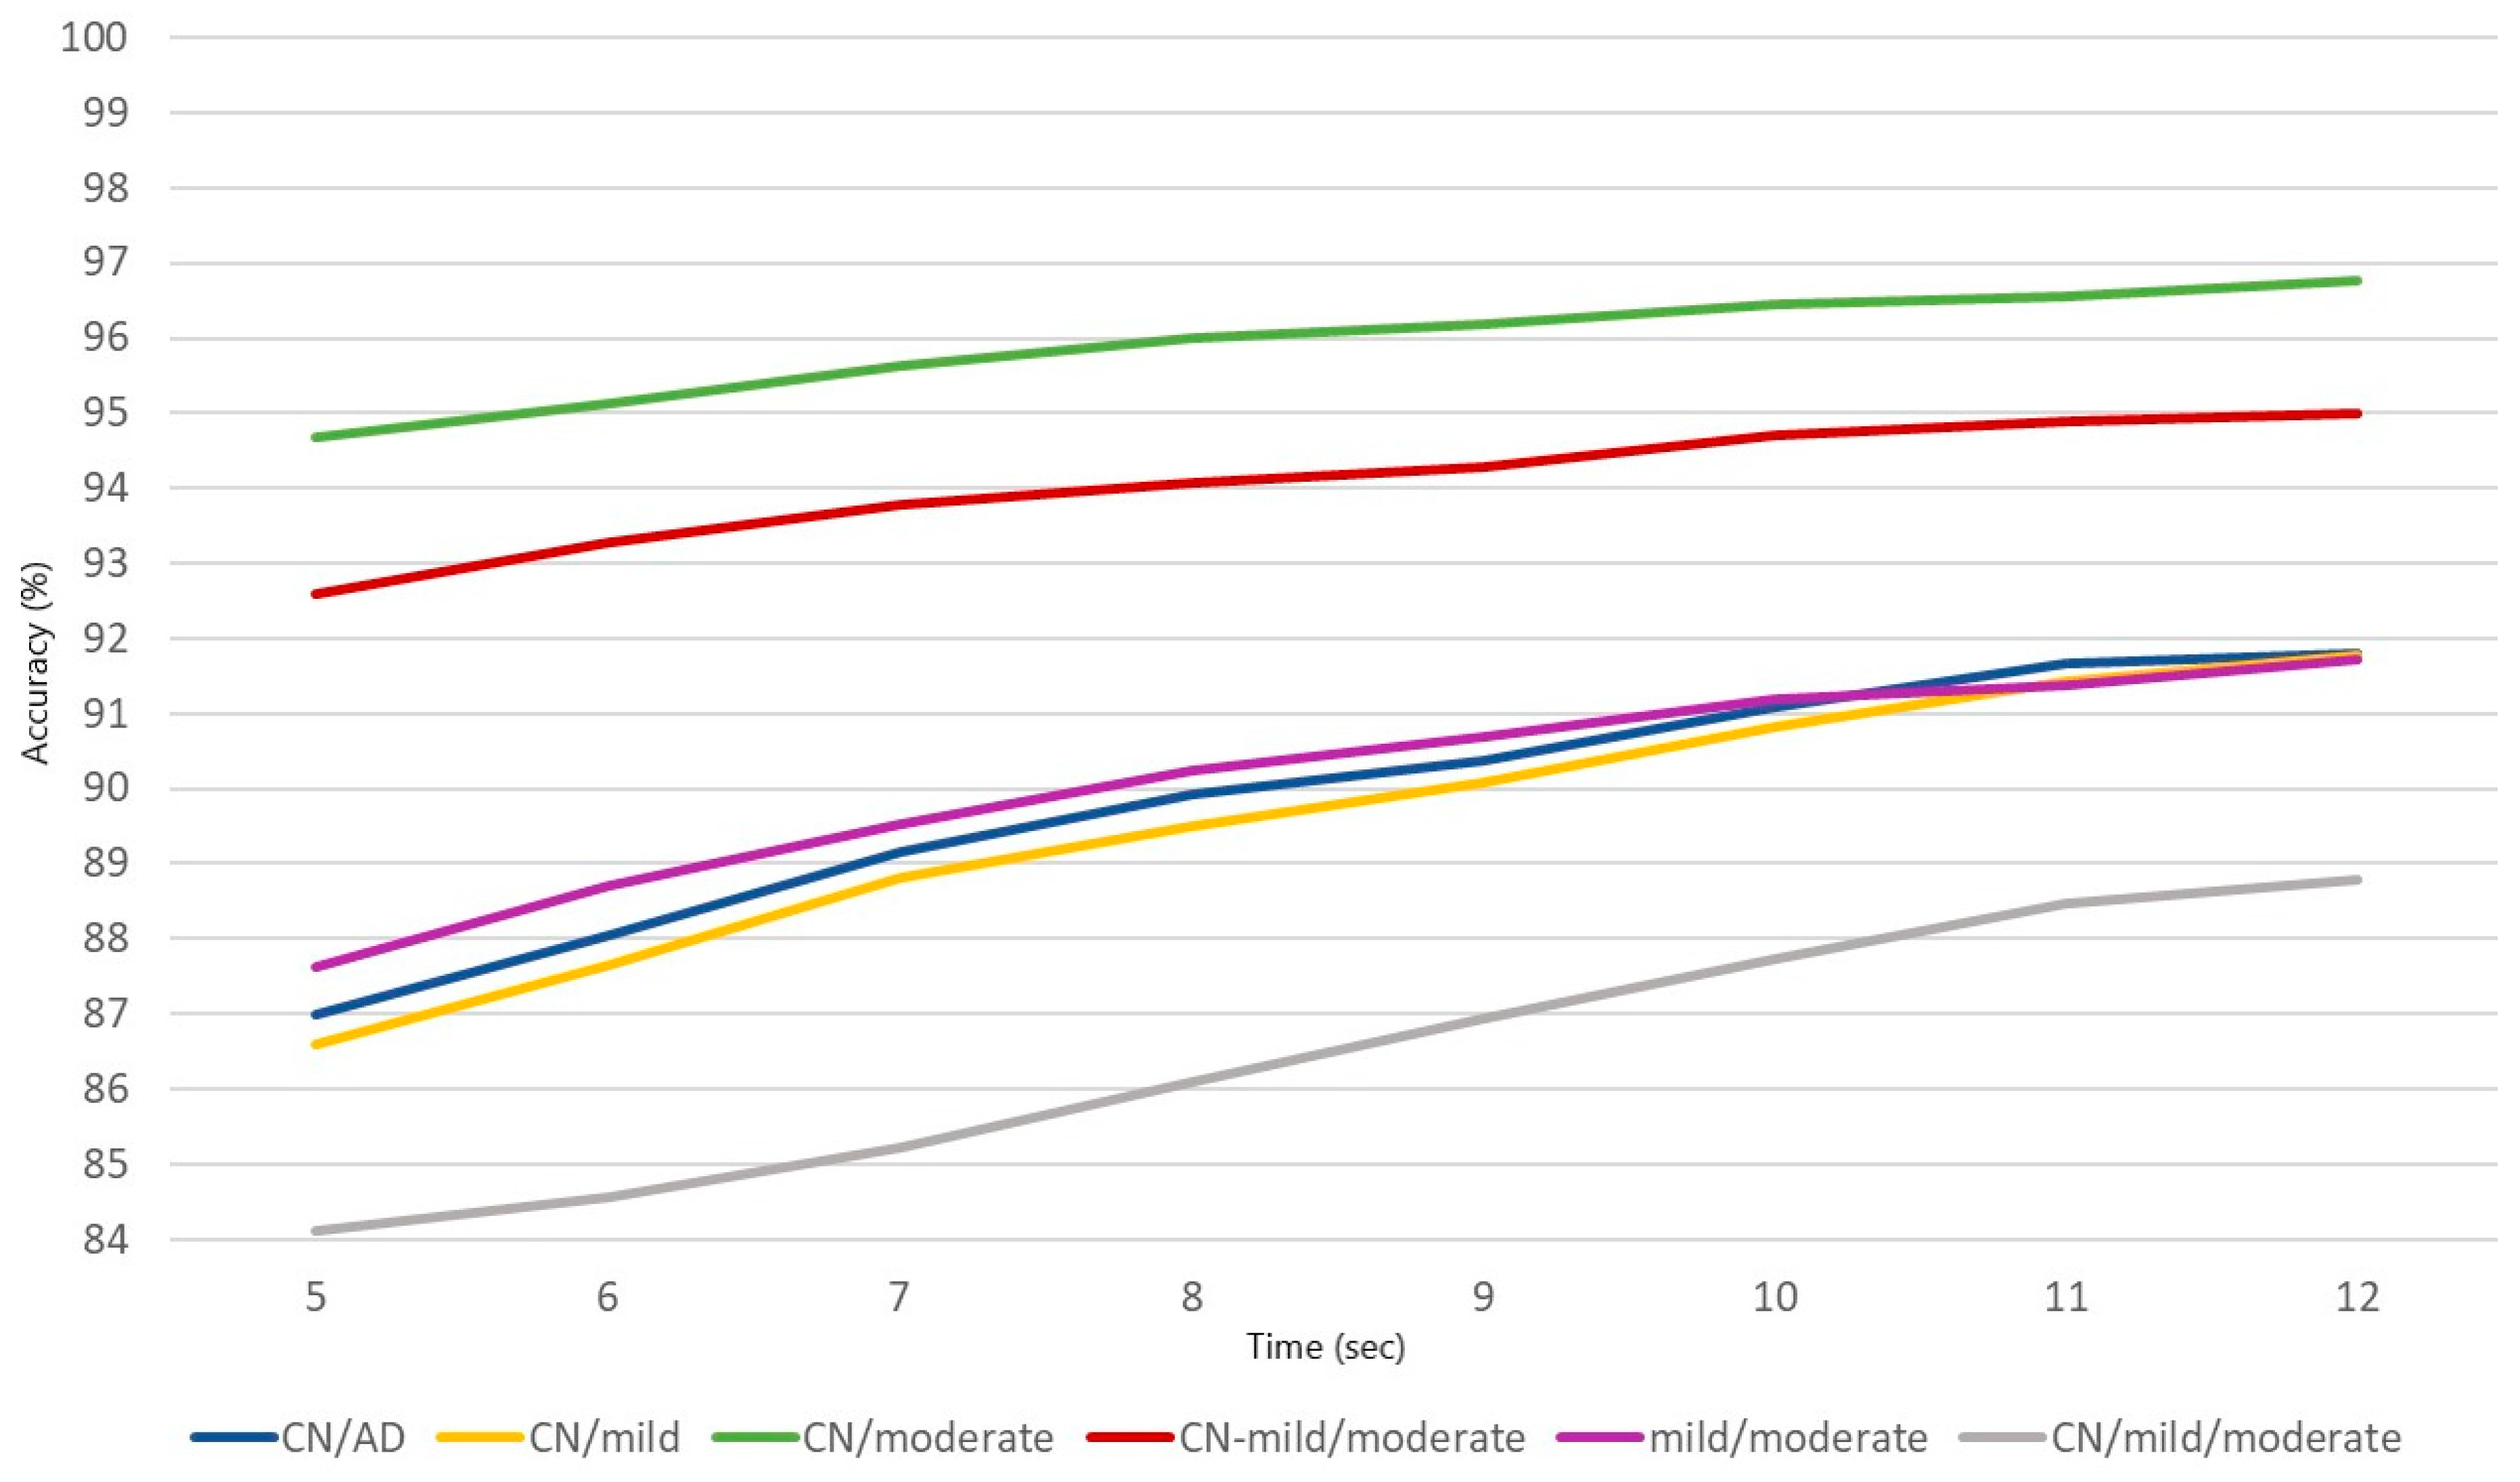
The best window length is 12 s for all classification problems with the classification accuracy ranging from 88.79% to 96.76% for the CN/mild/moderate and CN/moderate problems. The CN-mild/moderate problem indicates the second highest value of accuracy (94.99%), followed by CN/AD (91.80%), CN/mild (91.77%), and mild/moderate (91.71%). On the other hand, the worst classification results are obtained for epochs of 5 s. Likewise, CN/moderate shows the highest accuracy (94.68%), followed by the CN-mild/moderate (92.59%), mild/moderate (87.63%), CN/AD (86.98%), CN/mild (86.60%), and the 3-class problem CN/mild/moderate that succeeded the worst accuracy (82.34%). The classification accuracies for epochs of 6, 7, 8, 9, 10, and 11 s are gradually increased.
In Figure 2, a visualization of the obtained accuracy for each classification problem over different window lengths is presented.
Τhe rest of the analysis is conducted solely for the 12-s window length, which is the best classification window length according to the analysis. Table 4 presents the classification results (Accuracy, Precision, F1-score, and kappa statistics) as obtained for the best window length.
The best classification accuracy (96.76%), which also shows the highest kappa statistic (0.9069) and F1-score = 0.9277, is obtained for the 2-class problem CN/moderate, followed by the CN-mild/moderate (94.99%) with a kappa statistic of 0.8079 and an F1-score = 0.8372 and the CN-AD (91.80%) with a kappa statistic of 0.8340 and an F1-score = 0.9077. The 3-class problem CN-mild-moderate indicates the worse classification accuracy (88.79%) with a kappa of 0.8860 and an F1-score = 0.8474. The discrimination between the controls from mild Alzheimer’s (CN-mild) and between mild AD from moderate AD (mild-moderate) presents almost the same classification accuracy (91.77% and 91.71%, respectively) with the kappa statistics being 0.8132 and 0.8194, respectively, and the F1-scores equal to 0.8739 and 0.8837, respectively.
Furthermore, since the examination of different cortical regions is significant in AD, the electrodes are grouped in 5 groups, as proposed in previous studies [8,9] in order to capture the differences in the brain activities among subject groups in different brain regions. Thus, the 6 classification problems are also examined for epochs of 12 s for the anterior (Fp1, F3, Fz, Fp2, and F4), central (C3, Cz, and C4), left temporal (F7, T3, and T5), right temporal (F8, T4, and T6), and posterior (O1, O2, P3, Pz, and P4) clusters. The results are presented in Table 5. For the 3-class problem (CN/mild/moderate), the average values are presented.
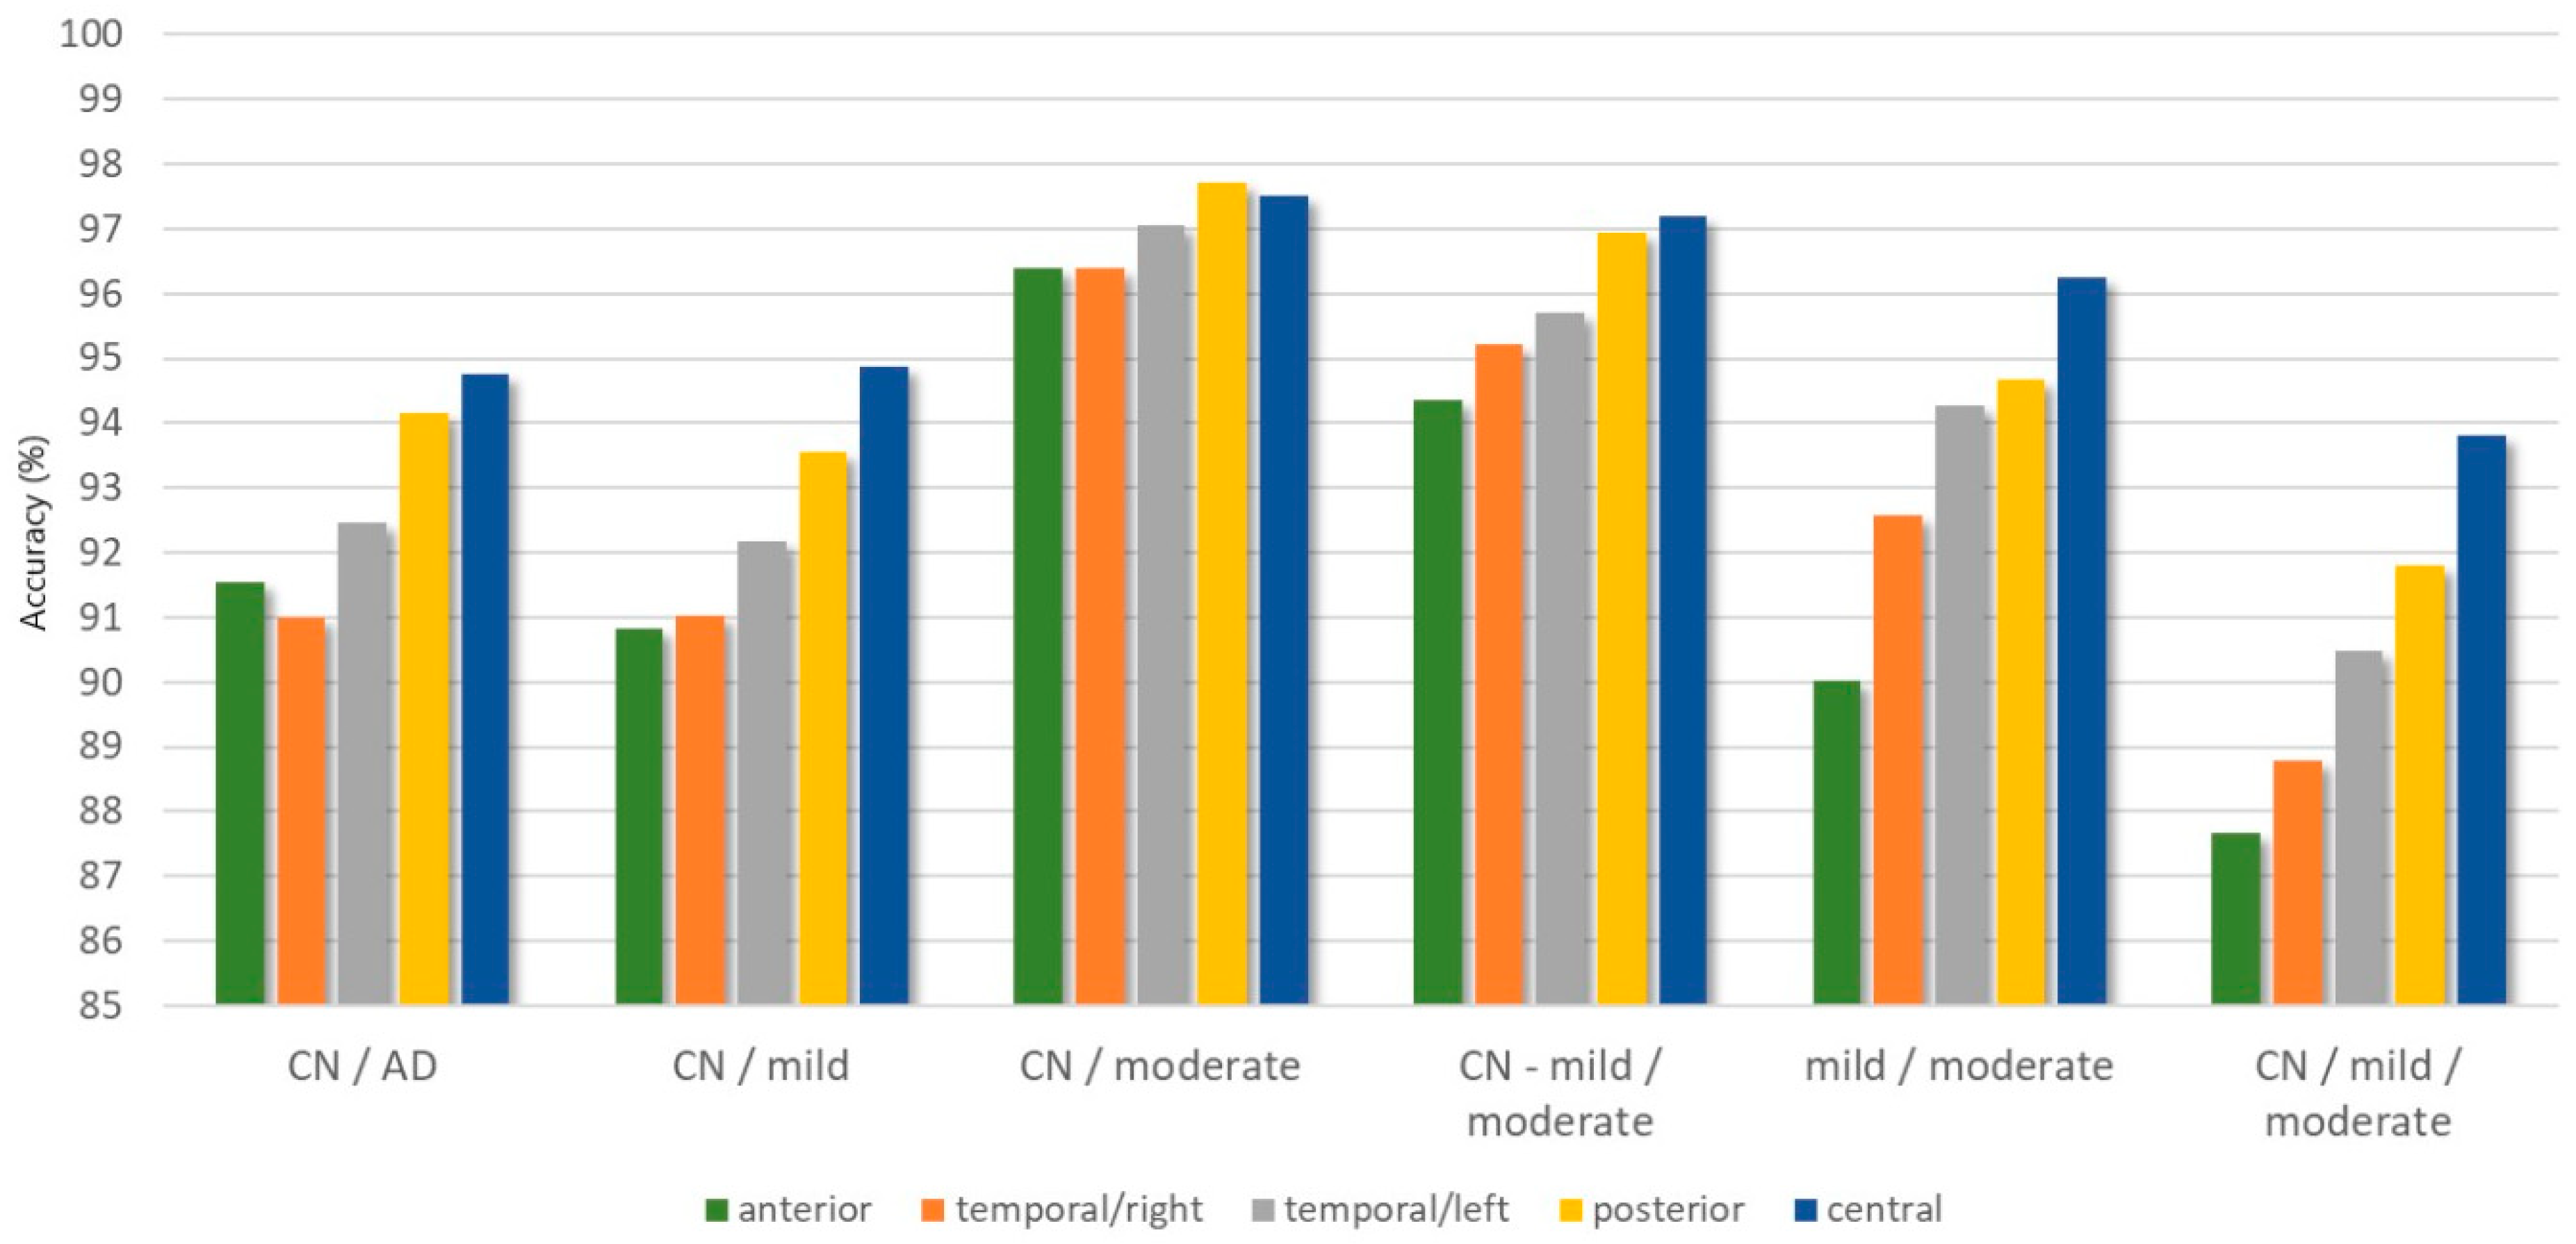
A discrimination among the healthy subjects and Moderate AD patients (CN/moderate) indicates the best classification accuracy for all electrode clusters, ranging from 96.39% to 97.72% with kappa statistics from 0.8957 to 0.9338 and F1-scores from 0.9188 to 0.9469 for the anterior cluster, the right side of the temporal region, the left side of the temporal region, the central region, and the posterior region.
For the 2-class problem “CN-mild/moderate”, the central region shows the best classification results (ACC = 97.19%, kappa = 0.8796, and F1-score = 0.9163), followed by the posterior region (ACC = 96.95%, kappa = 0.8492, and F1-score = 0.9425), the left side of the temporal region (ACC = 95.71%, kappa = 0.8348, and F1-score = 0.8599), the right side of the temporal region (ACC = 95.23%, kappa = 0.8156, and F1-score = 0.9480), and the anterior cluster (ACC = 94.37%, kappa = 0.7833, and F1-score = 0.8161). For the 2-class problem “mild-moderate”, the best classification accuracy is 96.24% (kappa = 0.921 and F1-score = 0.9518) for the central cluster, followed by 94.66% (kappa = 0.8828 and F1-score = 0.9239) for the posterior cluster, 94.28% (kappa = 0.8778 and F1-score = 0.9234) for the temporal/left, 92.57% (kappa = 0.8339 and F1-score = 0.8884) for the temporal/right, and the worse accuracy 90.03% (kappa = 0.7883 and F1-score = 0.8610) for the anterior cluster.
For the classification problem “CN/mild”, the highest accuracy is 94.87% for the central cluster (kappa = 0.8807 and F1-score = 0.9179), followed by 93.55% (kappa = 0.8566 and F1-score = 0.9055) for the posterior cluster, 92.18% (kappa = 0.8186 and F1-score = 0.8754) for the temporal/left, 91.02% (kappa = 0.8065 and F1-score = 0.8769), and 90.84% (kappa = 0.7894 and F1-score = 0.8561) for both the temporal/right and anterior clusters.
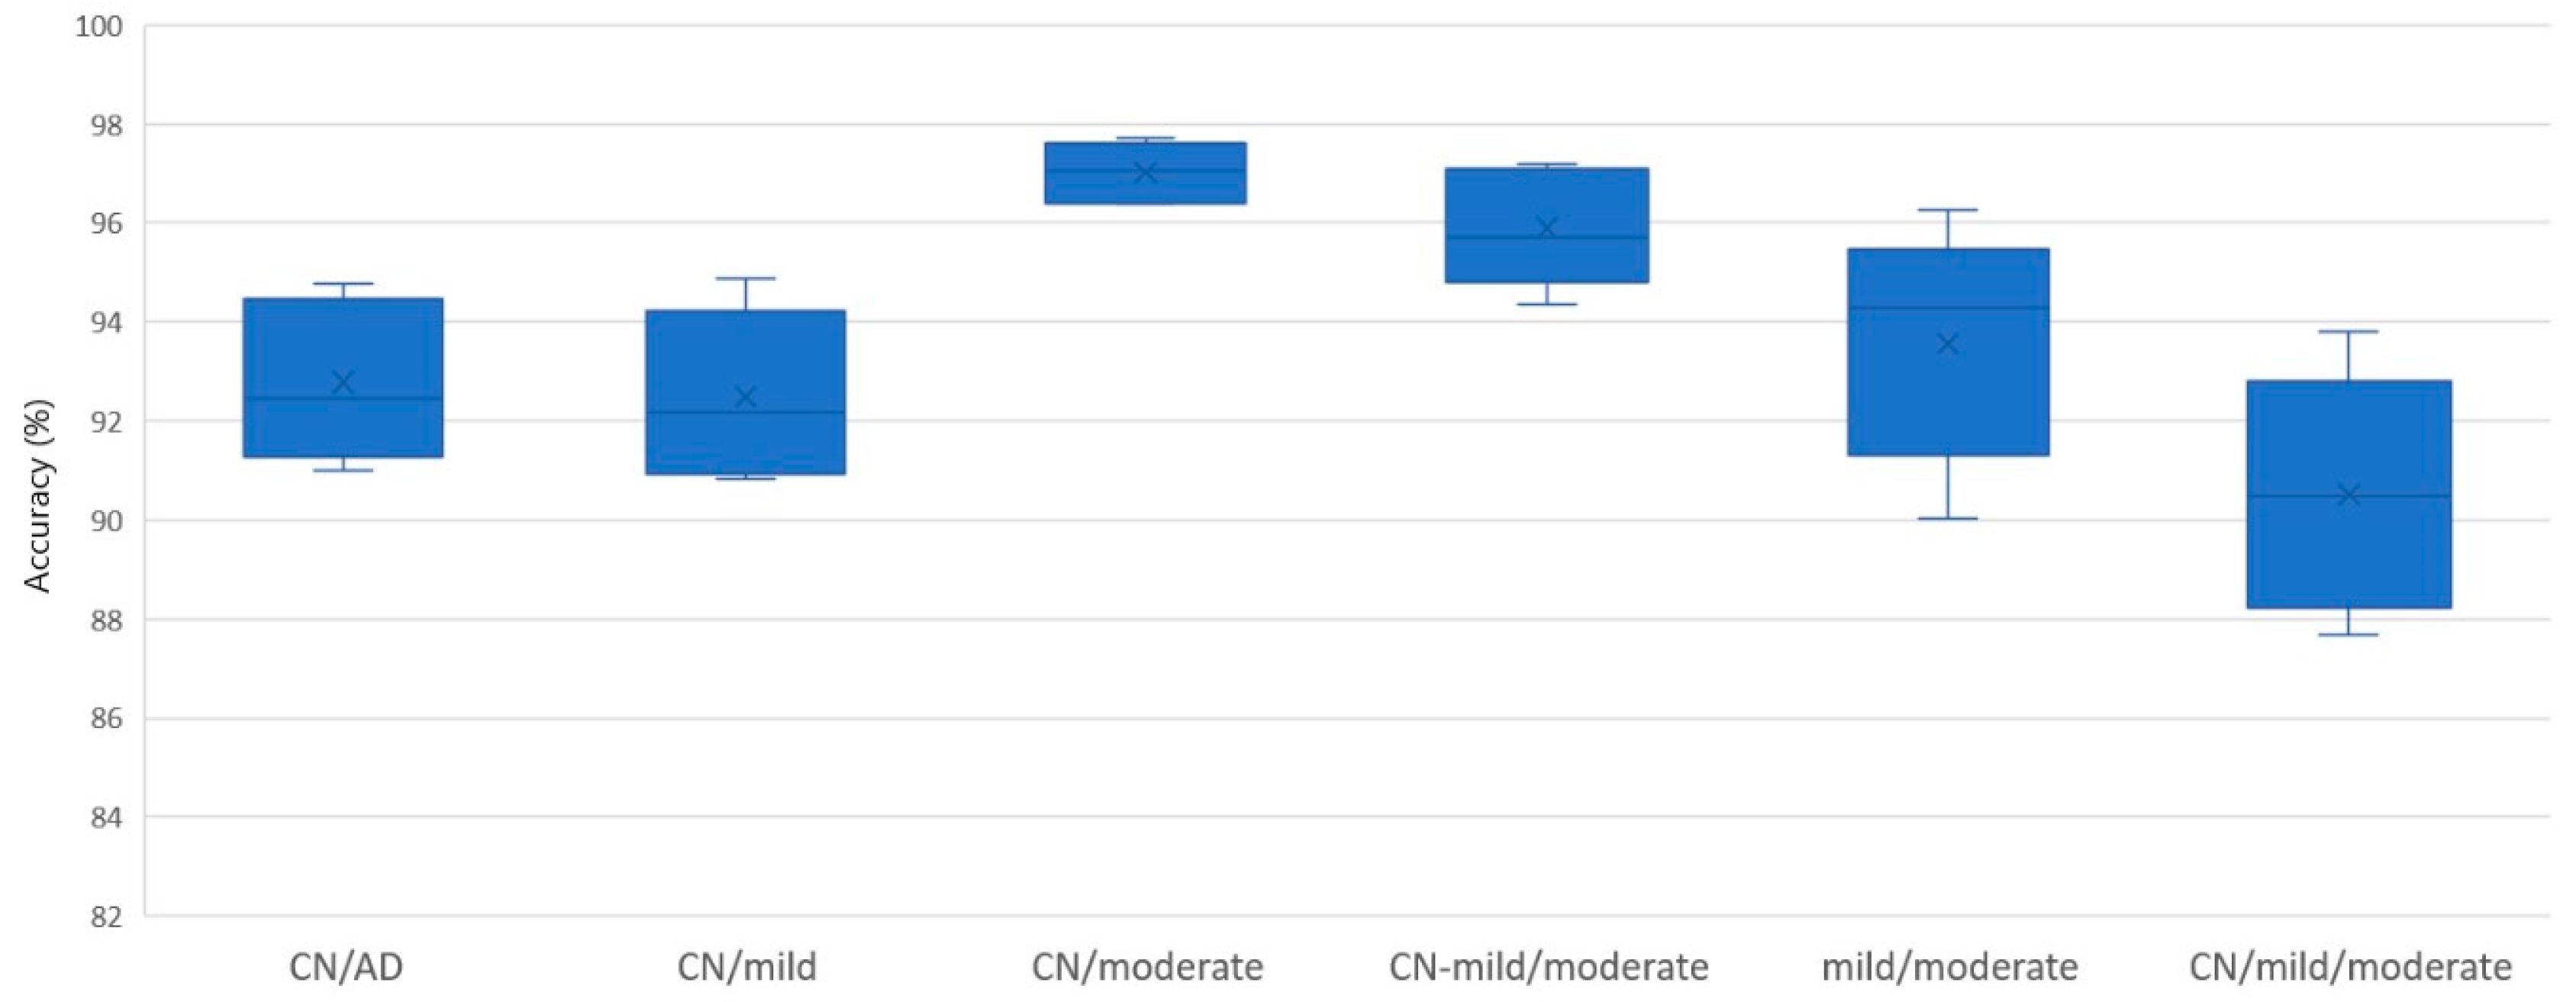
The classification of Alzheimer’s concerning controls group (CN/AD) presents good classification results with accuracies ranging from 90.99% to 94.76% (temporal/right, anterior, temporal/left, posterior, and central), with kappa statistics from 0.8194 to 0.8936, and with F1-scores from 0.9148 to 0.9534. The worst classification performance is obtained for the 3-class problem (CN/mild/moderate) with an accuracy ranging from 87.67% to 93.80%, with kappa from 0.7861 to 0.8930, and with an F1-score from 0.8041 to 0.9051 for the anterior cluster, the right side of the temporal region, the left side of the temporal region, the posterior region, and the central region. A visualization of the obtained accuracy range for each classification problem is depicted in Figure 3. Figure 4 represents the classification accuracy in each cluster for each classification problem.

4. Discussion

In this study, a methodology for the detection of AD-related dynamics from the whole brain and from specific brain regions of interest was presented. The statistical and spectral features were calculated from the EEG segments of different lengths acquired from 14 patients with AD and 10 healthy subjects, which were used to train and test a Random Forests classifier. Six different classification problems were conducted for the evaluation of the proposed method.
The proposed methodology showed significant results in the discrimination between healthy elderly and AD-related patient groups and in the characterization of the disease (mild/moderate). With regard to the window length, the results showed a high classification accuracy as the length of the window was gradually increasing, and the best classification results were obtained for epochs of 12 s.
Furthermore, in this study, the brain asymmetry was examined since it was highly related to EEG information processing [34,35]. Generally, healthy elderly individuals showed a cortical atrophy which was predominantly affected by age and gradually resulted in MCI without significant functional alterations. Brain asymmetry in healthy individuals was present mainly in the right temporal lobe due to cortical thinning, and higher dynamics were shown. On the other hand, in AD patients, diffuse cortical atrophy, brain disfunction, and lower dynamics over the cerebral cortex were shown. The symptoms of patients with AD were due to pathological alterations in many regions of the cerebral cortex and became more severe as the disease progressed. The hippocampus was predominantly affected by AD, and hippocampal asymmetry was significantly reduced in AD patients. Also, functional magnetic resonance imaging (fMRI) studies [36] have shown additional atrophy in AD patients with AD in the medial temporal cortex, and it was evidence that the degree of brain asymmetry progressively decreased in AD patients [37]. The obtained results were consistent with the literature findings regarding functional abnormalities in AD patients compared to healthy, age-matched individuals. The results of the study indicated that AD was diagnosed better from EEG signals at the central and occipitoparietal regions and the left side of the temporal lobe than at the frontal area and at the right side of the temporal lobe. AD-related brain dynamics were discriminated from the ones acquired from healthy subjects better at the central and posterior regions for all classification problems (CN/mild, CN/moderate, CN/AD, CN-mild/moderate, and CN/mild/moderate) and the 2-class disease severity (mild-moderate). This outcome is in line with literature that suggests that the occipitoparietal area [1,29,38] and the left side of the brain [11,12] are more affected in AD than the frontal area and right hemisphere.
Also, a classification between healthy elderly subjects and dementia patients with moderate AD (CN-mild/moderate and CN/moderate) showed the best classification accuracy for a whole-brain classification and for each cluster separately. Undoubtedly, it was easier for the classifier to capture EEG changes between healthy elderly and AD patients with more severe disease progress, than between healthy individuals and mild AD patients, who showed less cognitive decline. Furthermore, the most challenging classification problem was the 3-class problem (CN/mild/moderate), which presented the worse performance in both the entire-brain classification and for each cluster. The low accuracy of this problem is mainly attributed to the misclassification of the mild AD group as the control group.
Most of previous studies [19,20,26] dealt with healthy elderly subjects, patients with AD, and patients with MCI, which is a prodromal stage of AD, not a category [19]. In this study, MCI patients were not included in the analysis. Therefore, it was not straightforward to compare the results of this study with previous reports related to MCI, and so, these studies were excluded from the comparison. The proposed method with statistical, spectral, and nonlinear features and Random Forests outperformed in the classification accuracy of a previous study [10] for all of the four binary classification problems (CN/AD, CN/mild, CN/moderate, and mild/moderate). Falk et al. [10] proposed a method wherein the Hilbert–Huang Transform was used to decompose EEG signals in 5 frequency bands, and then, the percentage modulation energy (PME) was extracted for each EEG rhythm. Support Vector Machines (SVM) were trained and tested with PME and obtained a 90.60% classification accuracy for the CN/AD problem. For the same classification problem, a Linear Discriminant Analysis classifier in a study [13] indicated a 90% accuracy with a maximum detrended cross-correlation coefficient when the C3-P3 channels were used as the input.
High levels of accuracy above 96% were obtained in References [11,12,14]. Kulkarni et al. [12] extracted wavelet, spectral, and complexity features from 50 AD patients and 50 healthy, age-matched subjects. The feature vector of the complexity features with SVM obtained a classification accuracy of 96% for the discrimination of AD patients from the controls (AD-CN); however, the MMSE score was not reported. Also, in Reference [14], the authors proposed a brain functional network construction method based on the calculation of multiscale entropy and evaluated several classifiers. The classification accuracy for the CN/AD problem with the k-Nearest Neighbor was above 96%. Nevertheless, the MMSE score of the AD subjects included in this study ranged from moderate AD to MCI. (MMSE score = 21.3 ± 5.8). Therefore, since, in our study, no MCI patients were included, a comparison with Reference [14] was not straightforward.
Another AD detection method was proposed in Reference [11], in which the proposed Multivariate Multiscale Weighted Permutation Entropy method with ROC curves achieved a 96.70% accuracy in the right frontal to the left occipitoparietal regions. However, the MMSE score of AD patients in this study ranged from 12–15, indicating a moderate AD stage. Thus, it was feasible to compare the abovementioned classification with the results of the “CN/moderate” problem of the proposed methodology, which showed a slightly better classification accuracy.
Simons and Abasolo [15] proposed a distance-based Lempel–Ziv complexity (dLZC) method to characterize the changes between pairs of electrodes and succeeded with a 78.25% accuracy for the O1–O2 pair. A comparison of the proposed methodology with previous studies is presented in Table 6.

5. Conclusions

AD is a severe neurodegenerative disease, and we know little about the underlying mechanics of the disorder. Currently, the challenge in the field of AD-related EEG analysis is to accurately diagnose dementia as early as possible towards a more efficient and tailored treatment plan in order to delay the progression of the disease. Research studies focus on evaluating specific EEG markers that provide a highly accurate discrimination of AD patients that are on different medication in order to assist neurologists in the adjustment of intervention plans in clinical trials [39,40,41]. The proposed study is an extend of our previous work [42] and investigated the ability of several statistical and spectral features to accurately discriminate AD patients with mild or moderate AD from healthy, age-matched subjects. Despite the good classification performance, improvements need to be done concerning the statistical significance of the results. Feature selection methods and other classification algorithms need to be evaluated to sustain the quality of the classification performance. Furthermore, this study is evaluated on 24 subjects. In a forthcoming study, EEG recordings from more participants will be analyzed.
A limitation of the proposed methodology is that no additional EEG preprocessing for artifacts removal was employed. This is mainly because, in the current study, the EEG signals were obtained so as to minimize EMG or other types of interferences. However, it is possible that an EEG recording may be contaminated with artifacts, and thus, methods detecting EOG and EMG artifacts are considered necessary in a robust and concise methodology. Future work will include the employment of EEG preprocessing techniques in order to detect and remove EMG or other types of artifacts.

Author Contributions

M.G.T., A.T.T., and D.G.T. conceived of the idea and methodology. T.A., P.I., and N.G. recorded and reviewed the EEG signals and supervised the medical part. K.D.T., L.G.A., N.G., and A.T.T. performed the classification experiments, employing several different classifiers and evaluating different window lengths, and provided the comparative experiments. K.D.T. and all other authors prepared the manuscript. D.G.T. and P.A. organized the research team, and M.G.T. supervised the project.

Funding

This research received no external funding.

Acknowledgments

This research was cofinanced by Greece and the European Union (European Social Fund-ESF) through the Operational Programme «Human Resources Development, Education, and Lifelong Learning» in the context of the project “Strengthening Human Resources Research Potential via Doctorate Research” (MIS-5000432), implemented by the State Scholarships Foundation (ΙΚΥ).

Conflicts of Interest

The authors declare no conflict of interest.

References

  1. Abásolo, D.; Hornero, R.; Espino, P.; Poza, J.; Sánchez, C.I.; De La Rosa, R. Analysis of regularity in the EEG background activity of Alzheimer’s disease patients with Approximate Entropy. Clin. Neurophysiol. 2005, 116, 1826–1834. [Google Scholar] [CrossRef] [PubMed]
  2. Crews, L.; Masliah, E. Molecular mechanisms of neurodegeneration in Alzheimer ’s disease. Hum. Mol. Genet. 2010, 19, R12–R20. [Google Scholar] [CrossRef]
  3. Patterson, C. World Alzheimer Report 2018 The State of the Art of Dementia Research: New Frontiers. London, UK, 2018. Available online: https://www.alz.co.uk/research/WorldAlzheimerReport2018.pdf (accessed on 10 April 2019).
  4. Marshal, S.E.F.; Folstein, F.; Mchugh, P.R. Mini-Mental State’ A Ppractical method for grading the cognitive state of patients for the clinician. J. Phychiat. 1975, 12, 189–198. [Google Scholar]
  5. Morris, J.C. The Clinical Dementia Rating (CDR): Current version and scoring rules. Neurology 2012, 43, 2412. [Google Scholar] [CrossRef]
  6. Jeong, J.; Kim, S.Y.; Han, S.H. Non-linear dynamical analysis of the EEG in Alzheimer’s disease with optimal embedding dimension. Electroencephalogr. Clin. Neurophysiol. 1998, 106, 220–228. [Google Scholar] [CrossRef]
  7. Coronel, C.; Garn, H.; Waser, M.; Deistler, M.; Benke, T.; Dal-Bianco, P.; Ransmayr, G.; Seiler, S.; Grossegger, D.; Schmidt, R. Quantitative EEG markers of entropy and auto mutual information in relation to MMSE scores of probable Alzheimer’s disease patients. Entropy 2017, 19, 130. [Google Scholar] [CrossRef]
  8. Dauwels, J.; Vialatte, F.; Cichocki, A. Diagnosis of Alzheimer’s Disease from EEG Signals: Where Are We Standing? Curr. Alzheimer Res. 2010, 999, 1–19. [Google Scholar] [CrossRef]
  9. Garn, H.; Waser, M.; Deistler, M.; Benke, T.; Dal-Bianco, P.; Ransmayr, G.; Schmidt, H.; Sanin, G.; Santer, P.; Caravias, C.; et al. Quantitative EEG markers relate to Alzheimer’s disease severity in the Prospective Dementia Registry Austria (PRODEM). Clin. Neurophysiol. 2015, 126, 505–513. [Google Scholar] [CrossRef]
  10. Falk, T.H.; Fraga, F.J.; Trambaiolli, L.; Anghinah, R. EEG amplitude modulation analysis for semi-automated diagnosis of Alzheimer’s disease. EURASIP J. Adv. Signal. Process. 2012, 2012, 1–9. [Google Scholar] [CrossRef]
  11. Deng, B.; Cai, L.; Li, S.; Wang, R.; Yu, H.; Chen, Y.; Wang, J. Multivariate multi-scale weighted permutation entropy analysis of EEG complexity for Alzheimer’s disease. Cogn. Neurodyn. 2017, 11, 217–231. [Google Scholar] [CrossRef]
  12. Kulkarni, N.N.; Bairagi, V.K. Extracting Salient Features for EEG-based Diagnosis of Alzheimer’s Disease Using Support Vector Machine Classifier. IETE J. Res. 2017, 63, 11–22. [Google Scholar] [CrossRef]
  13. Chen, Y.; Cai, L.; Wang, R.; Song, Z.; Deng, B.; Wang, J.; Yu, H. DCCA cross-correlation coefficients reveals the change of both synchronization and oscillation in EEG of Alzheimer disease patients. Phys. A Stat. Mech. Appl. 2018, 490, 171–184. [Google Scholar] [CrossRef]
  14. Song, Z.; Deng, B.; Wang, J.; Wang, R. Biomarkers for Alzheimer’s Disease Defined by a Novel Brain Functional Network Measure. IEEE Trans. Biomed. Eng. 2018, 61, 1003–1009. [Google Scholar] [CrossRef] [PubMed]
  15. Simons, S.; Abásolo, D. Distance-based Lempel-Ziv complexity for the analysis of electroencephalograms in patients with Alzheimer’s disease. Entropy 2017, 19, 129. [Google Scholar] [CrossRef]
  16. Triggiani, A.I.; Bevilacqua, V.; Brunetti, A.; Lizio, R.; Tattoli, G.; Cassano, F.; Soricelli, A.; Ferri, R.; Nobili, F.; Gesualdo, L.; et al. Classification of healthy subjects and Alzheimer’s disease patients with dementia from cortical sources of resting state EEG rhythms: A study using artificial neural networks. Front. Neurosci. 2017, 10, 1–13. [Google Scholar] [CrossRef] [PubMed]
  17. Dottori, M.; Sedeno, L.; Martorell Caro, M.; Alifano, F.; Hesse, E.; Mikulan, E.; García, A.M.; Ruiz-Tagle, A.; Lillo, P.; Slachevsky, A.; et al. Towards affordable biomarkers of frontotemporal dementia: A classification study via network’s information sharing. Sci. Rep. 2017, 7, 1–12. [Google Scholar] [CrossRef] [PubMed]
  18. Neto, E.; Biessmann, F.; Aurlien, H.; Nordby, H.; Eichele, T. Regularized linear discriminant analysis of EEG features in dementia patients. Front. Aging Neurosci. 2016, 8, 1–10. [Google Scholar] [CrossRef]
  19. Ieracitano, C.; Mammone, N.; Bramanti, A.; Hussain, A.; Morabito, F.C. A Convolutional Neural Network approach for classification of dementia stages based on 2D-spectral representation of EEG recordings. Neurocomputing 2019, 323, 96–107. [Google Scholar] [CrossRef]
  20. Ruiz-Gómez, S.J.; Gomez, C.; Poza, J.; Gutierrez-Tobal, G.C.; Tola-Arribas, M.A.; Cano, M.; Hornero, R. Automated multiclass classification of spontaneous EEG activity in Alzheimer’s disease and mild cognitive impairment. Entropy 2018, 20, 35. [Google Scholar] [CrossRef]
  21. Nicastro, N.; Assal, F.; Seeck, M. From here to epilepsy: The risk of seizure in patients with Alzheimer’s disease. Epileptic Disord. 2016, 18, 1–12. [Google Scholar]
  22. Tylová, L.; Kukal, J.; Hubata-Vacek, V.; Vyšata, O. Unbiased estimation of permutation entropy in EEG analysis for Alzheimer’s disease classification. Biomed. Signal. Process. Control. 2018, 39, 424–430. [Google Scholar] [CrossRef]
  23. Waser, M.; Garn, H.; Schmidt, R.; Benke, T.; Dal-Bianko, P.; Ransmayr, G.; Schmidt, H.; Seiler, S.; Sanin, G.; Mayer, F.; et al. Quantifying synchrony patterns in the EEG of Alzheimer’s patients with linear and non-linear connectivity markers. J. Neural Transm. 2016, 123, 297–316. [Google Scholar] [CrossRef] [PubMed]
  24. Abásolo1, D.; Hornero, R.; Espino, P. Approximate entropy of eeg background activity in alzheimer’s disease patients. Intell. Autom. Soft Comput. 2009, 15, 591–603. [Google Scholar]
  25. Poza, J.; Gomez, C.; Garcia, M.; Tola-Arribas, M.A.; Carreres, A.; Cano, M.; Hornero, R. Spatio-Temporal Fluctuations of Neural Dynamics in Mild Cognitive Impairment and Alzheimer’s Disease. Curr. Alzheimer Res. 2017, 14, 924–936. [Google Scholar] [CrossRef] [PubMed]
  26. Labate, D.; La Foresta, F.; Morabito, G.; Palamara, I.; Morabito, F.C. Entropic measures of EEG complexity in alzheimer’s disease through a multivariate multiscale approach. IEEE Sens. J. 2013, 13, 3284–3292. [Google Scholar] [CrossRef]
  27. Bertè, F.; Lamponi, G.; Calabrò, R.S.; Bramanti, P. Elman neural network for the early identification of cognitive impairment in Alzheimer’s disease. Funct. Neurol. 2014, 29, 57–65. [Google Scholar]
  28. Liu, X.; Zhang, C.; Zheng, J.; Ma, Y.; Shang, X.; Zhang, Q.; Zheng, W.; Li, X.; Gao, J.; Wang, R.; et al. Multiple characteristics analysis of Alzheimer’s electroencephalogram by power spectral density and Lempel–Ziv complexity. Cogn. Neurodyn. 2016, 10, 121–133. [Google Scholar] [CrossRef]
  29. Fraga, F.J.; Falk, T.; Kanda, P.A.M.; Anghinah, R. Characterizing Alzheimer’s Disease Severity via Resting-Awake EEG Amplitude Modulation Analysis. PLoS ONE 2013, 8, e72240. [Google Scholar] [CrossRef]
  30. Delorme, A.; Makeig, S. EEGLAB: An open source toolbox for analysis of single-trial EEG dynamics including independent component analysis. J. Neurosci. Methods 2004, 134, 9–21. [Google Scholar] [CrossRef]
  31. Breiman, L.E.O. Random Forests. Mach. Learn. 2001, 45, 5–32. [Google Scholar] [CrossRef] [Green Version]
  32. Duda, R.O.; Hart, P.E.; Stork, D.G. Pattern Classification, 2nd ed.; John Wiley and Sons, Inc.: New York, NY, USA, 2000. [Google Scholar]
  33. Mchugh, M.L. Lessons in biostatistics Interrater reliability: The kappa statistic. Biochem. Medica 2012, 22, 276–282. [Google Scholar] [CrossRef]
  34. Posner, E.V.; Dyakin, V.V.; Lucas, J.; Dyakina-Fagnano, N.V. The Chain of Chirality Transfer as Determinant of Brain Functional Laterality. Breaking the Chirality Silence: Search for New Generation of Biomarkers; Relevance to Neurodegenerative Diseases, Cognitive Psychology, and Nutrition Science. Neurol. Neurosci. Res. 2017, 1, 1–12. [Google Scholar]
  35. Ramsøy, T.Z.; Skov, M.; Christensen, M.K.; Stahlhut, C. Frontal brain asymmetry and willingness to pay. Front. Neurosci. 2018, 12, 1–12. [Google Scholar] [CrossRef]
  36. Bakkour, A.; Morris, J.C.; Wolk, D.A.; Dickerson, B.C. The effects of aging and Alzheimer’s disease on cerebral cortical anatomy: Specificity and differential relationships with cognition. Neuroimage 2013, 76, 332–344. [Google Scholar] [CrossRef]
  37. Liu, H.; Zhang, L.; Xi, Q.; Zhao, X.; Wang, F.; Wang, X.; Men, W.; Lin, Q. Changes in brain lateralization in patients with mild cognitive impairment and Alzheimer’s disease: A resting-state functional magnetic resonance study from Alzheimer’s disease neuroimaging initiative. Front. Neurol. 2018, 9, 1–10. [Google Scholar] [CrossRef]
  38. Jacobs, H.I.L.; Van Boxtel, M.P.J.; Jolles, F.R.J.; Verhey, F.R.; Uylings, H.B.M. Parietal cortex matters in Alzheimer’s disease: An overview of structural, functional and metabolic findings. Neurosci. Biobehav. Rev. 2012, 36, 297–309. [Google Scholar] [CrossRef]
  39. Dauwels, J.; Vialatte, F.; Musha, T.; Cichocki, A. A comparative study of synchrony measures for the early diagnosis of Alzheimer’s disease based on EEG. Neuroimage 2010, 49, 668–693. [Google Scholar] [CrossRef]
  40. Khodayari-Rostamabad, A.; Hasey, G.; MacCrimmon, D.J.; Reilly, J.P.; De Bruin, H. A pilot study to determine whether machine learning methodologies using pre-treatment electroencephalography can predict the symptomatic response to clozapine therapy. Clin. Neurophysiol. 2010, 121, 1998–2006. [Google Scholar] [CrossRef]
  41. Simpraga, S.; Alvarez-Jimenez, R.; Mansvelder, H.D.; Van Gerven, J.M.A.; Groeneveld, G.J.; Poil, S.S.; Linkenkaer-Hansen, K. EEG machine learning for accurate detection of cholinergic intervention and Alzheimer’s disease. Sci. Rep. 2017, 7, 1–11. [Google Scholar] [CrossRef]
  42. Tzimourta, K.D.; Afrantou, T.; Ioannidis, P.; Karatzikou, M.; Tzallas, A.T.; Giannakeas, N.; Astrakas, L.G.; Angelidis, P.; Glavas, E.; Grigoriadis, N.; et al. Analysis of electroencephalographic signals complexity regarding Alzheimer’s Disease. Comput. Electr. Eng. 2019, 76, 198–212. [Google Scholar] [CrossRef]
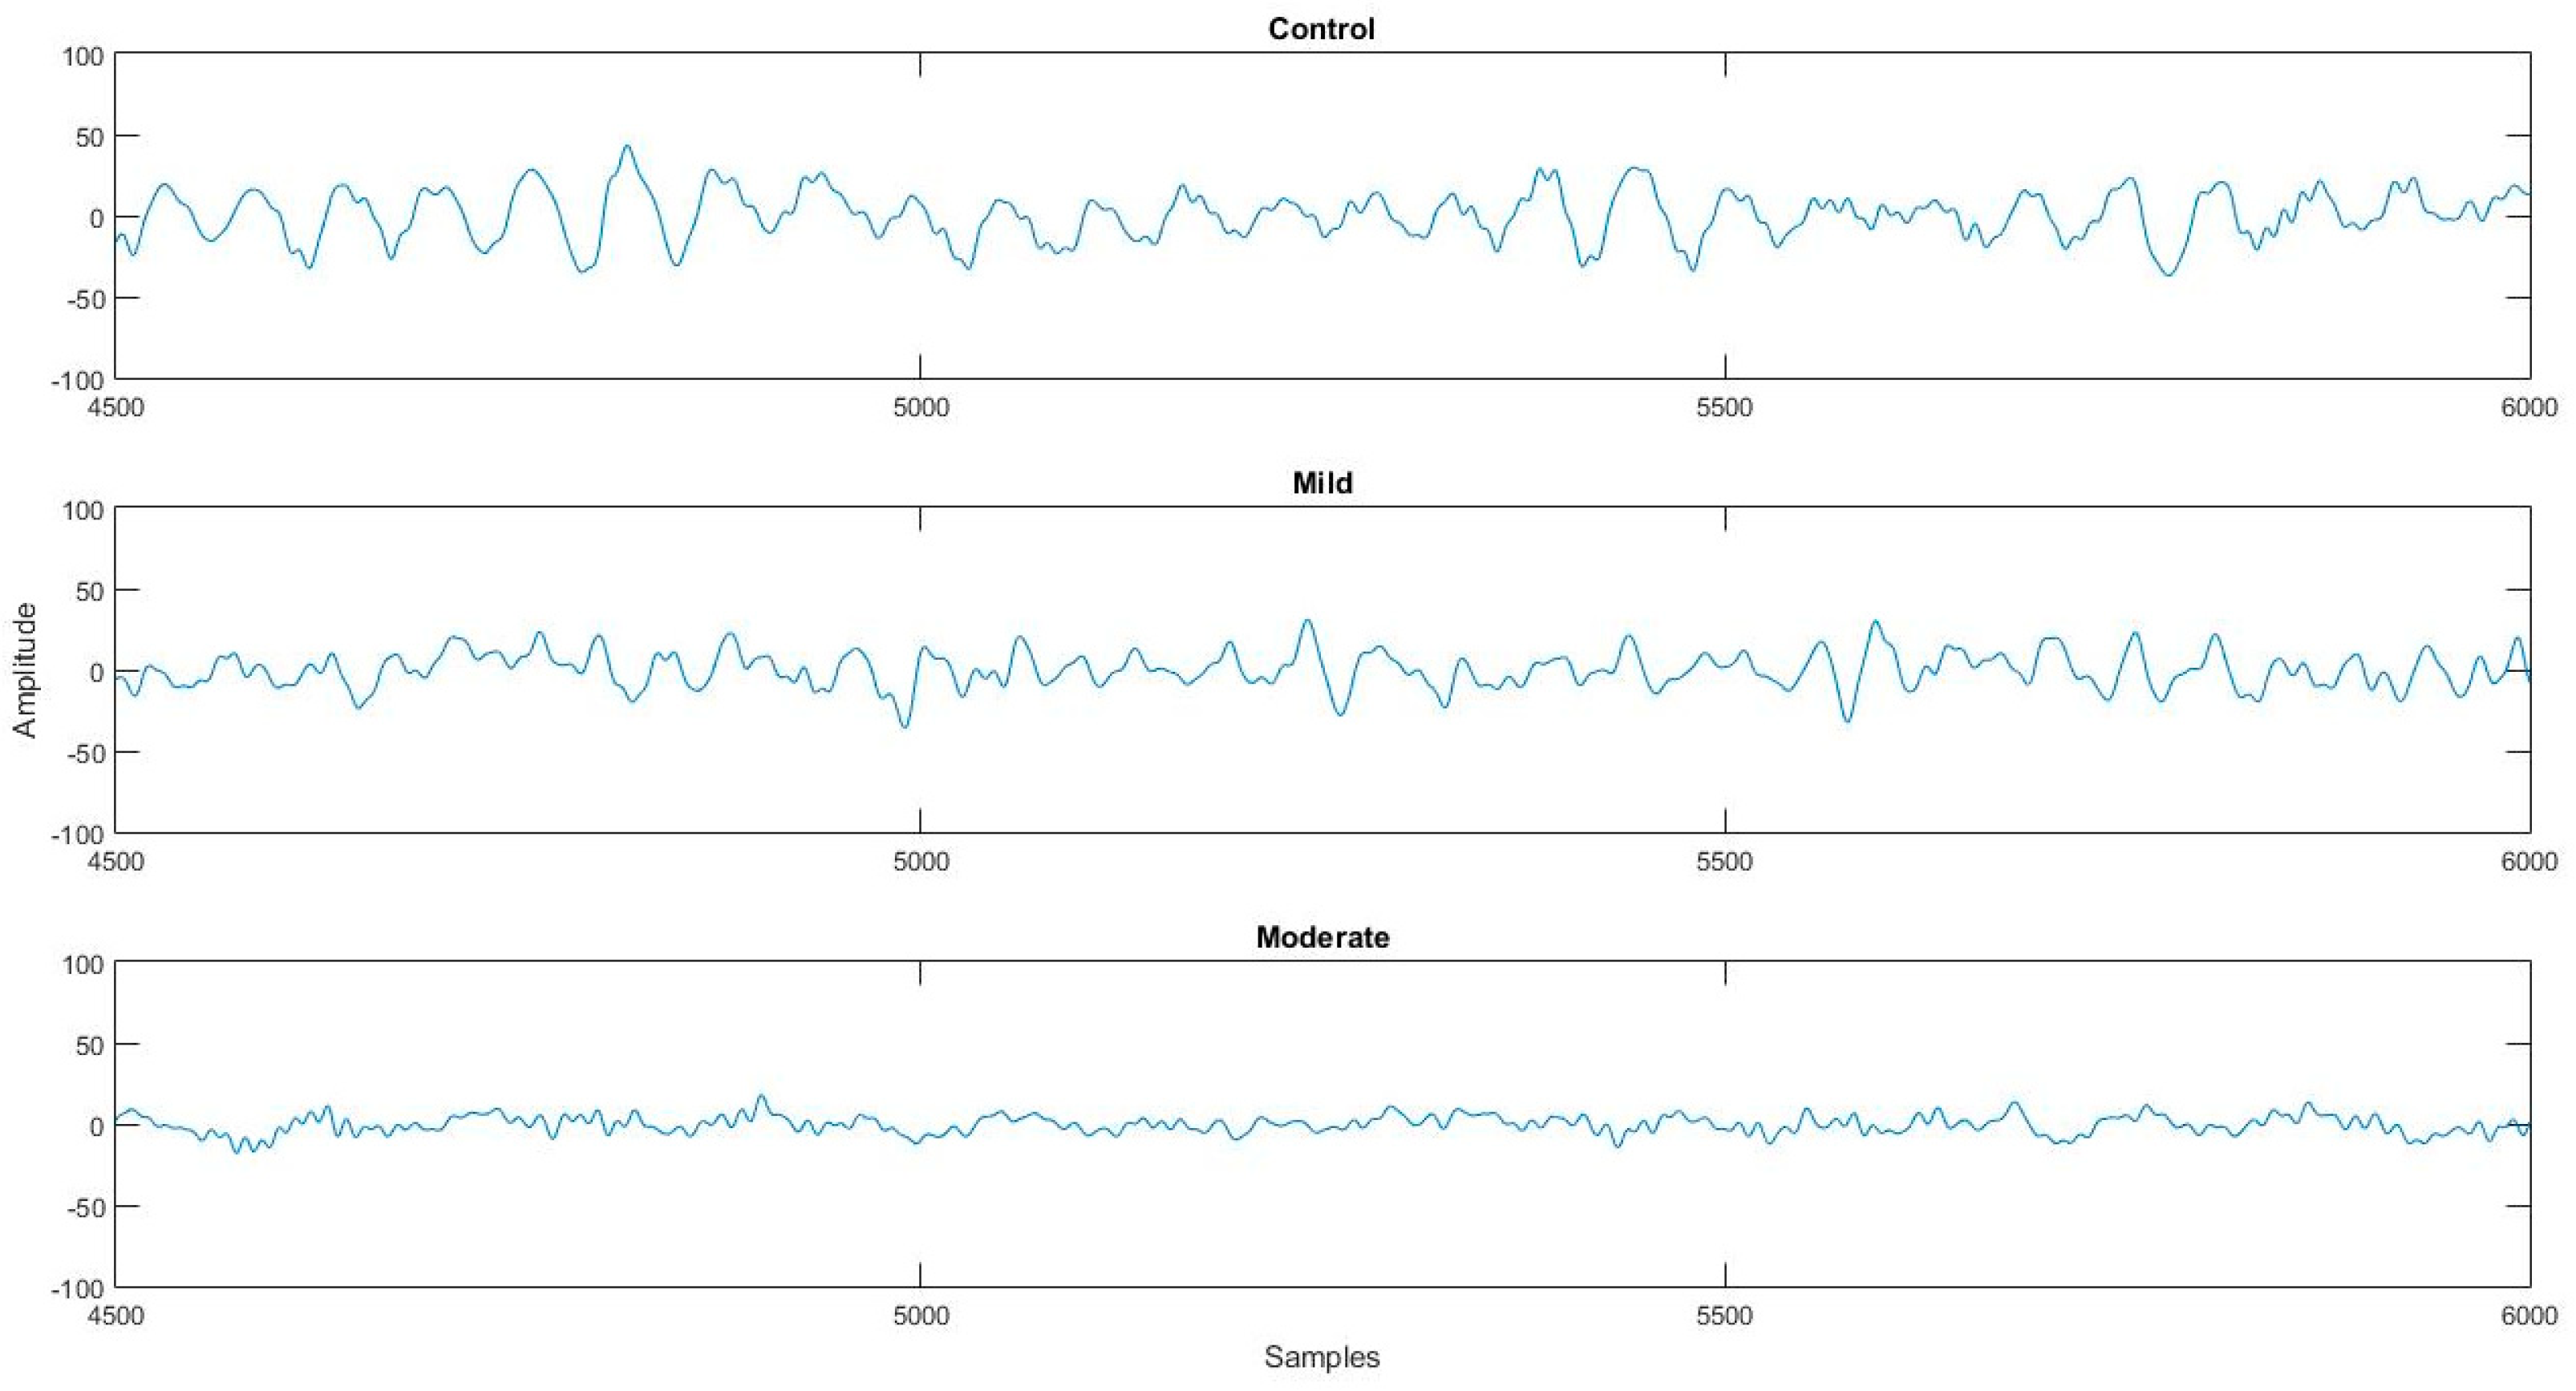
Figure 1. A segment of 3 s extracted from a 12-s epoch of O1 of three different subjects (control, mild Alzheimer’s Disease (AD) patient, and moderate AD patient).
Brainsci 09 00081 g001
Figure 2. The results in terms of the classification accuracy for the six classification problems over 8 window lengths. (blue: CN/AD, yellow: CN/mild, green: CN/moderate, red: CN-mild/moderate, purple: mild/moderate, grey: CN/mild/moderate).
Brainsci 09 00081 g002
Figure 3. Boxplot of the accuracy results from all electrode clusters for each classification problem: The abbreviation CN stands for Controls and AD stands for Alzheimer’s Disease.
Brainsci 09 00081 g003
Figure 4. The distribution of the accuracy results in each cluster for the 5 classification problems: The abbreviation CN stands for Controls and AD stands for Alzheimer’s Disease.
Brainsci 09 00081 g004
Table 1. The descriptions of participants’ characteristics.
Moderate ADMild ADControls
Age62.5 (61.25–68.25)73.5 (68.5–77.25)67 (62.25–72)
Gender (m:f)3:33:57:3
Education level (P:S:H)3:34:2:23:3:4
MMSE15 (14–16)21 (20–22)30
Disease duration (months)32 (24–36)22 (19.5–24)-
* m: male, f: female, P: primary education (6 years), S: secondary education (12 years), H: higher education (>12 years).
Table 2. The classification performance of MultiLayer Perceptron (MLP), k-Nearest Neighbor (KNN), Support Vector Machines (SVM), Naïve Bayes (NB), and Decision Trees (DT) for 12-s epochs in terms of accuracy.
Classification ProblemMLPKNNSVMNBDTRF
CN/AD86.1180.9877.2366.2083.2991.80
CN/mild89.0285.1677.1154.8085.7691.77
CN/moderate95.2393.6291.0981.9394.4896.76
CN-mild/moderate94.2091.3988.8680.0592.1594.99
mild/moderate90.1787.4879.1570.0386.3091.71
CN/mild/moderate80.7174.8866.5946.7477.5588.79
Table 3. The classification results in terms of the Accuracy (ACC) for each classification problem for 8 window lengths.
Classification Problem5 s6 s7 s8 s9 s10 s11 s12 s
CN/AD86.9888.0489.1589.9390.3791.0991.6691.80
CN/mild86.6087.6588.8189.5090.0990.8191.4391.77
CN/moderate94.6895.1395.6495.9996.1896.4696.5696.76
CN-mild/moderate92.5993.2793.7894.0694.2994.7094.8894.99
mild/moderate87.6388.7089.5290.2590.6991.1991.3891.71
CN/mild/moderate82.3483.7385.2386.1086.9387.7288.4788.79
Table 4. The classification results in terms of the Accuracy (ACC), Precision, F1-Score, and Kappa Statistics for a 12-s window length.
Classification ProblemACC (%)Precision (%)F1-scoreKappa
CN/AD91.8093.350.90770.8340
CN/mild91.7793.110.87390.8132
CN/moderate96.7697.780.92770.9069
CN-mild/moderate94.9992.240.83720.8079
mild/moderate91.7191.420.88370.8194
CN/mild/moderate88.7988.830.84740.8860
CN: Controls, AD: Alzheimer’s Disease.
Table 5. The classification results in terms of the Accuracy (ACC), Precision, F1-score, and Kappa statistics for the anterior (Fp1, F3, Fz, Fp2, and F4), central (C3, Cz, and C4), left/temporal (F7, T3, and T5), right/temporal (F8, T4, and T6), and posterior (O1, O2, P3, Pz, and P4) clusters. For the analysis, the electroencephalographic (EEG) signals were segmented in epochs of 12 nonoverlapping seconds.
Classification ProblemACC (%)Precision (%)F1-scoreKappa
anteriorCN/AD91.5390.320.92440.8283
CN/mild90.8492.470.85610.7894
CN/moderate96.3997.700.91880.8957
CN-mild/moderate94.3790.780.81610.7833
mild/moderate90.0389.480.86100.7835
CN/mild/moderate87.6787.310.80410.7861
centralCN/AD94.7694.000.95340.8936
CN/mild94.8796.440.91790.8807
CN/moderate97.5197.680.94690.9307
CN-mild/moderate97.1996.400.91630.8796
mild/moderate96.2496.440.95180.9210
CN/mild/moderate93.8094.430.90510.8930
temporal/leftCN/AD92.4591.980.93370.8462
CN/mild92.1891.530.87540.8186
CN/moderate97.0599.110.93190.9131
CN-mild/moderate95.7194.490.85990.8348
mild/moderate94.2893.780.92340.8778
CN/mild/moderate90.4990.730.85280.8339
temporal/rightCN/AD90.9988.940.91480.8194
CN/mild91.0292.120.87690.8065
CN/moderate96.4097.950.92320.8997
CN-mild/moderate95.2394.800.84340.8156
mild/moderate92.5792.930.88840.8329
CN/mild/moderate88.7889.830.84880.8112
posteriorCN/AD94.1793.900.94680.8823
CN/mild93.5593.250.90550.8566
CN/moderate97.7298.040.94850.9338
CN-mild/moderate96.9594.200.94250.8492
mild/moderate94.6693.290.92390.8828
CN/mild/moderate91.8091.570.89810.8600
Table 6. A comparison of the performances of the various methods proposed in the literature related to Alzheimer’s Disease.
AuthorsNo. of SubjectsWindow LengthMMSE RangeMethodClassification ProblemACC
Falk et al. [10]11 CN/11 mild/10 moderate5 sCN: 26.6 ± 2.7
mild: 18.5 ± 4.7
mod: 14.8 ± 3.9
HHT, Amplitude modulation analysis, SVMCN/AD
CN/mild
CN/mod
mild/mod
90.60%
74.10%
71.40%
53.80%
Deng et al. [11]14 CN/14 AD8 sCN: 28–30
AD: 12–15
Multivariate Multiscale Weighted Permutation Entropy, ROC analysisCN/AD96.70%
Kulkarni et al. [12]50 CN/50 AD~5 s Spectral entropy, Spectral centroid, Spectral roll-off, Zero Crossing Rate, SVMCN/AD96.00%
Chen et al. [13]15 CN/15 AD8 sCN: 28.1–30
AD: 12.5–15.7
Detrended Fluctuation Analysis, Cross-correlation coefficient, LDACN/AD90.00% (only C3–P3)
Song et al. [14]15 CN/15 AD8 sCN: 27.1 ± 1.3
AD: 21.3 ± 5.8
Brain Functional Connectivity Analysis, weighted-permutation entropy, KNNCN/AD96.63%
Simons and Abasolo [15]11 CN/11 AD5 sCN: 30
AD: 13.1 ± 5.9
Distance-based Lempel Ziv ComplexityCN/AD78.25% (only O1–O2)
This study10 CN/14 AD12 sCN: 30
mild: 21 ± 1.3
mod: 15 ± 1.6
moments, STD, IQR, Energy, RBP, ShanEN, ApEN, TsalEN, PermEN, MSE, SamplEN, Random ForestsCN/AD
CN/mild
CN/mod
mild/mod
CN-mild/mod
CN/mild/mod
91.80%
91.77%
96.76%
91.71%
94.99%
88.79%
CN: Controls, AD: Alzheimer’s Disease, mod: moderate AD, HHT: Hilbert–Huang Transform, SVM: Support Vector Machines, LDA: Linear Discriminant Analysis, KNN: k-Nearest Neighbor, STD: Standard Deviation, IQR: Interquartile range, RBP: Relative Band Power, ShanEn: Shannon Entropy, ApEN: Approximate Entropy, TsalEN: Tsallis Entropy, PermEn: Permutation Entropy, MSEL Multiscale Entropy, SamplEN: Sample Entropy.