Does School Racial Composition Explain Why High Income Black Youth Perceive More Discrimination? A Gender Analysis


Abstract
:1. Introduction
2. Methods
2.1. Design
2.2. Ethical Considerations
2.3. Participants and Sampling
2.4. Interviews and Data Collection
2.5. Measures
2.6. Statistical Analysis
3. Results
4. Discussion
4.1. Direction for Future Research
4.2. Theoretical Implications
4.3. Limitations
5. Conclusions
Funding
Acknowledgments
Conflicts of Interest
References
- Davey, S.; Hart, C.; Hole, D.; MacKinnon, P.; Gillis, C.; Watt, G.; Blane, D.; Hawthorne, V. Education and occupational social class: Which is the more important indicator of mortality risk? J. Epidemiol. Community Health 1998, 52, 153–160. [Google Scholar] [CrossRef]
- Conti, G.; Heckman, J.; Urzua, S. The education-health gradient. Am. Econ. Rev. 2010, 100, 234–238. [Google Scholar] [CrossRef] [PubMed]
- Baker, D.P.; Leon, J.; Smith Greenaway, E.G.; Collins, J.; Movit, M. The education effect on population health: A reassessment. Popul. Dev. Rev. 2011, 37, 307–332. [Google Scholar] [CrossRef] [PubMed]
- Assari, S. Unequal gain of equal resources across racial groups. Int. J. Health Policy Manag. 2018, 7, 1–9. [Google Scholar] [CrossRef] [PubMed]
- Assari, S. Health disparities due to blacks’ diminished return: Public Policy Solutions. Soc. Issues Policy Rev. 2018, 12, 112–145. [Google Scholar] [CrossRef]
- Bowen, M.E.; González, H.M. Childhood socioeconomic position and disability in later life: Results of the health and retirement study. Am. J. Public Health 2010, 100, S197–S203. [Google Scholar] [CrossRef] [PubMed]
- Lantz, P.M.; House, J.S.; Mero, R.P.; Williams, D.R. Stress, life events, and socioeconomic disparities in health: Results from the Americans’ Changing Lives Study. J. Health Soc. Behav. 2005, 46, 274–288. [Google Scholar] [CrossRef] [PubMed]
- Kim, J. Intercohort trends in the relationship between education and health: Examining physical impairment and depressive symptomatology. J. Aging Health 2008, 20, 671–693. [Google Scholar] [CrossRef] [PubMed]
- Herd, P.; Goesling, B.; House, J.S. Socioeconomic position and health: The differential effects of education versus income on the onset versus progression of health problems. J. Health Soc. Behav. 2007, 48, 223–238. [Google Scholar] [CrossRef] [PubMed]
- Leopold, L.; Engelhardt, H. Education and physical health trajectories in old age. Evidence from the Survey of Health, Ageing and Retirement in Europe (SHARE). Int. J. Public Health 2013, 58, 23–31. [Google Scholar] [CrossRef] [PubMed]
- Schoeni, R.F.; Buchmueller, T.C.; Freedman, V.A. Socioeconomic Status and Health over the Life Course and Across Generations: Introduction to a Special Issue and Overview of a Unique Data Resource. BE J. Econom. Anal. Policy 2011, 11, 3444. [Google Scholar] [CrossRef] [PubMed]
- Mirowsky, J.; Ross, C.E. Education, Social Status, and Health; Aldine de Gruyter: New York, NY, USA, 2003. [Google Scholar]
- Assari, S.; Lankarani, M.M. Race and Urbanity Alter the Protective Effect of Education but not Income on Mortality. Front. Public Health 2016, 4, 100. [Google Scholar] [CrossRef] [PubMed]
- Assari, S. The Benefits of Higher Income in Protecting against Chronic Medical Conditions Are Smaller for African Americans than Whites. Healthcare 2018, 6, 2. [Google Scholar] [CrossRef] [PubMed]
- Assari, S. High Income Protects Whites but Not African Americans against Risk of Depression. Healthcare 2018, 6, 37. [Google Scholar] [CrossRef] [PubMed]
- Assari, S.; Caldwell, C.H.; Zimmerman, M.A. Family Structure and Subsequent Anxiety Symptoms; Minorities’ Diminished Return. Brain Sci. 2018, 8, 97. [Google Scholar] [CrossRef] [PubMed]
- Assari, S.; Thomas, A.; Caldwell, C.H.; Mincy, R.B. Blacks’ Diminished Health Return of Family Structure and Socioeconomic Status; 15 Years of Follow-up of a National Urban Sample of Youth. J. Urban Health 2018, 95, 21–35. [Google Scholar] [CrossRef] [PubMed]
- Assari, S.; Caldwell, C.H.; Mincy, R. Family Socioeconomic Status at Birth and Youth Impulsivity at Age 15; Blacks’ Diminished Return. Children 2018, 5, 58. [Google Scholar] [CrossRef] [PubMed]
- Assari, S.; Caldwell, C.H.; Mincy, R.B. Maternal Educational Attainment at Birth Promotes Future Self-Rated Health of White but Not Black Youth: A 15-Year Cohort of a National Sample. J. Clin. Med. 2018, 7, 93. [Google Scholar] [CrossRef] [PubMed]
- Assari, S. Life Expectancy Gain Due to Employment Status Depends on Race, Gender, Education, and Their Intersections. J. Racial Ethn. Health Disparities 2017. [Google Scholar] [CrossRef] [PubMed]
- Phelan, J.C.; Link, B.G.; Tehranifar, P. Social conditions as fundamental causes of health inequalities: Theory, evidence, and policy implications. J. Health Soc. Behav. 2010, 51, S28–S40. [Google Scholar] [CrossRef] [PubMed]
- Freese, J.; Lutfey, K. Fundamental Causality: Challenges of an Animating Concept for Medical Sociology. In Handbook of the Sociology of Health, Illness, and Healing; Springer: Berlin, Germany, 2011; pp. 67–81. [Google Scholar]
- Dahl, E.; Van der Wel, K.A. Educational inequalities in health in European welfare states: A social expenditure approach. Soc. Sci. Med. 2013, 81, 60–69. [Google Scholar] [CrossRef] [PubMed]
- Link, B.; Phelan, J. Social conditions as fundamental causes of disease. J. Health Soc. Behav. 1995, 36, 80–94. [Google Scholar] [CrossRef]
- Assari, S.; Gibbons, F.X.; Simons, R. Social Determinants of perceived Discrimination among Black youth in the United States, an 18-Year Longitudinal Study. Behav. Sci. 2018, 5, 24. [Google Scholar]
- Assari, S.; Gibbons, F.X.; Simons, R. Depression among Black Youth; Interaction of Class and Place. Brain Sci. 2018, 8, 108. [Google Scholar] [CrossRef] [PubMed]
- Hudson, D.L.; Bullard, K.M.; Neighbors, H.W.; Geronimus, A.T.; Yang, J.; Jackson, J.S. Are benefits conferred with greater socioeconomic position undermined by racial discrimination among African American men? J. Men’s Health 2012, 9, 127–136. [Google Scholar] [CrossRef] [PubMed]
- Assari, S.; Hani, N. Household Income and Children’s Unmet Dental Care Need; Blacks’ Diminished Return. Dent. J. 2018, 6, 17. [Google Scholar] [CrossRef] [PubMed]
- Assari, S. Socioeconomic Status and Self-Rated Oral Health; Diminished Return among Hispanic Whites. Dent. J. 2018, 6, 11. [Google Scholar] [CrossRef] [PubMed]
- Assari, S.; Lankarani, M.M. Educational Attainment Promotes Fruit and Vegetable Intake for Whites but Not Blacks. J 2018, 1, 29–41. [Google Scholar] [CrossRef] [Green Version]
- Assari, S.; Nikahd, A.; Malekahmadi, M.R.; Lankarani, M.M.; Zamanian, H. Race by Gender Group Differences in the Protective Effects of Socioeconomic Factors Against Sustained Health Problems Across Five Domains. J. Racial Ethn. Health Disparities 2017, 4, 884–894. [Google Scholar] [CrossRef] [PubMed]
- Assari, S.; Moghani, L.M. Poverty Status and Childhood Asthma in White and Black Families: National Survey of Children’s Health. Healthcare 2018, 6, 62. [Google Scholar] [CrossRef] [PubMed]
- Assari, S. Combined Racial and Gender Differences in the Long-Term Predictive Role of Education on Depressive Symptoms and Chronic Medical Conditions. J. Racial Ethn. Health Disparities 2017, 4, 385–396. [Google Scholar] [CrossRef] [PubMed]
- Assari, S. Ethnic and Gender Differences in Additive Effects of Socio-economics, Psychiatric Disorders, and Subjective Religiosity on Suicidal Ideation among Blacks. Int. J. Prev. Med. 2015, 6, 53. [Google Scholar] [CrossRef] [PubMed]
- Assari, S. Family Income and Depression among Black Youth; Ethnicity by Gender Differences in a National Sample. J. Racial Ethn. Health Disparities 2017, in press. [Google Scholar]
- Hudson, D.L.; Neighbors, H.W.; Geronimus, A.T.; Jackson, J.S. The relationship between socioeconomic position and depression among a US nationally representative sample of African Americans. Soc. Psychiatry Psychiatr. Epidemiol. 2012, 47, 373–381. [Google Scholar] [CrossRef] [PubMed]
- Fuller-Rowell, T.E.; Curtis, D.S.; Doan, S.N.; Coe, C.L. Racial disparities in the health benefits of educational attainment: A study of inflammatory trajectories among African American and white adults. Psychosom. Med. 2015, 77, 33–40. [Google Scholar] [CrossRef] [PubMed]
- Wilson, K.B.; Thorpe, R.J., Jr.; LaVeist, T.A. Dollar for Dollar: Racial and ethnic inequalities in health and health-related outcomes among persons with very high income. Prev. Med. 2017, 96, 149–153. [Google Scholar] [CrossRef] [PubMed]
- Assari, S.; Caldwell, C.H. High Risk of Depression in High-Income African American Boys. J. Racial Ethn. Health Disparities 2017. [Google Scholar] [CrossRef] [PubMed]
- Assari, S. Social Determinants of Depression: The Intersections of Race, Gender, and Socioeconomic Status. Brain Sci. 2017, 7, 156. [Google Scholar] [CrossRef] [PubMed]
- Hudson, D.L.; Puterman, E.; Bibbins-Domingo, K.; Matthews, K.A.; Adler, N.E. Race, life course socioeconomic position, racial discrimination, depressive symptoms and self-rated health. Soc. Sci. Med. 2013, 97, 7–14. [Google Scholar] [CrossRef] [PubMed]
- Assari, S.; Caldwell, C.H. Social Determinants of Perceived Discrimination among Black Youth: Intersection of Ethnicity and Gender. Children 2018, 5, 24. [Google Scholar] [CrossRef] [PubMed]
- Griffith, D.M.; Johnson, J.L.; Zhang, R.; Neighbors, H.W.; Jackson, J.S. Ethnicity, nativity, and the health of American Blacks. J. Health Care Poor Underserved 2011, 22, 142–156. [Google Scholar] [PubMed]
- Zong, J.; Batalova, J. Caribbean Immigrants in the United States. 2016. Available online: https://www.migrationpolicy.org/article/caribbean-immigrants-united-states (accessed on 6 July 2018).
- Thomas, K.J. A Demographic Profile of Black Caribbean Immigrants in the United States; Migration Policy Institute: Washington, DC, USA, 2012; Volume 15, Available online: https://www.migrationpolicy.org/article/caribbean-immigrants-united-states (accessed on 6 July 2018).
- Pettigrew, T.F. Intergroup contact theory. Annu. Rev. Psychol. 1998, 49, 65–85. [Google Scholar] [CrossRef] [PubMed]
- Barlow, F.K.; Paolini, S.; Pedersen, A.; Hornsey, M.J.; Radke, H.R.M.; Harwood, J.; Sibley, C.G. The contact caveat: Negative contact predicts increased prejudice more than positive contact predicts reduced prejudice. Pers. Soc. Psychol. Bull. 2012, 38, 1629–1643. [Google Scholar] [CrossRef] [PubMed]
- Graf, S.; Paolini, S.; Rubin, M. Negative intergroup contact is more influential, but positive intergroup contact is more common: Assessing contact prominence and contact prevalence in five Central European countries. Eur. J. Soc. Psychol. 2014, 44, 536–547. [Google Scholar] [CrossRef]
- Hayward, L.E.; Tropp, L.R.; Hornsey, M.J.; Barlow, F.K. Towards a comprehensive understanding of intergroup contact: Descriptions and mediators of positive and negative contact among majority and minority groups. Pers. Soc. Psychol. Bull. 2017, 43, 347–364. [Google Scholar] [CrossRef] [PubMed]
- Swim, J.K.; Hyers, L.L.; Cohen, L.L.; Fitzgerald, D.C.; Bylsma, W.H. African American college students’ experiences with everyday racism: Characteristics of and responses to these incidents. J. Black Psychol. 2003, 29, 38–67. [Google Scholar] [CrossRef]
- Tropp, L.R.; Mazziotta, A.; Wright, S.C. Recent developments in intergroup contact research: Affective processes, group status, and contact valence. In Cambridge Handbook of the Psychology of Prejudice; Sibley, C., Barlow, F.K., Eds.; Cambridge University Press: Cambridge, UK, 2016; pp. 463–480. [Google Scholar]
- Tropp, L.R.; Pettigrew, T.F. Relationships between intergroup contact and prejudice among minority and majority status groups. Psychol. Sci. 2005, 16, 951–957. [Google Scholar] [CrossRef] [PubMed]
- Heeringa, S.G.; Wagner, J.; Torres, M.; Duan, N.; Adams, T.; Berglund, P. Sample designs and sampling methods for the Collaborative Psychiatric Epidemiology Studies (CPES). Int. J. Methods Psychiatr. Res. 2004, 13, 221–240. [Google Scholar] [CrossRef] [PubMed]
- Jackson, J.S.; Neighbors, H.W.; Nesse, R.M.; Trierweiler, S.J.; Torres, M. Methodological innovations in the National Survey of American Life. Int. J. Methods Psychiatr. Res. 2004, 13, 289–298. [Google Scholar] [CrossRef] [PubMed]
- Jackson, J.S.; Torres, M.; Caldwell, C.H.; Neighbors, H.W.; Nesse, R.M.; Taylor, R.J.; Trierweiler, S.J.; Williams, D.R. The National Survey of American Life: A study of racial, ethnic and cultural influences on mental disorders and mental health. Int. J. Methods Psychiatr. Res. 2004, 13, 196–207. [Google Scholar] [CrossRef] [PubMed]
- Seaton, E.K.; Caldwell, C.H.; Sellers, R.M.; Jackson, J.S. Developmental characteristics of African American and Caribbean Black Adolescents’ attributions regarding discrimination. J. Res. Adolesc. 2010, 20, 774–788. [Google Scholar] [CrossRef] [PubMed]
- Seaton, E.K.; Caldwell, C.H.; Sellers, R.M.; Jackson, J.S. An intersectional approach for understanding perceived discrimination and psychological well-being among African American and Caribbean Black youth. Dev. Psychol. 2010, 46, 1372–1379. [Google Scholar] [CrossRef] [PubMed]
- Birkett, N.J. Computer-aided personal interviewing. A new technique for data collection in epidemiologic surveys. Am. J. Epidemiol. 1988, 127, 684–690. [Google Scholar] [CrossRef] [PubMed]
- Census, B. How the Census Bureau Measures Poverty. 2018. Available online: https://www.census.gov/topics/income-poverty/poverty/guidance/poverty-measures.html (accessed on 1 July 2018).
- Assari, S.; Preiser, B.; Lankarani, M.M.; Caldwell, C.H. Subjective Socioeconomic Status Moderates the Association between Discrimination and Depression in African American Youth. Brain Sci. 2018, 8, 71. [Google Scholar] [CrossRef] [PubMed]
- Assari, S.; Caldwell, C.H. Darker skin tone increases perceived discrimination among male but not female Caribbean black youth. Children 2017, 4, 107. [Google Scholar] [CrossRef] [PubMed]
- Costas, R., Jr.; Garcia-Palmieri, M.R.; Sorlie, P.; Hertzmark, E. Coronary heart disease risk factors in men with light and dark skin in Puerto Rico. Am. J. Public Health 1981, 71, 614–619. [Google Scholar] [CrossRef] [PubMed]
- Perez, A.D.; Hirschman, C. The Changing Racial and Ethnic Composition of the US Population: Emerging American Identities. Popul. Dev. Rev. 2009, 35, 1–51. [Google Scholar] [CrossRef] [PubMed] [Green Version]
- Taylor, M.C. How white attitudes vary with the racial composition of local populations: Numbers count. Am. Sociol. Rev. 1998, 63, 512–535. [Google Scholar] [CrossRef]
- Chiricos, T.; Hogan, M.; Gertz, M. Racial composition of neighborhood and fear of crime. Criminology 1997, 35, 107–132. [Google Scholar] [CrossRef]
- Joyner, K.; Kao, G. School racial composition and adolescent racial homophily. Soc. Sci. Q. 2000, 81, 810–825. [Google Scholar]
- Williams, D.R.; Yu, Y.; Jackson, J.S.; Anderson, N.B. Racial differences in physical and mental health socio-economic status, stress and discrimination. J. Health Psychol. 1997, 2, 335–351. [Google Scholar] [CrossRef] [PubMed]
- Krieger, N.; Smith, K.; Naishadham, D.; Hartman, C.; Barbeau, E.M. Experiences of discrimination: Validity and reliability of a self-report measure for population health research on racism and health. Soc. Sci. Med. 2005, 61, 1576–1596. [Google Scholar] [CrossRef] [PubMed] [Green Version]
- Assari, S.; Moghani Lankarani, M.; Caldwell, C.H. Discrimination increases suicidal ideation in black adolescents regardless of ethnicity and gender. Behav. Sci. 2017, 7, 75. [Google Scholar] [CrossRef] [PubMed]
- Kline, R. Principles and Practice of Structural Equation Modeling, 3rd ed.; Guilford Press: New York, NY, USA, 2011. [Google Scholar]
- Pearl, J. Graphs, causality, and structural equation models. Sociol. Methods Res. 1998, 27, 226–284. [Google Scholar] [CrossRef]
- Pearl, J. The causal foundations of structural equation modeling. In Handbook of Structural Equation Modeling; Hoyle, R.H., Ed.; The Guilford Press: New York, NY, USA, 2011; pp. 68–91. [Google Scholar]
- Hu, L.T.; Bentler, P.M. Cutoff criteria for fit indexes in covariance structure analysis: Conventional criteria versus new alternatives. Struct Equ. Model. 1999, 6, 1–55. [Google Scholar] [CrossRef]
- Lei, M.; Lomax, R.G. The effect of varying degrees of nonnormality in structural equation modeling. Struct Equ. Model. 2005, 12, 1–27. [Google Scholar] [CrossRef]
- Tabachnick, B.; Fidell, L. Using Multivariate Statistics, 3rd ed.; Harper Collins: New York, NY, USA, 1996. [Google Scholar]
- Assari, S.; Lankarani, M.M.; Caldwell, C.H. Does Discrimination Explain High Risk of Depression among High-Income African American Men? Behav. Sci. 2018, 8, 40. [Google Scholar] [CrossRef] [PubMed]
- Grossman, M.; Hanushek, E.; Welch, F. Education and Nonmarket Outcomes. In Handbook of the Economics of Education; Elsevier: Amsterdam, The Netherlands, 2006; Volume 1, pp. 577–633. [Google Scholar]
- Brunello, G.; Fort, M.; Schneeweis, N.; Winter-Ebmer, R. The Causal Effect of Education on Health: What is the Role of Health Behaviors? Health Econ. 2016, 25, 314–336. [Google Scholar] [CrossRef] [PubMed]
- Andresen, E.M.; Malmgren, J.A.; Carter, W.B.; Patrick, D.L. Screening for depression in well older adults: Evaluation of a short form of the CES-D (Center for Epidemiologic Studies Depression Scale). Am. J. Prev. Med. 1994, 10, 77–84. [Google Scholar] [CrossRef]
- Antonakis, J.; Bendahan, S.; Jacquart, P.; Lalive, R. On making causal claims: A review and recommendations. Leadersh. Q. 2010, 21, 1086–1120. [Google Scholar] [CrossRef] [Green Version]
- Dawid, A.P.; Faigman, D.L.; Fienberg, S.E. Fitting science into legal contexts: Assessing effects of causes or causes of effects? Sociol. Methods Res. 2014, 43, 359–390. [Google Scholar] [CrossRef]


| All | African American Female | African American Male | Caribbean Black Female | Caribbean Black Male | ||||||
|---|---|---|---|---|---|---|---|---|---|---|
| Mean | 95% CI | Mean | 95% CI | Mean | 95% CI | Mean | 95% CI | Mean | 95% CI | |
| Age (Years) | 14.97 | 14.84–15.09 | 14.91 | 14.72–15.10 | 14.99 | 14.83–15.15 | 15.55 | 15.44–15.66 | 14.80 | 14.59–15.01 |
| Family Income (Centered) | 170.31 | −4159.66–4500.27 | 196.85 | −4874.99–5268.70 | 83.65 | −6101.89–6269.19 | −478.97 | −8941.67–7983.74 | 1930.03 | −7151.01–11,011.08 |
| Income to Needs Ratio | 3.98 | 3.73–4.23 | 3.98 | 3.74–4.21 | 3.95 | 3.58–4.33 | 3.99 | 3.614.38 | 4.43 | 3.58–5.27 |
| Perceived Discrimination (Everyday) | 5.07 | 4.68–5.47 | 4.76 | 4.31–5.21 | 5.36 | 4.81–5.91 | 4.48 | 3.75–5.22 | 6.13 | 4.25–8.01 |
| Independent Variable | Dependent Variable | b | (SE) | 95% CI | z | p | |
|---|---|---|---|---|---|---|---|
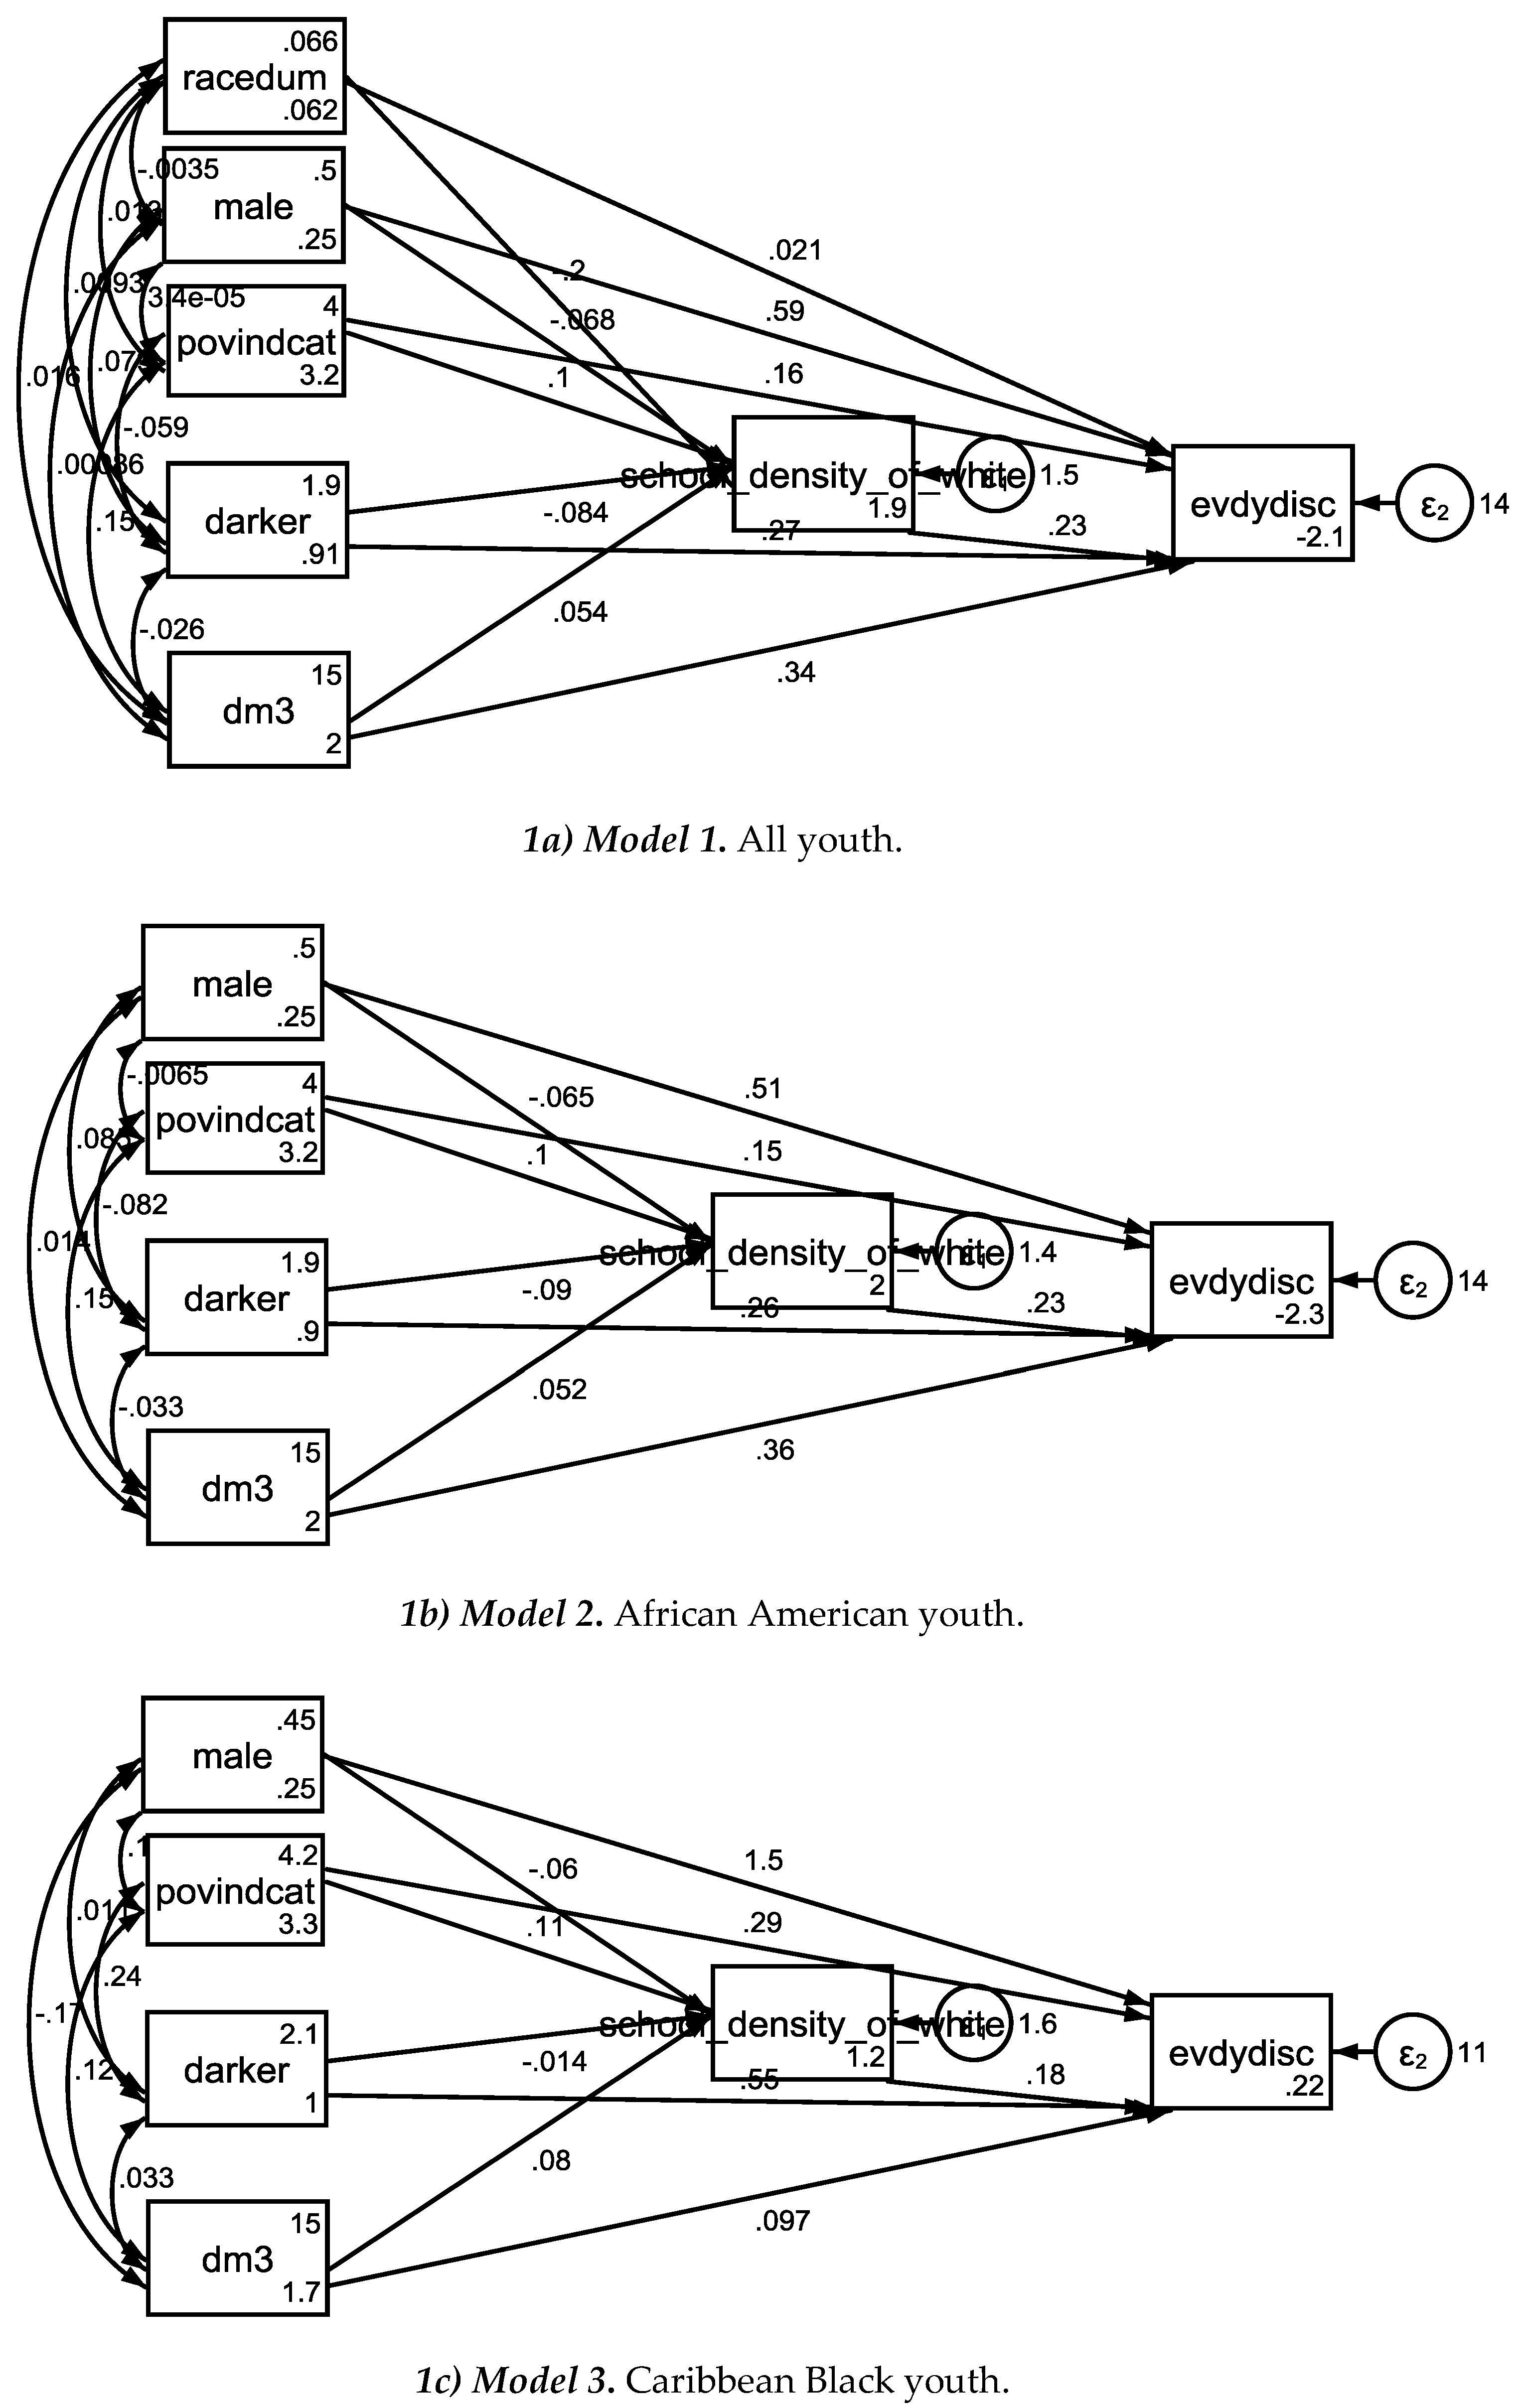
| Model 1 (All) | |||||||
| Independent Variable: | |||||||
| Income-to-needs ratio | School Density | 0.10 | 0.02 | 0.05 | 0.15 | 4.10 | 0.000 |
| Skin Color (Dark) | School Density | −0.08 | 0.05 | −0.18 | 0.01 | −1.74 | 0.082 |
| Age | School Density | 0.05 | 0.03 | −0.01 | 0.11 | 1.73 | 0.083 |
| Ethnicity (CB) | School Density | −0.20 | 0.16 | −0.50 | 0.11 | −1.27 | 0.203 |
| Gender (Male) | School Density | −0.07 | 0.09 | −0.25 | 0.11 | −0.75 | 0.454 |
| Intercept | School Density | 1.94 | 0.49 | 0.99 | 2.90 | 3.99 | 0.000 |
| School density (Percentages of Whites) | Perceived Discrimination | 0.23 | 0.12 | 0.00 | 0.46 | 1.96 | 0.050 |
| Income-to-needs ratio | Perceived Discrimination | 0.16 | 0.08 | 0.01 | 0.31 | 2.11 | 0.034 |
| Skin Color (Dark) | Perceived Discrimination | 0.27 | 0.15 | −0.01 | 0.56 | 1.88 | 0.060 |
| Age | Perceived Discrimination | 0.34 | 0.10 | 0.15 | 0.53 | 3.58 | 0.000 |
| Ethnicity (CB) | Perceived Discrimination | 0.02 | 0.33 | −0.62 | 0.66 | 0.06 | 0.950 |
| Gender (Male) | Perceived Discrimination | 0.59 | 0.28 | 0.05 | 1.13 | 2.13 | 0.033 |
| Intercept | Perceived Discrimination | −2.11 | 1.47 | −4.99 | 0.77 | −1.44 | 0.151 |
| Model 2 (African Americans) | |||||||
| Income-to-needs ratio | School Density | 0.10 | 0.03 | 0.05 | 0.15 | 3.85 | 0.000 |
| Skin Color (Dark) | School Density | −0.09 | 0.05 | −0.19 | 0.01 | −1.78 | 0.075 |
| Age | School Density | 0.05 | 0.03 | −0.01 | 0.12 | 1.62 | 0.106 |
| Gender (Male) | School Density | −0.07 | 0.09 | −0.25 | 0.12 | −0.69 | 0.487 |
| Intercept | School Density | 1.98 | 0.50 | 0.99 | 2.97 | 3.93 | 0.000 |
| School density (Percentages of Whites) | Perceived Discrimination | 0.23 | 0.12 | −0.01 | 0.47 | 1.85 | 0.064 |
| Income-to-needs ratio | Perceived Discrimination | 0.15 | 0.08 | −0.01 | 0.30 | 1.81 | 0.070 |
| Skin Color (Dark) | Perceived Discrimination | 0.26 | 0.16 | −0.05 | 0.56 | 1.64 | 0.102 |
| Age | Perceived Discrimination | 0.36 | 0.10 | 0.17 | 0.56 | 3.62 | 0.000 |
| Gender (Male) | Perceived Discrimination | 0.51 | 0.29 | −0.06 | 1.08 | 1.74 | 0.082 |
| Intercept | Perceived Discrimination | −2.30 | 1.55 | −5.33 | 0.73 | −1.49 | 0.136 |
| Model 3 (Caribbean Blacks) | |||||||
| Income-to-needs ratio | School Density | 0.11 | 0.08 | −0.05 | 0.26 | 1.36 | 0.175 |
| Skin Color (Dark) | School Density | −0.01 | 0.16 | −0.32 | 0.29 | −0.09 | 0.927 |
| Age | School Density | 0.08 | 0.10 | −0.11 | 0.27 | 0.81 | 0.417 |
| Gender (Male) | School Density | −0.06 | 0.30 | −0.64 | 0.52 | −0.20 | 0.840 |
| Intercept | School Density | 1.17 | 1.51 | −1.80 | 4.13 | 0.77 | 0.440 |
| School density (Percentages of Whites) | Perceived Discrimination | 0.18 | 0.20 | −0.21 | 0.56 | 0.90 | 0.367 |
| Income-to-needs ratio | Perceived Discrimination | 0.29 | 0.12 | 0.05 | 0.53 | 2.36 | 0.018 |
| Skin Color (Dark) | Perceived Discrimination | 0.55 | 0.24 | 0.08 | 1.01 | 2.31 | 0.021 |
| Age | Perceived Discrimination | 0.10 | 0.19 | −0.28 | 0.47 | 0.51 | 0.613 |
| Gender (Male) | Perceived Discrimination | 1.54 | 0.51 | 0.55 | 2.54 | 3.04 | 0.002 |
| Intercept | Perceived Discrimination | 0.22 | 2.65 | −4.97 | 5.42 | 0.08 | 0.933 |
| Independent Variable | Dependent Variable | b | (SE) | 95% CI | z | p | |
|---|---|---|---|---|---|---|---|
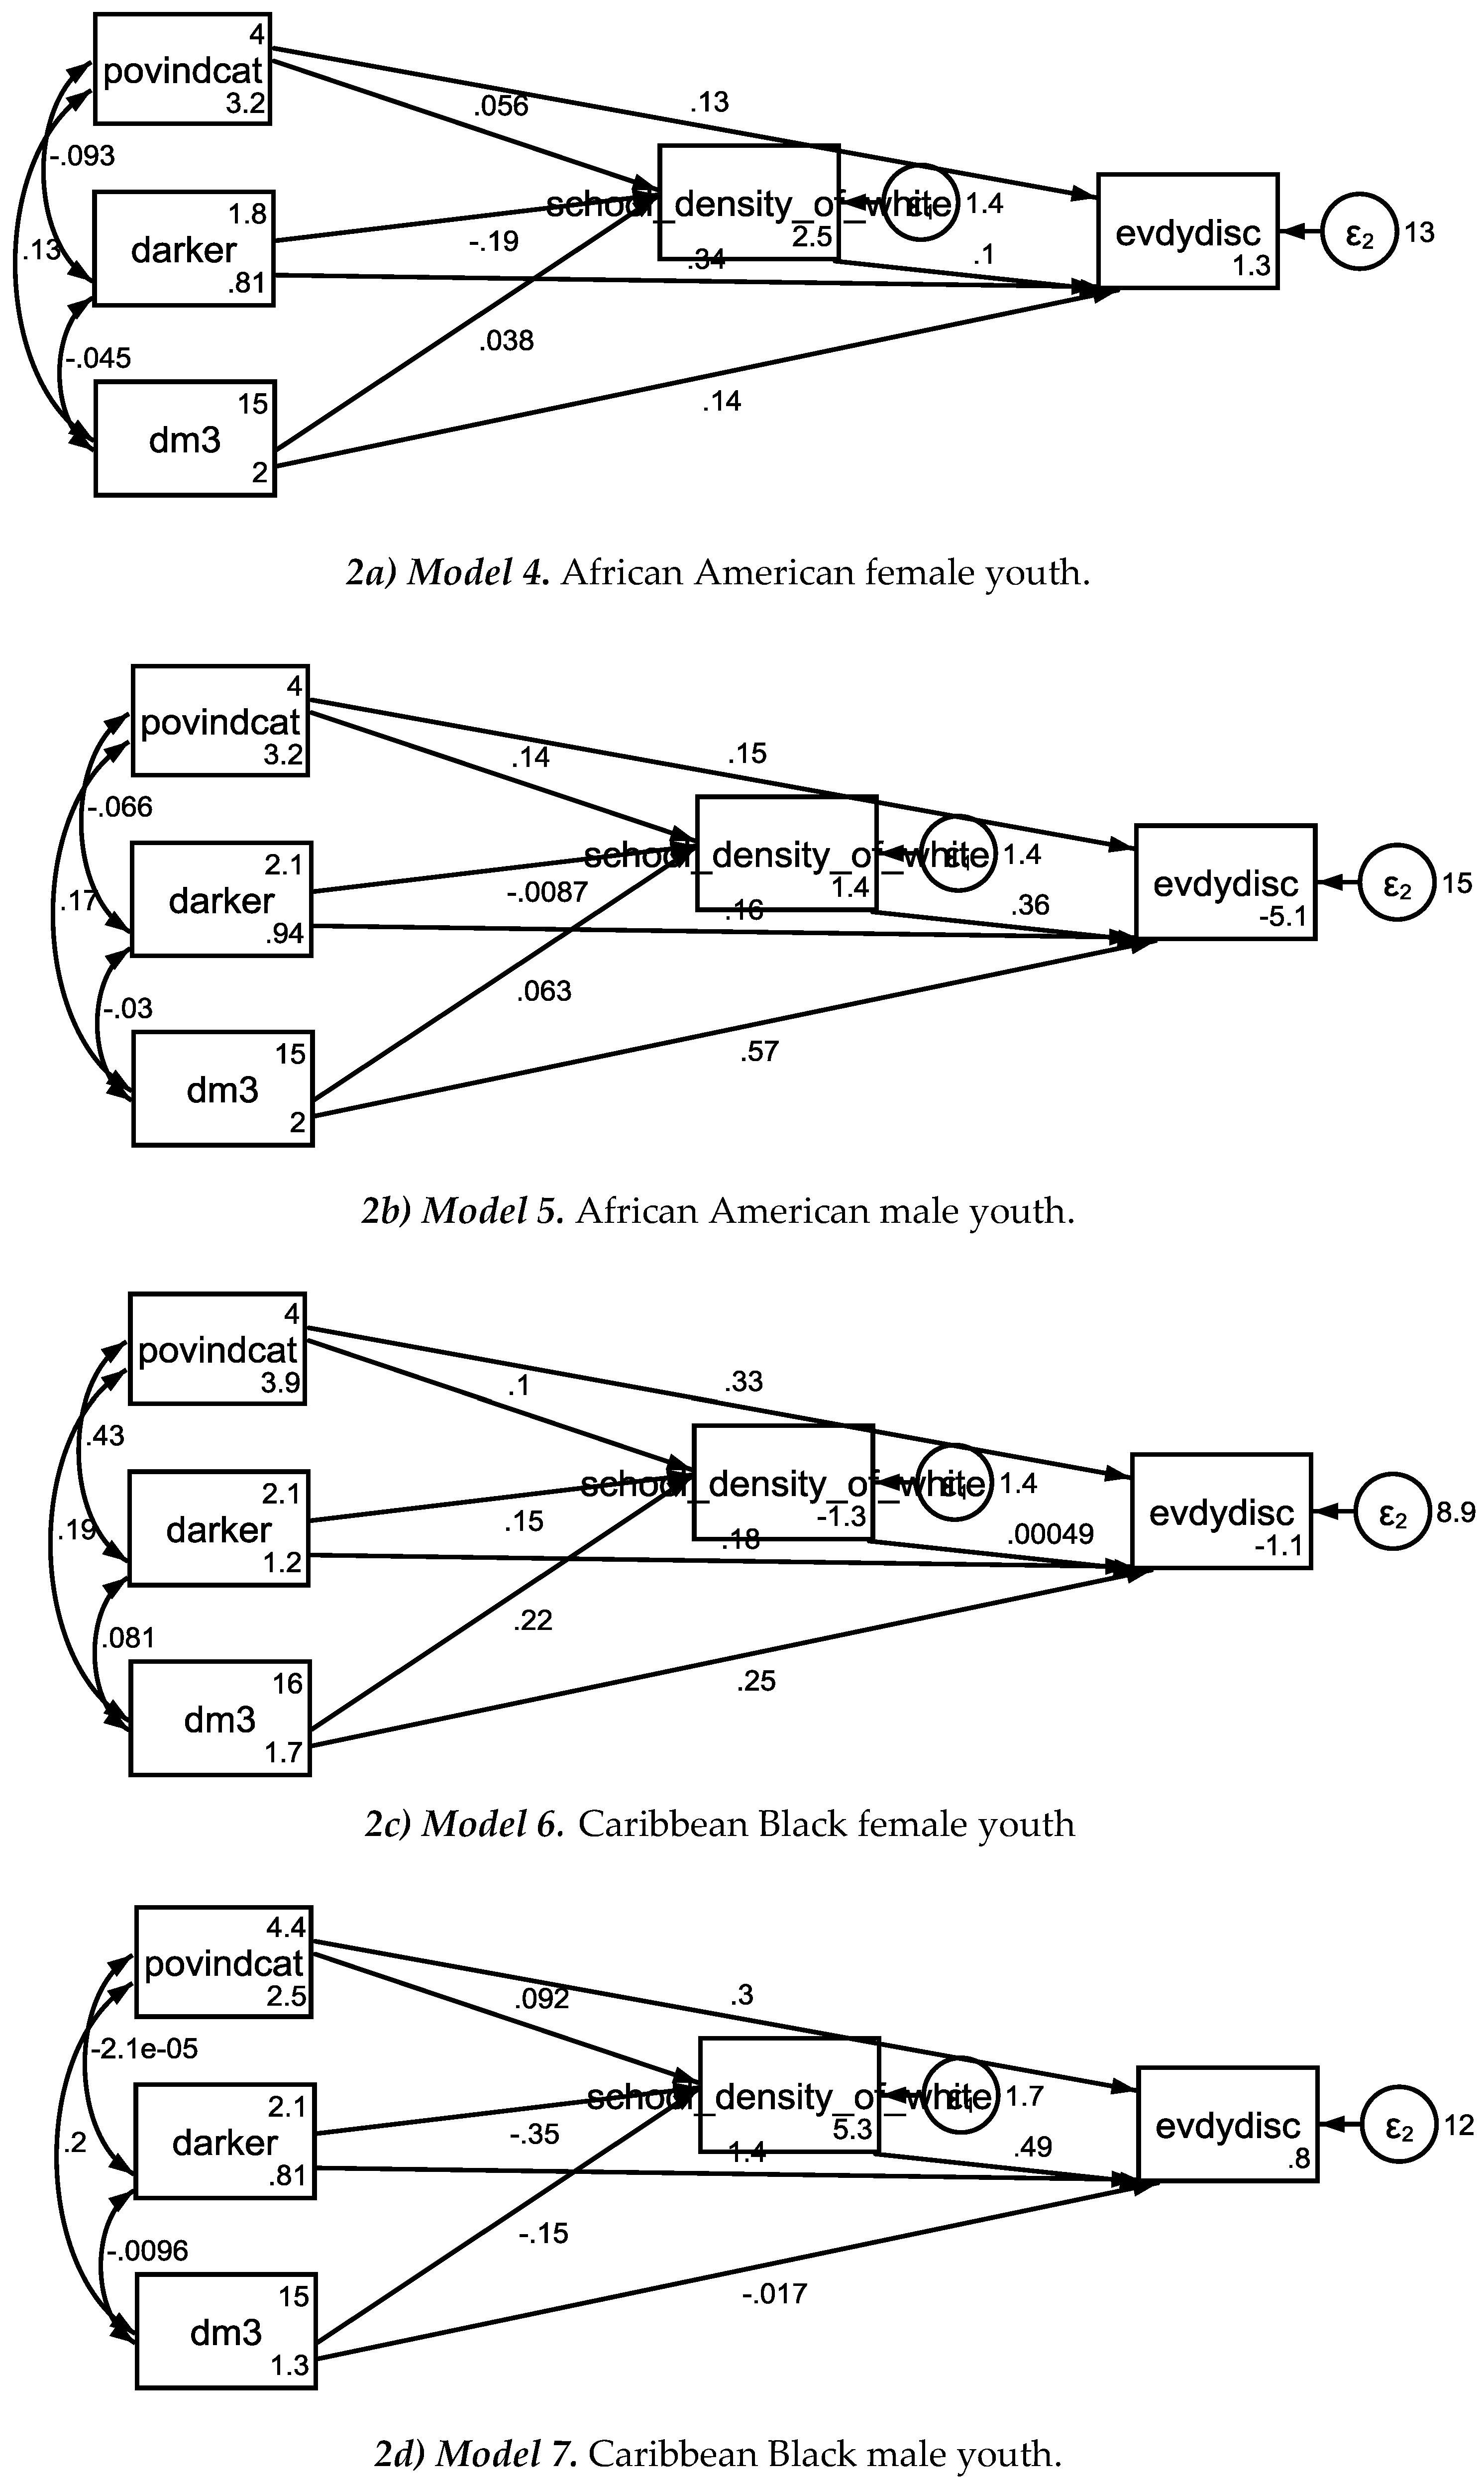
| Model 4 (African American Females) | |||||||
| Income-to-needs ratio | School Density | 0.06 | 0.04 | −0.01 | 0.13 | 1.58 | 0.114 |
| Skin Color (Dark) | School Density | −0.19 | 0.07 | −0.32 | −0.05 | −2.74 | 0.006 |
| Age | School Density | 0.04 | 0.05 | −0.05 | 0.13 | 0.82 | 0.414 |
| Intercept | School Density | 2.53 | 0.75 | 1.07 | 4.00 | 3.40 | 0.001 |
| School density (Percentages of Whites) | Perceived Discrimination | 0.10 | 0.16 | −0.22 | 0.42 | 0.62 | 0.537 |
| Income-to-needs ratio | Perceived Discrimination | 0.13 | 0.11 | −0.08 | 0.34 | 1.20 | 0.230 |
| Skin Color (Dark) | Perceived Discrimination | 0.34 | 0.22 | −0.08 | 0.77 | 1.59 | 0.112 |
| Age | Perceived Discrimination | 0.14 | 0.14 | −0.13 | 0.41 | 0.99 | 0.321 |
| Intercept | Perceived Discrimination | 1.33 | 2.26 | −3.09 | 5.75 | 0.59 | 0.555 |
| Model 5 (African American Males) | |||||||
| Income-to-needs ratio | School Density | 0.14 | 0.04 | 0.07 | 0.22 | 3.86 | 0.000 |
| Skin Color (Dark) | School Density | −0.01 | 0.07 | −0.15 | 0.13 | −0.12 | 0.902 |
| Age | School Density | 0.06 | 0.04 | −0.02 | 0.15 | 1.45 | 0.147 |
| Intercept | School Density | 1.41 | 0.66 | 0.12 | 2.70 | 2.13 | 0.033 |
| School density (Percentages of Whites) | Perceived Discrimination | 0.36 | 0.19 | −0.01 | 0.73 | 1.93 | 0.050 |
| Income-to-needs ratio | Perceived Discrimination | 0.15 | 0.12 | −0.08 | 0.37 | 1.24 | 0.213 |
| Skin Color (Dark) | Perceived Discrimination | 0.16 | 0.22 | −0.27 | 0.58 | 0.71 | 0.475 |
| Age | Perceived Discrimination | 0.57 | 0.14 | 0.30 | 0.85 | 4.05 | 0.000 |
| Intercept | Perceived Discrimination | −5.14 | 2.09 | −9.23 | −1.05 | −2.46 | 0.014 |
| Model 6 (Caribbean Black Females) | |||||||
| Income-to-needs ratio | School Density | 0.10 | 0.09 | −0.07 | 0.27 | 1.17 | 0.243 |
| Skin Color (Dark) | School Density | 0.15 | 0.16 | −0.16 | 0.47 | 0.96 | 0.337 |
| Age | School Density | 0.22 | 0.12 | −0.02 | 0.46 | 1.77 | 0.077 |
| Intercept | School Density | −1.30 | 1.87 | −4.97 | 2.36 | −0.70 | 0.485 |
| School density (Percentages of Whites) | Perceived Discrimination | 0.00 | 0.22 | −0.43 | 0.44 | 0.00 | 0.998 |
| Income-to-needs ratio | Perceived Discrimination | 0.33 | 0.13 | 0.07 | 0.60 | 2.51 | 0.012 |
| Skin Color (Dark) | Perceived Discrimination | 0.18 | 0.28 | −0.38 | 0.73 | 0.62 | 0.535 |
| Age | Perceived Discrimination | 0.25 | 0.23 | −0.19 | 0.70 | 1.12 | 0.261 |
| Intercept | Perceived Discrimination | −1.13 | 3.29 | −7.58 | 5.31 | −0.34 | 0.730 |
| Model 7 (Caribbean Black Males) | |||||||
| Income-to-needs ratio | School Density | 0.09 | 0.14 | −0.18 | 0.36 | 0.67 | 0.502 |
| Skin Color (Dark) | School Density | −0.35 | 0.24 | −0.82 | 0.12 | −1.45 | 0.148 |
| Age | School Density | −0.15 | 0.12 | −0.38 | 0.08 | −1.25 | 0.210 |
| Intercept | School Density | 5.28 | 2.03 | 1.30 | 9.27 | 2.60 | 0.009 |
| School density (Percentages of Whites) | Perceived Discrimination | 0.49 | 0.35 | −0.19 | 1.18 | 1.41 | 0.157 |
| Income to needs ratio | Perceived Discrimination | 0.30 | 0.26 | −0.22 | 0.82 | 1.14 | 0.255 |
| Skin Color (Dark) | Perceived Discrimination | 1.37 | 0.39 | 0.62 | 2.13 | 3.57 | 0.000 |
| Age | Perceived Discrimination | −0.02 | 0.30 | −0.60 | 0.57 | −0.06 | 0.954 |
| Intercept | Perceived Discrimination | 0.80 | 4.63 | −8.26 | 9.87 | 0.17 | 0.862 |
© 2018 by the author. Licensee MDPI, Basel, Switzerland. This article is an open access article distributed under the terms and conditions of the Creative Commons Attribution (CC BY) license (http://creativecommons.org/licenses/by/4.0/).
Share and Cite
Assari, S. Does School Racial Composition Explain Why High Income Black Youth Perceive More Discrimination? A Gender Analysis. Brain Sci. 2018, 8, 140. https://doi.org/10.3390/brainsci8080140
Assari S. Does School Racial Composition Explain Why High Income Black Youth Perceive More Discrimination? A Gender Analysis. Brain Sciences. 2018; 8(8):140. https://doi.org/10.3390/brainsci8080140
Chicago/Turabian StyleAssari, Shervin. 2018. "Does School Racial Composition Explain Why High Income Black Youth Perceive More Discrimination? A Gender Analysis" Brain Sciences 8, no. 8: 140. https://doi.org/10.3390/brainsci8080140
APA StyleAssari, S. (2018). Does School Racial Composition Explain Why High Income Black Youth Perceive More Discrimination? A Gender Analysis. Brain Sciences, 8(8), 140. https://doi.org/10.3390/brainsci8080140