Oxamate, but Not Selective Targeting of LDH-A, Inhibits Medulloblastoma Cell Glycolysis, Growth and Motility


Abstract
1. Introduction
2. Materials and Methods
3. Results
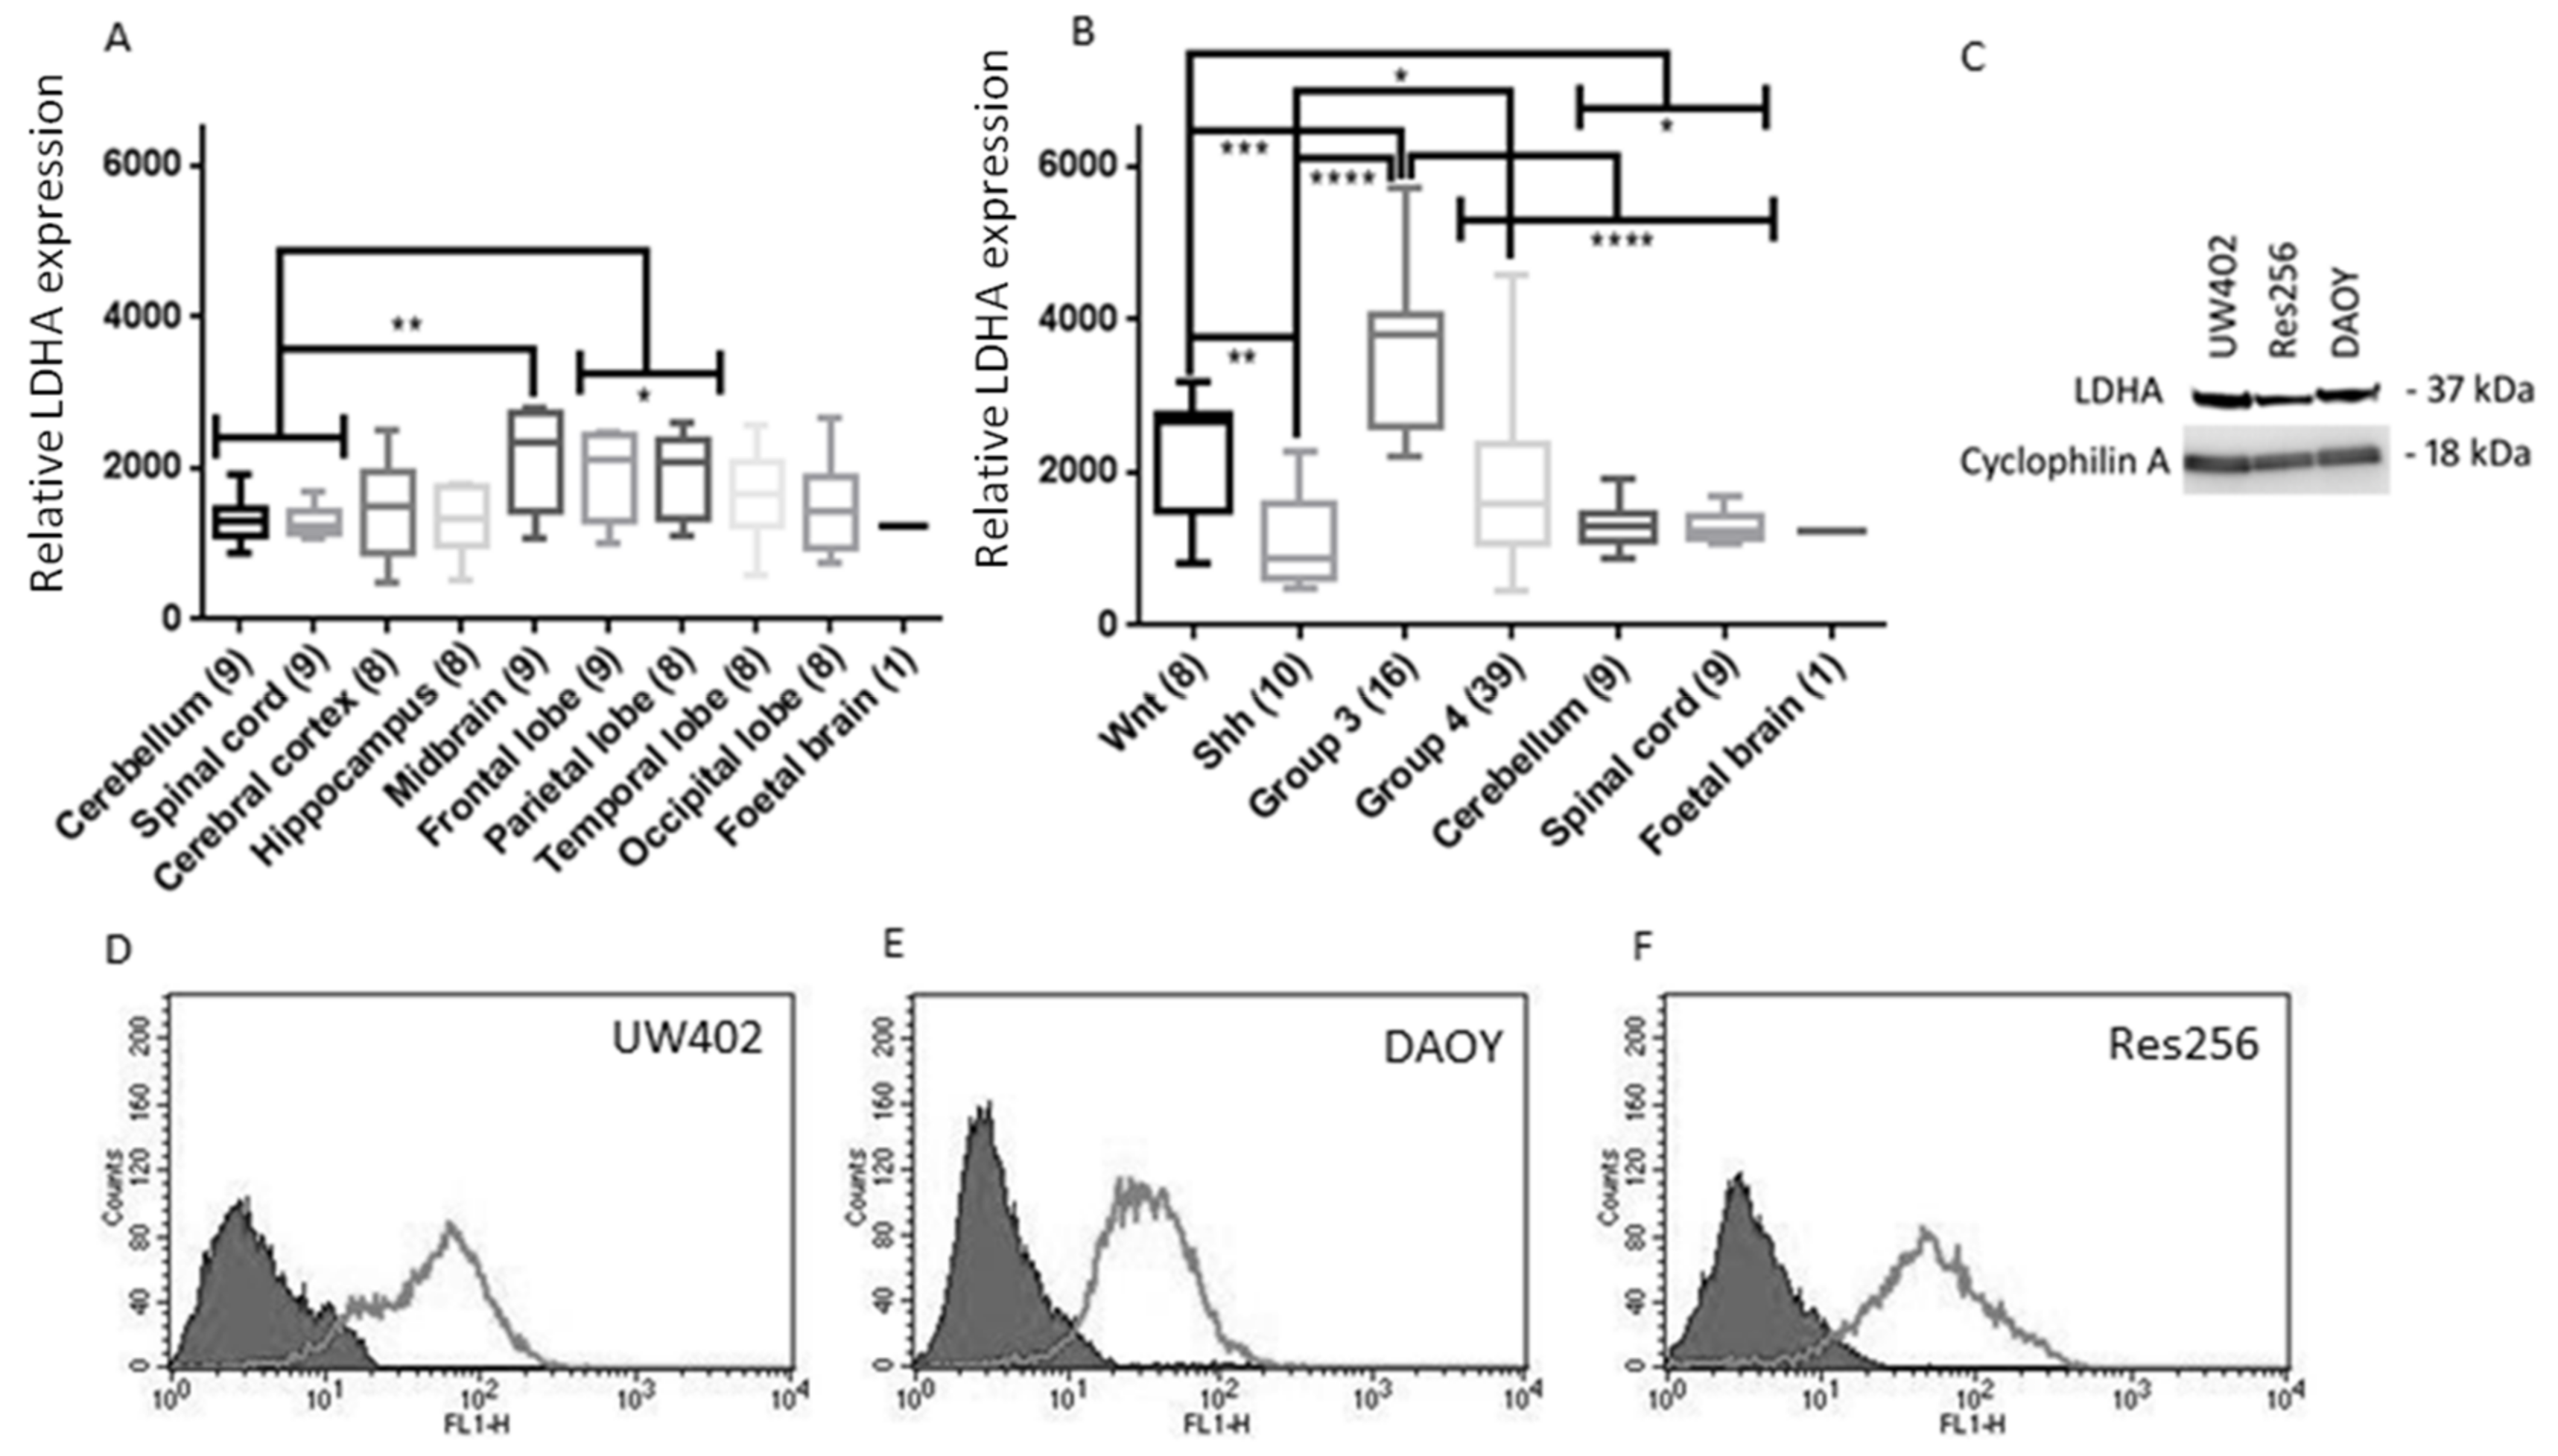
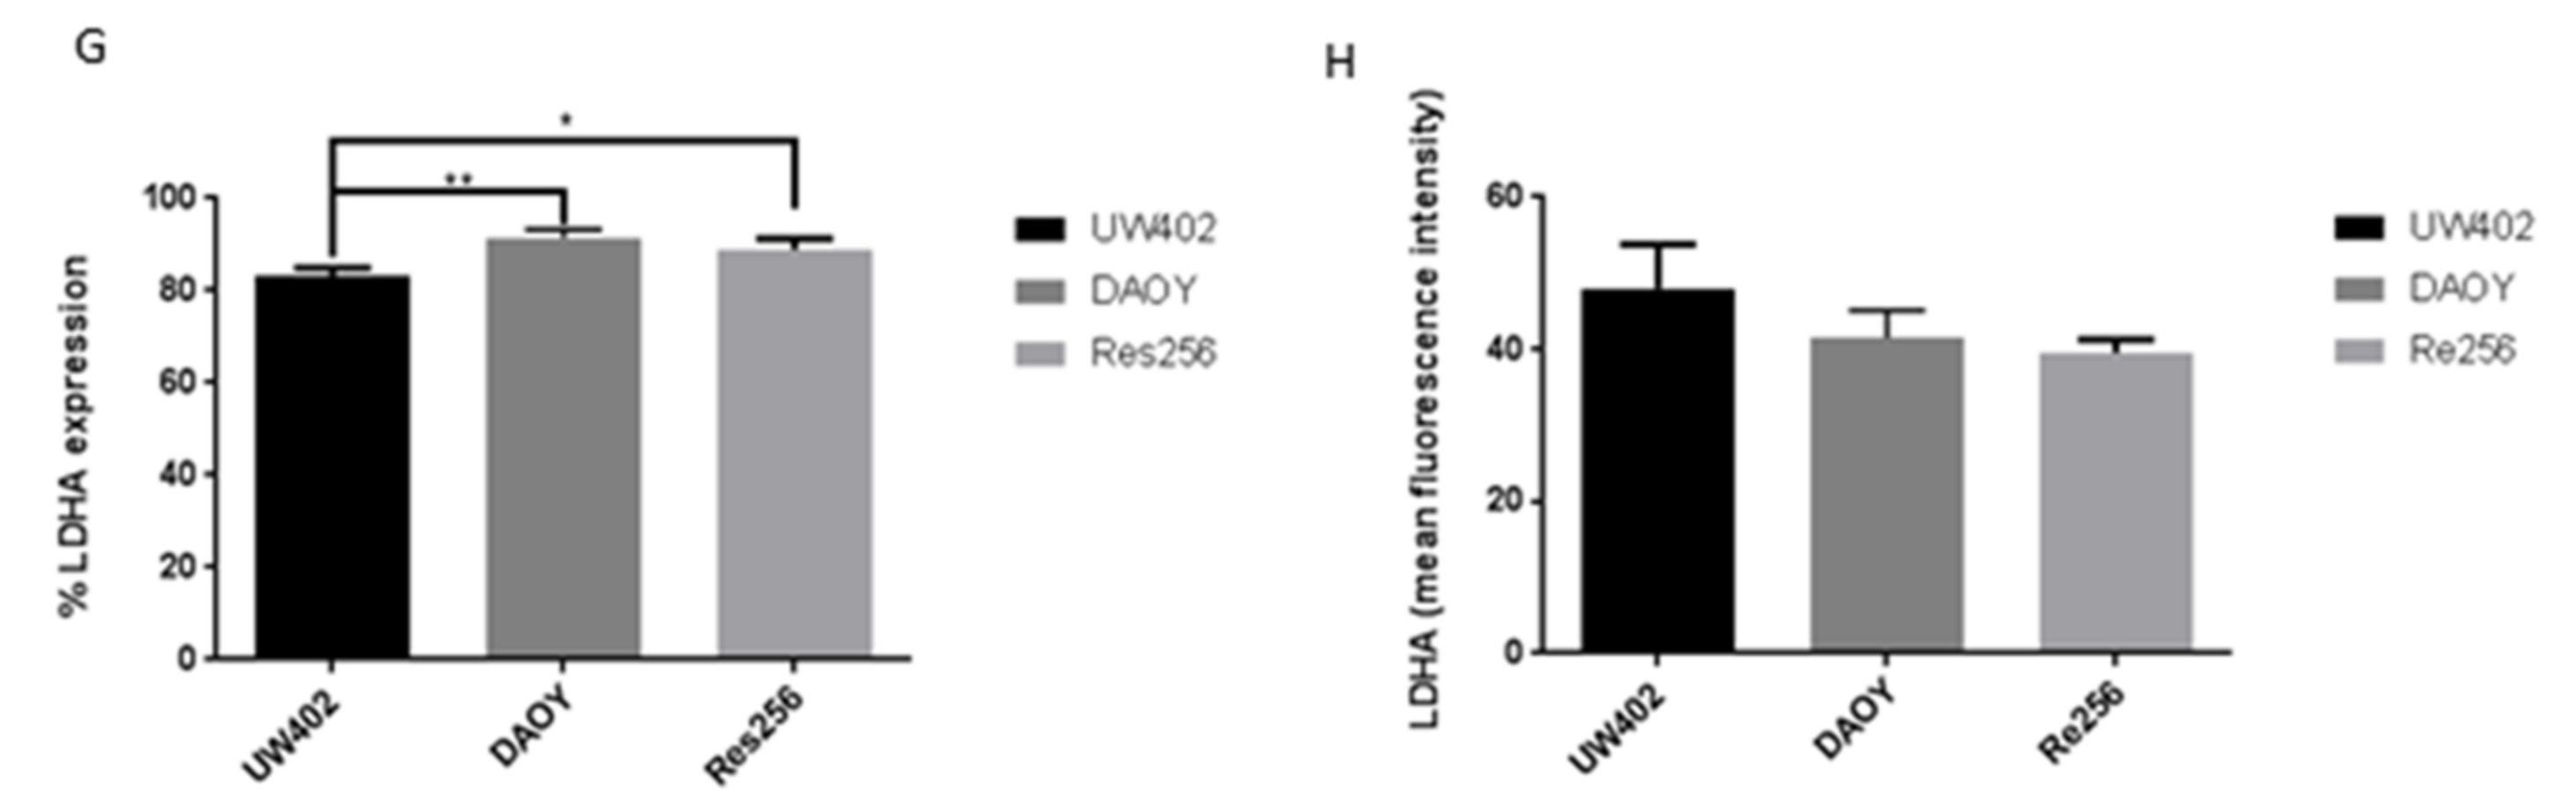
3.1. LDHA Expression in MB
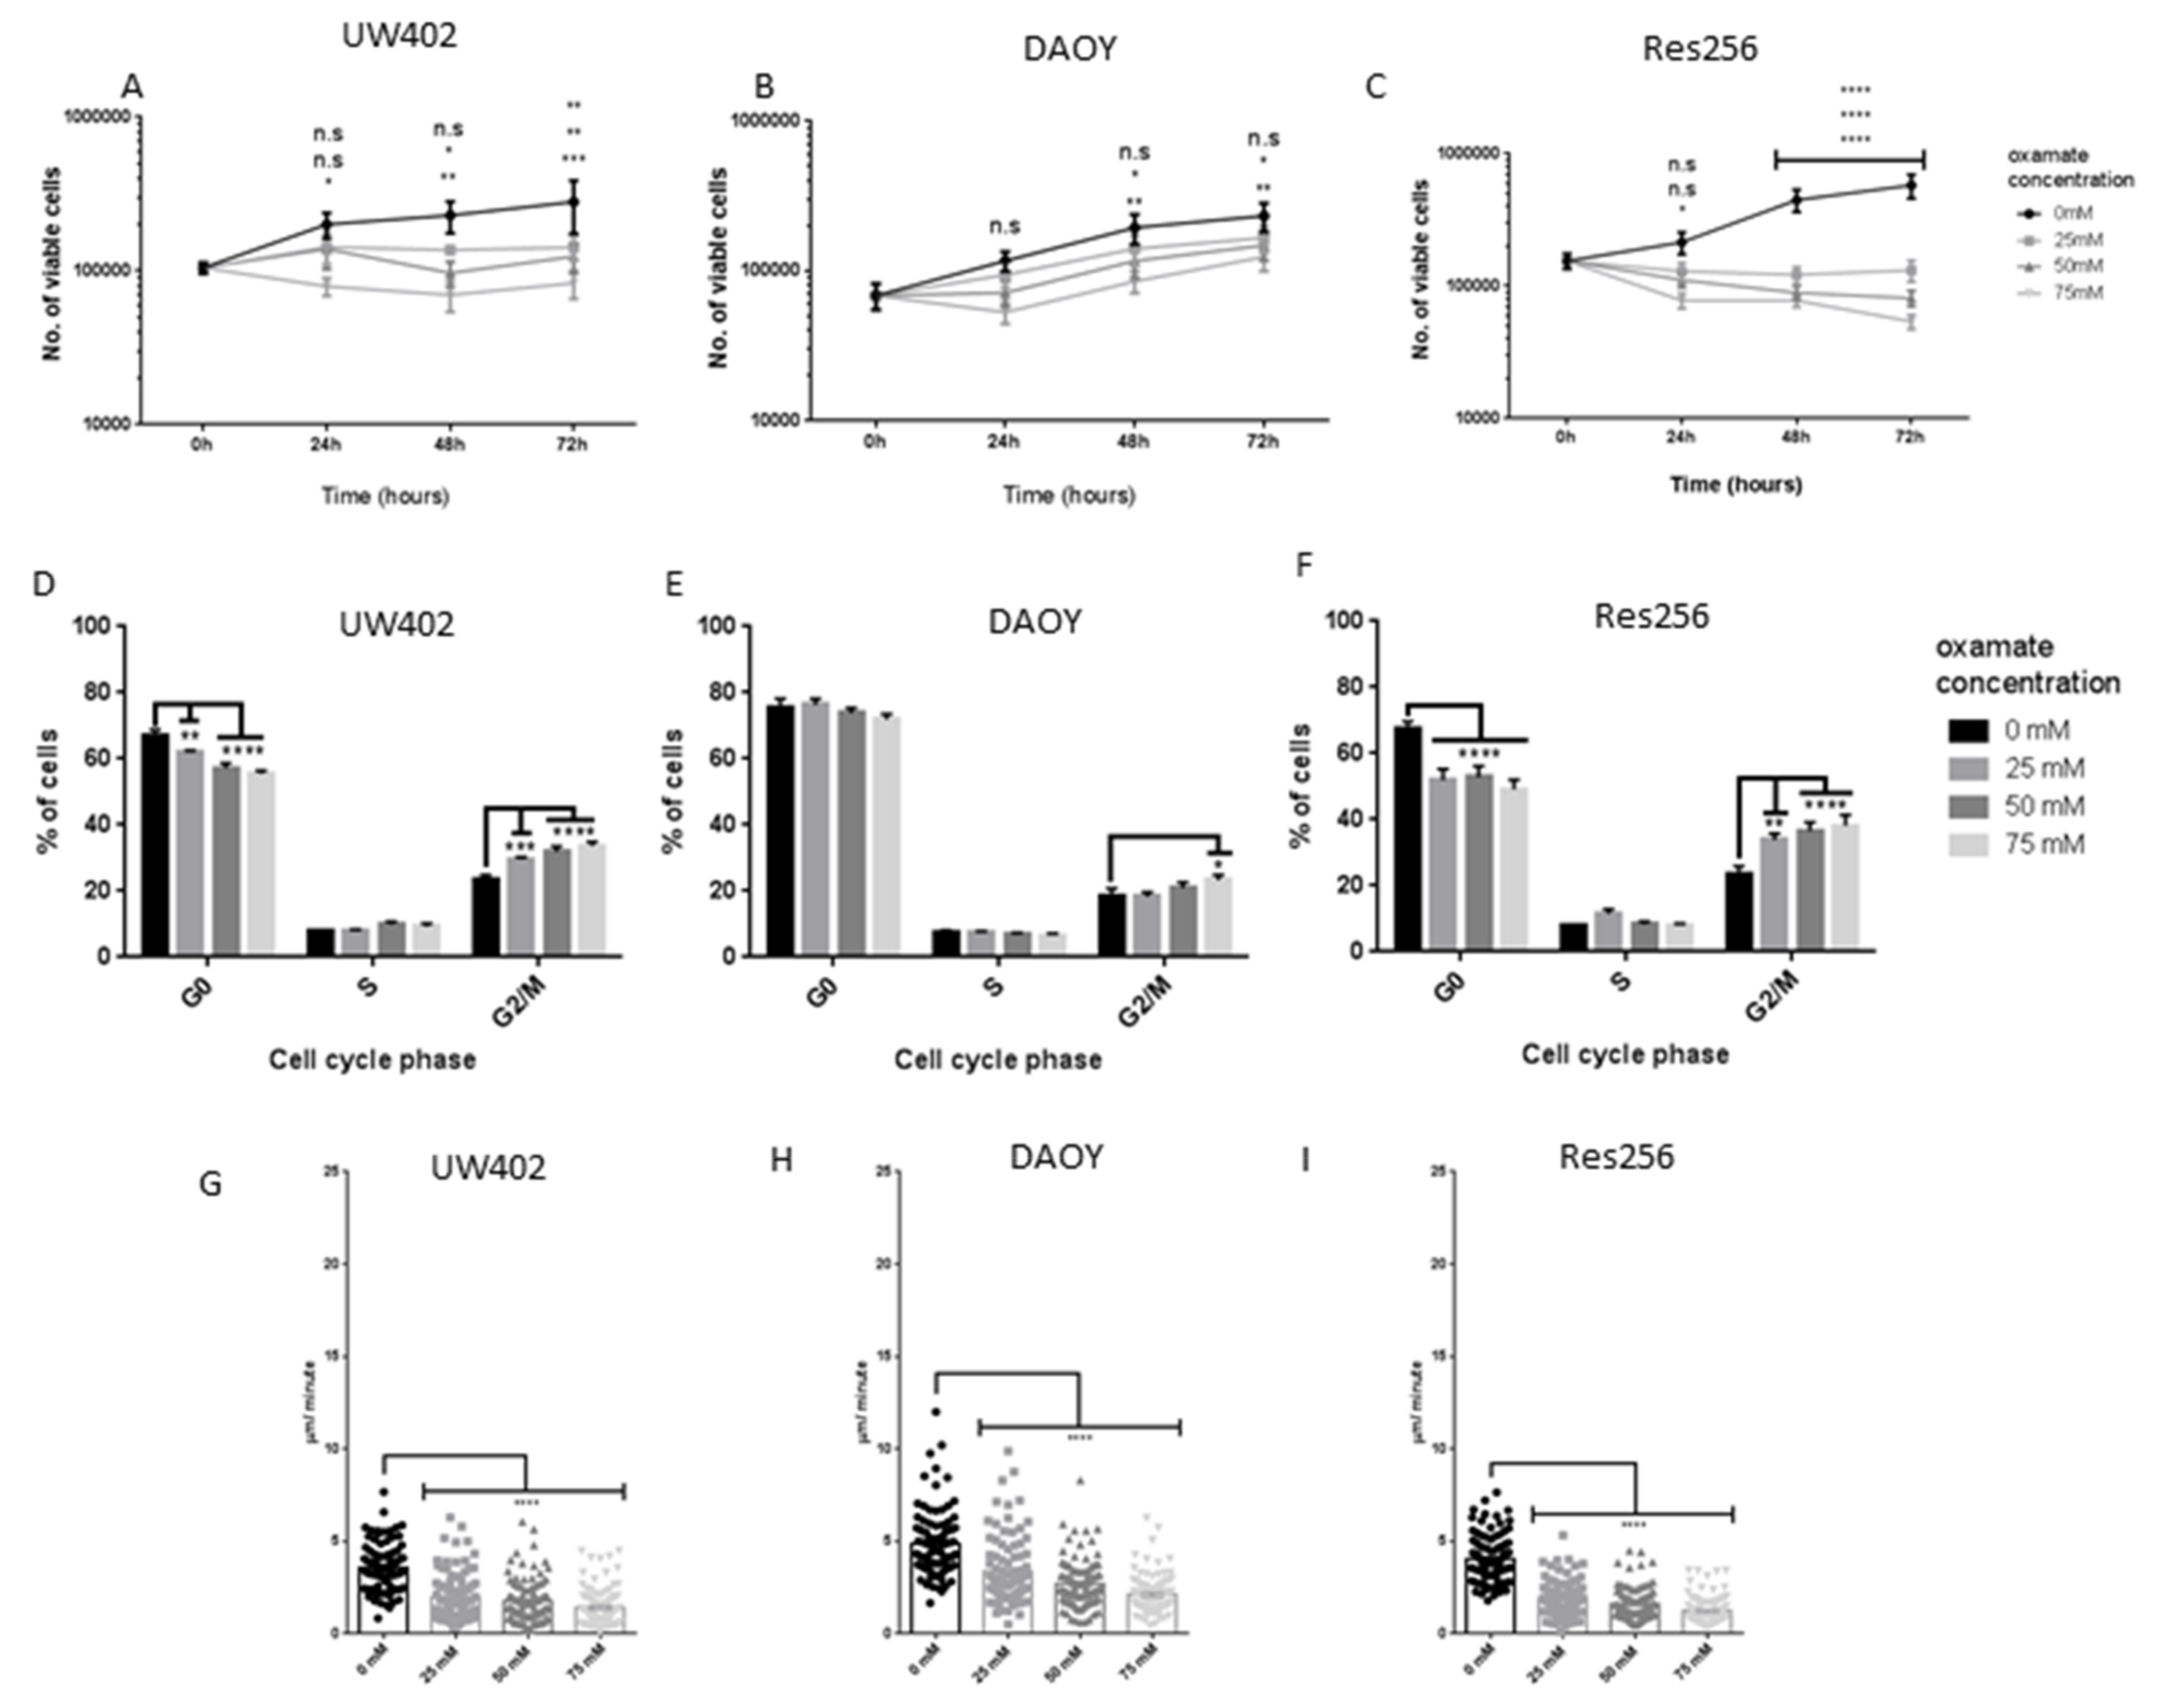
3.2. Oxamate Attenuates MB Proliferation
3.3. Oxamate Inhibits MB Cell Speed of Migration
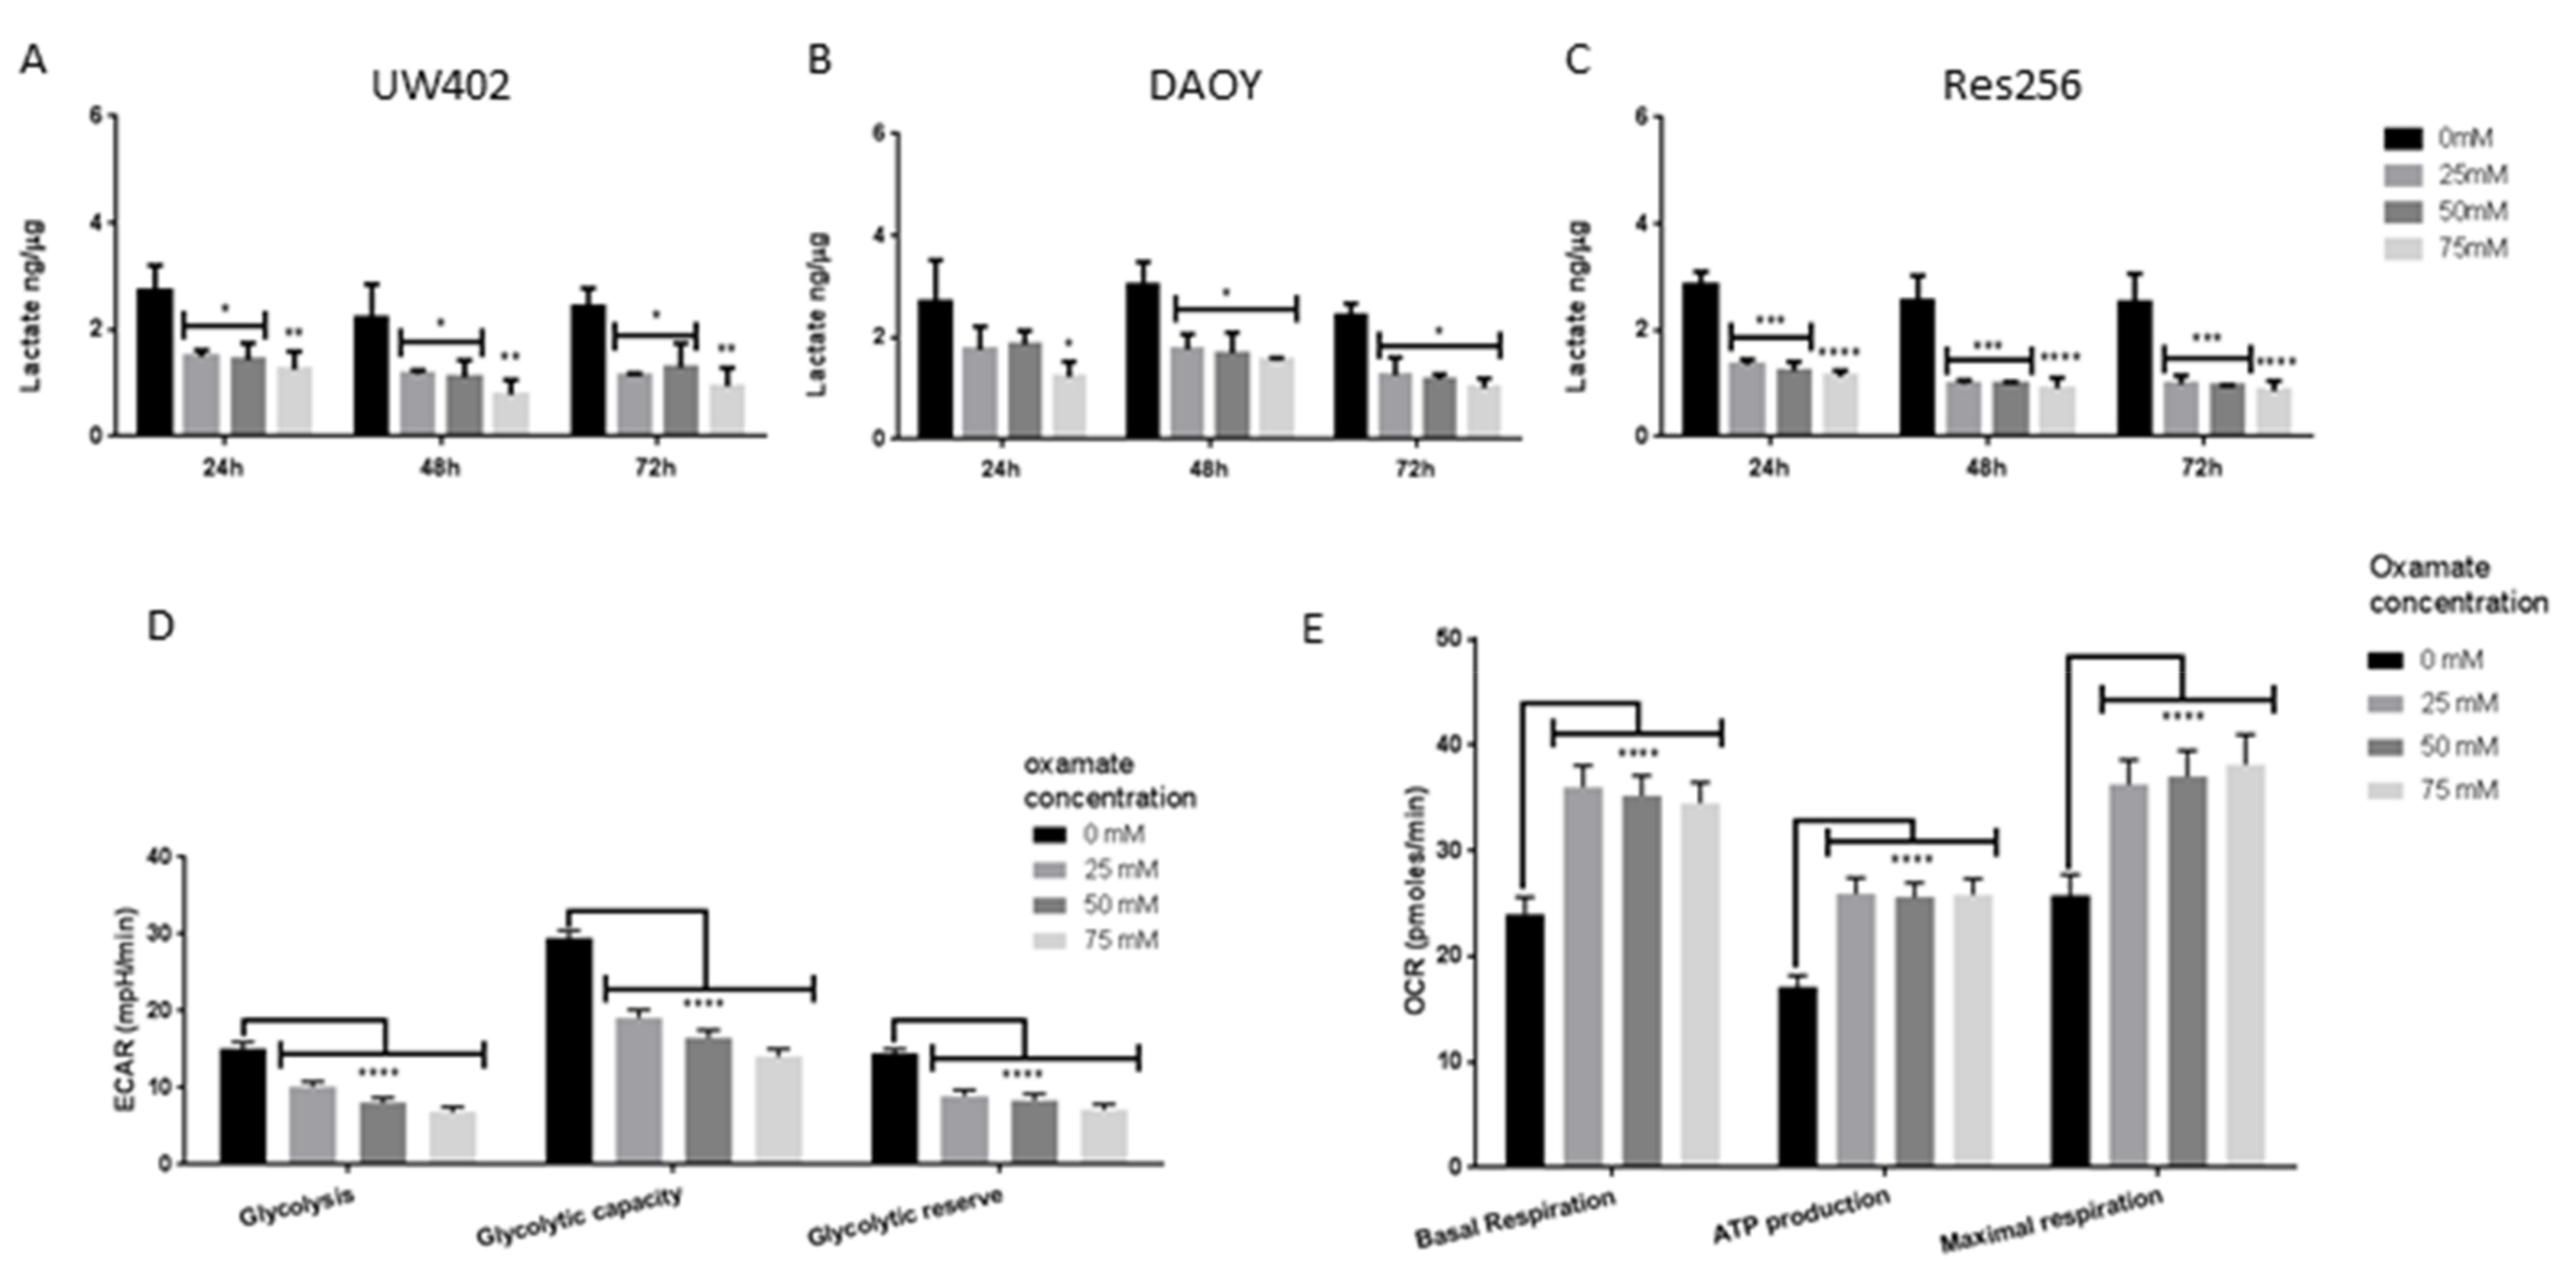
3.4. Oxamate Inhibits MB Aerobic Glycolysis and Promotes OXPHOS
3.5. Oxamate and LDHA as a Therapeutic Target for MB
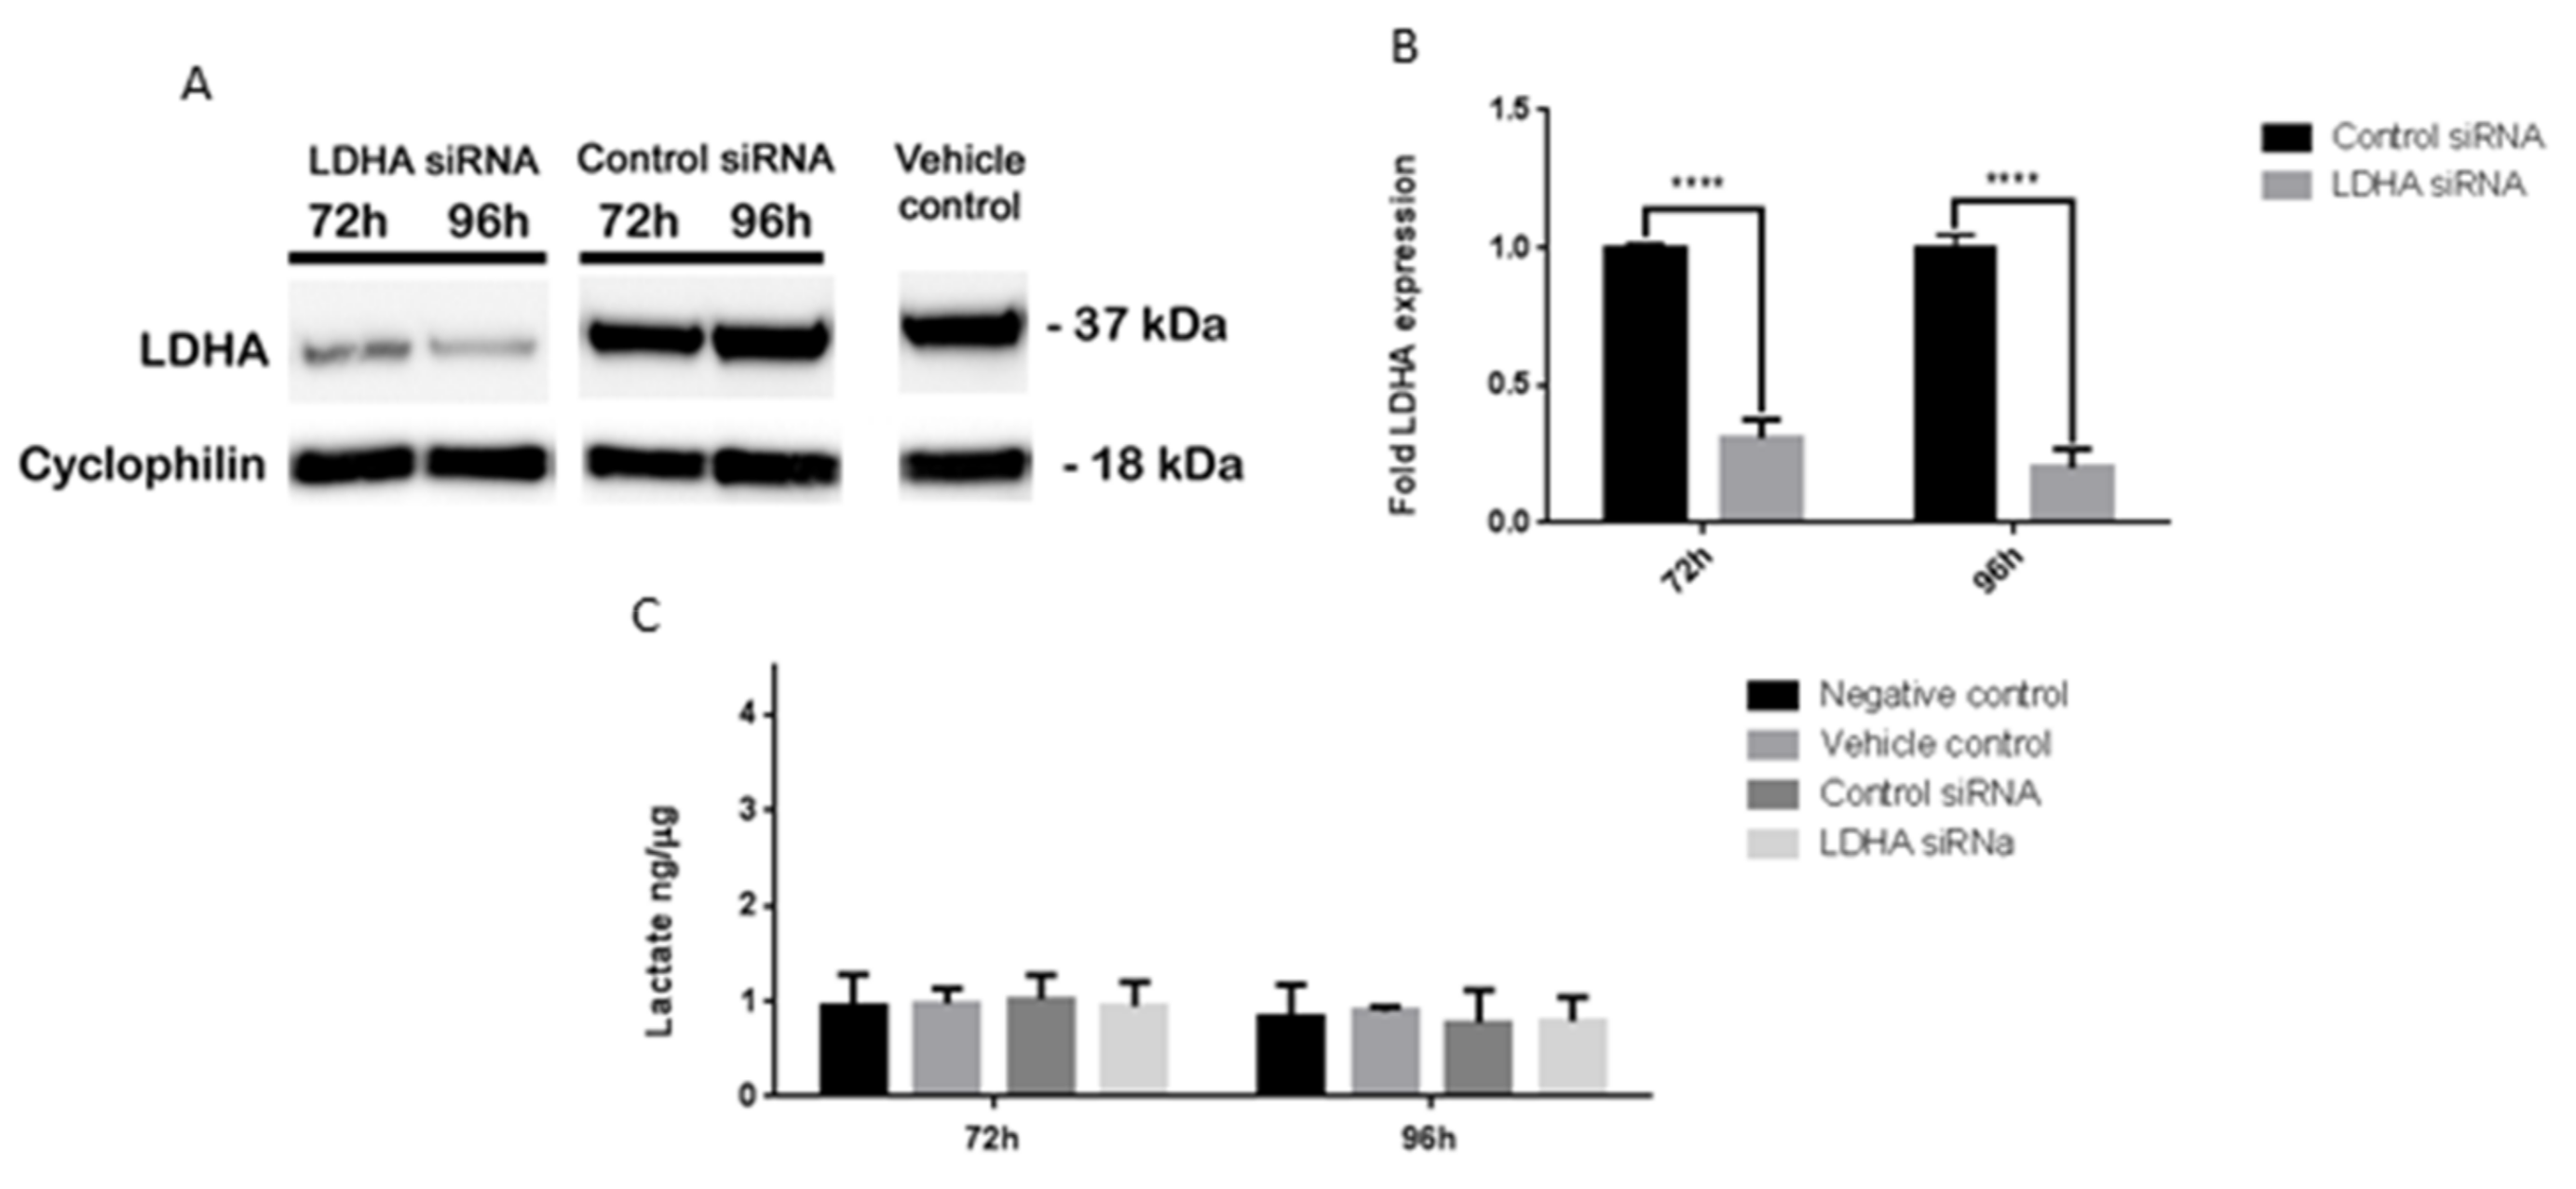
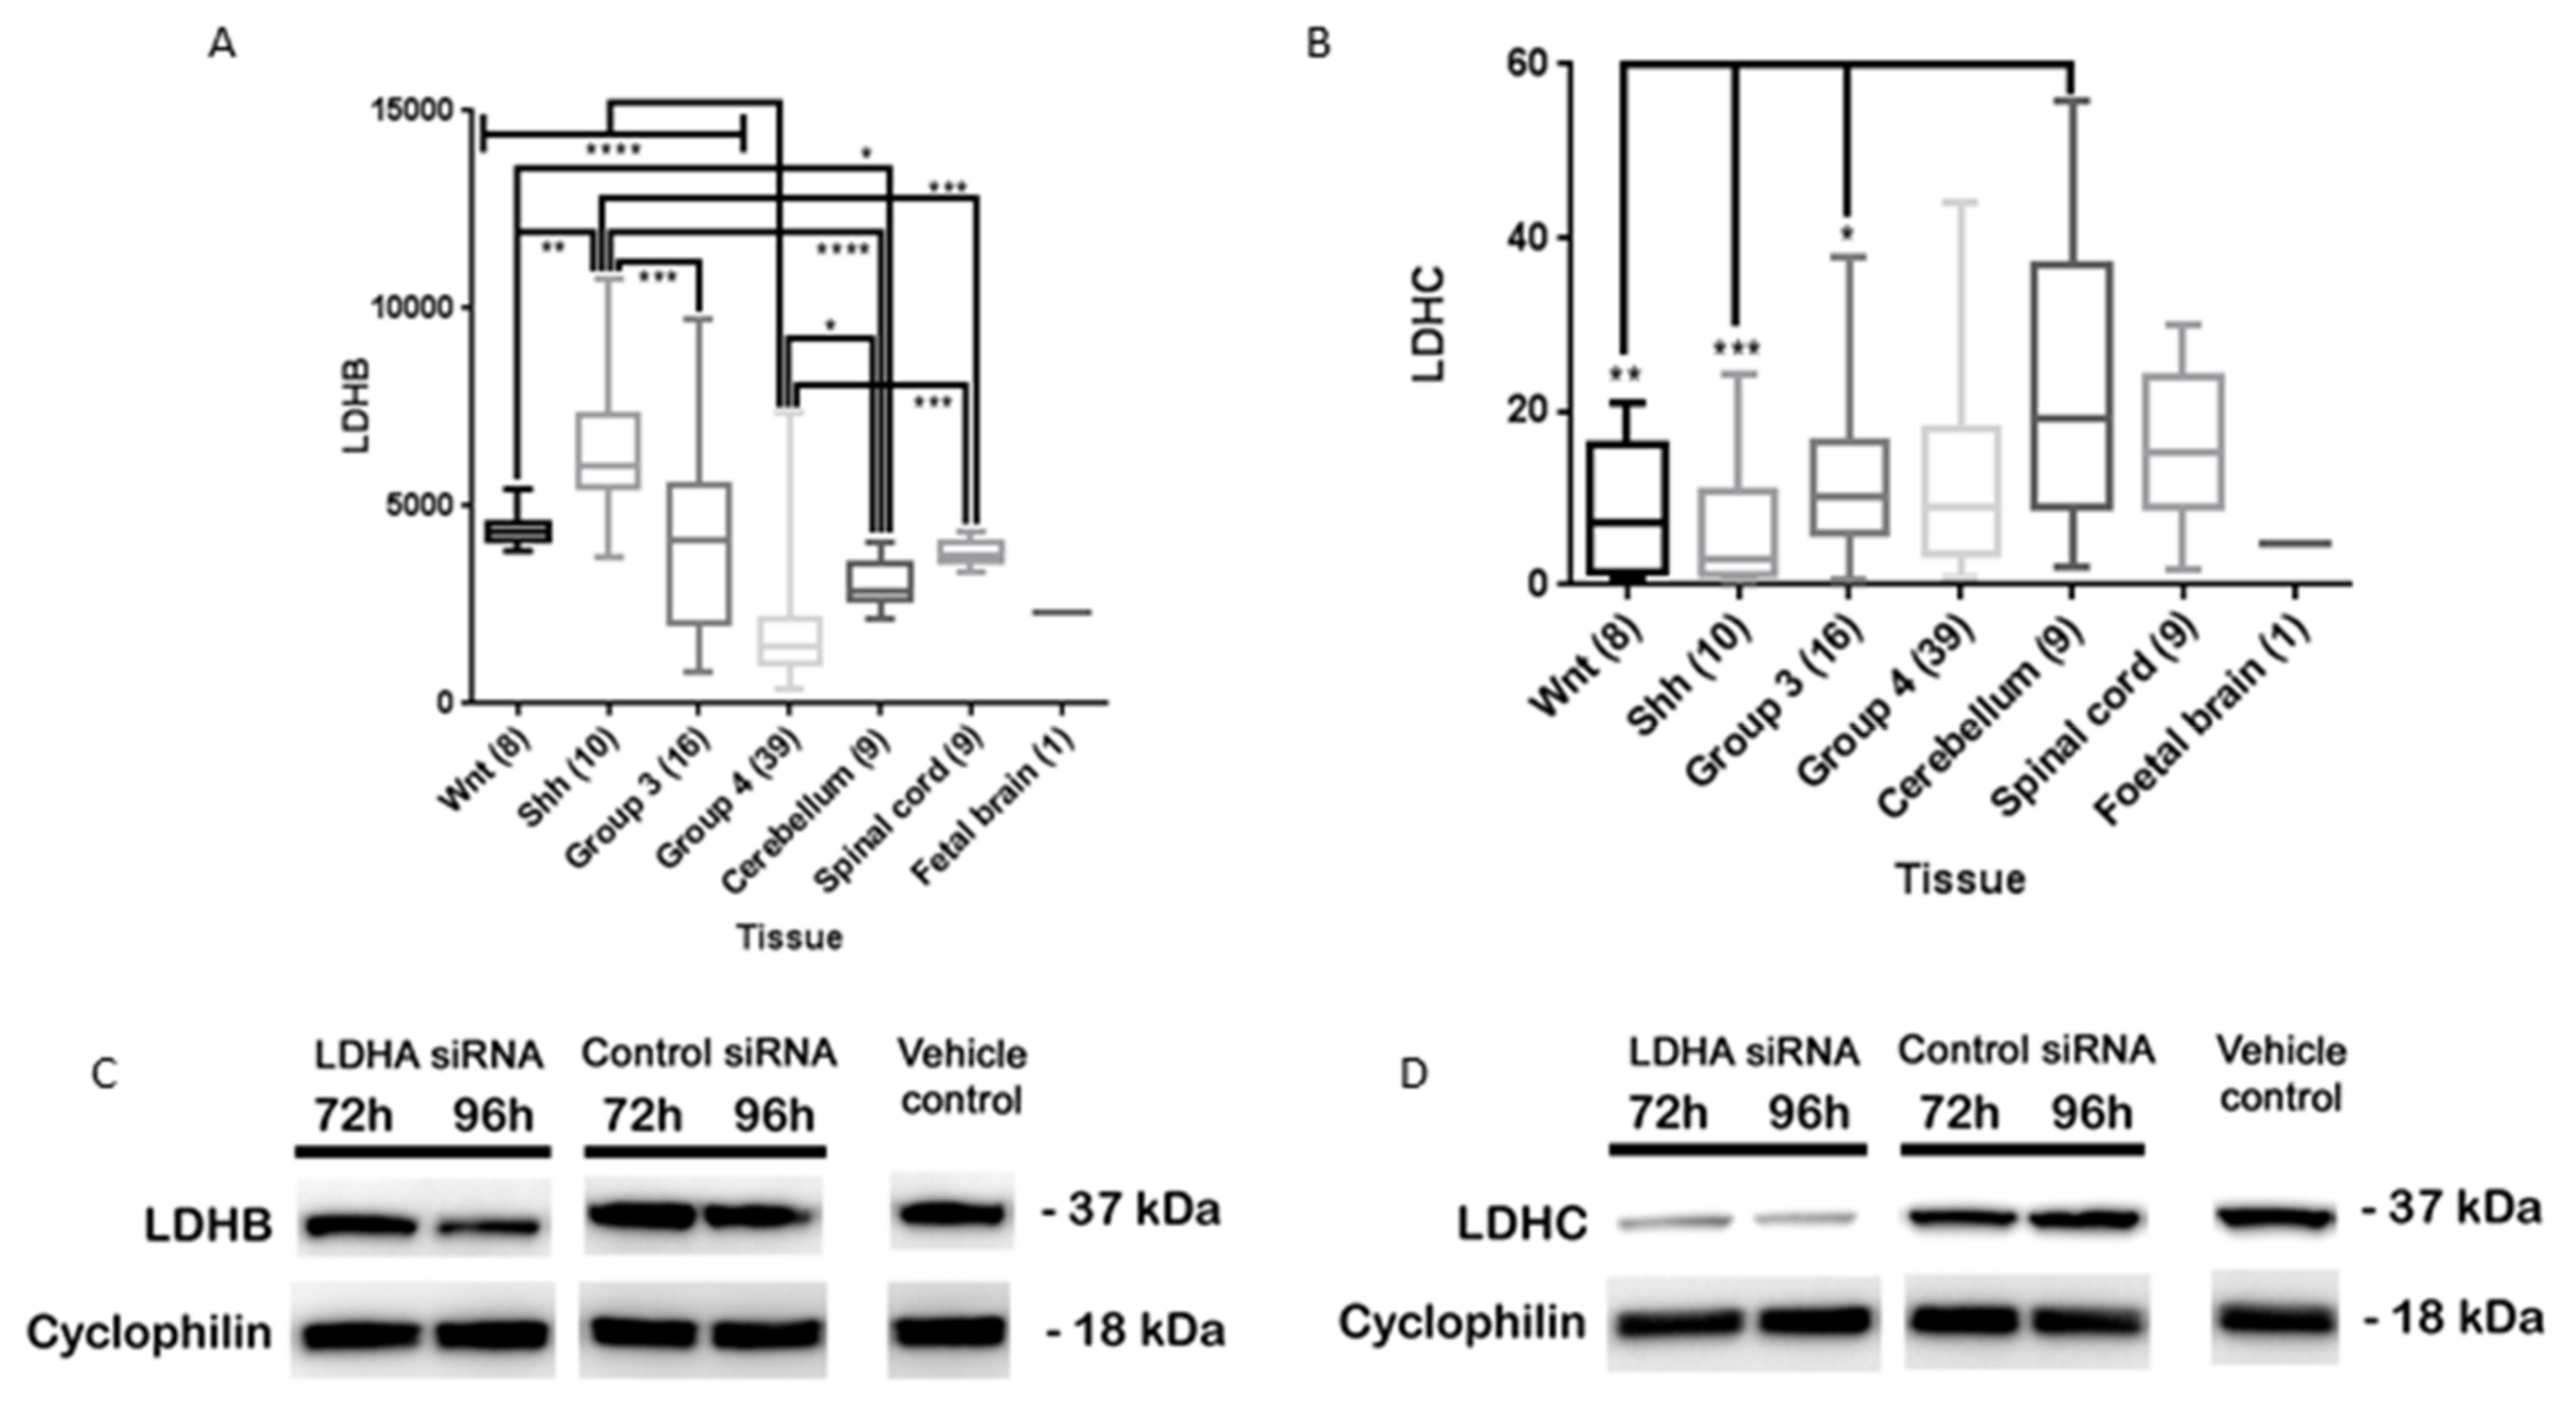
3.6. LDHA siRNA Does Not Inhibit MB Viability, Cell Migration or Metabolism
4. Discussion
5. Conclusions
Acknowledgments
Author Contributions
Conflicts of Interest
References
- Louis, D.N.; Ohgaki, H.; Wiestler, O.D.; Cavenee, W.K.; Burger, P.C.; Jouvet, A.; Kleihues, P. The 2007 WHO classification of tumours of the central nervous system. Acta Neuropathol. 2007, 114, 97–109. [Google Scholar] [CrossRef] [PubMed]
- Taylor, M.D.; Northcott, P.A.; Korshunov, A.; Remke, M.; Cho, Y.J.; Clifford, S.C.; Eberhart, C.G.; Parsons, D.W.; Rutkowski, S.; Gajjar, A.; et al. Molecular subgroups of medulloblastoma: The current consensus. Acta Neuropathol. 2012, 123, 465–472. [Google Scholar] [CrossRef] [PubMed]
- Pickles, J.C.; Hawkins, C.; Pietsch, T.; Jacques, T.S. CNS embryonal tumours: WHO 2016 and beyond. Neuropathol. Appl. Neurobiol. 2017, 26. (In English) [Google Scholar] [CrossRef] [PubMed]
- Kumar, V.; McGuire, T.; Coulter, D.W.; Sharp, J.G.; Mahato, R.I. Challenges and recent advances in medulloblastoma therapy. Trends Pharmacol. Sci. 2017, 38, 1061–1084. (In English) [Google Scholar] [CrossRef] [PubMed]
- Smee, R.I.; Williams, J.R.; De-Loyde, K.J.; Meagher, N.S.; Cohn, R. Medulloblastoma: Progress over time. J. Med. Imaging Radiat. Oncol. 2012, 56, 227–234. [Google Scholar] [CrossRef] [PubMed]
- Warburg, O. On respiratory impairment in cancer cells. Science 1956, 124, 269–270. [Google Scholar] [PubMed]
- Kim, J.W.; Dang, C.V. Cancer’s molecular sweet tooth and the Warburg effect. Cancer Res. 2006, 66, 8927–8930. [Google Scholar] [CrossRef] [PubMed]
- Valvona, C.J.; Fillmore, H.L.; Nunn, P.B.; Pilkington, G.J. The Regulation and Function of Lactate Dehydrogenase A: Therapeutic Potential in Brain Tumor. Brain Pathol. 2016, 26, 3–17. [Google Scholar] [CrossRef] [PubMed]
- Gershon, T.R.; Crowther, A.J.; Tikunov, A.; Garcia, I.; Annis, R.; Yuan, H.; Miller, C.R.; Macdonald, J.; Olson, J.; Deshmukh, M. Hexokinase-2-mediated aerobic glycolysis is integral to cerebellar neurogenesis and pathogenesis of medulloblastoma. Cancer Metab. 2013, 1. [Google Scholar] [CrossRef] [PubMed]
- Bhatia, B.; Hsieh, M.; Kenney, A.M.; Nahlé, Z. Mitogenic Sonic hedgehog signaling drives E2F1-dependent lipogenesis in progenitor cells and medulloblastoma. Oncogene 2011, 30, 410–422. [Google Scholar] [CrossRef] [PubMed]
- Blüml, S.; Margol, A.S.; Sposto, R.; Kennedy, R.J.; Robison, N.J.; Vali, M.; Hung, L.T.; Muthugounder, S.; Finlay, J.L.; Erdreich-Epstein, A.; et al. Molecular subgroups of medulloblastoma identification using noninvasive magnetic resonance spectroscopy. Neuro Oncol. 2015, 18, 126–131. [Google Scholar] [CrossRef] [PubMed]
- Peet, A.C.; Davies, N.P.; Ridley, L.; Brundler, M.A.; Kombogiorgas, D.; Lateef, S.; Natarajan, K.; Sgouros, S.; MacPherson, L.; Grundy, R.G. Magnetic resonance spectroscopy suggests key differences in the metastatic behaviour of medulloblastoma. Eur. J. Cancer 2007, 43, 1037–1044. [Google Scholar] [CrossRef] [PubMed]
- Li, K.K.; Pang, J.C.; Ching, A.K.; Wong, C.K.; Kong, X.; Wang, Y.; Zhou, L.; Chen, Z.; Ng, H.K. miR-124 is frequently down-regulated in medulloblastoma and is a negative regulator of SLC16A1. Hum. Pathol. 2009, 40, 1234–1243. [Google Scholar] [CrossRef] [PubMed]
- Esen, E.; Chen, J.; Karner, C.M.; Okunade, A.L.; Patterson, B.W.; Long, F. WNT-LRP5 signaling induces Warburg effect through mTORC2 activation during osteoblast differentiation. Cell Metab. 2013, 17, 745–755. [Google Scholar] [CrossRef] [PubMed]
- Pate, K.T.; Stringari, C.; Sprowl-Tanio, S.; Wang, K.; TeSlaa, T.; Hoverter, N.P.; McQuade, M.M.; Garner, C.; Digman, M.A.; Teitell, M.A.; et al. Wnt signaling directs a metabolic program of glycolysis and angiogenesis in colon cancer. EMBO J. 2014, 33, 1454–1473. [Google Scholar] [CrossRef] [PubMed]
- Dang, C.V.; Le, A.; Gao, P. MYC-induced cancer cell energy metabolism and therapeutic opportunities. Clin. Cancer Res. 2009, 15, 6479–6483. [Google Scholar] [CrossRef] [PubMed]
- Shim, H.; Dolde, C.; Lewis, B.C.; Wu, C.S.; Dang, G.; Jungmann, R.A.; Dalla-Favera, R.; Dang, C.V. c-Myc transactivation of LDH-A: Implications for tumor metabolism and growth. Proc. Natl. Acad. Sci. USA 1997, 94, 6658–6663. [Google Scholar] [CrossRef] [PubMed]
- Papaconstantinou, J.; Colowick, S.P. The role of glycolysis in the growth of tumor cells. II. The effect of oxamic acid on the growth of HeLa cells in tissue culture. J. Biol. Chem. 1961, 236, 285–288. [Google Scholar] [PubMed]
- R2: Genomics Analysis and Visualization Platform. Available online: https://hgserver1.amc.nl/cgi-bin/r2/main.cgi (accessed on 29 March 2018).
- Gebäck, T.; Schulz, M.M.; Koumoutsakos, P.; Detmar, M. TScratch: A novel and simple software tool for automated analysis of monolayer wound healing assays. Biotechniques 2009, 46, 265–274. [Google Scholar] [PubMed]
- Vaishnavi, S.N.; Vlassenko, A.G.; Rundle, M.M.; Snyder, A.Z.; Mintun, M.A.; Raichle, M.E. Regional aerobic glycolysis in the human brain. Proc. Natl. Acad. Sci. USA 2010, 107, 17757–17762. [Google Scholar] [CrossRef] [PubMed]
- Goyal, M.S.; Hawrylycz, M.; Miller, J.A.; Snyder, A.Z.; Raichle, M.E. Aerobic glycolysis in the human brain is associated with development and neotenous gene expression. Cell Metab. 2015, 19, 49–57. (In English) [Google Scholar] [CrossRef] [PubMed]
- Bhatia, B.; Potts, C.R.; Guldal, C.; Choi, S.; Korshunov, A.; Pfister, S.; Kenney, A.M.; Nahlé, Z.A. Hedgehog-mediated regulation of PPARγ controls metabolic patterns in neural precursors and shh-driven medulloblastoma. Acta Neuropathol. 2012, 123, 587–600. [Google Scholar] [CrossRef] [PubMed]
- Walenta, S.; Wetterling, M.; Lehrke, M.; Schwickert, G.; Sundfør, K.; Rofstad, E.K.; Mueller-Klieser, W. High lactate levels predict likelihood of metastases, tumor recurrence, and restricted patient survival in human cervical cancers. Cancer Res. 2000, 60, 916–921. [Google Scholar] [PubMed]
- Zhai, X.; Yang, Y.; Wan, J.; Zhu, R.; Wu, Y. Inhibition of LDH-A by oxamate induces G2/M arrest, apoptosis and increases radiosensitivity in nasopharyngeal carcinoma cells. Oncol. Rep. 2013, 30, 2983–2991. [Google Scholar] [CrossRef] [PubMed]
- Miskimins, W.K.; Ahn, H.J.; Kim, J.Y.; Ryu, S.; Jung, Y.S.; Choi, J.Y. Synergistic anti-cancer effect of phenformin and oxamate. PLoS ONE 2014, 9, e85576. [Google Scholar] [CrossRef] [PubMed]
- Elwood, J.C. Effect of oxamate on glycolysis and respiration in sarcoma 37 ascites cells. Cancer Res. 1968, 28, 2056–2060. [Google Scholar] [PubMed]
- Packer, R.J.; Vezina, G. Management of and prognosis with medulloblastoma: Therapy at a crossroads. Arch. Neurol. 2008, 65, 1419–1424. [Google Scholar] [CrossRef] [PubMed]
- Brizel, D.M.; Schroeder, T.; Scher, R.L.; Walenta, S.; Clough, R.W.; Dewhirst, M.W.; Mueller-Klieser, W. Elevated tumor lactate concentrations predict for an increased risk of metastases in head-and-neck cancer. Int. J. Radiat. Oncol. Biol. Phys. 2001, 51, 349–353. [Google Scholar] [CrossRef]
- Goetze, K.; Walenta, S.; Ksiazkiewicz, M.; Kunz-Schughart, L.A.; Mueller-Klieser, W. Lactate enhances motility of tumor cells and inhibits monocyte migration and cytokine release. Int. J. Oncol. 2011, 39, 453–463. [Google Scholar] [CrossRef] [PubMed]
- Castro-Gamero, A.M.; Borges, K.S.; Lira, R.C.; Andrade, A.F.; Fedatto, P.F.; Cruzeiro, G.A.V.; Silva, R.B.; Fontes, A.M.; Valera, E.T.; Bobola, M.; et al. Chromosomal heterogeneity and instability characterize pediatric medulloblastoma cell lines and affect neoplastic phenotype. Cytotechnology 2013, 65, 871–885. (In English) [Google Scholar] [CrossRef] [PubMed]
- Triscott, J.; Lee, C.; Foster, C.; Manoranjan, B.; Pambid, M.R.; Berns, R.; Fotovati, A.; Venugopal, C.; O’Halloran, K.; Narendran, A.; et al. Personalizing the treatment of peadiatric medulloblastoma: Polo-like kinase 1 as a molecular target in high-risk children. Cancer Res. 2013, 73, 6734–6744. (In English) [Google Scholar] [CrossRef] [PubMed]
- Arseneault, R.; Chien, A.; Newington, J.T.; Rappon, T.; Harris, R.; Cumming, R.C. Attenuation of LDHA expression in cancer cells leads to redox-dependent alterations in cytoskeletal structure and cell migration. Cancer Lett. 2013, 338, 255–266. [Google Scholar] [CrossRef] [PubMed]
- Fantin, V.R.; St-Pierre, J.; Leder, P. Attenuation of LDH-A expression uncovers a link between glycolysis, mitochondrial physiology, and tumor maintenance. Cancer Cell 2006, 9, 425–434. [Google Scholar] [CrossRef] [PubMed]
- Le, A.; Cooper, C.R.; Gouw, A.M.; Dinavahi, R.; Maitra, A.; Deck, L.M.; Royer, R.E.; Vander Jagt, D.L.; Semenza, G.L.; Dang, C.V. Inhibition of lactate dehydrogenase A induces oxidative stress and inhibits tumor progression. Proc. Natl. Acad. Sci. USA 2010, 107, 2037–2042. [Google Scholar] [CrossRef] [PubMed]
- Read, J.A.; Winter, V.J.; Eszes, C.M.; Sessions, R.B.; Brady, R.L. Structural basis for altered activity of M- and H-isozyme forms of human lactate dehydrogenase. Proteins 2001, 43, 175–185. [Google Scholar] [CrossRef]
- Zhou, M.; Zhao, Y.; Ding, Y.; Liu, H.; Liu, Z.; Fodstad, O.; Riker, A.I.; Kamarajugadda, S.; Lu, J.; Owen, L.B.; et al. Warburg effect in chemosensitivity: Targeting lactate dehydrogenase-A re-sensitizes taxol-resistant cancer cells to taxol. Mol. Cancer 2010, 9, 33. [Google Scholar] [CrossRef] [PubMed]
- Kawauchi, D.; Robinson, G.; Uziel, T.; Gibson, P.; Rehg, J.; Gao, C.; Finkelstein, D.; Qu, C.; Pounds, S.; Ellison, D.W. A mouse model of the most aggressive subgroup of human medulloblastoma. Cancer Cell 2012, 21, 168–180. [Google Scholar] [CrossRef] [PubMed]
- Markant, S.L.; Wechsler-Reya, R.J. Review: Personalized mice: Modelling the molecular heterogeneity of medulloblastoma. Neuropathol. Appl. Neurobiol. 2012, 38, 228–240. [Google Scholar] [CrossRef] [PubMed]


© 2018 by the authors. Licensee MDPI, Basel, Switzerland. This article is an open access article distributed under the terms and conditions of the Creative Commons Attribution (CC BY) license (http://creativecommons.org/licenses/by/4.0/).
Share and Cite
Valvona, C.J.; Fillmore, H.L. Oxamate, but Not Selective Targeting of LDH-A, Inhibits Medulloblastoma Cell Glycolysis, Growth and Motility. Brain Sci. 2018, 8, 56. https://doi.org/10.3390/brainsci8040056
Valvona CJ, Fillmore HL. Oxamate, but Not Selective Targeting of LDH-A, Inhibits Medulloblastoma Cell Glycolysis, Growth and Motility. Brain Sciences. 2018; 8(4):56. https://doi.org/10.3390/brainsci8040056
Chicago/Turabian StyleValvona, Cara J., and Helen L. Fillmore. 2018. "Oxamate, but Not Selective Targeting of LDH-A, Inhibits Medulloblastoma Cell Glycolysis, Growth and Motility" Brain Sciences 8, no. 4: 56. https://doi.org/10.3390/brainsci8040056
APA StyleValvona, C. J., & Fillmore, H. L. (2018). Oxamate, but Not Selective Targeting of LDH-A, Inhibits Medulloblastoma Cell Glycolysis, Growth and Motility. Brain Sciences, 8(4), 56. https://doi.org/10.3390/brainsci8040056