1. Introduction
The human brain constitutes a highly organized neurobiological system comprising spatially segregated yet functionally integrated regions. Each brain region has its own mission and function. There are biological connections between different brain regions, which are called structural connections. With the development of functional magnetic resonance imaging (fMRI) technology, research on the functional connections between different brain regions has gradually attracted the interest of many researchers. The functional connections between different brain regions, also referred to as the brain’s topological structure, jointly shape complex behaviors [
1,
2]. The complex network topology of the brain is better suited for analysis from the perspective of network physiology. Network physiology aims to understand how physiological states and functions emerge from the physiological network interactions across physiological systems and subsystems. The scope of network physiology extends far beyond applying knowledge from one field (statistical physics, applied mathematics, informatics, and network theory) to solve problems in another (systems biology, neuroscience, physiology, and medicine). In recent years, we have witnessed the broad impact of introducing novel concepts and methods derived from modern statistical physics and network theory to biology and medicine [
3,
4]. For example, Miller et al. [
5] discovered a special structural organization of neural connections, which allows individual neurons and brain regions to interact as a functional whole.
The majority of functional magnetic resonance imaging (fMRI) techniques utilize paramagnetic deoxyhemoglobin as an endogenous contrast agent. As early as in the 1990s, researchers discovered that blood-oxygenation-level-dependent (BOLD) signal variations could be used to detect brain region activation [
6,
7]. In fMRI experiments, each scan generates time-series data of BOLD signals across brain regions. Investigations into the correlation of BOLD signals between different brain regions reveal the degree of temporal correlation derived from time-series data, which is called “functional connectivity” (FC). FC is defined as statistically significant temporal dependencies of anatomically separated brain regions. Featuring non-invasive whole-brain imaging capabilities for subjects, fMRI has emerged as a core tool for exploring neural circuit mechanisms underlying major depressive disorder, schizophrenia, and Alzheimer’s disease (AD) [
8]. Data analysis using this tool has yielded numerous critical insights for these diseases. However, fMRI demonstrates limited data representation in AD, a neurodegenerative disorder, which restricts its utility in elucidating pathological processes and advancing the mechanistic understanding of AD. Therefore, integrating fMRI with interdisciplinary knowledge to extract multi-dimensional insights and enhance diagnostic capabilities represents a critical frontier in current AD research leveraging this neuroimaging modality. Our research goal is to investigate how the brain network structure differs across distinct physiological states—EMCI, LMCI, and AD. Previous studies have shown that interactions between the brain and peripheral physiological systems also undergo reorganization in neurodegenerative diseases. Prior work has inspired the conceptual framework of this study. For example, Liu et al. [
9] observed that brain wave network interactions evolve with the transition from one physiologic state to another following a particular pattern of reorganization. And Bartsch RP et al. determined how organ systems coordinate and optimize their function to produce distinct integrating organ-to-organ interactions into a physiologic network [
10].
Graph theory-based complex brain network analysis techniques can be applied to fMRI data to construct brain networks by calculating the functional connectivity between brain regions [
11]. Graph theory approaches primarily investigate relationships between nodes and edges. In this context, correlation coefficient calculation refers to quantifying BOLD signal correlations between brain regions, transforming resting-state fMRI data into functional networks composed of nodes and edges amenable to graph analysis. In 2005, Salvador first partitioned the brain into 90 regions using the Automated Anatomical Labeling (AAL) atlas with resting-state fMRI data [
12]. By combining resting-state fMRI and graph theory, brain regions can be abstracted as nodes in a network. This approach enables the analysis of interactions between brain regions through correlation coefficients, with both the magnitude and temporal dynamics of these coefficients reflecting changes in functional connectivity—a key focus of fMRI data analysis. Functional connections within brain networks are considered the functional basis for advanced cognitive functions and neurodegenerative diseases. Thus, correlation coefficient calculation not only accurately captures functional associations between brain regions but also plays a pivotal role in brain disease research.
While graph theory provides a powerful statistical tool for analyzing correlations between brain regions via correlation coefficients, its application to fMRI data requires binary thresholding of brain networks—a process that inherently loses raw signal information [
13]. Additionally, spatiotemporal data resolution (spatial parcellation and temporal sampling) and inter-subject variability introduce noise into the acquired data, compromising the stability and accuracy of functional connectivity measurements. These limitations reduce the reliability of correlation-based methods in detecting disease-specific connectivity changes and functional modules. Therefore, there is a critical need for novel approaches that minimize inter-subject variability while preserving group differences, enabling the precise identification of disease-related connectivity alterations and associated functional module networks.
Building on Huang’s demonstration of the feasibility of individual brain networks for deriving network properties and distinguishing disease groups [
14], our study integrated resting-state fMRI data with graph theory by introducing individual brain networks. By defining differences between disease and cognitively normal groups as constraints in fMRI data, this method constructs individual brain networks that minimize inter-subject variability while preserving group differences and effectively reducing noise in fMRI signals. Leveraging the widely accepted Yeo 7-network parcellation [
15], which is a partitioning scheme that divides the entire brain into seven functional networks, including the Visual Network (VIS), Somatomotor Network (SMN), dorsal attention network (DAN), Ventral Attention Network (VAN), Limbic Network (LN), Frontoparietal Network (FN), and Default Mode Network (DMN), our study analyzed alterations in these functional networks during disease progression. In addition, Lee et al. [
16] calculated the overlap score, which quantifies the degree of overlap between communities. They revealed that brain networks exhibited significantly higher overlap scores than both their null networks and other real-world networks. Additionally, they showed that brain regions with a high degree of overlap—including the superior frontal gyrus, precuneus, putamen, and thalamus—are located in either the fronto-parietal or subcortical region and are closely associated with cognitive flexibility, a core dimension of executive functions. So, our study innovatively introduced co-community probability into individual brain networks. By combining individual brain networks’ constructions with community detection algorithms, we replaced conventional correlation coefficients with co-community probability to quantify functional connectivity. Statistical testing and enrichment analysis of these matrices enabled the precise identification of alterations in the topological characteristics of brain functional networks. This framework provides a novel perspective on how disease severity impacts functional connectivity patterns within the Yeo 7-network parcellation in Alzheimer’s disease, potentially uncovering new therapeutic targets for early intervention.
2. Materials and Methods
2.1. Participants
In this study, the dataset was obtained from the Alzheimer’s Disease Neuroimaging Initiative (ADNI) [
17], with approval from institutional review boards and informed consent obtained from all participants. The ADNI database has been widely used for the early tracking and detection of AD, aiming to develop biomarkers for the disorder, advance the understanding of AD pathophysiology, and improve diagnostic methods for early detection. Since its launch in 2004, the project has completed three research phases, each involving the recruitment of patients from North America for imaging and clinical assessments. Over time, follow-up imaging data and clinical reassessments were periodically collected to track disease progression. To date, this effort has amassed substantial resting-state fMRI data across diverse patient populations. In this study, the data include 182 resting-state fMRI subjects, consisting of 88 female and 94 male participants. Participants in the dataset were sitting and instructed to keep their eyes open during the fMRI acquisition. Patients were assigned to diagnostic groups categorized as follows: 20 cognitively normal (CN), 57 early mild cognitive impairment (EMCI), 55 late mild cognitive impairment (LMCI), and 50 Alzheimer’s disease (AD) subjects aged 60–80 years. We stratified each disease category by age into three groups: 60s group (aged 60–69), 70s group (aged 70–79), and 80s group (aged 80–89). This resulted in nine disease-specific age groups and one cognitively normal group.
2.2. Data Acquisition
Functional images were obtained from the ADNI database with 3 T field strength using Philips Medical Systems scanners, with a matrix size of 64 × 64, a voxel size of 3.3 × 3.3 × 3.3 mm3, a GR pulse sequence, 48/36 slices per subject with a 3.3 mm gap (default interleaved slice order), 140 volumes, a TE of 30.0 ms, and a TR of 3001.0 ms.
Structural images were obtained from the ADNI database with 3 T field strength using Philips Medical Systems scanners, with a matrix size of 256 × 256, a GR pulse sequence, a slice gap of 1.2 mm, a TE of 3.1 ms, a TR of 6.8 ms, and a TI of 0.0 ms.
2.3. Preprocessing
Preprocessing of datasets included the following steps: (1) reorientation, where distorted images were checked and excluded, and then the origin of remaining fMRI data was reset; (2) slice-timing correction, where top-down inter-leaved slice timing correction was applied to address temporal discrepancies; (3) head motion correction, where we corrected for head movements in six directions (x/y/z translation and rotation); (4) coregistration, where we aligned T1-weighted structural images with functional images; (5) segmentation, where we segmented coregistered structural images into gray matter, white matter, CSF, bone, and others; (6) normalization, which allowed for transformation to the MNI space with 1 mm structural and 3 mm functional resampling; and (7) smoothing, where we applied 6 × 6 × 6 Gaussian kernel smoothing to enhance SNR. All steps were implemented using SPM12 [
18] (
http://www.fil.ion.ucl.ac.uk/spm (accessed on 4 May 2023)).
The preprocessed resting-state fMRI sample data matrix was generated, where the dimensions represent 91 × 109 × 91 spatial voxels and 140 time points. The fMRI data were acquired with a repetition time (TR) of 3 s, resulting in 140 sequential whole-brain scans. The 91 × 109 × 91 dimensions correspond to the spatial volume and anatomical location of the scanned brain.
2.4. Computing Individual Brain Network Matrix
Before computing the individual brain network matrix, the functional connectivity matrix was computed using a conventional approach. This calculation was based on the Automated Anatomical Labeling (AAL) atlas proposed by Tzourio-Mazoyer [
19], which originally contains 116 brain regions. After excluding 26 cerebellar regions irrelevant to this study, the analysis was performed using the atlas’s remaining 90 cerebral regions. The BOLD signal intensity for each AAL-defined region was calculated as the sum of BOLD signals across all voxels within that region. Through this process, the preprocessed fMRI data matrix
was partitioned into a BOLD time-series matrix
, where each sample consists of 90 brain regions with 140 time points per region.
Using the BOLD time-series matrix
from the
k-th subjects, the Pearson correlation coefficient between BOLD signals
and
of any two brain regions was computed as follows:
where
N denotes the number of brain regions. This resulted in a Pearson correlation coefficient matrix
for each subject, which was then used to construct node–edge functional brain connectivity networks.
The individual brain network matrix was constructed based on the Pearson correlation coefficient matrix through the following procedures.
The mean of the brain region correlation matrices across
H cognitively normal subjects was computed as follows:
where
H = 20, and the averaged brain region correlation matrix
of cognitively normal subjects was derived.
The differential correlation matrix
for the
k-th disease subject relative to the cognitively normal group matrix
was computed as follows:
The differential correlation matrix
was subjected to Fisher’s
z-transformation to generate the weighted matrix
for the
k-th subject in the disease group, defined as follows:
Using the weighted matrix
the individual brain network matrix
for the k-th subject in the disease group was computed as follows:
2.5. Community Detection Based on the Louvain Algorithm Was Performed to Compute the Co-Community Probability Matrix
After obtaining the individual brain network matrix for each participant, we adopted the functional connectivity matrix processing approach proposed by Yeo to reduce computational complexity [
15]. Specifically, we kept the top 10% of correlations based on the individual brain network matrix
through thresholding, binarized the sparse matrix, and extracted brain graph networks. The Louvain algorithm, one of the most popular modularity optimization methods widely recognized for its speed and performance in community detection [
20], was then applied to partition the network into functional modules. This algorithm operates in two iterative phases until modularity no longer increases: (1) Local Node Movement, where nodes are iteratively reassigned to the community maximizing modularity gain, and (2) Network Aggregation, where an aggregated network is constructed and each community becomes a meta-node.
Given the inherent randomness in the Louvain algorithm’s initialization, repeated community detections were performed for each subject. To mitigate this stochasticity, multiple partition results were randomly sampled. As brain networks with higher community overlap are associated with stronger functional relevance, we computed the co-community probability matrix by quantifying the frequency of two brain regions being assigned to the same community across Louvain community detections. This probability reflects functional connectivity between two brain regions.
For the individual brain network matrix
of the
k-th subject, let
m denote the number of non-zero elements. The corresponding individual brain network
was constructed, where
represents nodes and
represents edges. This network
was then split into 90 communities
, each corresponding to a node
∈
V(G). The modularity of
G after merging community
(where
i = 1, 2, …, 90) with all connected communities
was computed as follows:
Community was iteratively merged with the community that yielded the maximum modularity change ΔQ until all communities (i = 1, 2, …, 90) were consolidated into a single new community.
The process of computing modularity changes and merging communities was iteratively repeated until no further community assignments changed for all nodes
. One Louvain community partition result was generated. This algorithm was run
M times for each subject. In this study,
M = 50. The total number of algorithm executions for each sample group was the product of
M and the number of subjects within that group. For each subject in this study, five partition results were randomly selected from their
outputs, and
f presented the total number of partition results selected across the entire sample group. In this study,
f equals the product of the number of subjects and five. A subset of
f partition results were randomly selected to compute co-community probabilities. For the
k-th subject, the co-community probability matrix was calculated as follows:
where
q denotes the number of times brain regions
and
were co-assigned to the same community across
f partition iterations.
In this study, participants were categorized into three distinct age groups, each further partitioned into three disease subgroups based on disease severity levels. This resulted in a total of nine disease groups for which co-community probability matrices were computed.
2.6. Graph Theory Metrics and Statistical Analysis
This study focused on two graph theory metrics: modularity and participation coefficient. According to Yeo’s functional parcellation, the brain’s functional network is divided into seven major functional domains. Sporns highlighted that modularity represents a general property of complex biological systems [
21], with modules playing potential functional roles across multiple biological domains—from evolution and development to metabolism and information processing. The modular brain network’s potential functions include enabling specialized information processing and complex dynamics. Inspired by this, we analyzed brain networks from a modular perspective using community detection and community overlap to derive novel indices for evaluating functional connectivity, aiming to uncover pathological features overlooked by conventional methods. Consequently, the performance of brain networks in community detection became the focus of graph-theoretical parameter assessment.
In evaluating the community detection results, modularity is a commonly used metric to measure the quality of community partitions [
22]. Modularity
Q is defined as follows:
where
m is the total number of edges in the network,
is the adjacency matrix element defined as 1 if nodes
v and
w are connected and 0 otherwise,
is an indicator function equal to 1 when
v and
w belong to the same community and 0 otherwise, and
and
denote the degrees of nodes
v and
w.
Modularity quantifies the topological separation between communities. A higher Q value indicates tighter connections within communities and sparser connections between communities.
The participation coefficient is a metric used to quantify the degree of node integration within and across communities [
23] and is also used to evaluate community partition quality. This modularity-based approach to node role assignment is applicable to both structural and functional networks and can reveal the role of particularly important nodes in maintaining inter-module communication. The participation coefficient of nodes
is defined as follows:
where
is the number of edges from node
i to nodes in community
s,
is the total degree of node
i, and
is the number of communities connected to node
i.
A node with stronger intra-community connections has a participation coefficient approaching 0, while a node with evenly distributed connections across communities has a coefficient approaching 1. Thus, in well-partitioned networks, nodes exhibit lower average participation coefficients.
In statistical analysis, t-tests were conducted to compare co-community probability matrices across disease subgroups of varying severity levels within the same age group (FDR-corrected p < 0.05). Among statistically significant functional connections, we selected those demonstrating significant alterations in co-community probability along the increasing disease severity levels (EMCI → LMCI → AD) for further analysis.
The co-community probability matrices demonstrating significant group differences from t-tests were partitioned into seven functional networks based on Yeo’s parcellation: the Visual Network (VIS), Somatomotor Network (SMN), dorsal attention network (DAN), Ventral Attention Network (VAN), Limbic Network (LN), Frontoparietal Network (FN), and Default Mode Network (DMN). Fisher’s exact test was employed to identify significantly enriched functional networks among altered functional connections using p-values derived from the enrichment analysis.
4. Discussion
Based on the ADNI dataset, this approach introduces co-community probability as an alternative variant to conventional Pearson correlation coefficients to quantify functional connectivity, enhancing the accuracy of detecting pathological connectivity changes and enabling robust subsequent statistical testing and functional enrichment analysis.
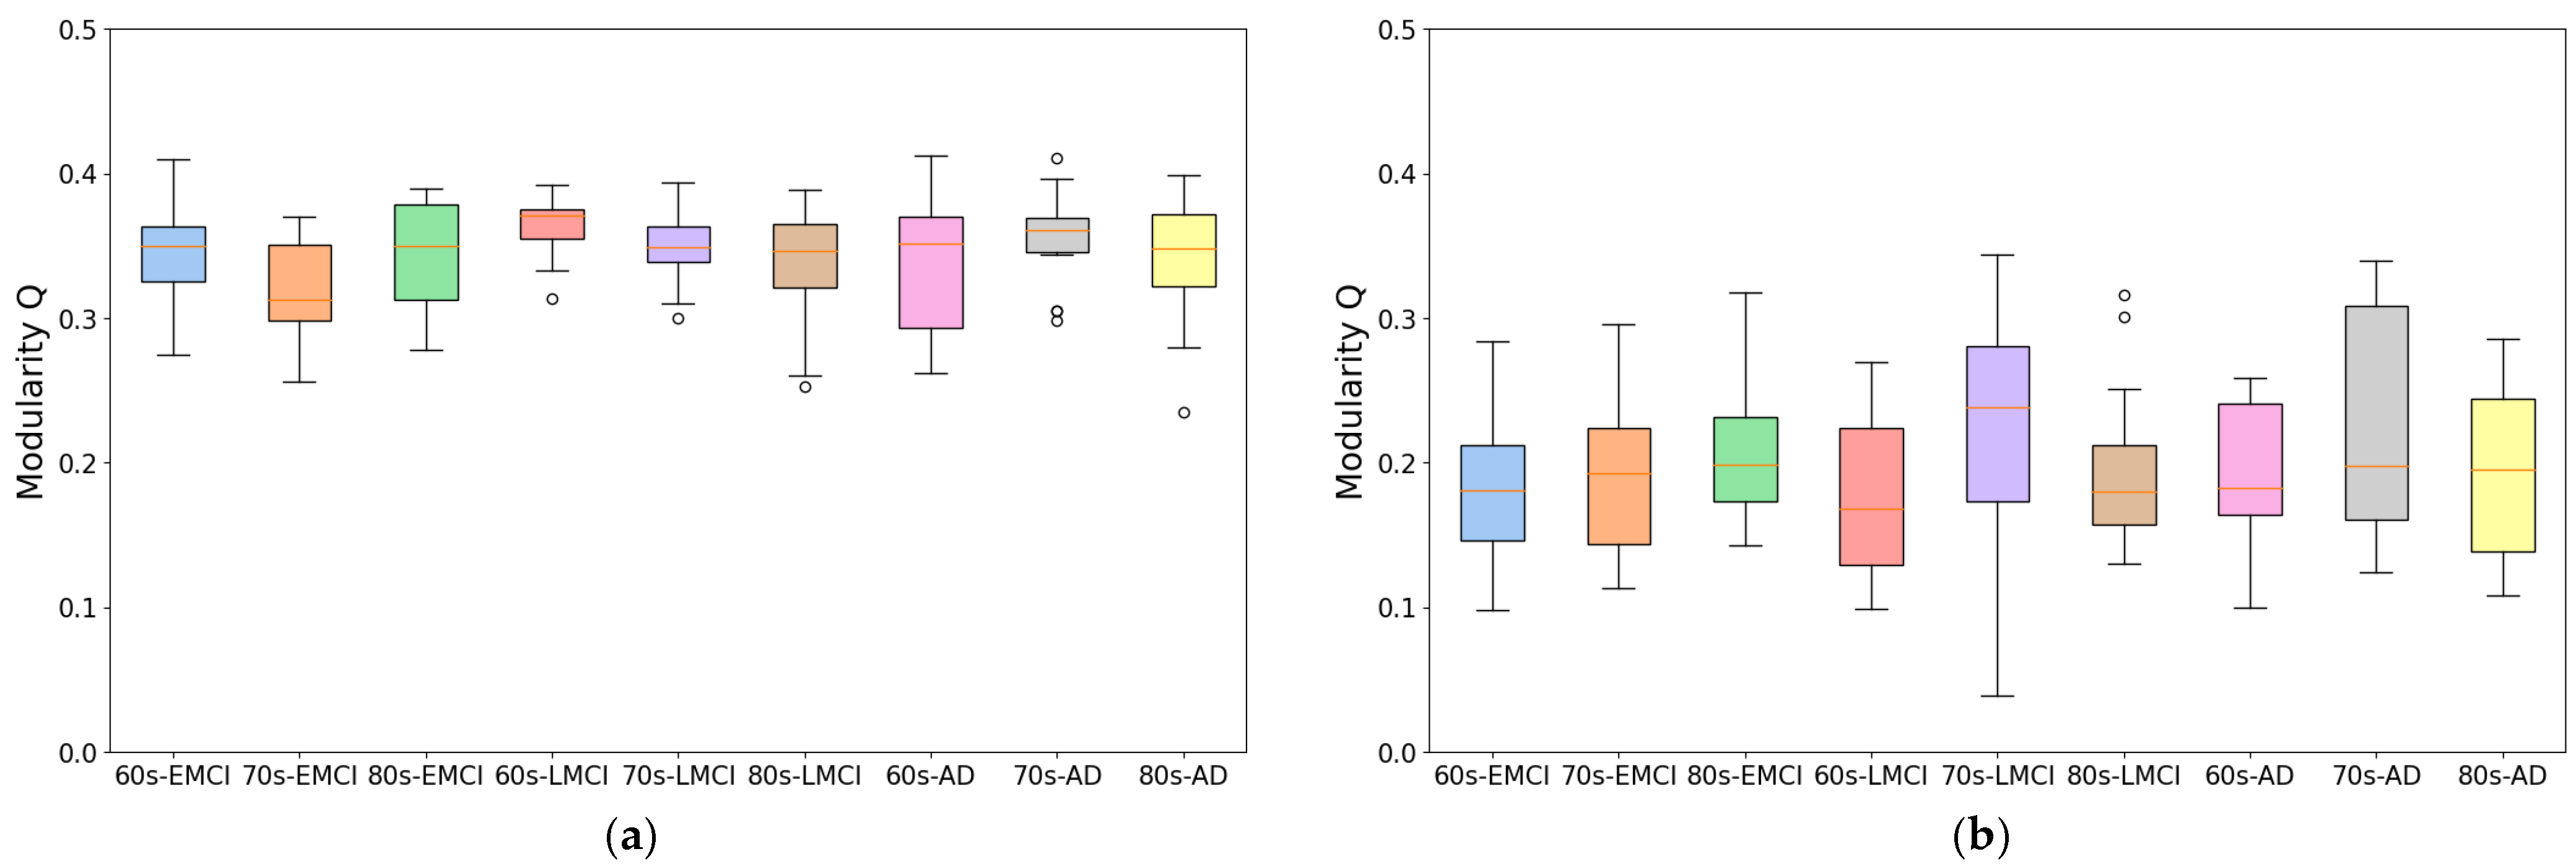
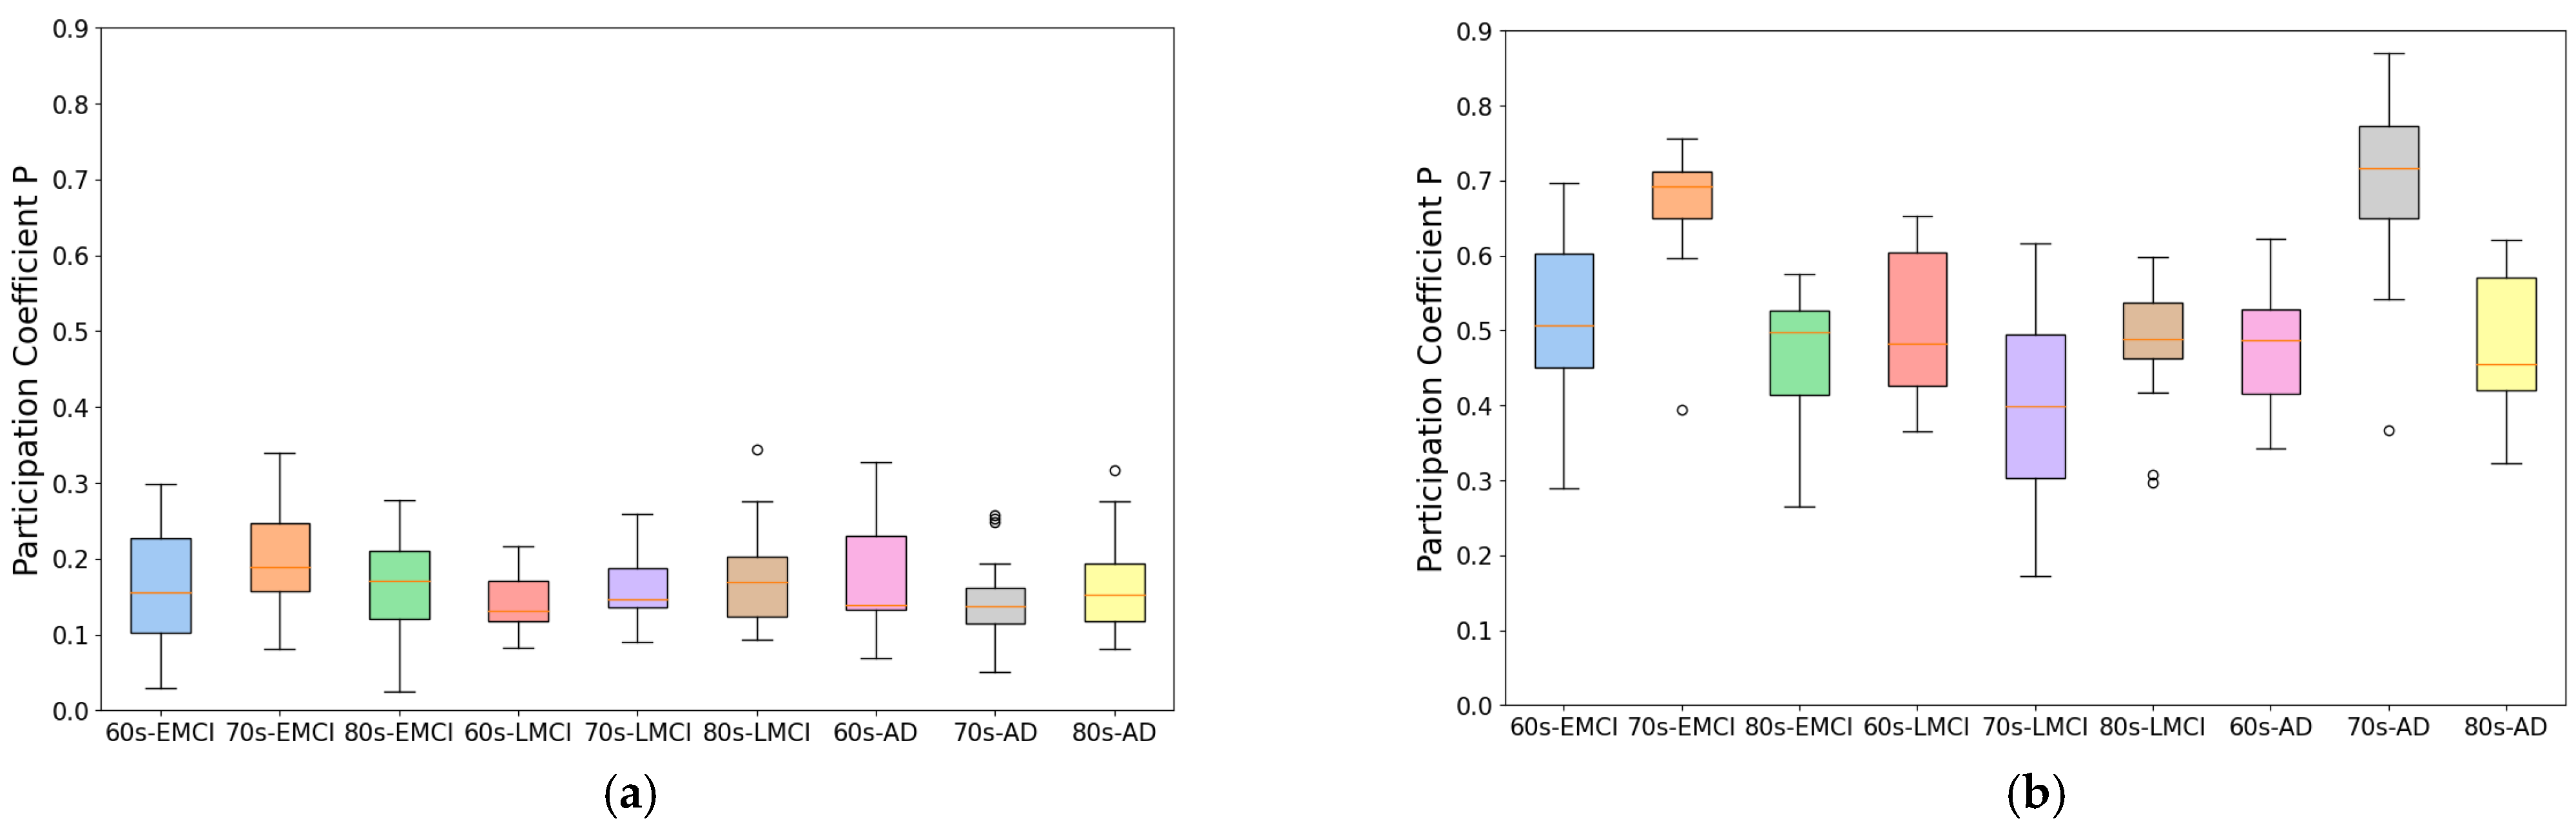
To develop this method, we improved traditional correlation-based approaches by introducing an individual brain networks method for fMRI functional connectivity analysis. This method minimizes inter-subject variability while preserving group differences, as demonstrated by its application to Alzheimer’s disease datasets. As shown in
Figure 1 and
Figure 2, the individual brain network approach achieved a 70% improvement in modularity and a 50% reduction in participation coefficient compared to conventional methods, indicating enhanced network stability and more reliable community detection. This advancement provides a robust framework for analyzing co-community probability and detecting disease-specific connectivity alterations.
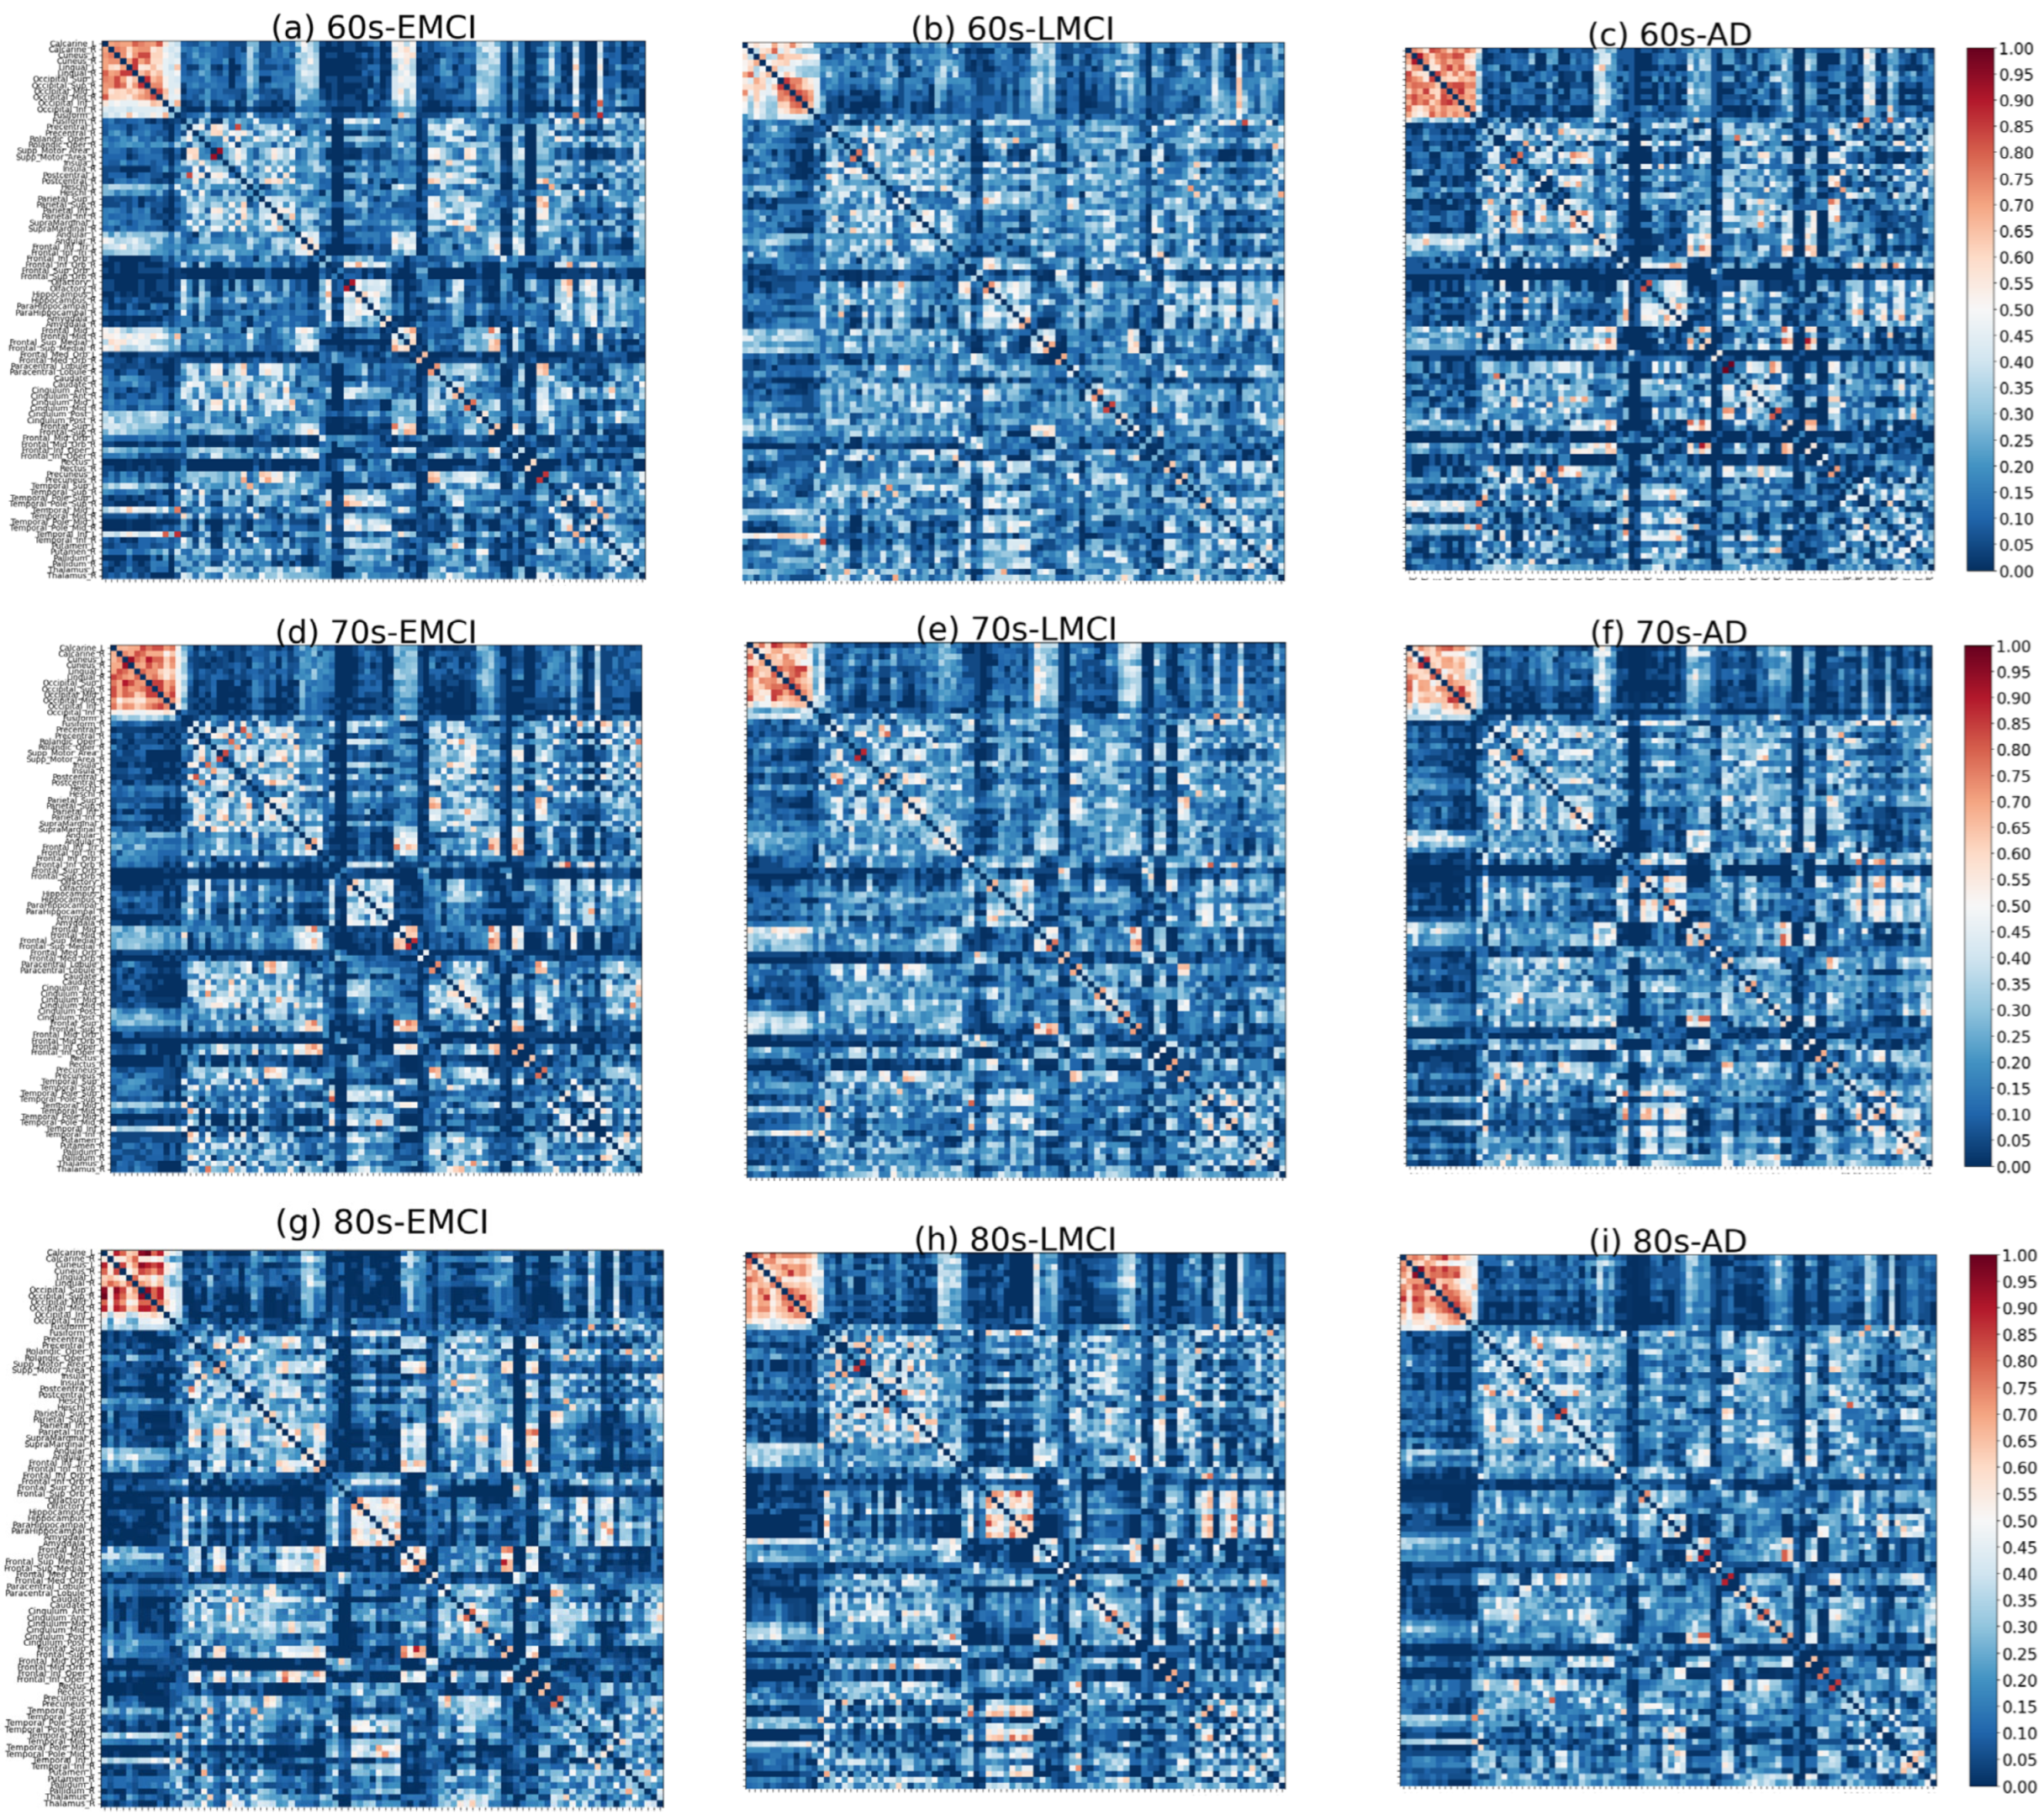
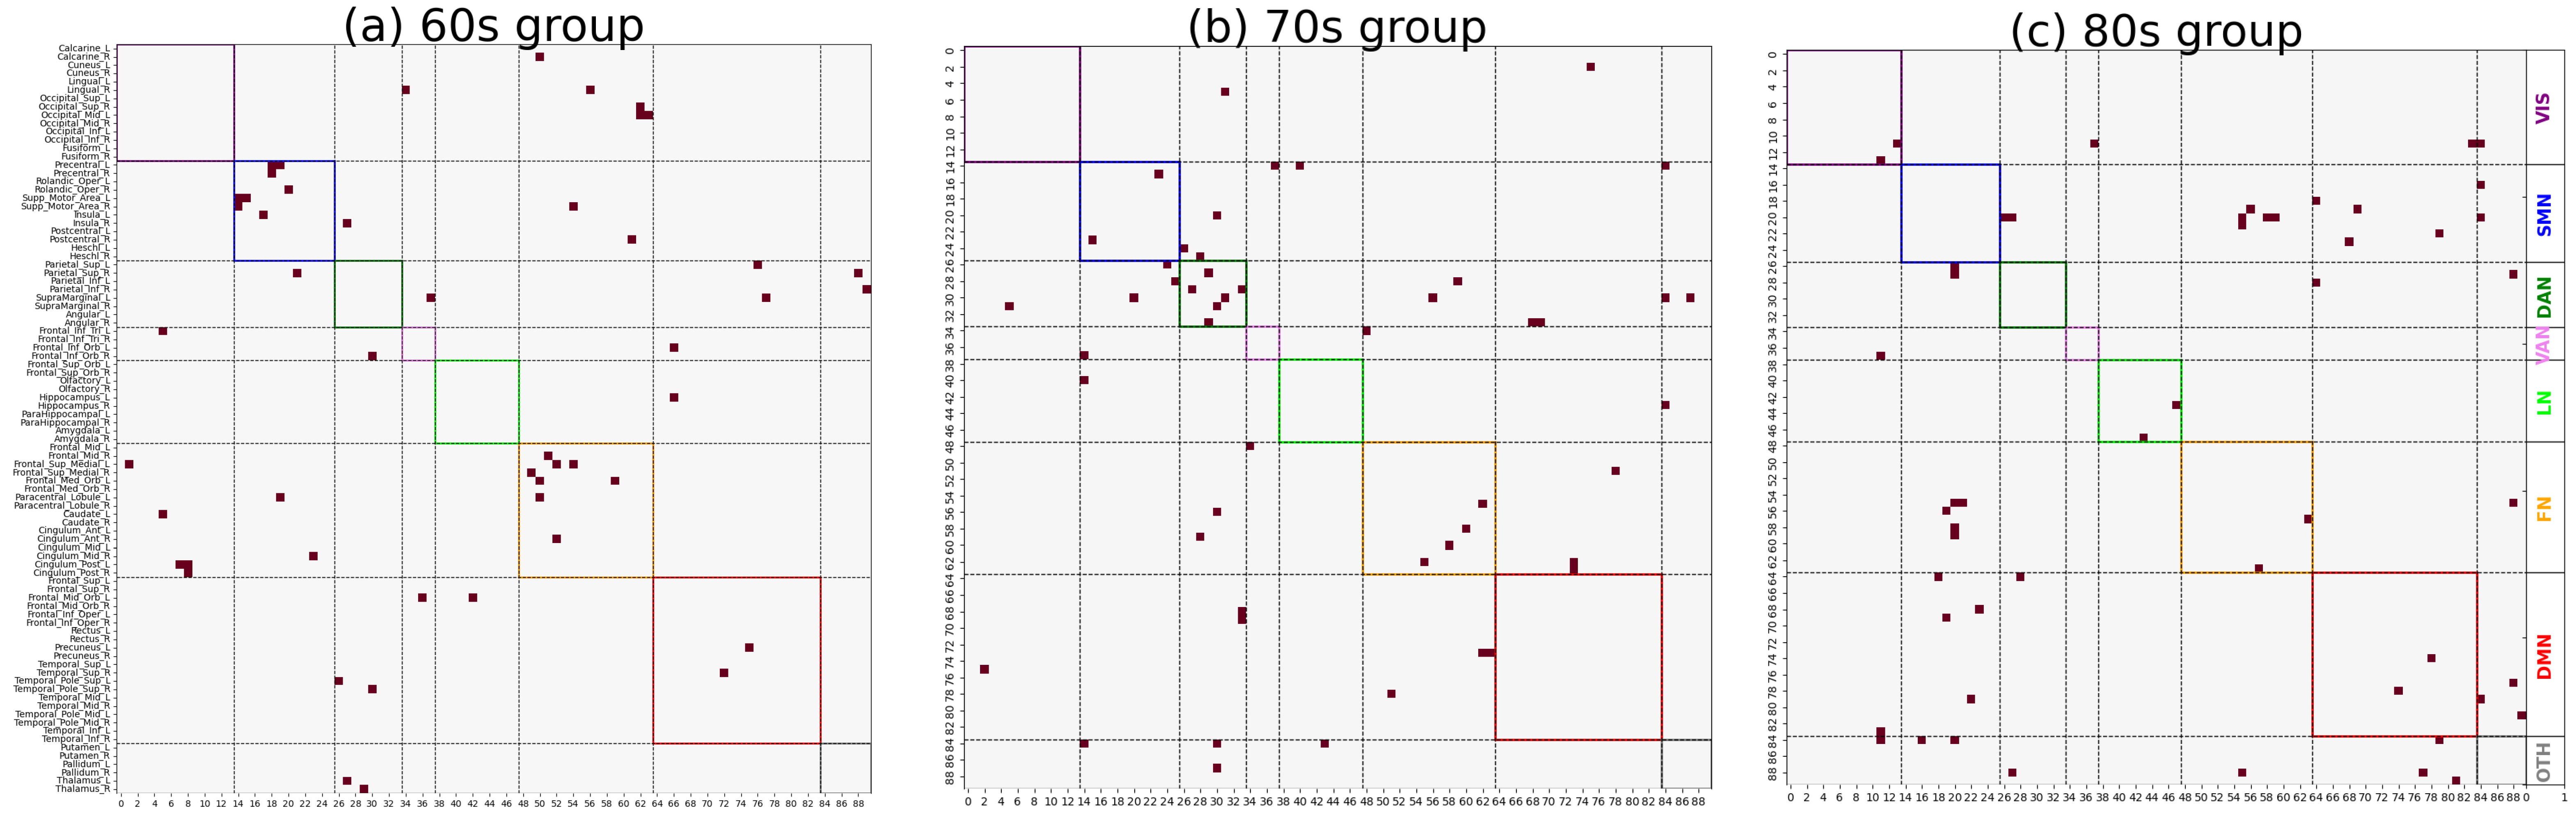
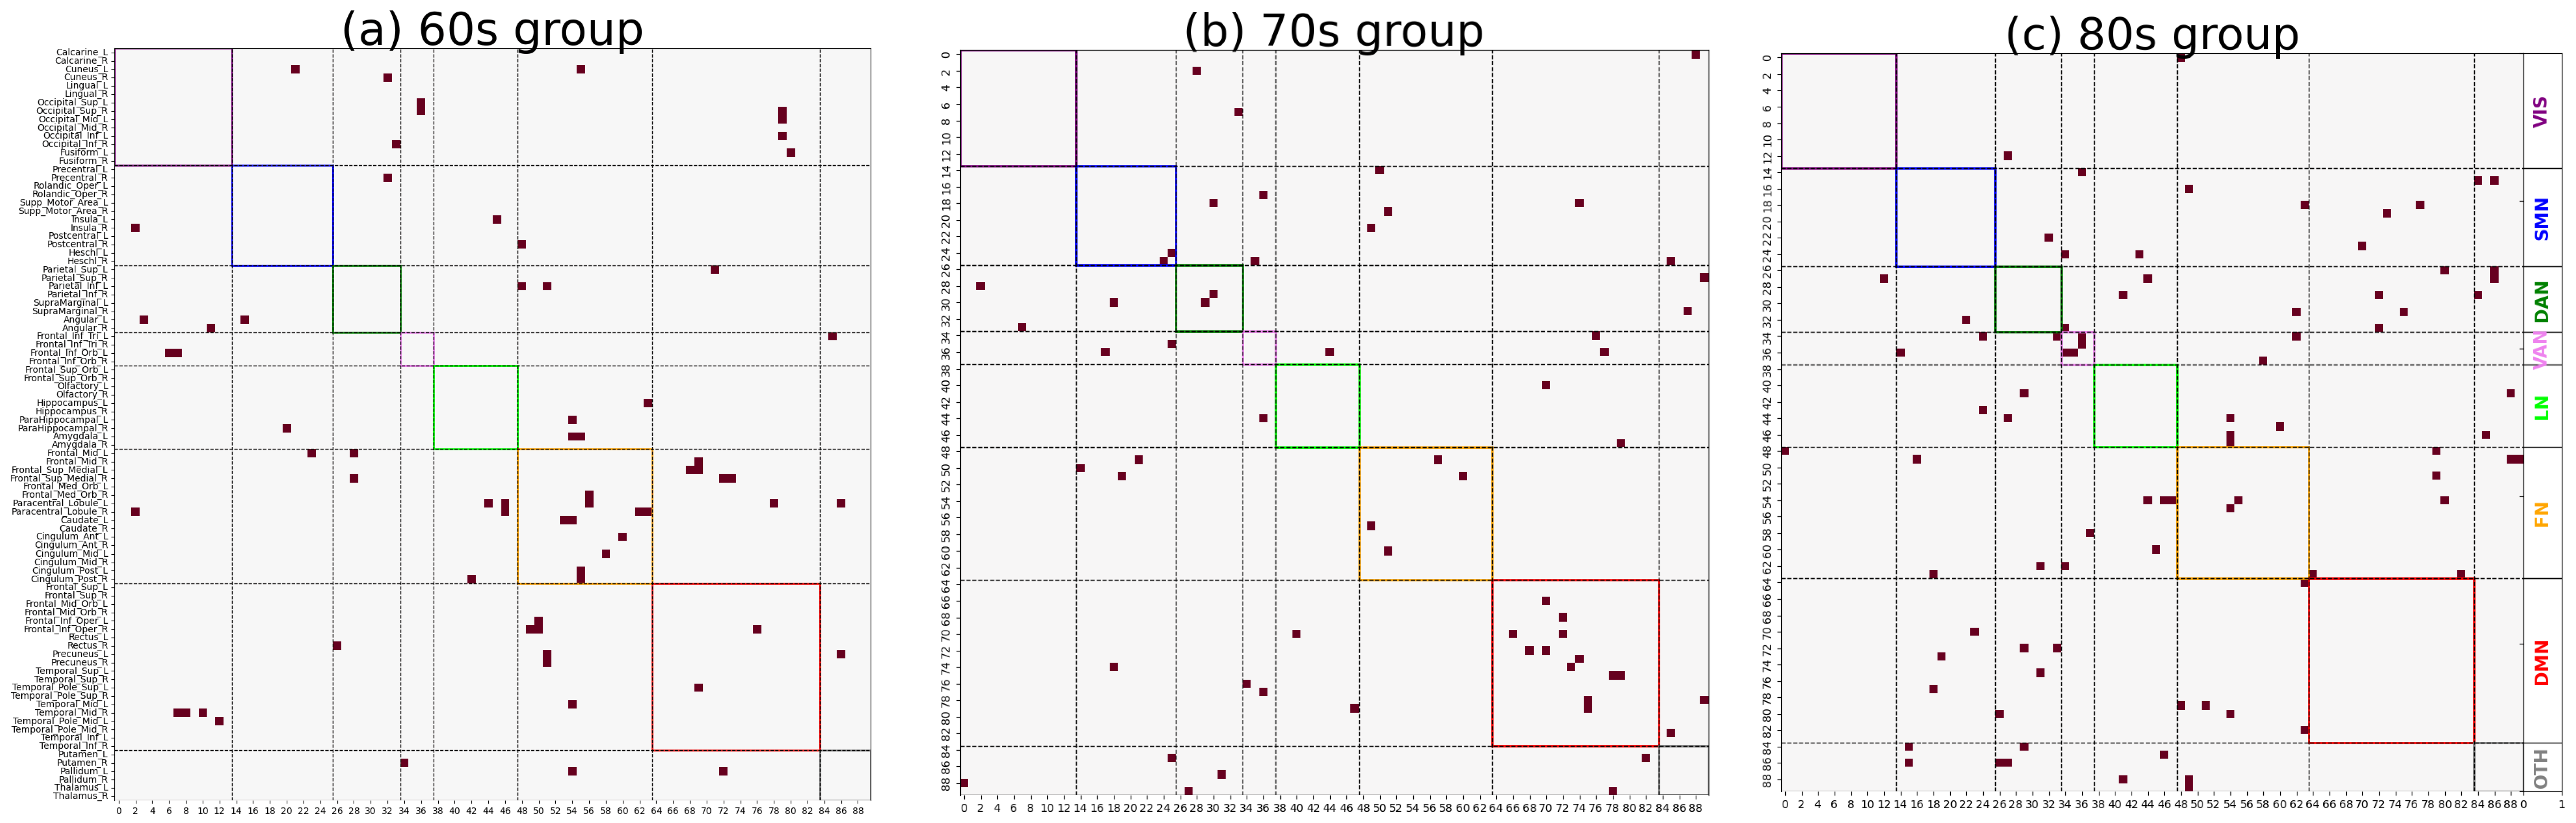
As shown in
Figure 3 and
Figure 4, significant differences in the distribution of major functional connections were observed across Alzheimer’s disease subgroups of varying severity levels within the same age group. And the distribution of significant co-community probability alterations along the increasing disease severity levels (EMCI → LMCI → AD) across seven functional networks based on Yeo’s parcellation was modulated by age, leading to differential enrichment results.
As shown in
Table 1 and
Table 2, we observed significantly decreased co-community probability alterations, which were enriched within the SMN and FN in the 60s group. Consistent with previous studies in the literature, the reduced connectivity within the SMN may be attributed to disrupted connections involving the postcentral gyrus [
24,
25], which played a critical role in the somatosensory processing of pain and temperature [
26]. Additionally, insular atrophy could contribute to decreased functional connectivity within this network [
27]. Within the FN, reduced connectivity may be associated with the frontal lobe [
28]. The frontal lobe is responsible for logic, regulating behavior, complex planning, and learning. As the disease progresses, changes in the frontal lobe will lead to loss of motivation and cause apathy in patients.
In the 70s group, significantly decreased co-community probabilities were enriched in the DAN. Conversely, significantly increased co-community probabilities were enriched in the DMN. This finding aligns with Esposito’s observation of spontaneous anticorrelated activity between the DMN and DAN [
29]. The underlying mechanism may involve functional anticorrelation as a critical aspect of intrinsic brain functional organization, allowing for the identification of markers indexing the conversion of MCI to AD.
Our data reveal age-specific differences in functional network changes during Alzheimer’s disease (AD) progression, leading us to recommend paying particular attention to the age groups of subjects in AD functional network studies. Our findings emphasize the dynamic alterations in these functional networks during AD progression, complementing our understanding of AD-related brain network dysfunction from the perspective of co-community probability matrix enrichment. The identified functional networks and their observed changes were validated in prior AD research, confirming the reliability of our methodology. Additionally, in the 60s group, significantly increased co-community probabilities were enriched in the FN; in the 80s group, such increases were observed in the VAN. These findings may reflect metabolic compensation or network reorganization within functional networks. Therefore, these functional networks should receive equal attention to the previously described ones in AD pathological studies as they may provide novel insights into AD’s pathological mechanisms. The enrichment analysis results in
Table 1 and
Table 2 indicate that, in the 60s group, all brain region pairs with increased co-community probabilities were more concentrated in the FN across the whole brain, while those with decreased co-community probabilities were also more enriched in the FN with disease progression. A plausible hypothesis for this phenomenon is that the Frontoparietal Network serves as a functional hub of the brain, and disease-related alterations lead to extensive functional changes within the FN, involving not only decreases but also increases in co-community probabilities.
In conclusion, by introducing co-community probability to replace traditional methods and employing community enrichment analysis, our study identified functional domains consistent with previously reported alterations in AD, collectively explaining the pathological remodeling of intra-network functional relationships in AD patients. This work suggests that using different data-driven methods based on CCPM to study alterations in the topological characteristics of brain networks would have better in-formation complementarity, which can provide a novel analytical perspective for AD progression. However, this study primarily focused on the enrichment of co-community probability changes within functional networks. In contrast, Wang identified dysregulated functional connectivity between the DAN and DMN in patients with cognitive impairment and AD [
30]. Buckner further demonstrated age-related disconnected connectivity among the DAN, FN, and DMN [
31]. Therefore, the co-community probability relationships between functional networks remained an underexplored area requiring further investigation. In addition, Rizzo had shown that interactions between the brain and peripheral physiological systems also undergo reorganization in neurodegenerative diseases [
32]. This work shows that if the co-community probability matrix approach is applied to the dynamic networks of brain–organ interactions in relation to basic physiological states found in network physiology, an enrichment analysis of co-community probabilities could potentially identify novel network-based biomarkers for AD patients.


