Author Contributions
Conceptualization, Z.L., Z.S., M.L. and Y.X.; methodology, Z.L. and M.L.; software, Z.L., M.L. and J.H.; validation, Z.L., M.L. and J.H.; formal analysis, Z.L.; investigation, Z.L.; resources, Z.L.; data curation, Z.S.; writing—original draft preparation, Z.L.; writing—review and editing, Z.L., M.L., J.H. and Z.Z.; visualization, Z.L.; supervision, Z.L., Z.S., J.H., M.L. and Z.Z.; project administration, Z.L. and J.H.; funding acquisition, Z.Z. All authors have read and agreed to the published version of the manuscript.
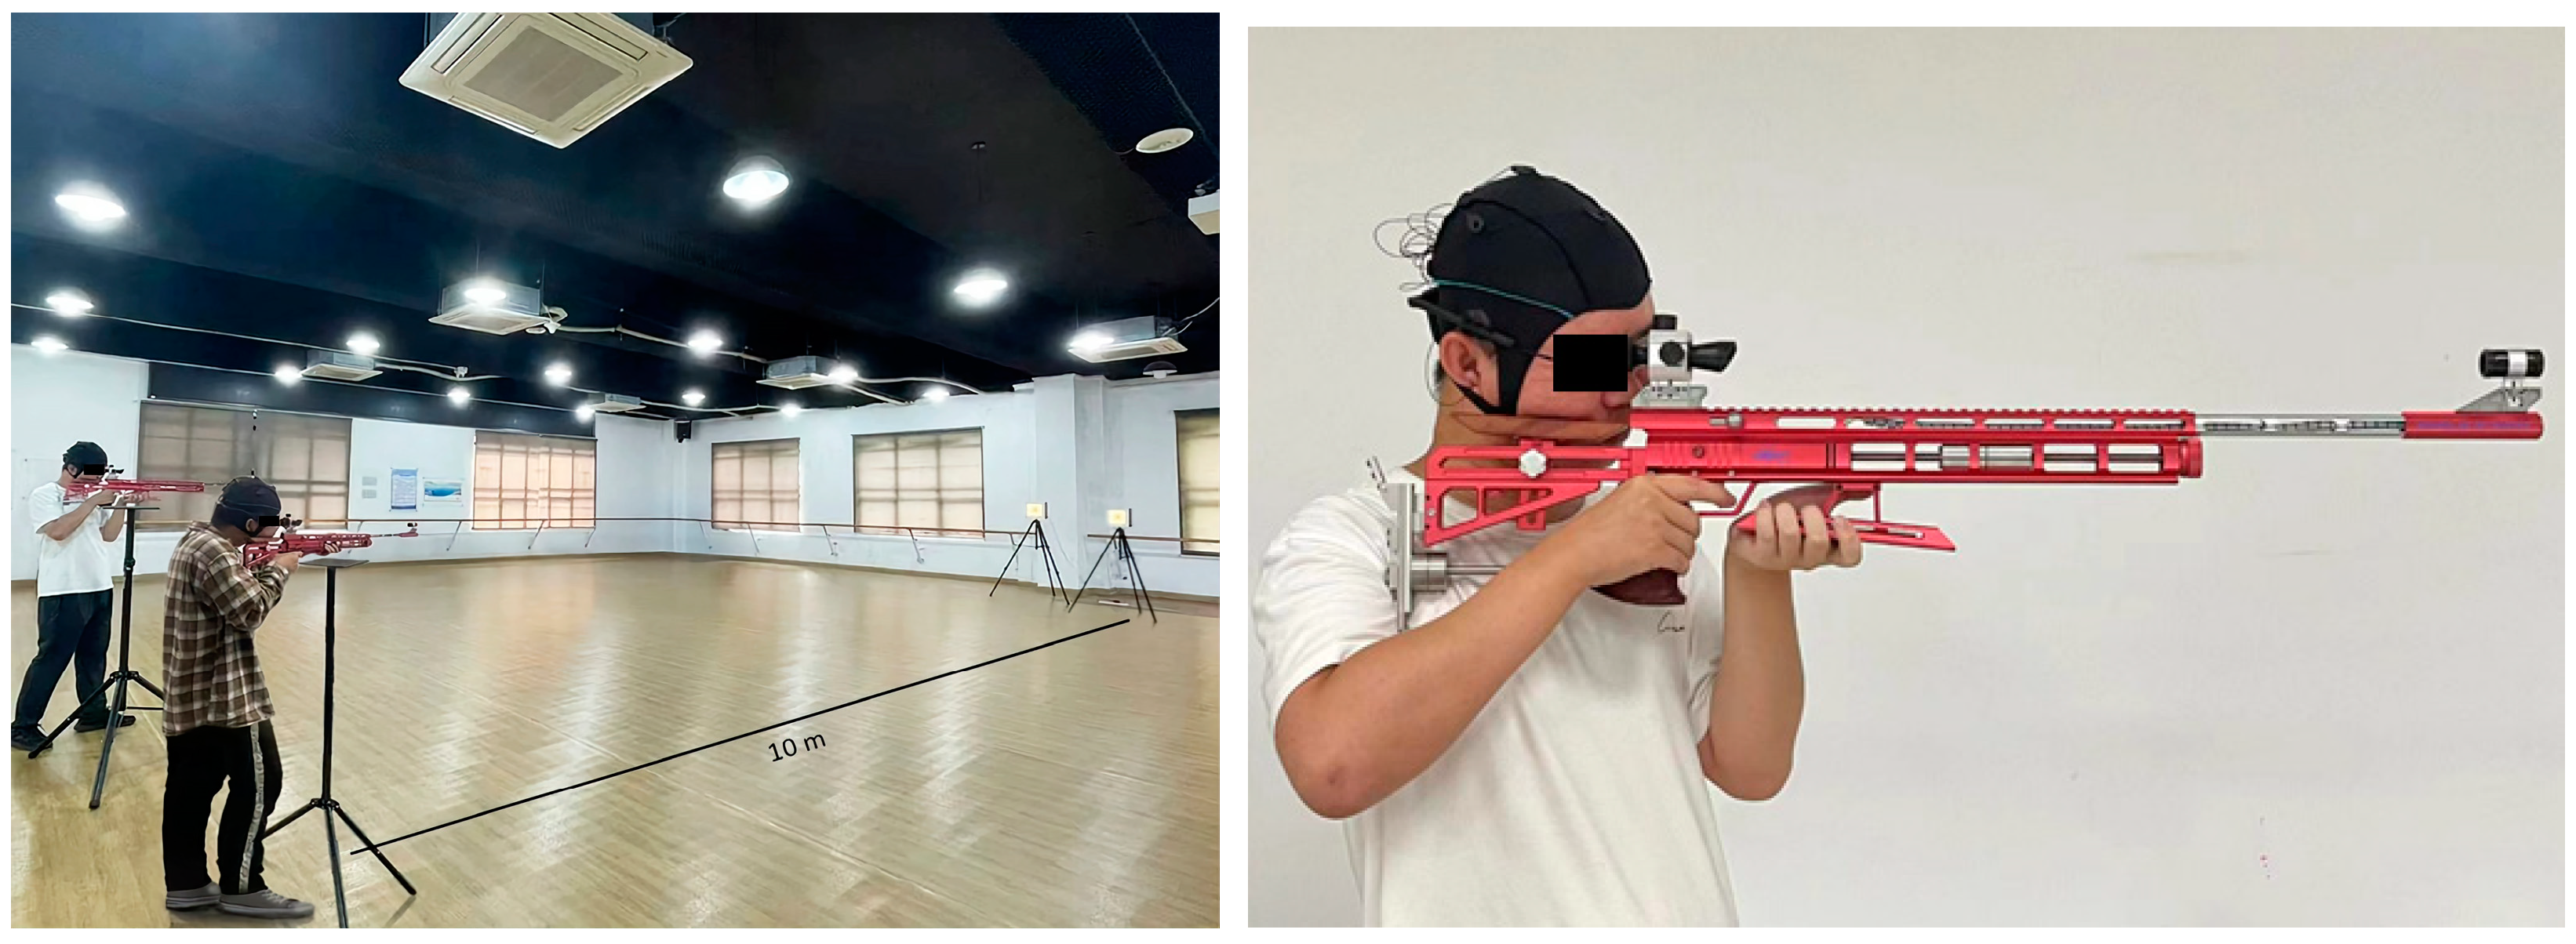
Figure 1.
The shooters aimed and shot at a target 10 m away while the EEG data were recorded.
Figure 1.
The shooters aimed and shot at a target 10 m away while the EEG data were recorded.
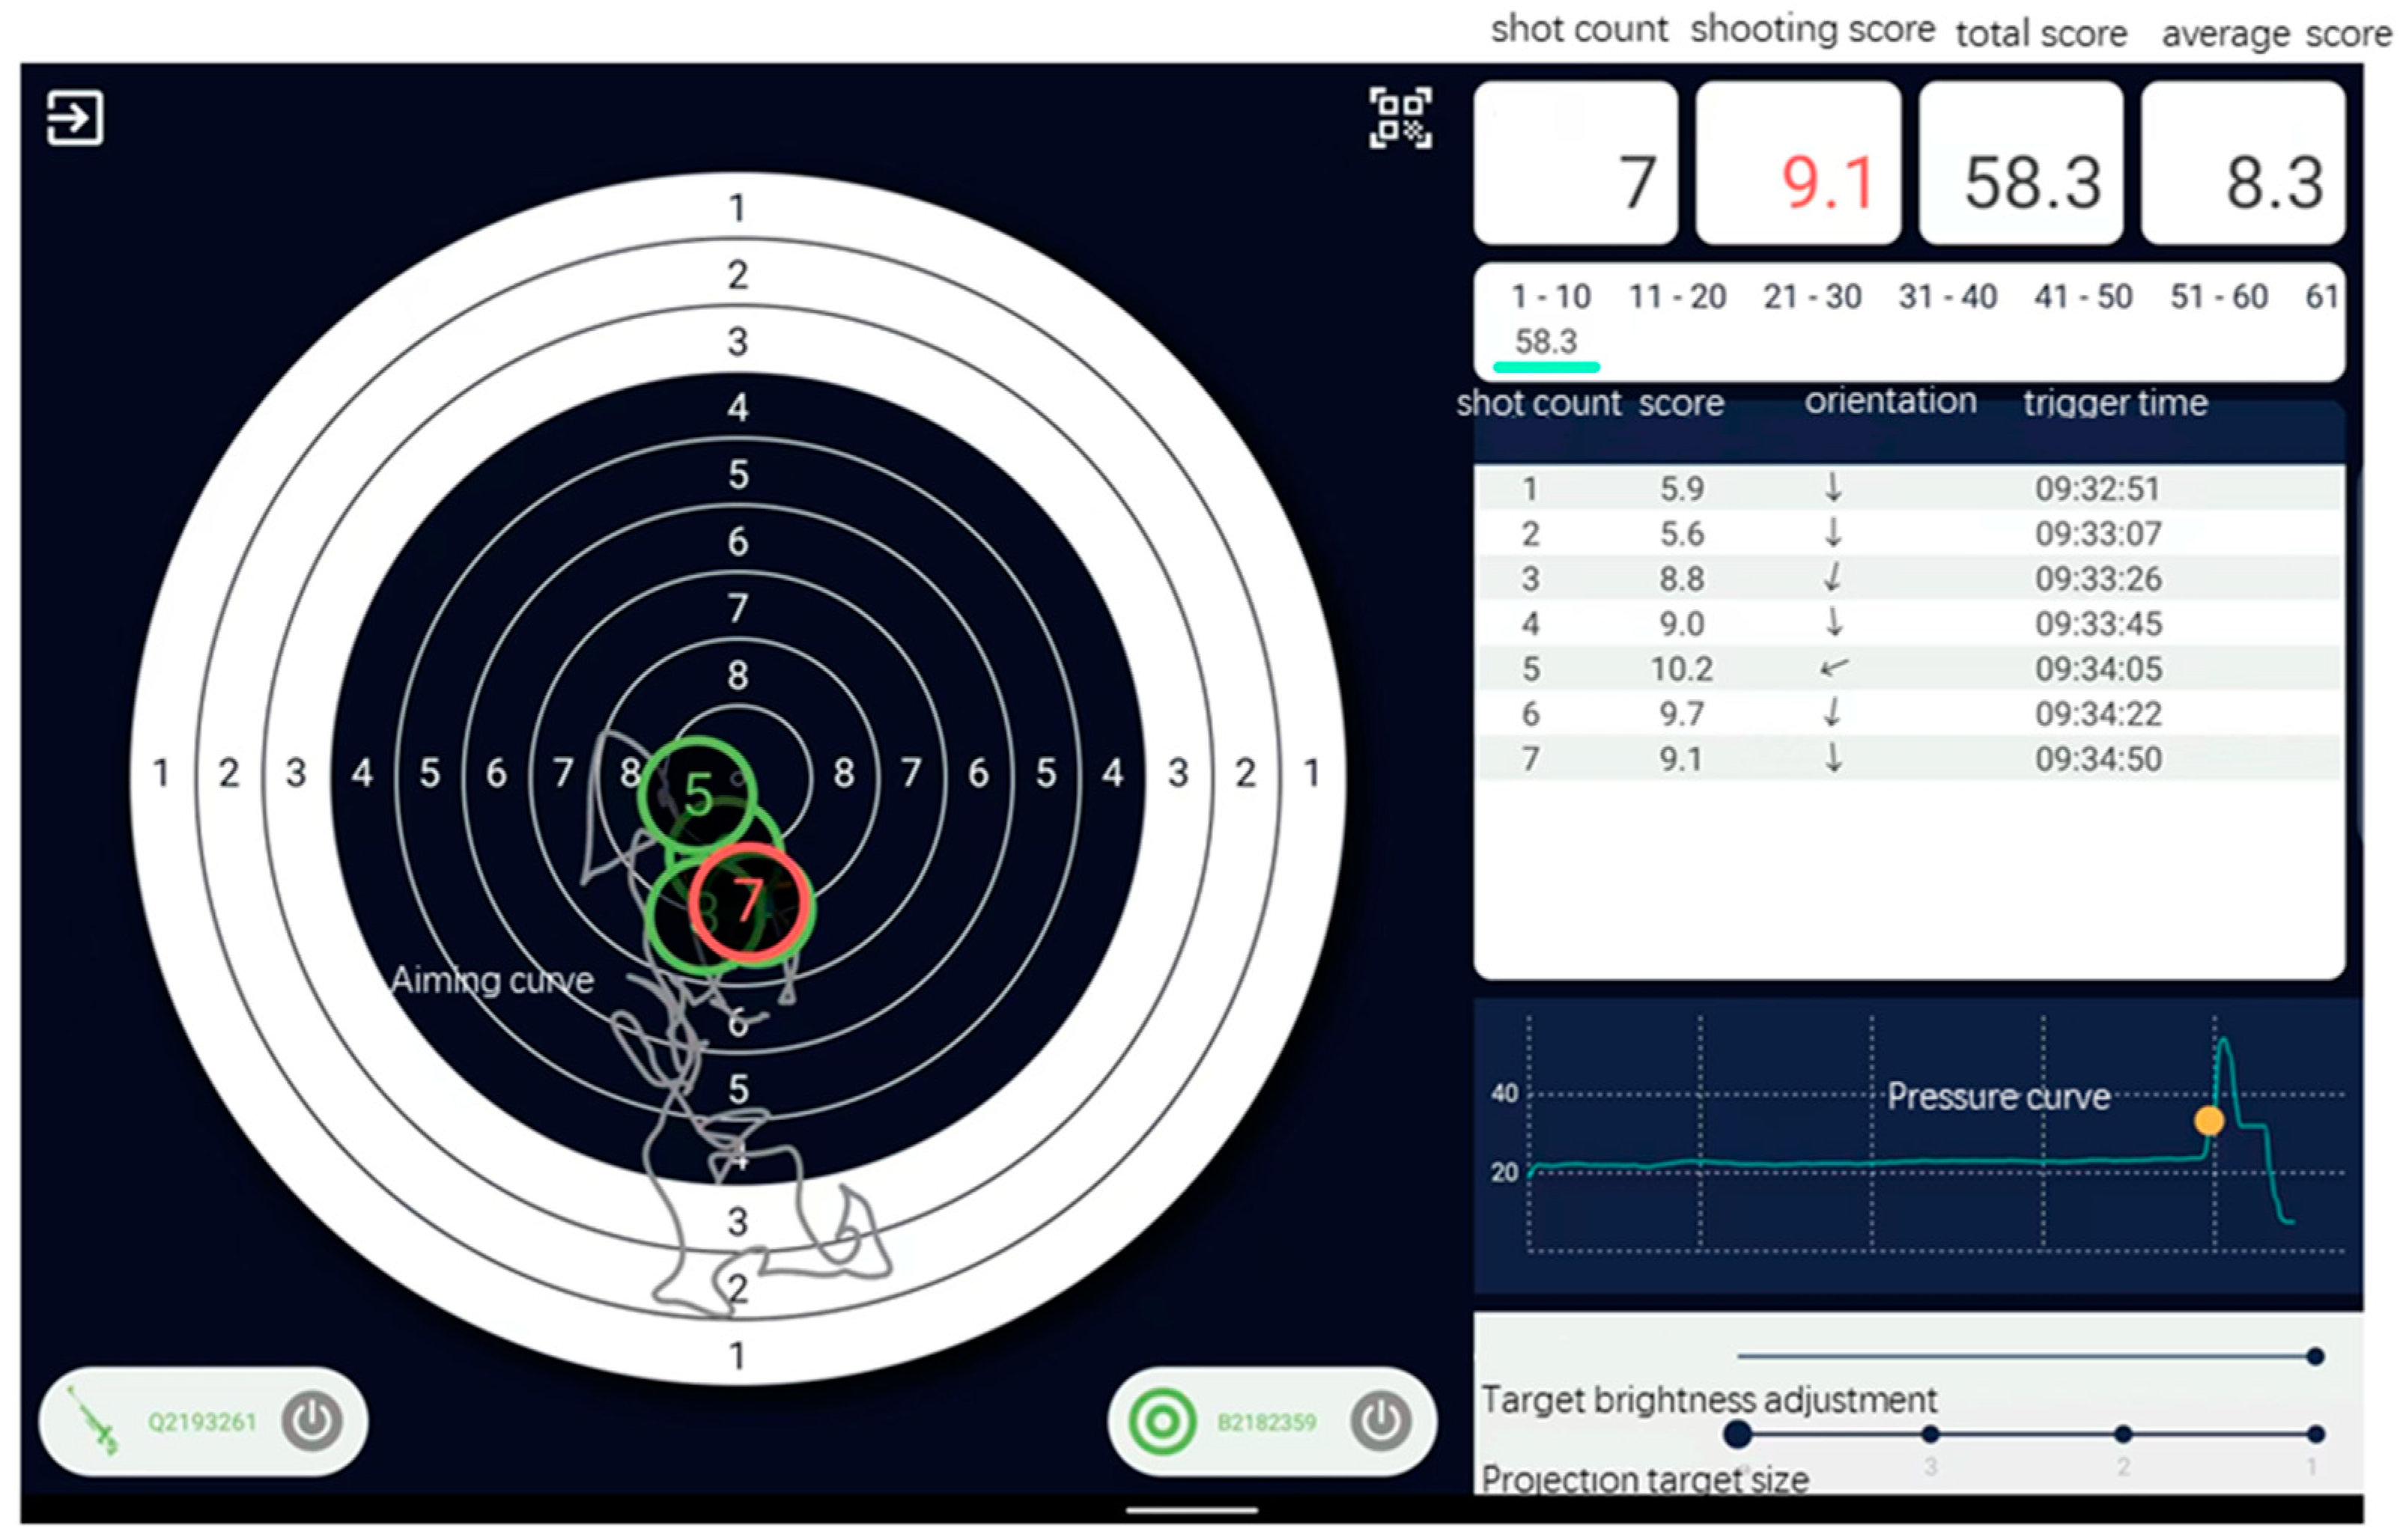
Figure 2.
The shooting system recorded each shot’s score, aiming, and pressure curve.
Figure 2.
The shooting system recorded each shot’s score, aiming, and pressure curve.
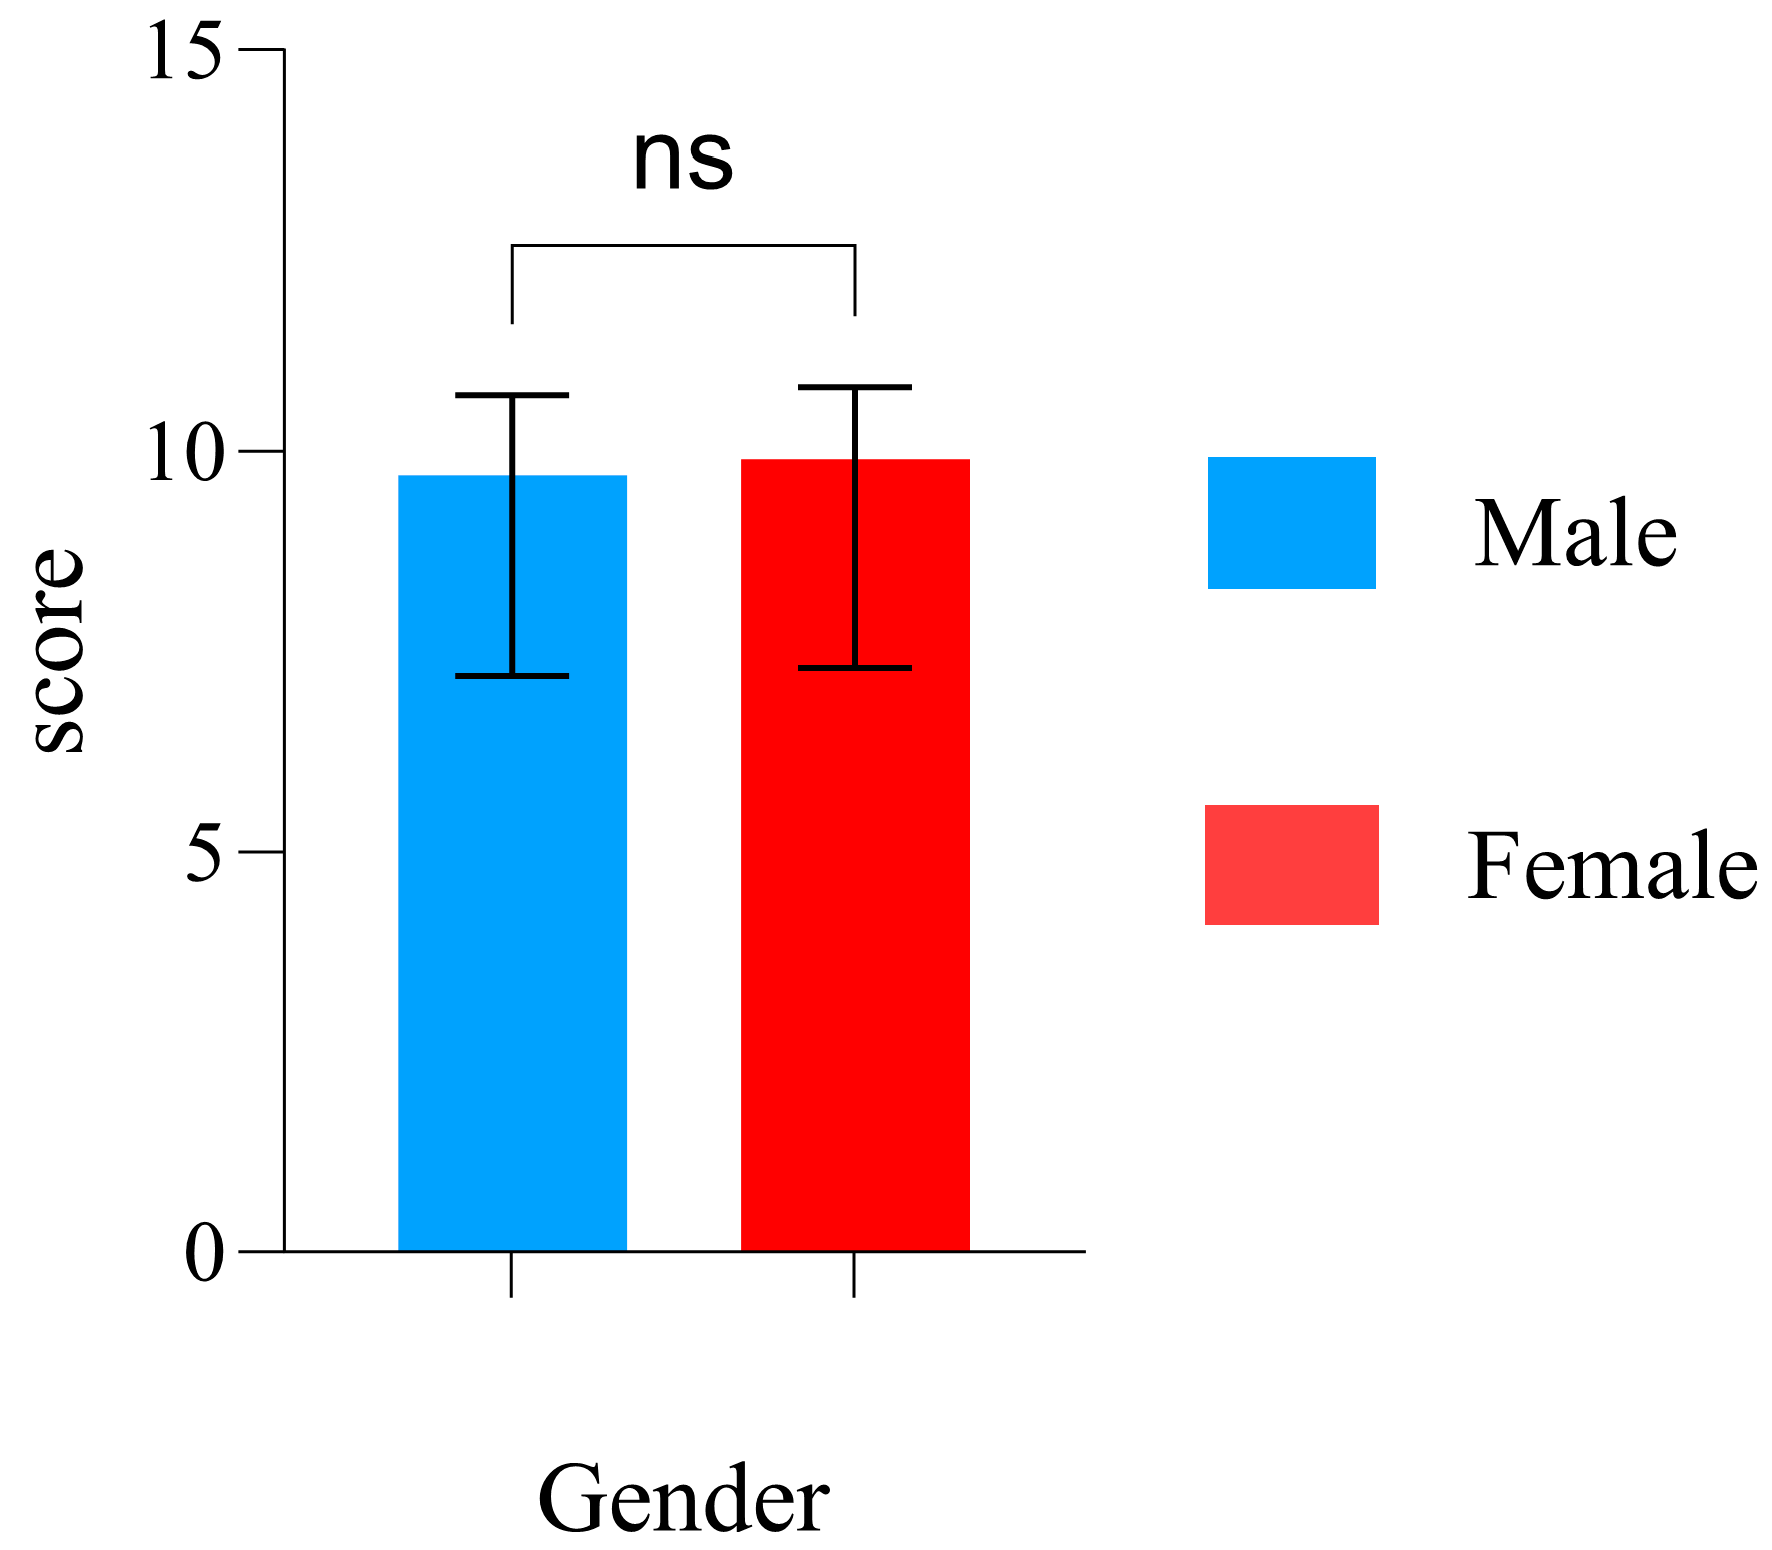
Figure 3.
Shooting scores of male and female subjects (ns indicates p > 0.05).
Figure 3.
Shooting scores of male and female subjects (ns indicates p > 0.05).
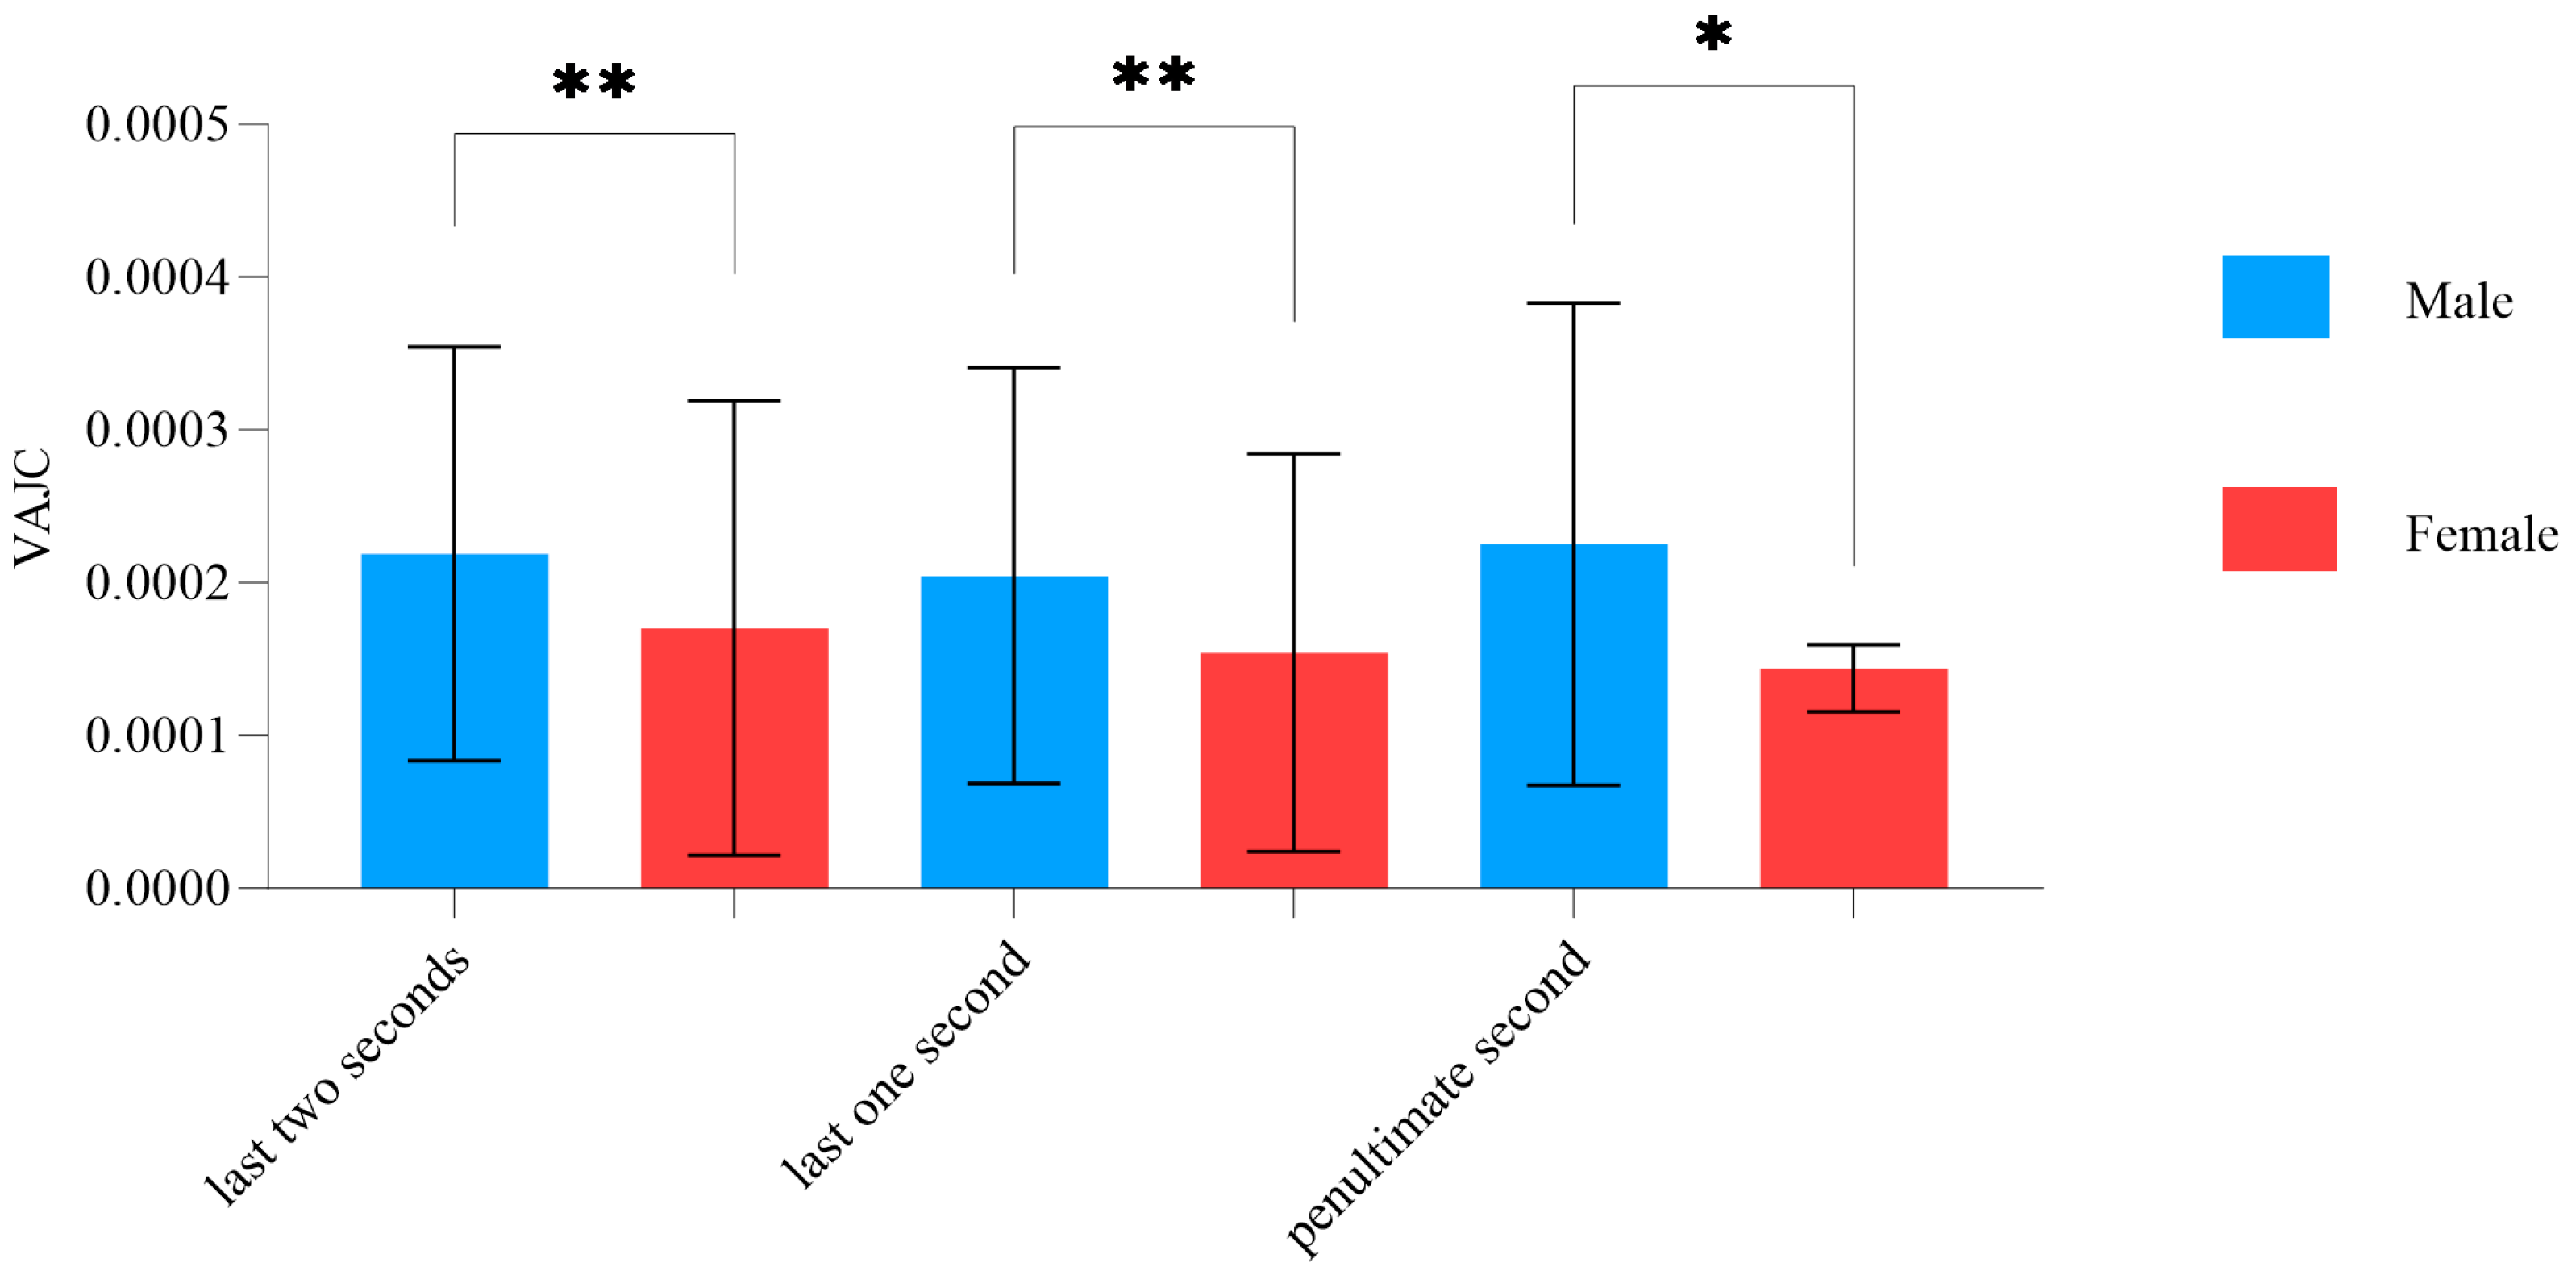
Figure 4.
Characteristics in the aiming stability variance (VAJC) between the male and female groups (* indicates p ≤ 0.05, ** indicates p ≤ 0.01).
Figure 4.
Characteristics in the aiming stability variance (VAJC) between the male and female groups (* indicates p ≤ 0.05, ** indicates p ≤ 0.01).
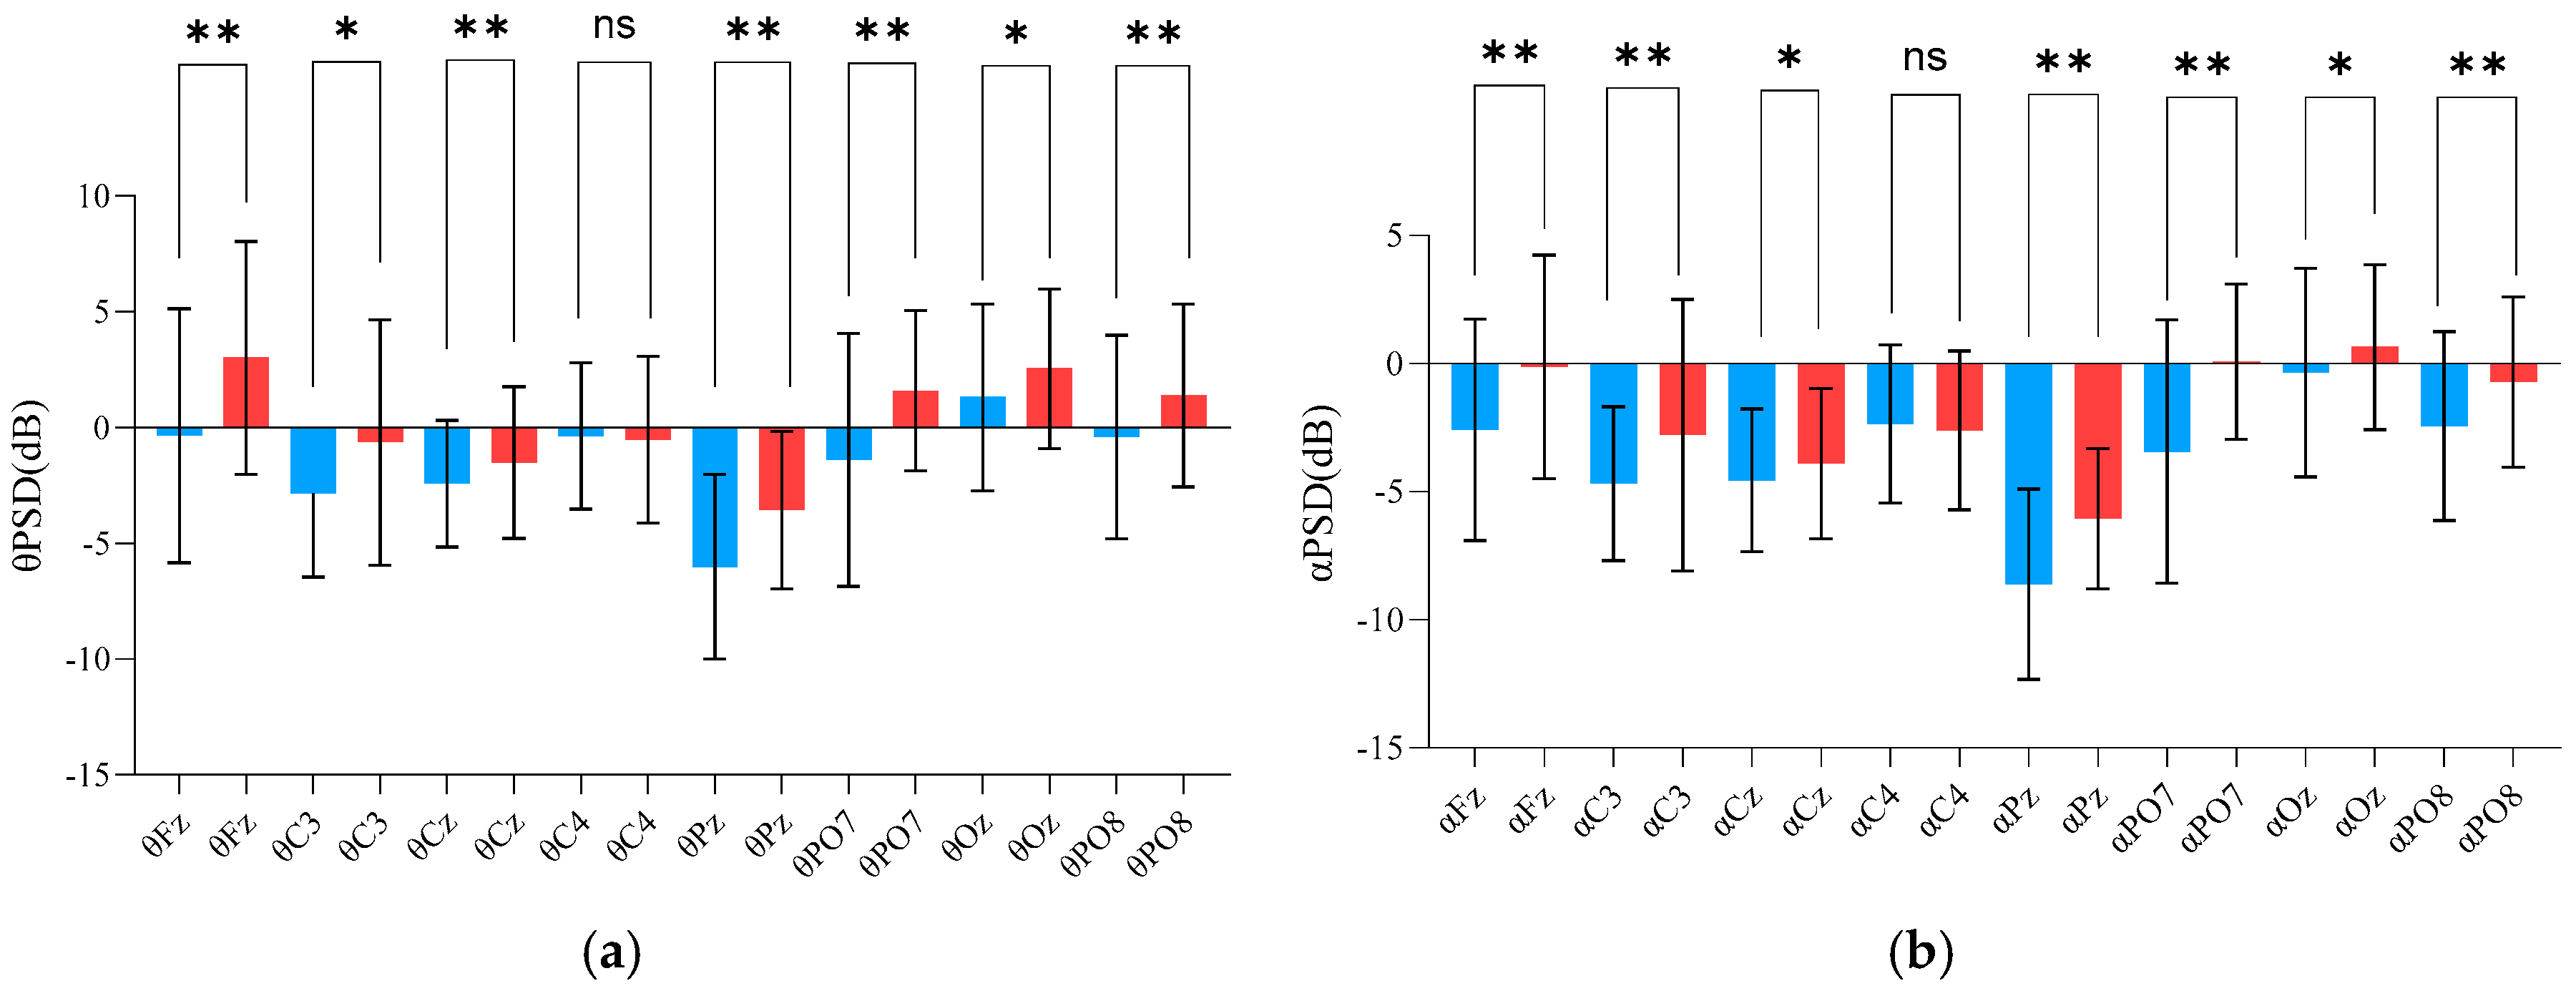
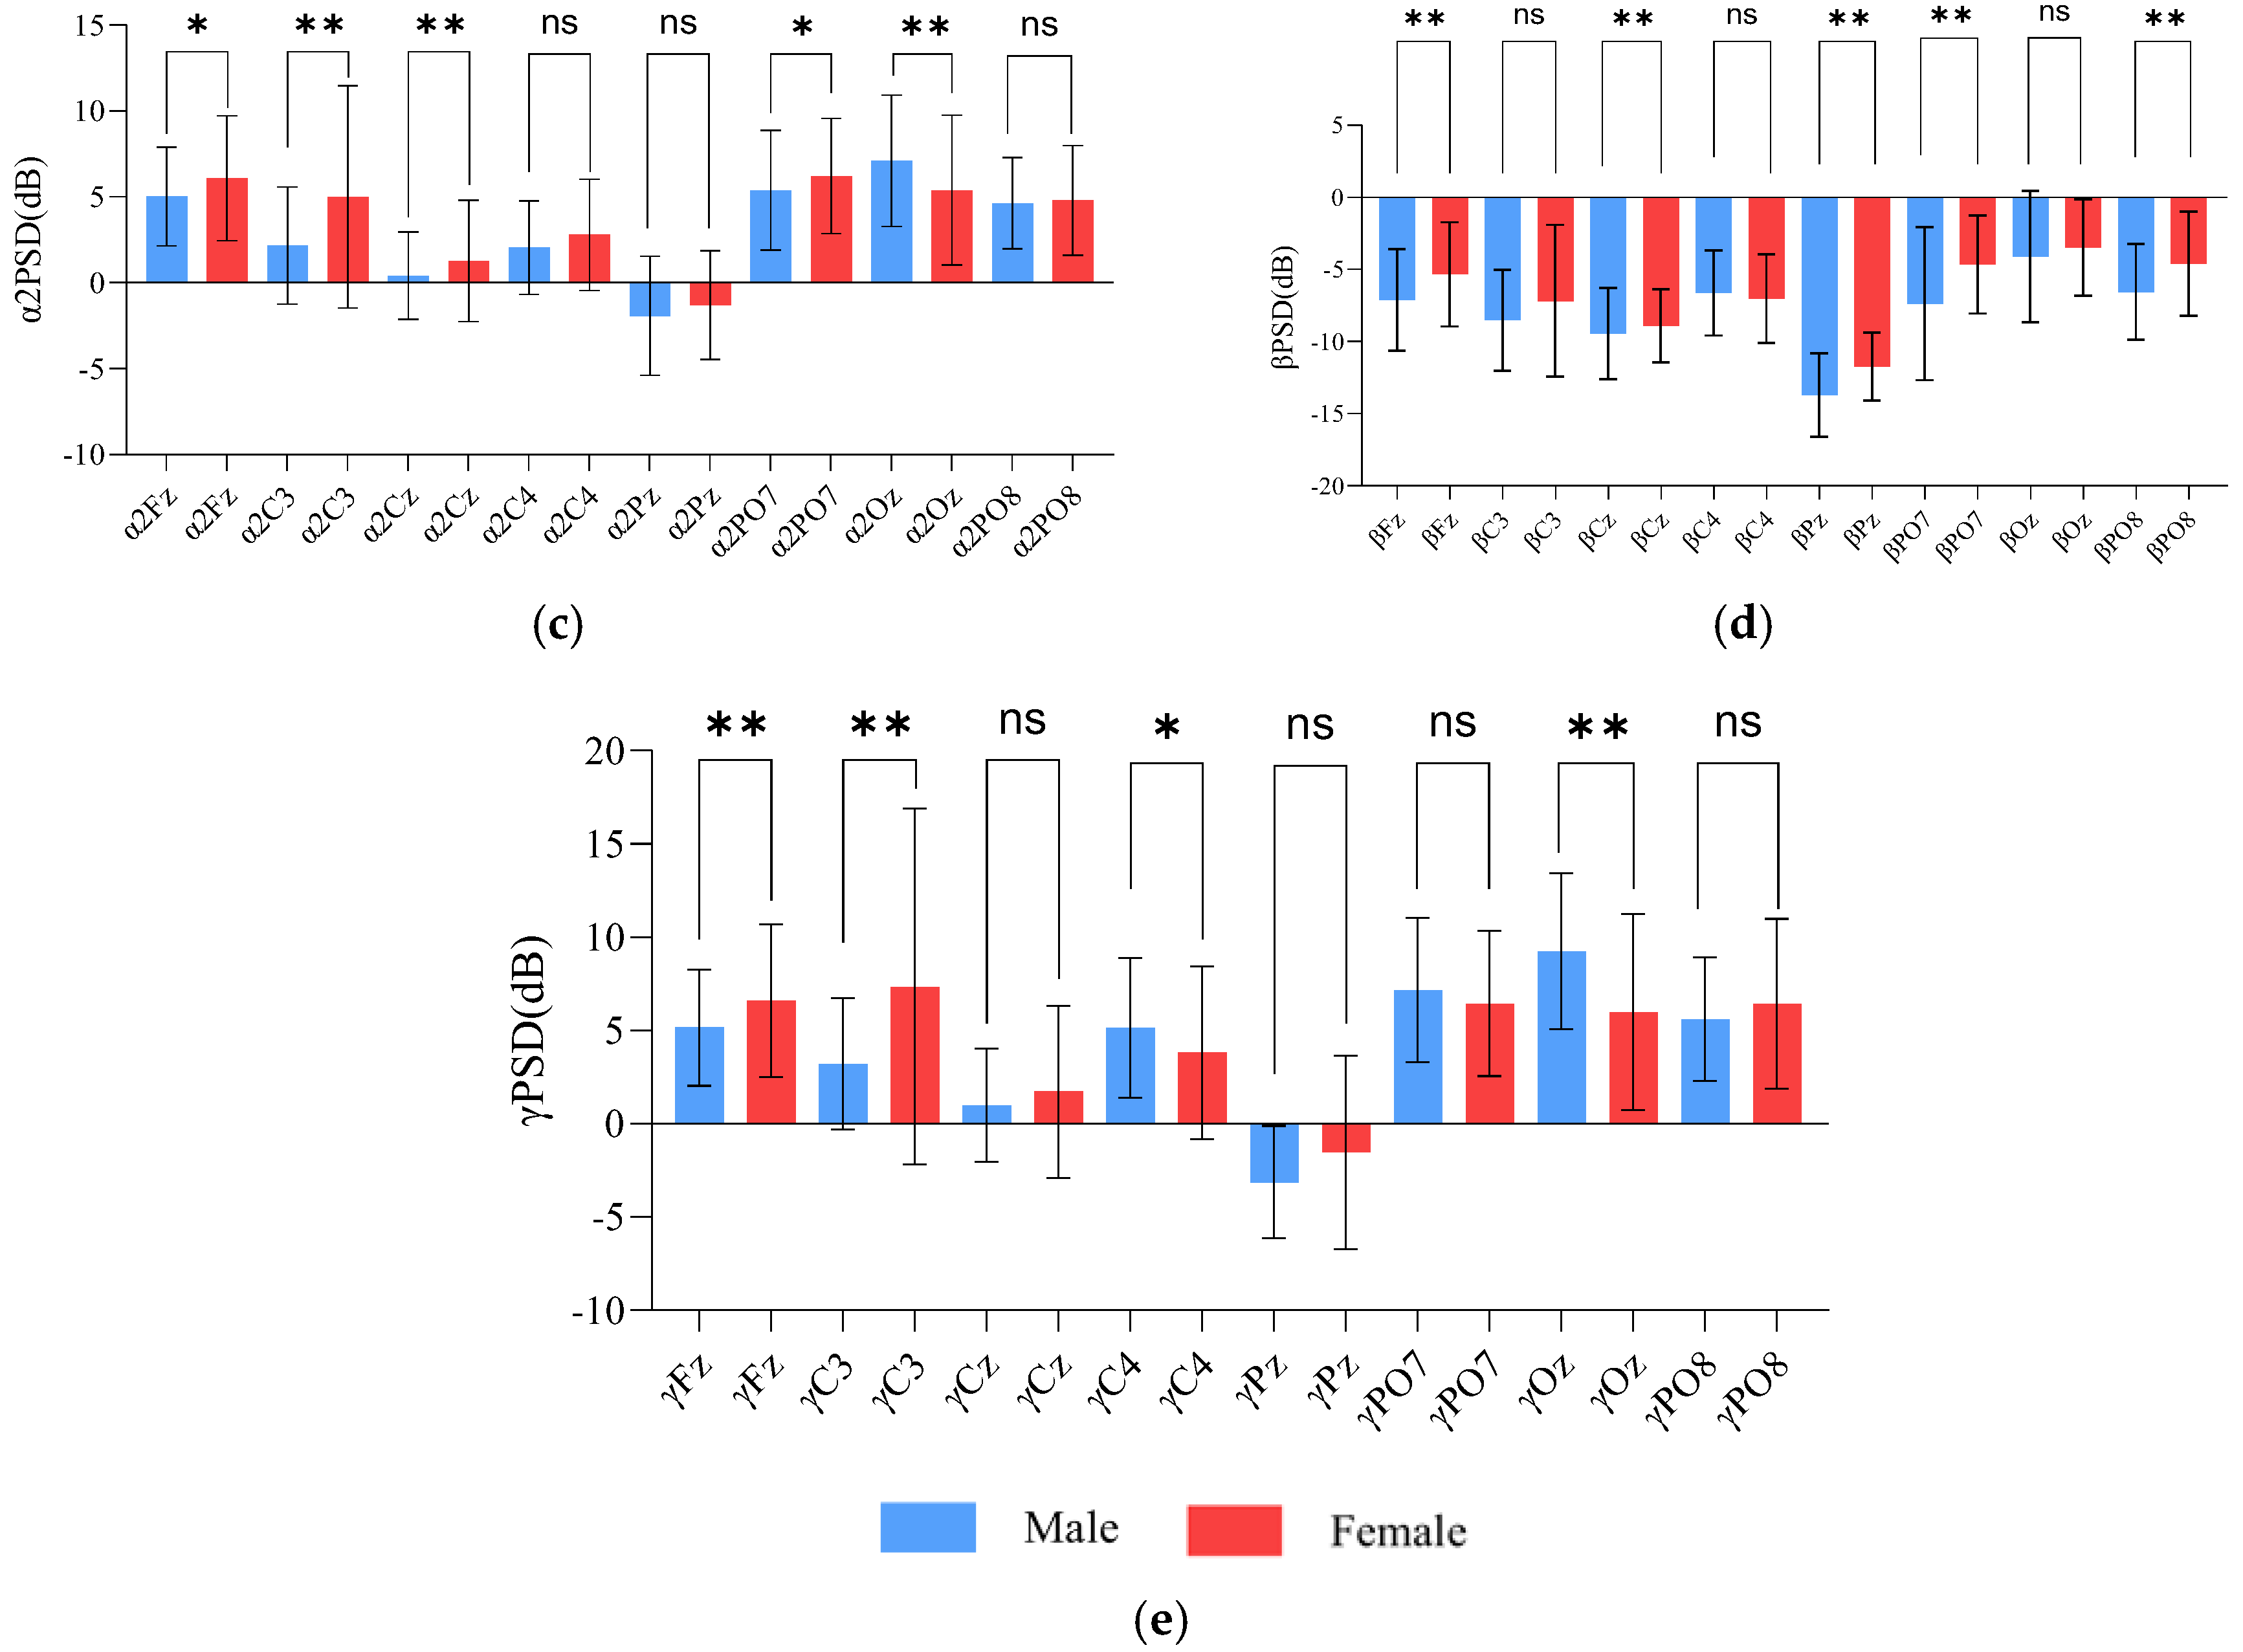
Figure 5.
Characteristics in the power spectral density (PSD) (dB) of the five bands (theta, alpha, alpha−2 (10−13 Hz), beta, and gamma) between the male and female groups in the aiming period. (a) Different sexual characteristics in the theta PSD, (b) different sexual characteristics in the alpha PSD, (c) different sexual characteristics in the alpha−2 PSD, (d) different sexual characteristics in the beta PSD, and (e) different sexual characteristics in the gamma PSD (ns indicates p > 0.05, * indicates p ≤ 0.05, ** indicates p ≤ 0.01).
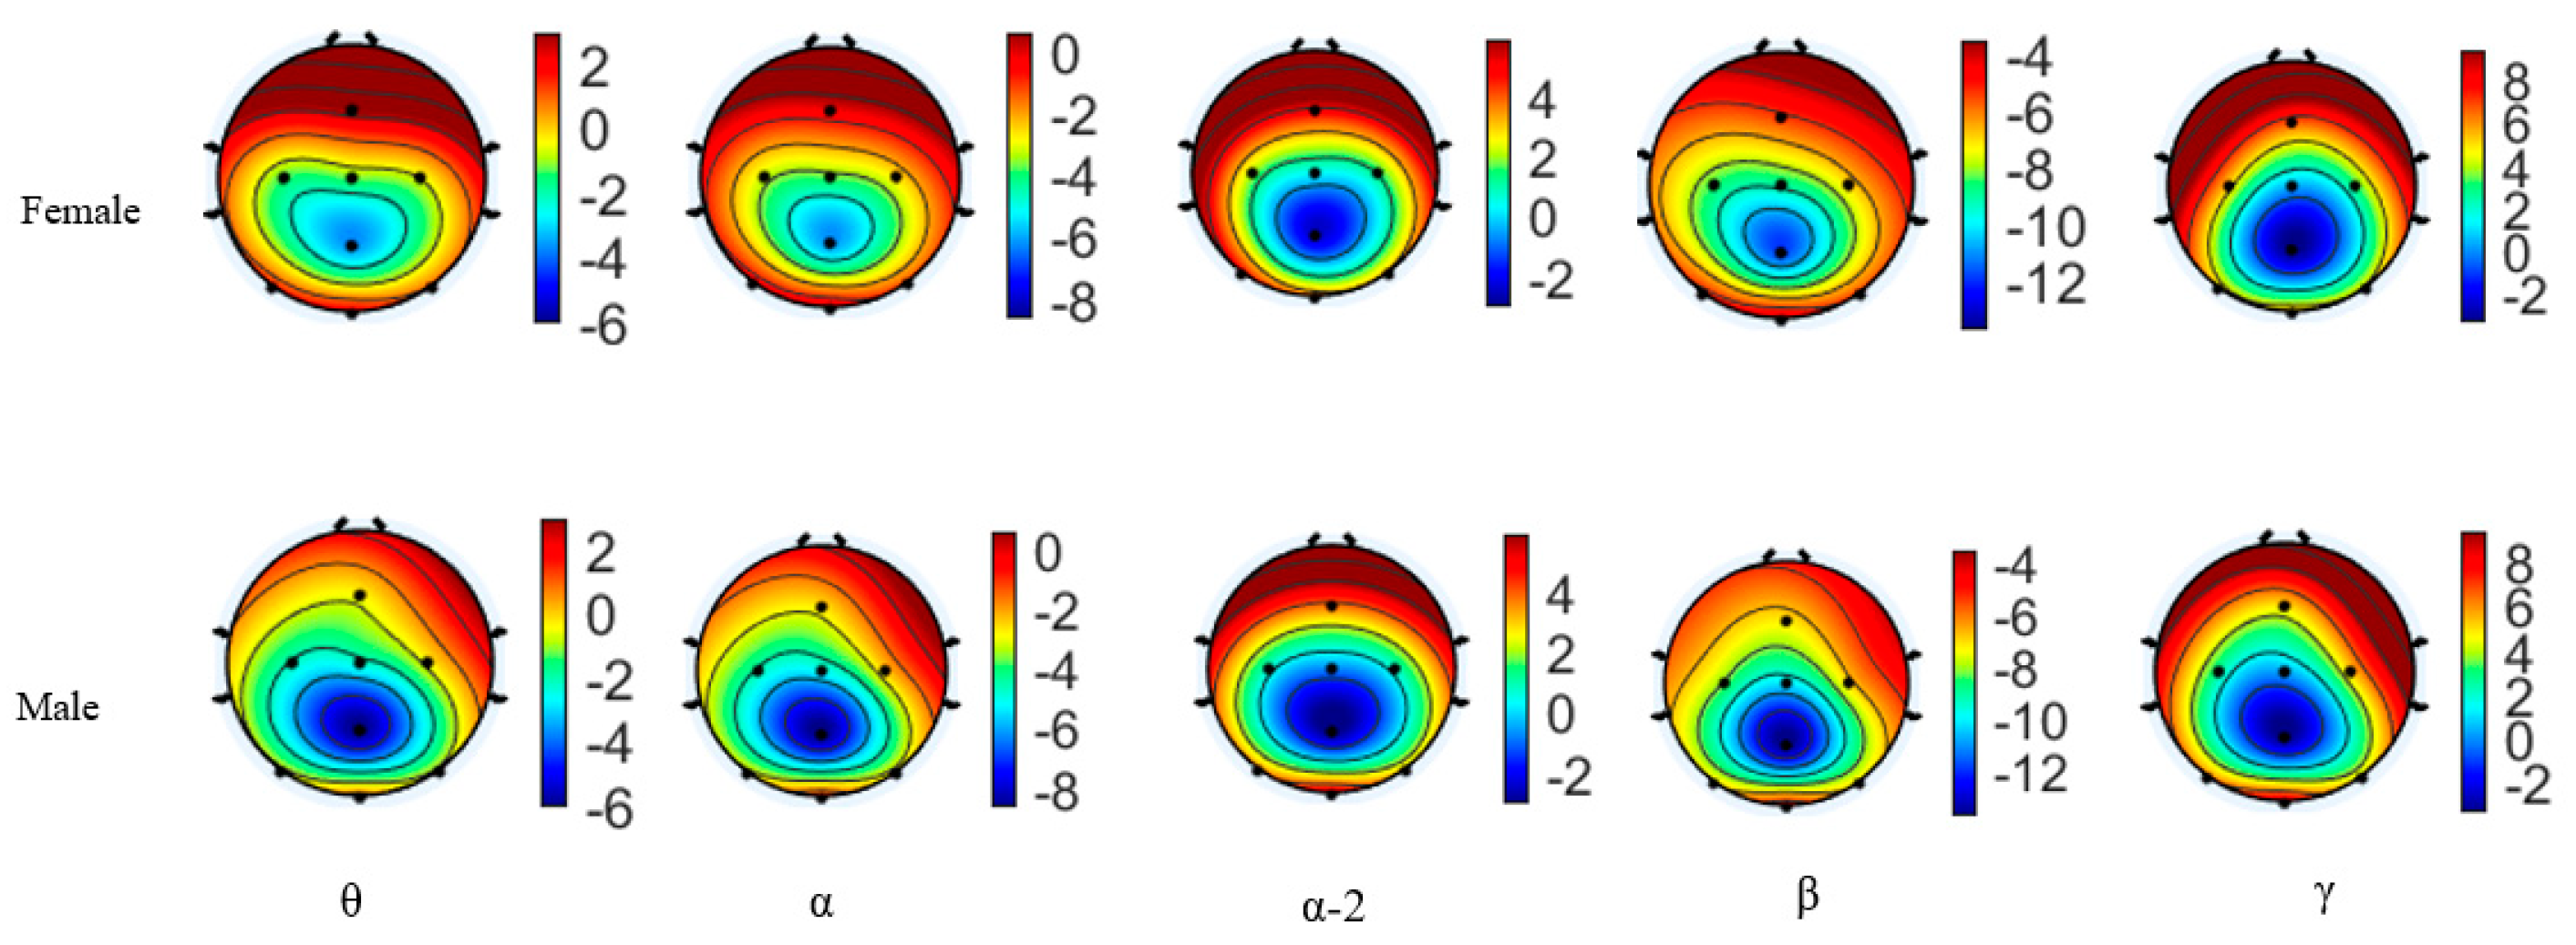
Figure 6.
The PSD EEG topographic map of different sexes in theta, alpha, alpha−2, beta, and gamma bands.
Figure 6.
The PSD EEG topographic map of different sexes in theta, alpha, alpha−2, beta, and gamma bands.
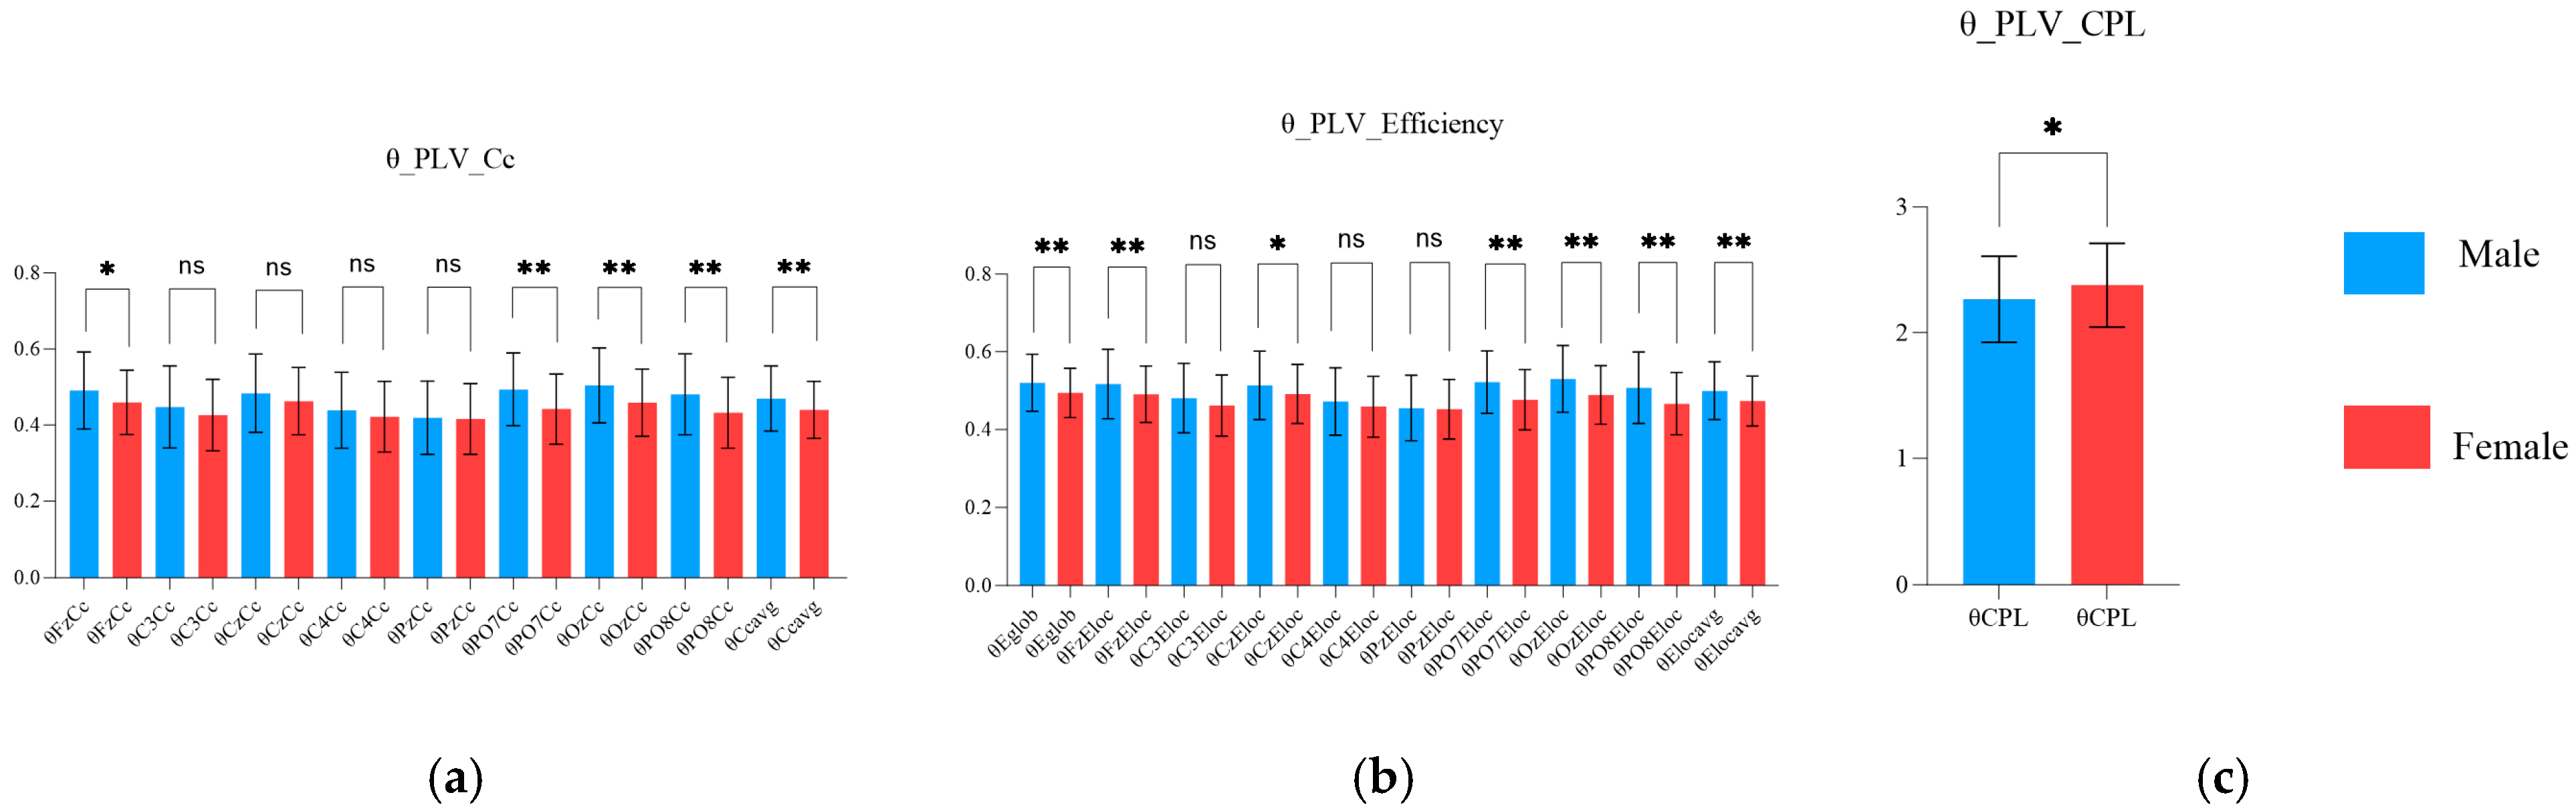
Figure 7.
Characteristics in the theta band’s phase-locking value (PLV) network properties between the male and female groups during the aiming period. (a) Sex characteristics in theta PLV Cc; (b) sex characteristics in theta PLV efficiency; and (c) sex characteristics in theta PLV CPL (ns indicates p > 0.05, * indicates p ≤ 0.05, ** indicates p ≤ 0.01).
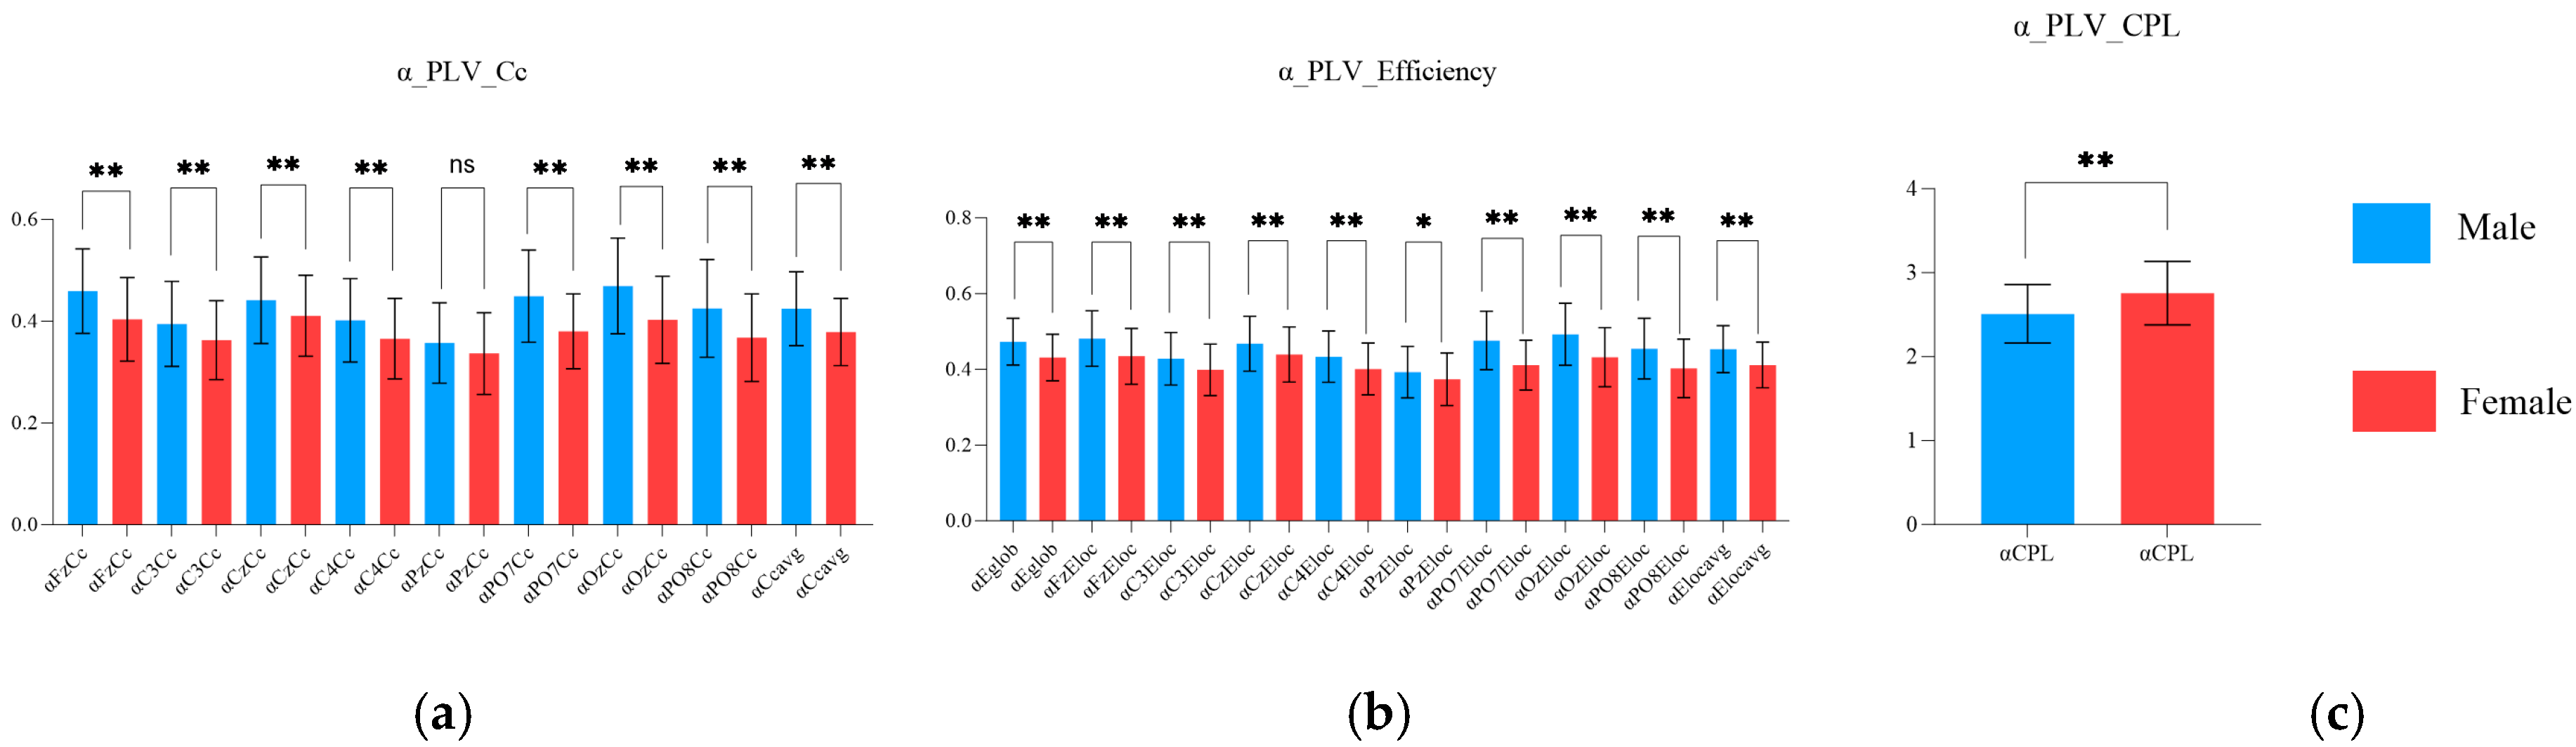
Figure 8.
Characteristics of the PLV network properties in the alpha band between the male and female groups during the aiming period. (a) sex characteristics in the alpha PLV Cc; (b) sex characteristics in the alpha PLV efficiency; and (c) sex characteristics in the alpha PLV CPL (ns indicates p > 0.05, * indicates p ≤ 0.05, ** indicates p ≤ 0.01).
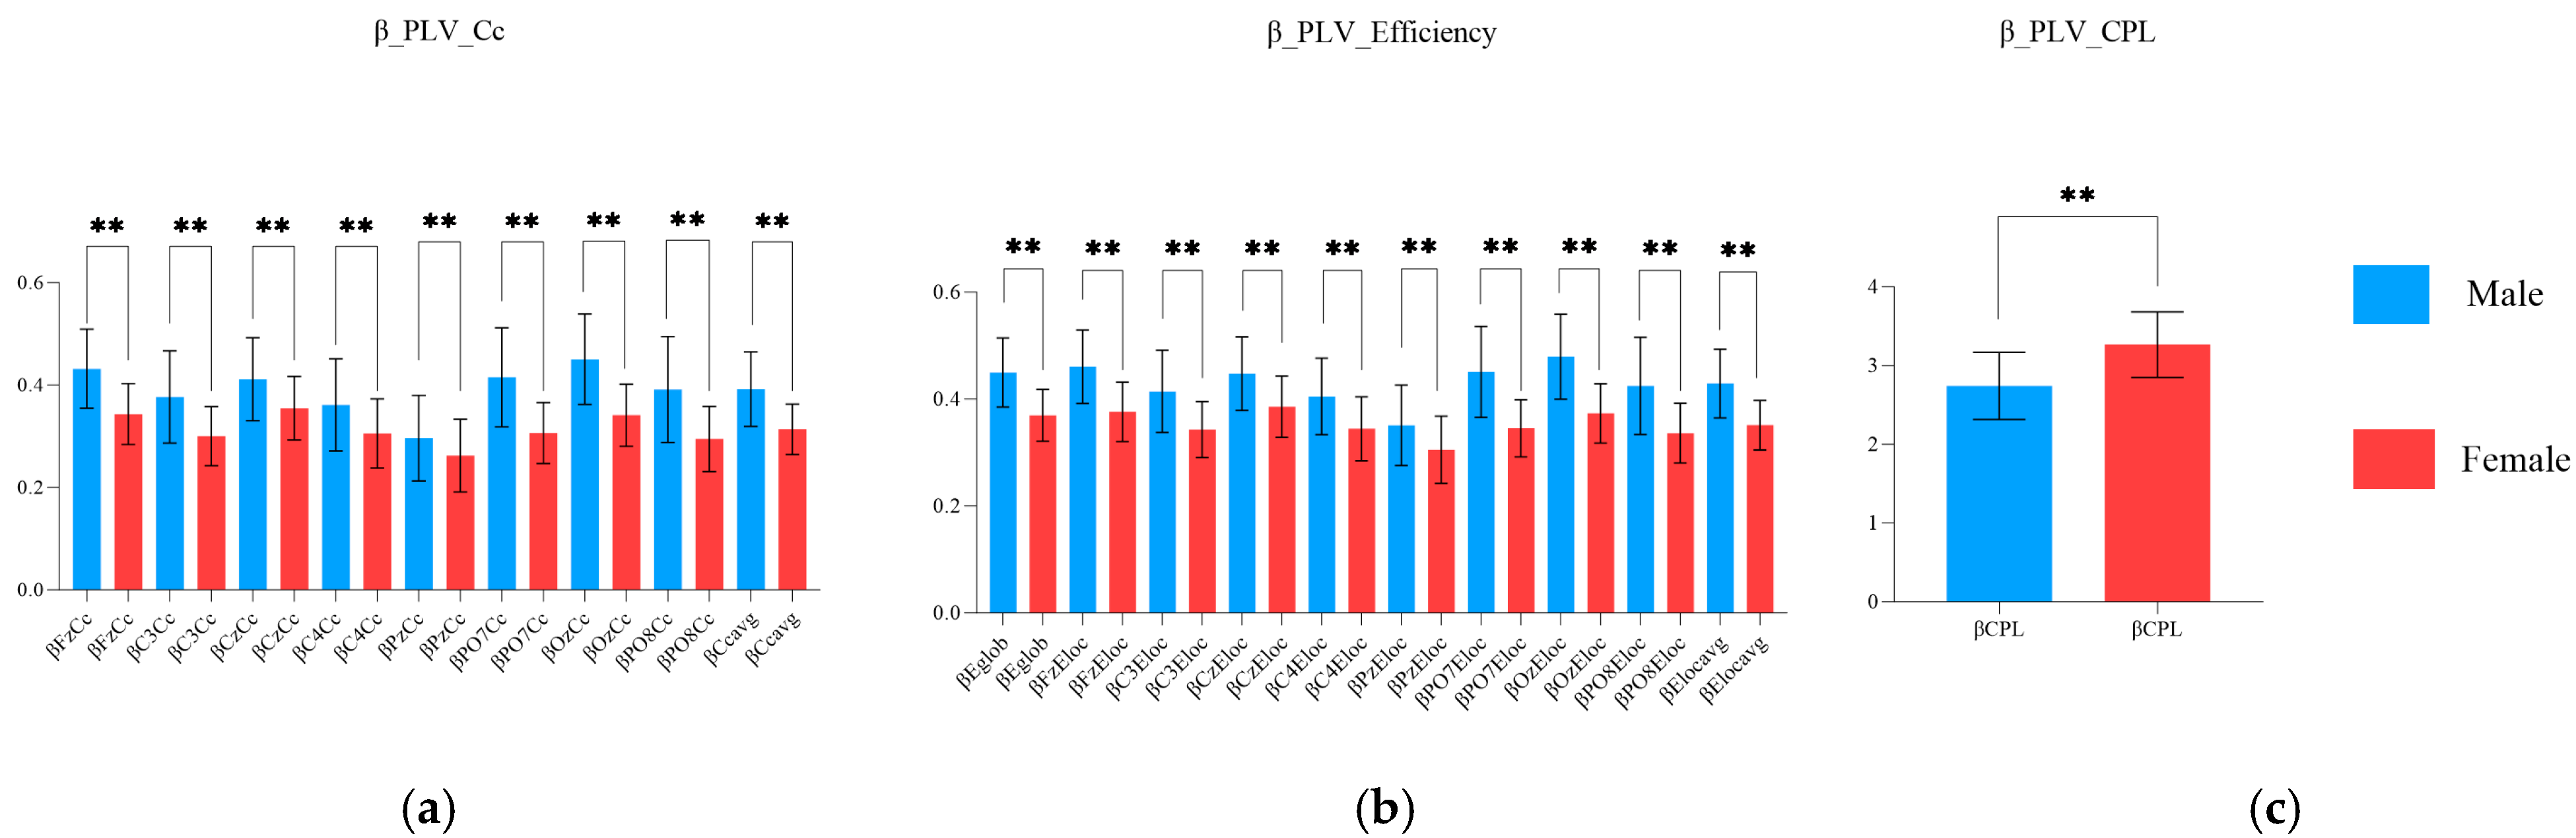
Figure 9.
Differences in the properties of the PLV network in the beta band between the male and female groups in the aiming period. (a) Sex characteristics in the beta PLV Cc; (b) sex characteristics in the beta PLV efficiency; and (c) sex characteristics in the beta PLV CPL (** indicates p ≤ 0.01).
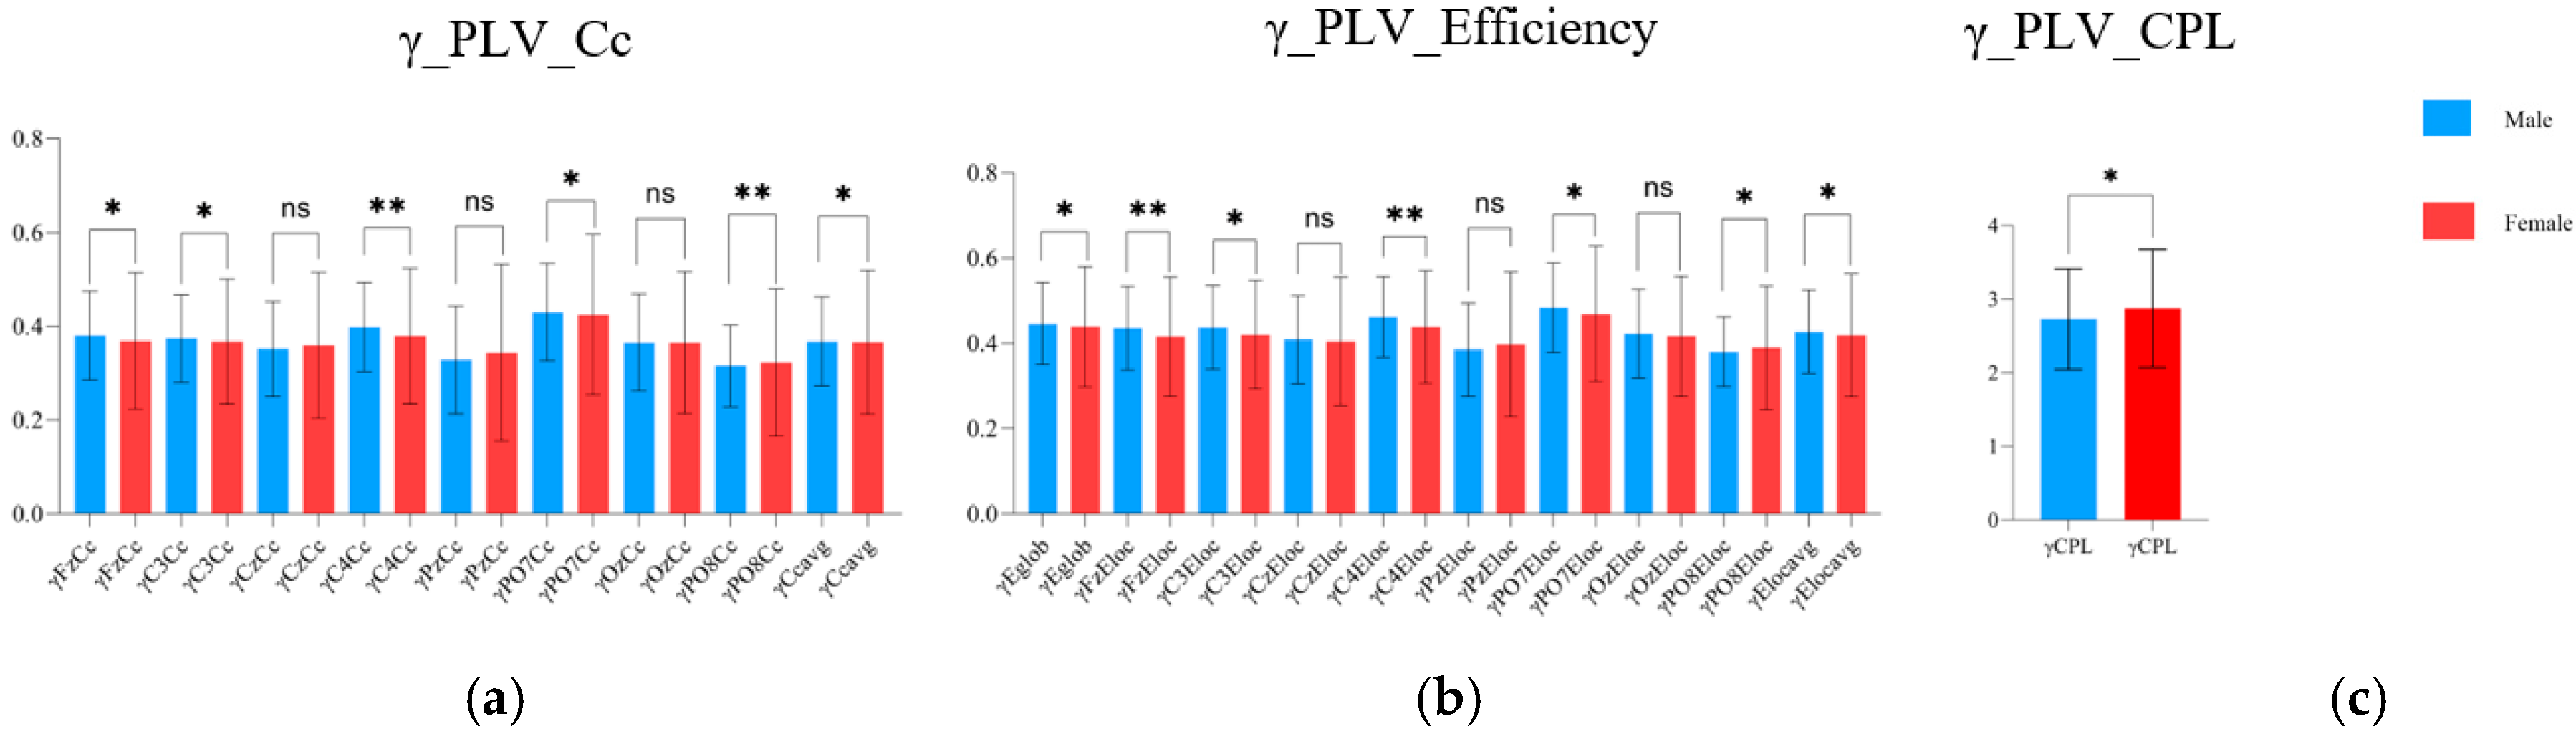
Figure 10.
Features in the properties of the PLV network in the gamma band between the male and female groups in the aiming period. (a) Sex characteristics in the gamma PLV Cc; (b) Sex characteristics in the gamma PLV efficiency; and (c) Sex characteristics in the gamma PLV CPL (ns indicates p > 0.05, * indicates p ≤ 0.05, ** indicates p ≤ 0.01).
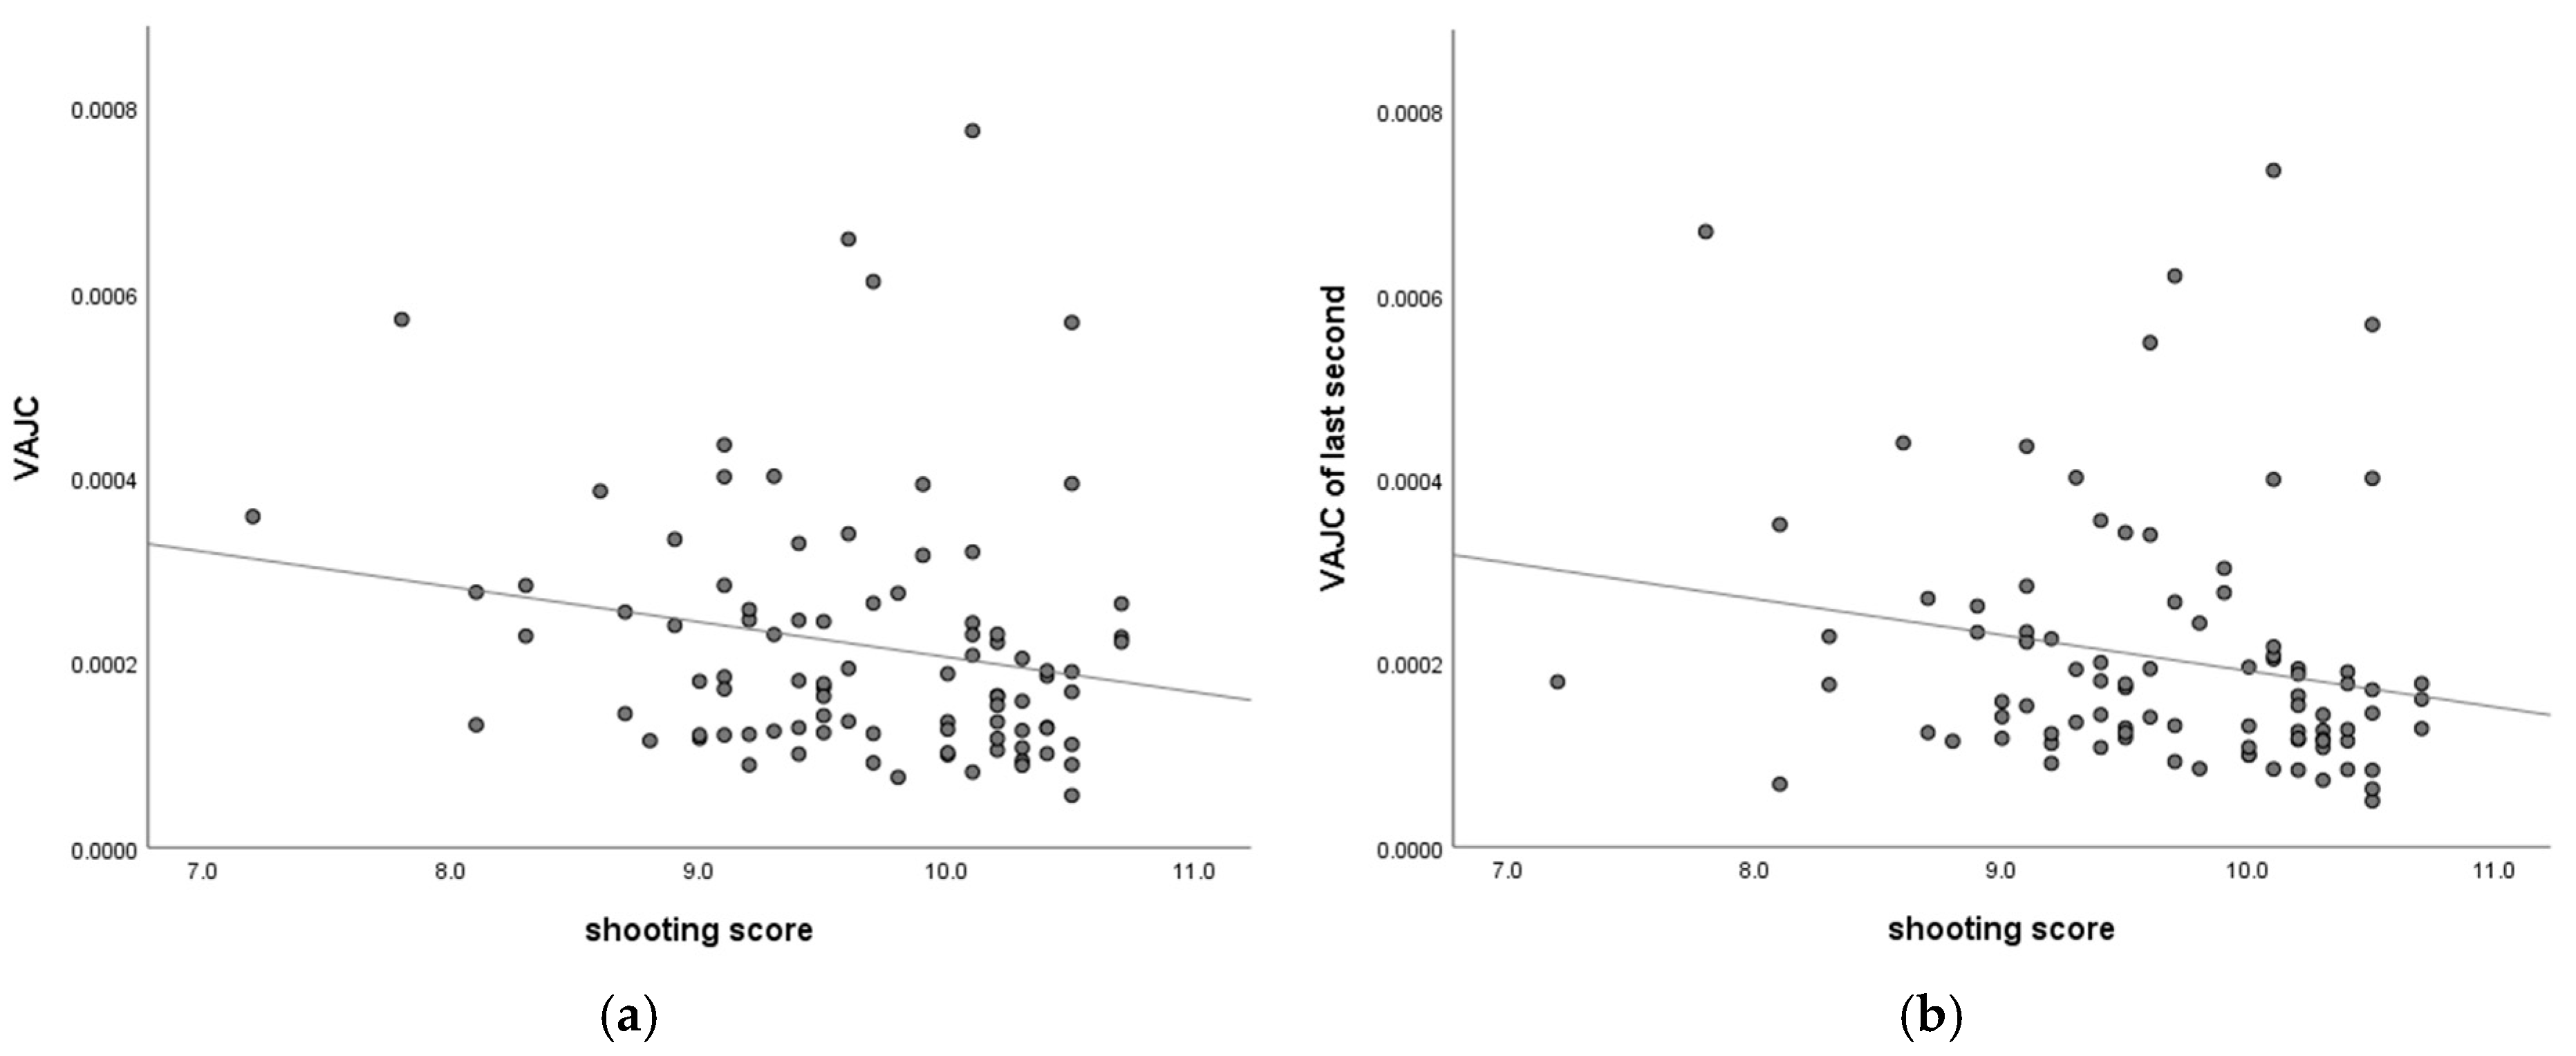
Figure 11.
Correlation between shooting score and VAJC in the male group. (a) Correlation between shooting score and VAJC in males; and (b) Correlation between shooting score and VAJC of last second in males.
Figure 11.
Correlation between shooting score and VAJC in the male group. (a) Correlation between shooting score and VAJC in males; and (b) Correlation between shooting score and VAJC of last second in males.
Table 1.
The shooting median scores of sexes.
Table 1.
The shooting median scores of sexes.
| Sex | Median Score |
|---|
| Male | 9.7 |
| Female | 9.9 |
Table 2.
The VAJC average values of sexes.
Table 2.
The VAJC average values of sexes.
| Sex | VAJC of the Last Two Seconds | VAJC of last One Second | VAJC of Penultimate Second |
|---|
| Male | 0.00018 | 0.0001640 | 0.0001870 |
| Female | 0.0001197 | 0.0001130 | 0.0001436 |
Table 3.
The PSD average value of sexes in the theta band (dB).
Table 3.
The PSD average value of sexes in the theta band (dB).
| Sex | θFz | θC3 | θCz | θC4 | θPz | θPO7 | θOz | θPO8 |
|---|
| Male | −0.3496 | −2.087 | −2.238 | −0.3623 | −6.019 | −0.2448 | 1.309 | −0.3021 |
| Female | 3.014 | −1.319 | −1.162 | −0.5263 | −3.565 | 1.935 | 2.543 | 1.245 |
Table 4.
The PSD average value of sexes in the alpha band (dB).
Table 4.
The PSD average value of sexes in the alpha band (dB).
| Sex | αFz | αC3 | αCz | αC4 | αPz | αPO7 | αOz | αPO8 |
|---|
| Male | −2.585 | −4.487 | −5.053 | −2.364 | −8.611 | −2.499 | −0.3475 | −2.470 |
| Female | −0.1233 | −3.146 | −3.673 | −2.604 | −6.058 | 0.1379 | 0.6435 | −0.9375 |
Table 5.
The PSD average value of sexes in the alpha-2 band (dB).
Table 5.
The PSD average value of sexes in the alpha-2 band (dB).
| Sex | α2Fz | α2C3 | α2Cz | α2C4 | α2Pz | α2PO7 | α2Oz | α2PO8 |
|---|
| Male | 3.889 | 0.7983 | −0.6692 | 0.8379 | −2.965 | 4.029 | 5.946 | 3.401 |
| Female | 5.018 | 2.141 | 0.3982 | 1.458 | −2.331 | 5.274 | 4.179 | 3.636 |
Table 6.
The PSD average value of sexes in the beta band (dB).
Table 6.
The PSD average value of sexes in the beta band (dB).
| Sex | βFz | βC3 | βCz | βC4 | βPz | βPO7 | βOz | βPO8 |
|---|
| Male | −7.102 | −8.157 | −10.09 | −6.924 | −13.71 | −6.722 | −4.091 | −6.744 |
| Female | −5.329 | −8.422 | −8.938 | −6.969 | −11.74 | −4.550 | −3.464 | −5.168 |
Table 7.
The PSD average value of sexes in the gamma band (dB).
Table 7.
The PSD average value of sexes in the gamma band (dB).
| Sex | γFz | γC3 | γCz | γC4 | γPz | γPO7 | γOz | γPO8 |
|---|
| Male | 5.093 | 2.698 | 0.3612 | 5.247 | −3.282 | 6.897 | 9.515 | 5.436 |
| Female | 6.847 | 5.235 | 0.4364 | 3.133 | −3.369 | 5.683 | 6.233 | 5.299 |
Table 8.
The Cc average values of sexes in the theta band.
Table 8.
The Cc average values of sexes in the theta band.
| Sex | Fz | C3 | Cz | C4 | Pz | PO7 | Oz | PO8 | Avg |
|---|
| Male | 0.4907 | 0.4477 | 0.4839 | 0.4294 | 0.4022 | 0.4940 | 0.5042 | 0.4810 | 0.4700 |
| Female | 0.4595 | 0.4265 | 0.4629 | 0.4068 | 0.3998 | 0.4421 | 0.4588 | 0.4324 | 0.4400 |
Table 9.
The efficiency average values of sexes in the theta band.
Table 9.
The efficiency average values of sexes in the theta band.
| Sex | Eglob | Fz | C3 | Cz | C4 | Pz | PO7 | Oz | PO8 | Avg | CPL |
|---|
| Male | 0.5204 | 0.5171 | 0.4681 | 0.5137 | 0.4599 | 0.4443 | 0.5221 | 0.5303 | 0.5076 | 0.4938 | 2.266 |
| Female | 0.4940 | 0.4909 | 0.4581 | 0.4917 | 0.4456 | 0.4345 | 0.4766 | 0.4890 | 0.4665 | 0.4645 | 2.378 |
Table 10.
The Cc average values of sexes in the alpha band.
Table 10.
The Cc average values of sexes in the alpha band.
| Sex | Fz | C3 | Cz | C4 | Pz | PO7 | Oz | PO8 | Avg |
|---|
| Male | 0.4554 | 0.3845 | 0.4357 | 0.3817 | 0.3415 | 0.4493 | 0.4672 | 0.4332 | 0.4152 |
| Female | 0.3976 | 0.3536 | 0.4096 | 0.3596 | 0.3300 | 0.3803 | 0.3977 | 0.3523 | 0.3692 |
Table 11.
The efficiency average values of sexes in the alpha band.
Table 11.
The efficiency average values of sexes in the alpha band.
| Sex | Eglob | Fz | C3 | Cz | C4 | Pz | PO7 | Oz | PO8 | Avg | CPL |
|---|
| Male | 0.4375 | 0.4752 | 0.4181 | 0.4680 | 0.4212 | 0.3856 | 0.4764 | 0.4892 | 0.4602 | 0.4505 | 2.509 |
| Female | 0.4298 | 0.4351 | 0.3861 | 0.4397 | 0.3914 | 0.3639 | 0.4115 | 0.4262 | 0.3889 | 0.4078 | 2.756 |
Table 12.
The Cc average values of sexes in the beta band.
Table 12.
The Cc average values of sexes in the beta band.
| Sex | Fz | C3 | Cz | C4 | Pz | PO7 | Oz | PO8 | Avg |
|---|
| Male | 0.4320 | 0.3707 | 0.4112 | 0.3639 | 0.2802 | 0.4101 | 0.4386 | 0.3882 | 0.3820 |
| Female | 0.3432 | 0.2925 | 0.3549 | 0.3008 | 0.2470 | 0.3013 | 0.3305 | 0.2856 | 0.3097 |
Table 13.
The efficiency average values of sexes in the beta band.
Table 13.
The efficiency average values of sexes in the beta band.
| Sex | Eglob | Fz | C3 | Cz | C4 | Pz | PO7 | Oz | PO8 | Avg | CPL |
|---|
| Male | 0.4402 | 0.4607 | 0.4014 | 0.4477 | 0.3878 | 0.3306 | 0.4364 | 0.4662 | 0.4247 | 0.4173 | 2.742 |
| Female | 0.3647 | 0.3763 | 0.3370 | 0.3857 | 0.3437 | 0.2953 | 0.3388 | 0.3671 | 0.3336 | 0.3457 | 3.267 |
Table 14.
The Cc average values of sexes in the gamma band.
Table 14.
The Cc average values of sexes in the gamma band.
| Sex | Fz | C3 | Cz | C4 | Pz | PO7 | Oz | PO8 | Avg |
|---|
| Male | 0.3722 | 0.3666 | 0.3519 | 0.4099 | 0.3002 | 0.4346 | 0.3547 | 0.2987 | 0.3607 |
| Female | 0.3288 | 0.3144 | 0.2987 | 0.3251 | 0.2553 | 0.3624 | 0.3129 | 0.2573 | 0.3020 |
Table 15.
The Efficiency average values of sexes in the gamma band.
Table 15.
The Efficiency average values of sexes in the gamma band.
| Sex | Eglob | Fz | C3 | Cz | C4 | Pz | PO7 | Oz | PO8 | Avg | CPL |
|---|
| Male | 0.4500 | 0.4350 | 0.4400 | 0.4150 | 0.4700 | 0.3700 | 0.4900 | 0.4200 | 0.3600 | 0.4300 | 2.622 |
| Female | 0.3855 | 0.3665 | 0.3791 | 0.3532 | 0.3888 | 0.3278 | 0.4094 | 0.3678 | 0.3340 | 0.3671 | 2.983 |
Table 16.
The significant correlations between the shooting score and PSD according to sex in the case.
Table 16.
The significant correlations between the shooting score and PSD according to sex in the case.
| | PSD |
|---|
| | | R | p |
|---|
| Male | thetaPO8 | 0.223 | 0.035 |
| alphaC3 | −0.273 | 0.010 |
| alphaC4 | −0.220 | 0.039 |
| alpha-2PO7 | −0.278 | 0.0087 |
| betaC3 | −0.261 | 0.014 |
| betaC4 | −0.249 | 0.019 |
| gammaC3 | −0.230 | 0.031 |
| gammaC4 | −0.320 | 0.002 |
| Female | alphaC4 | 0.242 | 0.005 |
| alphaPO7 | 0.266 | 0.002 |
| alpha-2PO7 | 0.188 | 0.028 |
| betaFz | 0.171 | 0.046 |
| betaPO7 | 0.249 | 0.003 |
| gammaC3 | 0.208 | 0.015 |
| gammaPO8 | 0.233 | 0.006 |
Table 17.
The significant correlations between the shooting score and PLV according to sex in the case.
Table 17.
The significant correlations between the shooting score and PLV according to sex in the case.
| | PLV |
|---|
| | | R | p |
|---|
| Male | alphaPz_Cc | −0.254 | 0.016 |
| alphaPz_Eloc | −0.267 | 0.011 |
| betaPz_Cc | −0.328 | 0.002 |
| betaPz_Eloc | −0.352 | 0.001 |
| gammaC4Eloc | 0.216 | 0.043 |
| gammaPzEloc | 0.224 | 0.036 |
| Female | alphaPO8_Eloc | −0.178 | 0.038 |
| betaOz_Cc | −0.169 | 0.050 |
| betaOz_Eloc | −0.22 | 0.010 |
| gammaPO8Cc | 0.191 | 0.026 |
Table 18.
Correlations between shooting score and VAJC according to sex in the study.
Table 18.
Correlations between shooting score and VAJC according to sex in the study.
| | | R | p |
|---|
| Male | VAJC | −0.234 | 0.026 |
| | VAJC of last second | −0.281 | 0.007 |
| Female | VAJC | −0.073 | 0.39 |
| | VAJC of last second | −0.103 | 0.228 |


