Does Q.Clear Processing Change PET Ratios? Quantitative Evidence Using BTXBrain-DAT
Abstract
1. Introduction
2. Materials and Methods
2.1. Study Design
2.2. Imaging Protocol: PET/CT Scanning
2.3. Data Analysis Using BTXBrain-DAT
2.4. Variables for Comparison
2.5. Statistical Analysis
3. Results
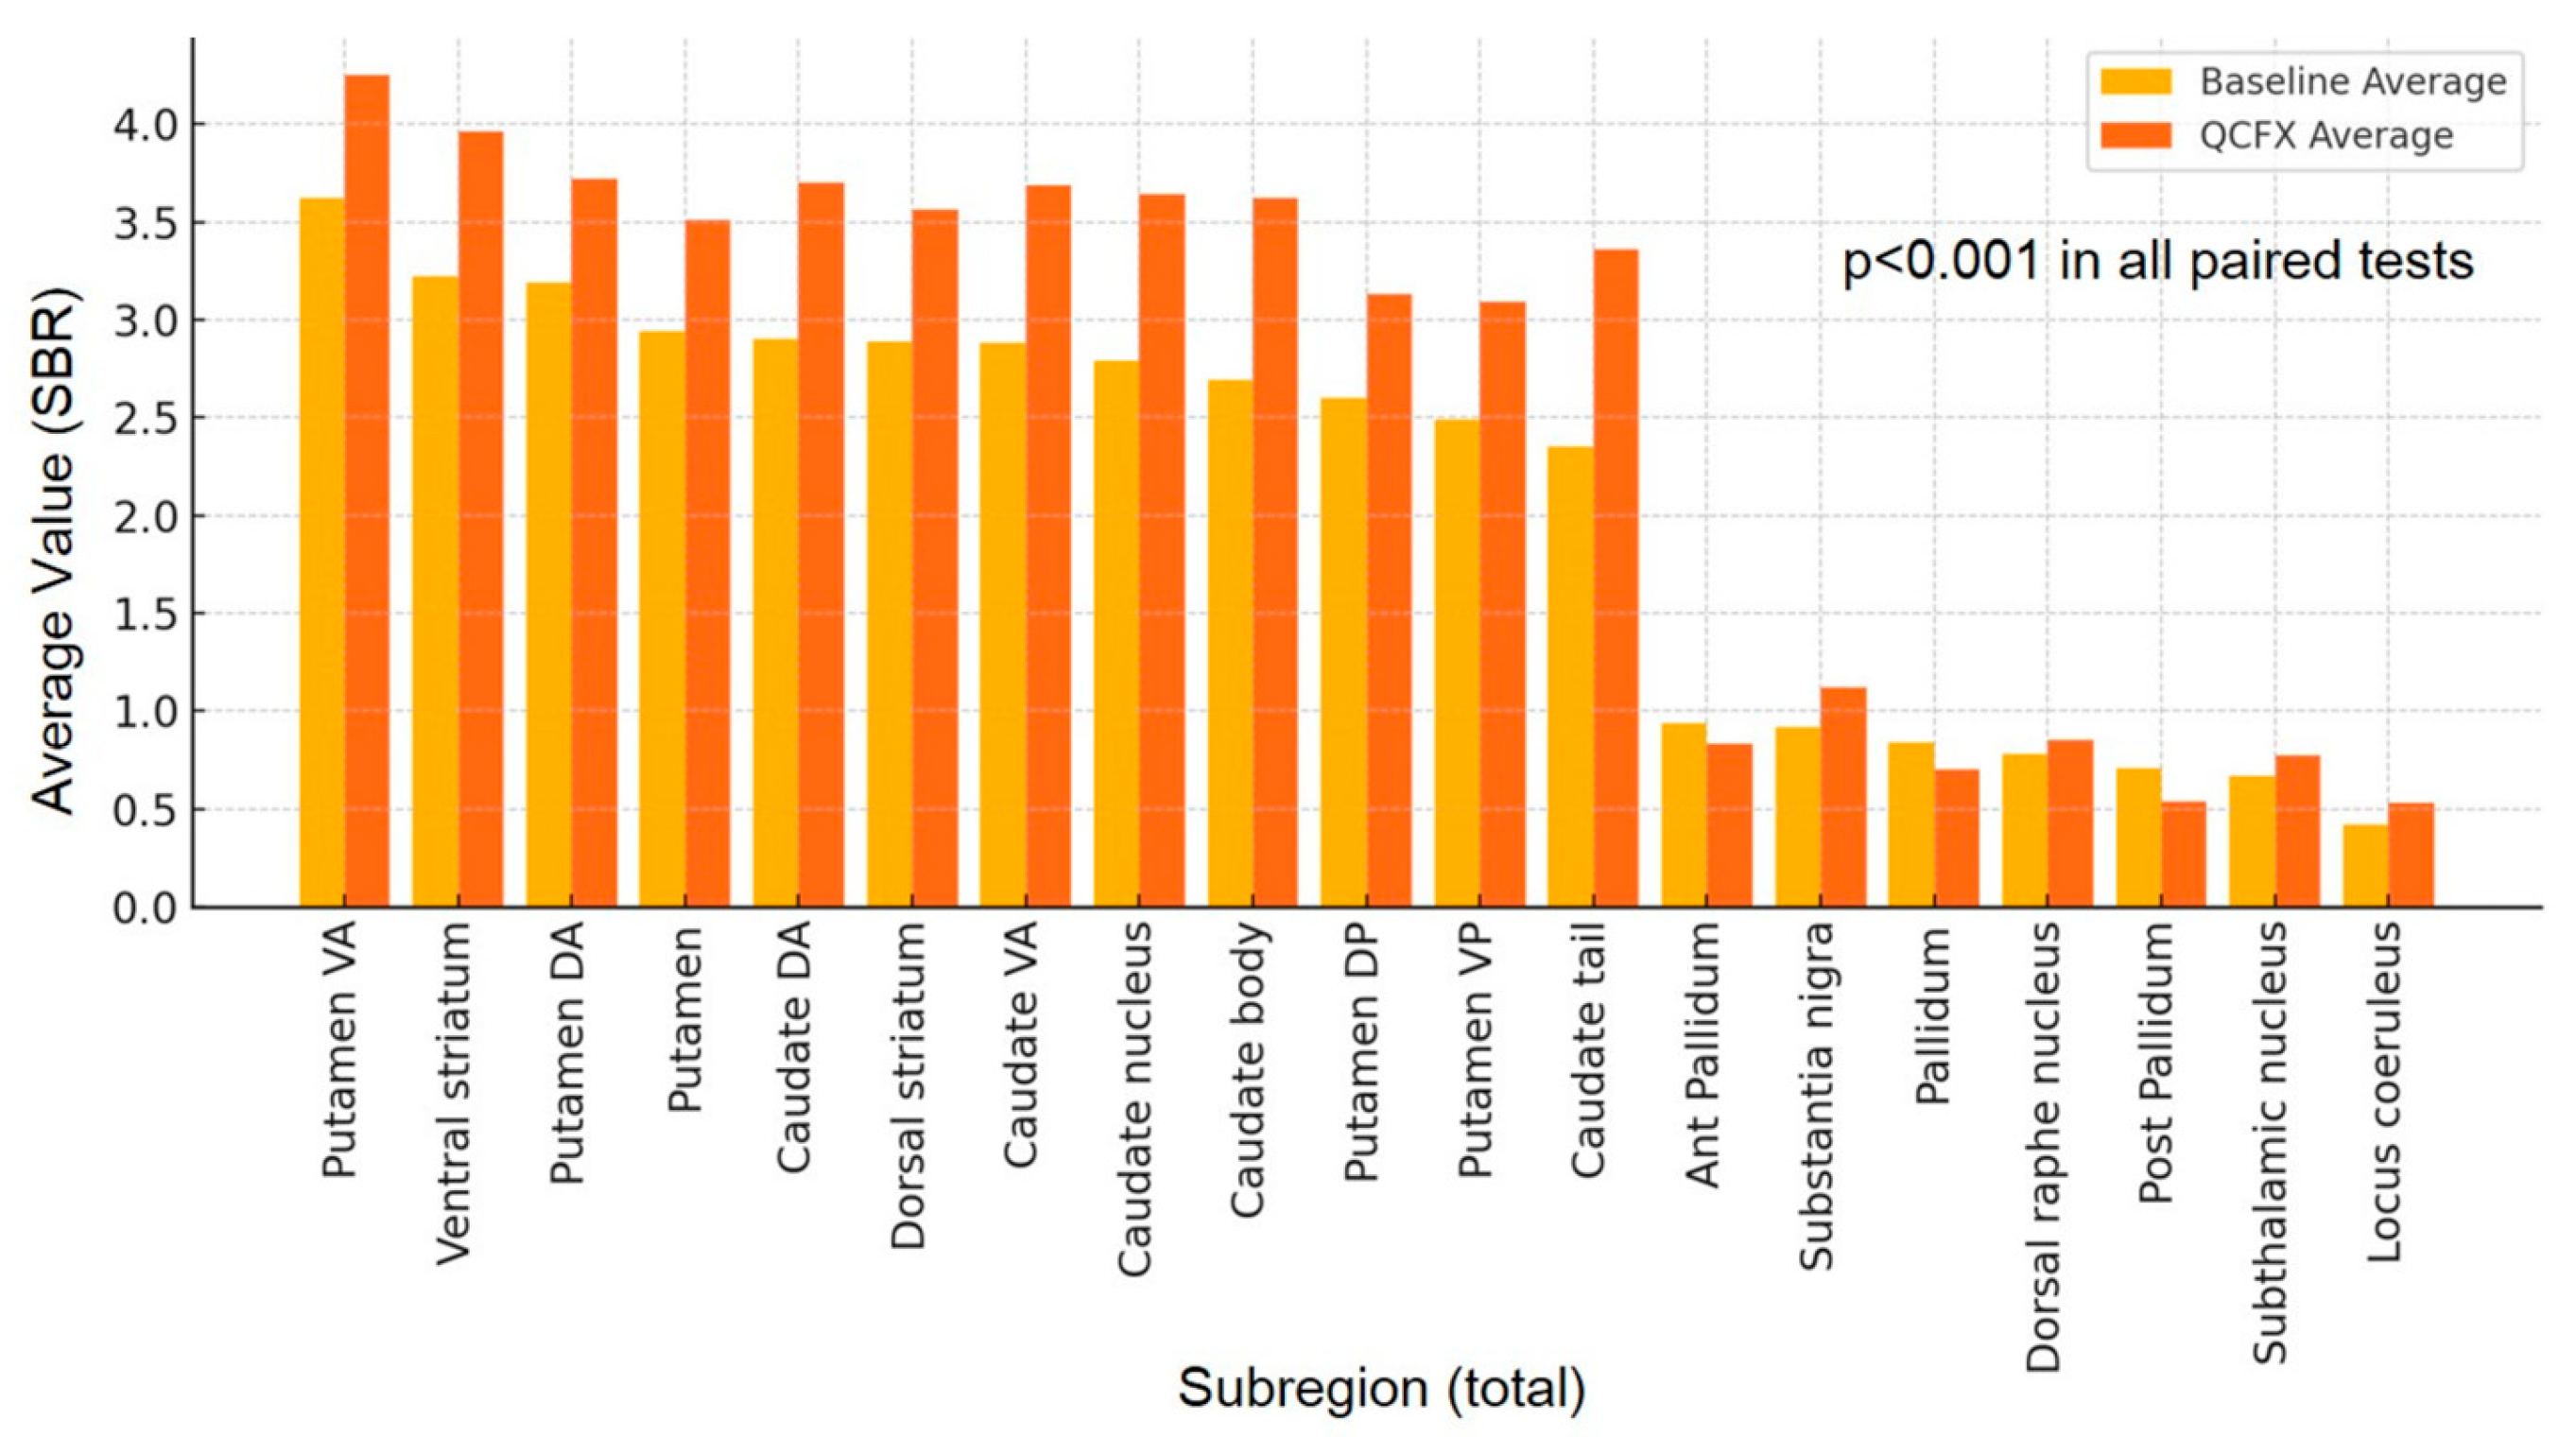
3.1. Differences in 19 Subregion Variables
3.2. Comparison of Three Asymmetric Indices
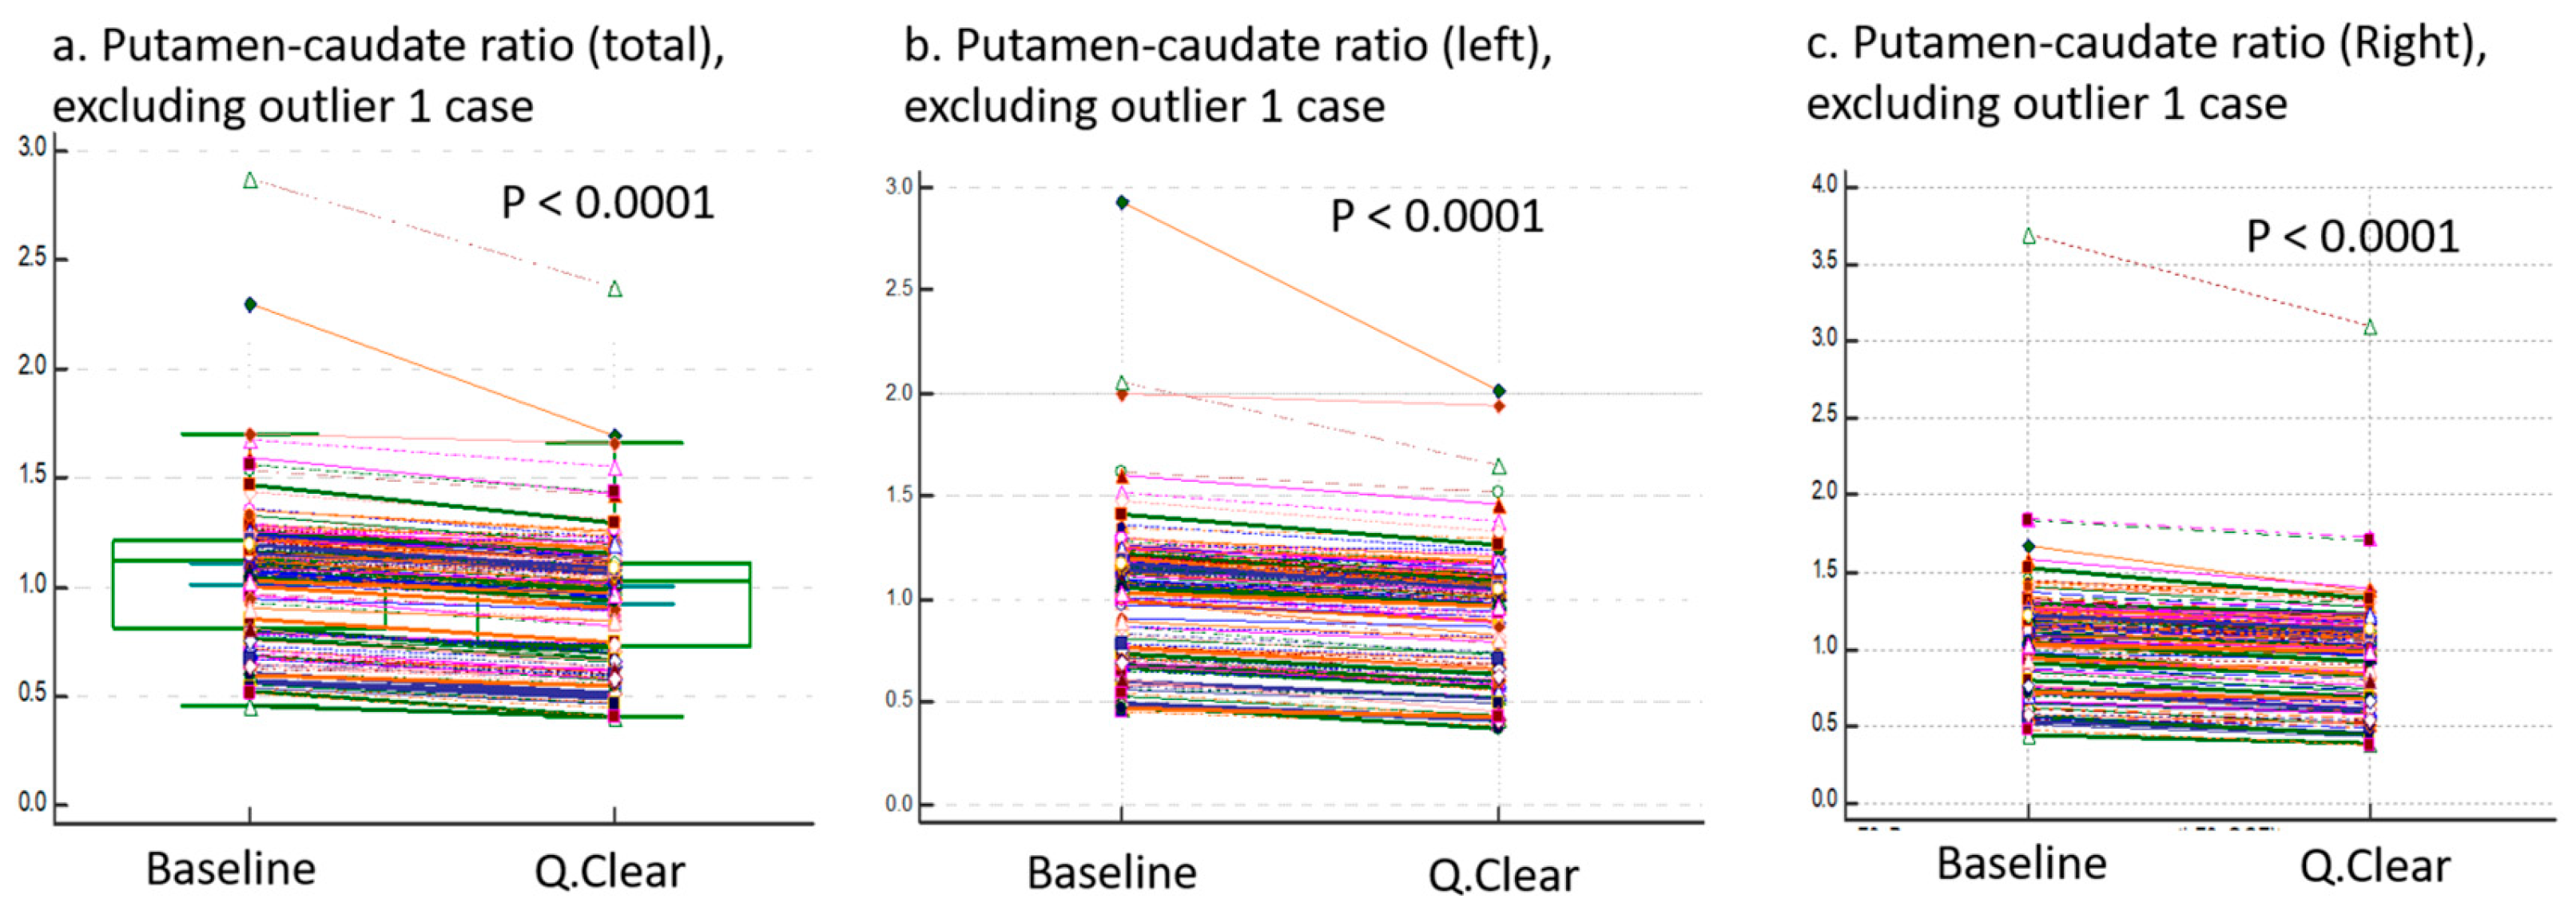
3.3. Comparison of Three Ratio Variables
3.4. Bland–Altman Plots
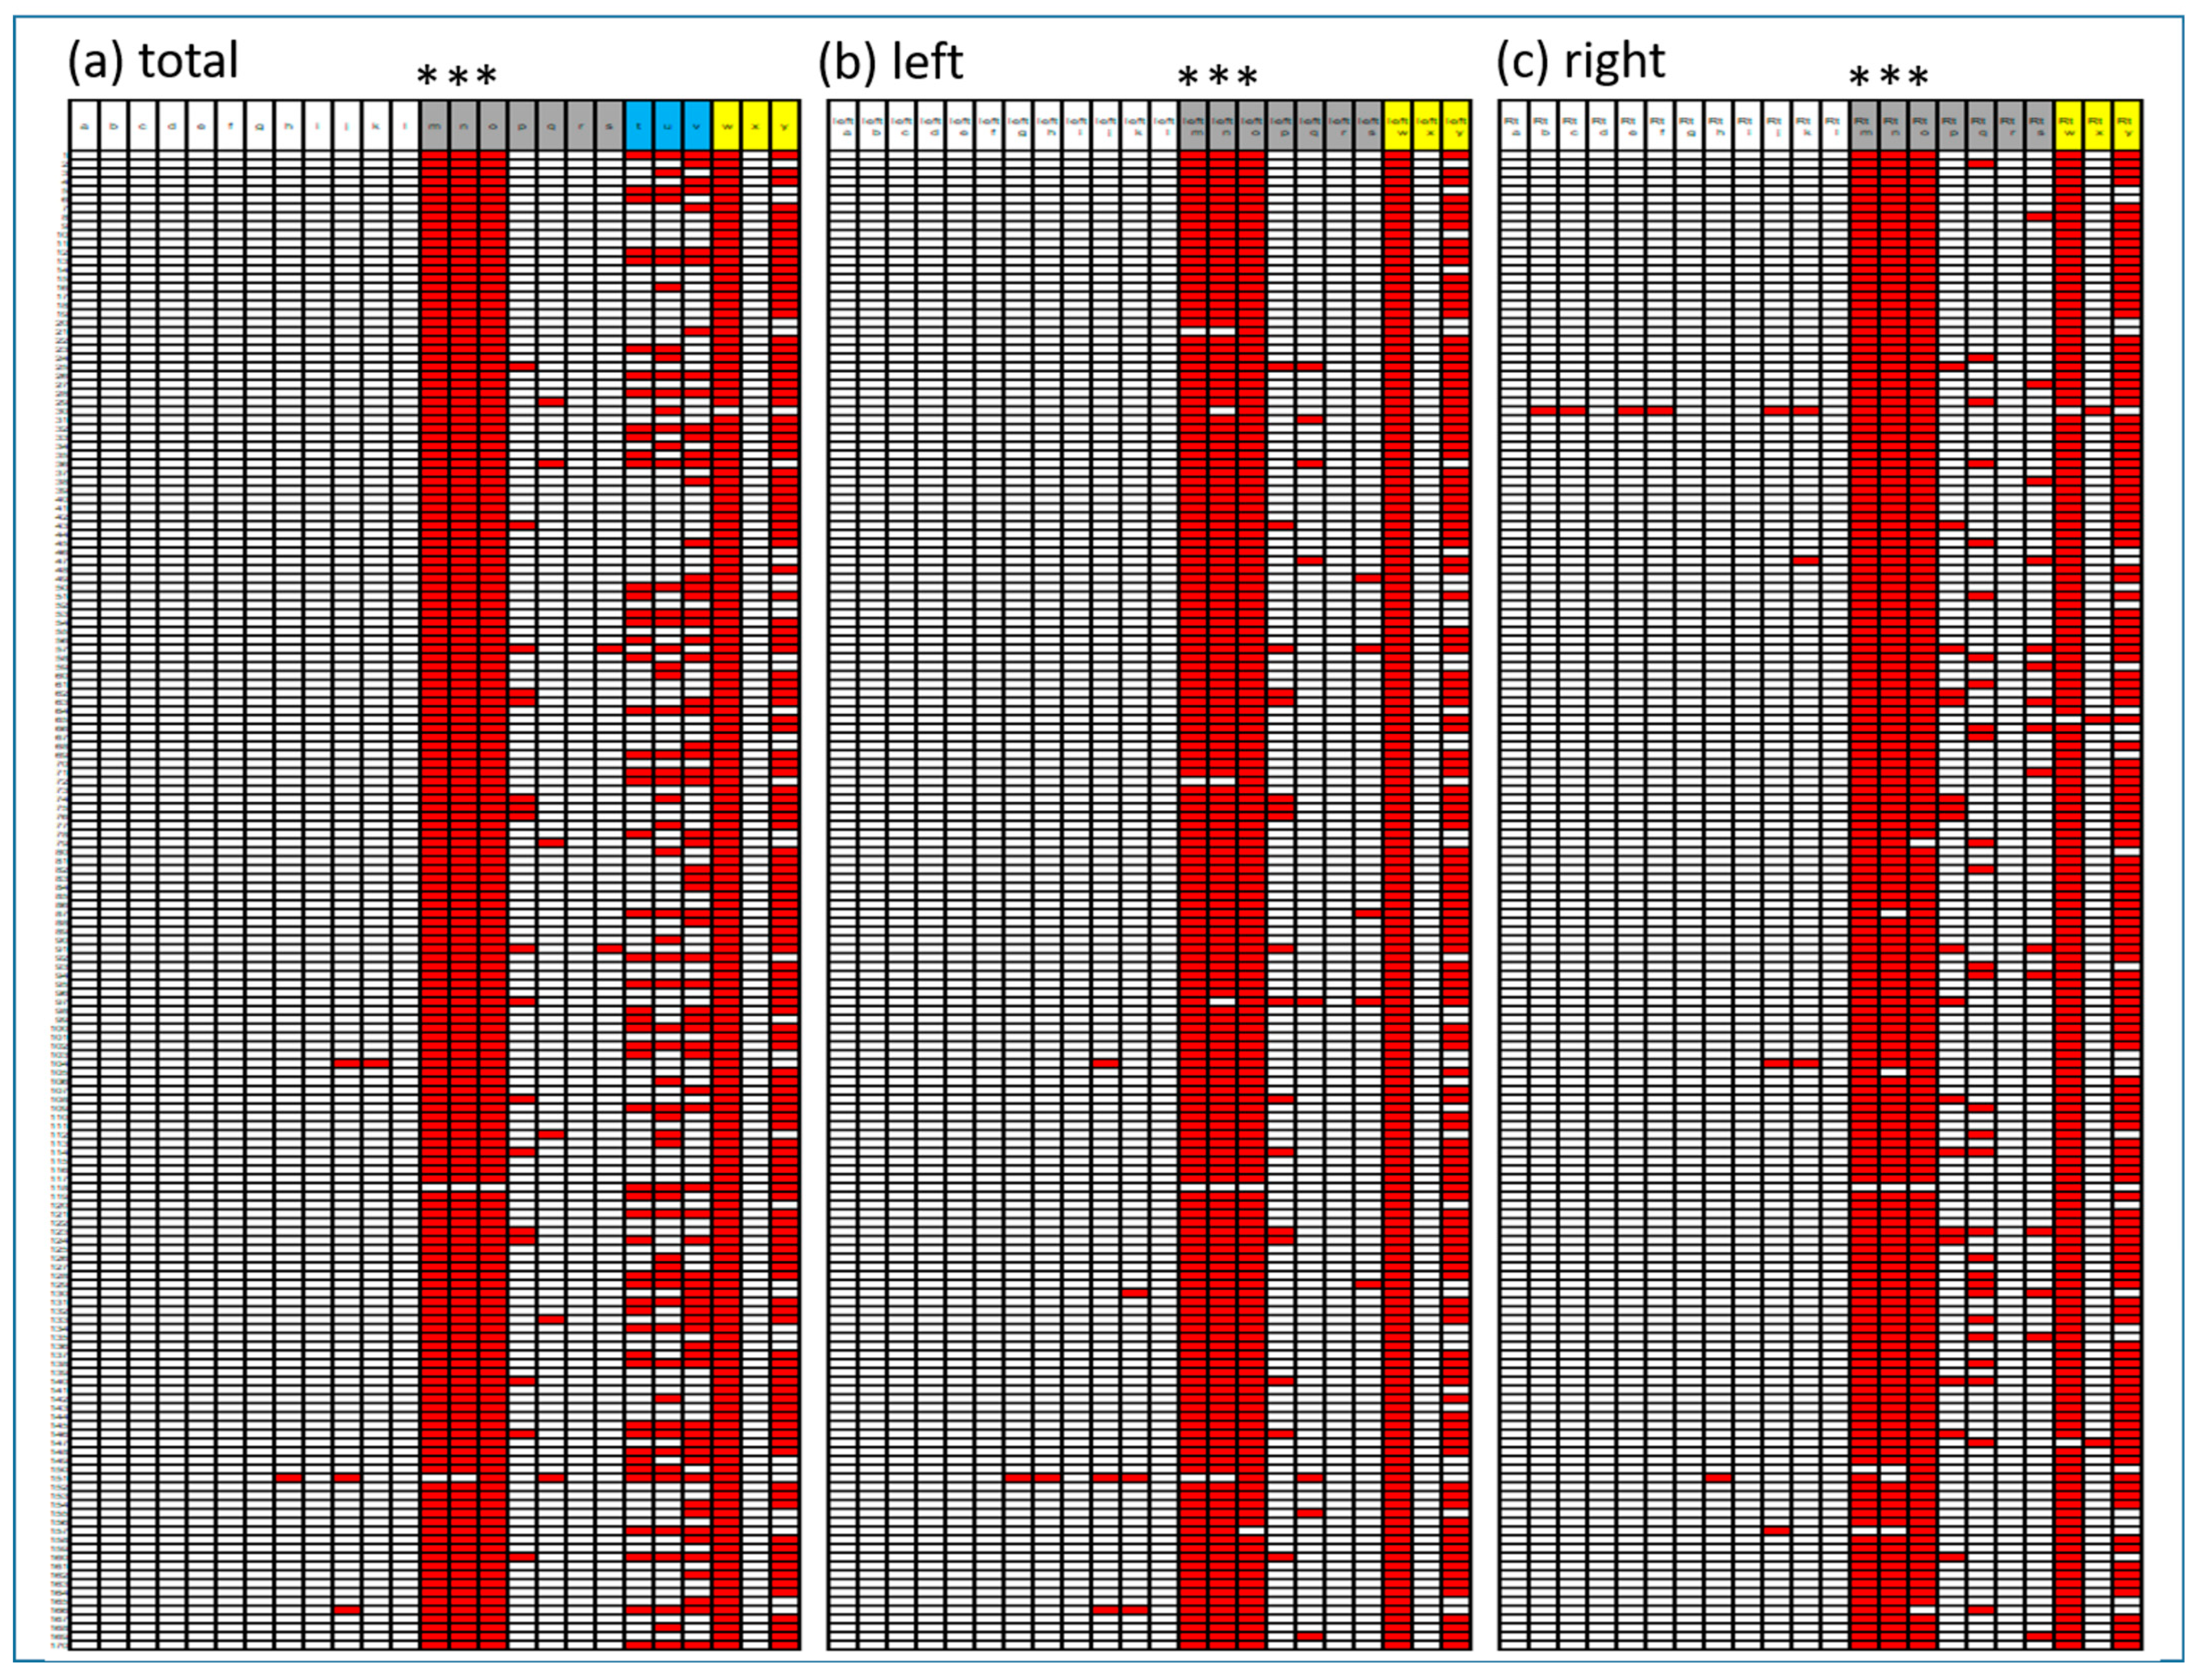
3.5. Evaluation of BTX Program Reproducibility
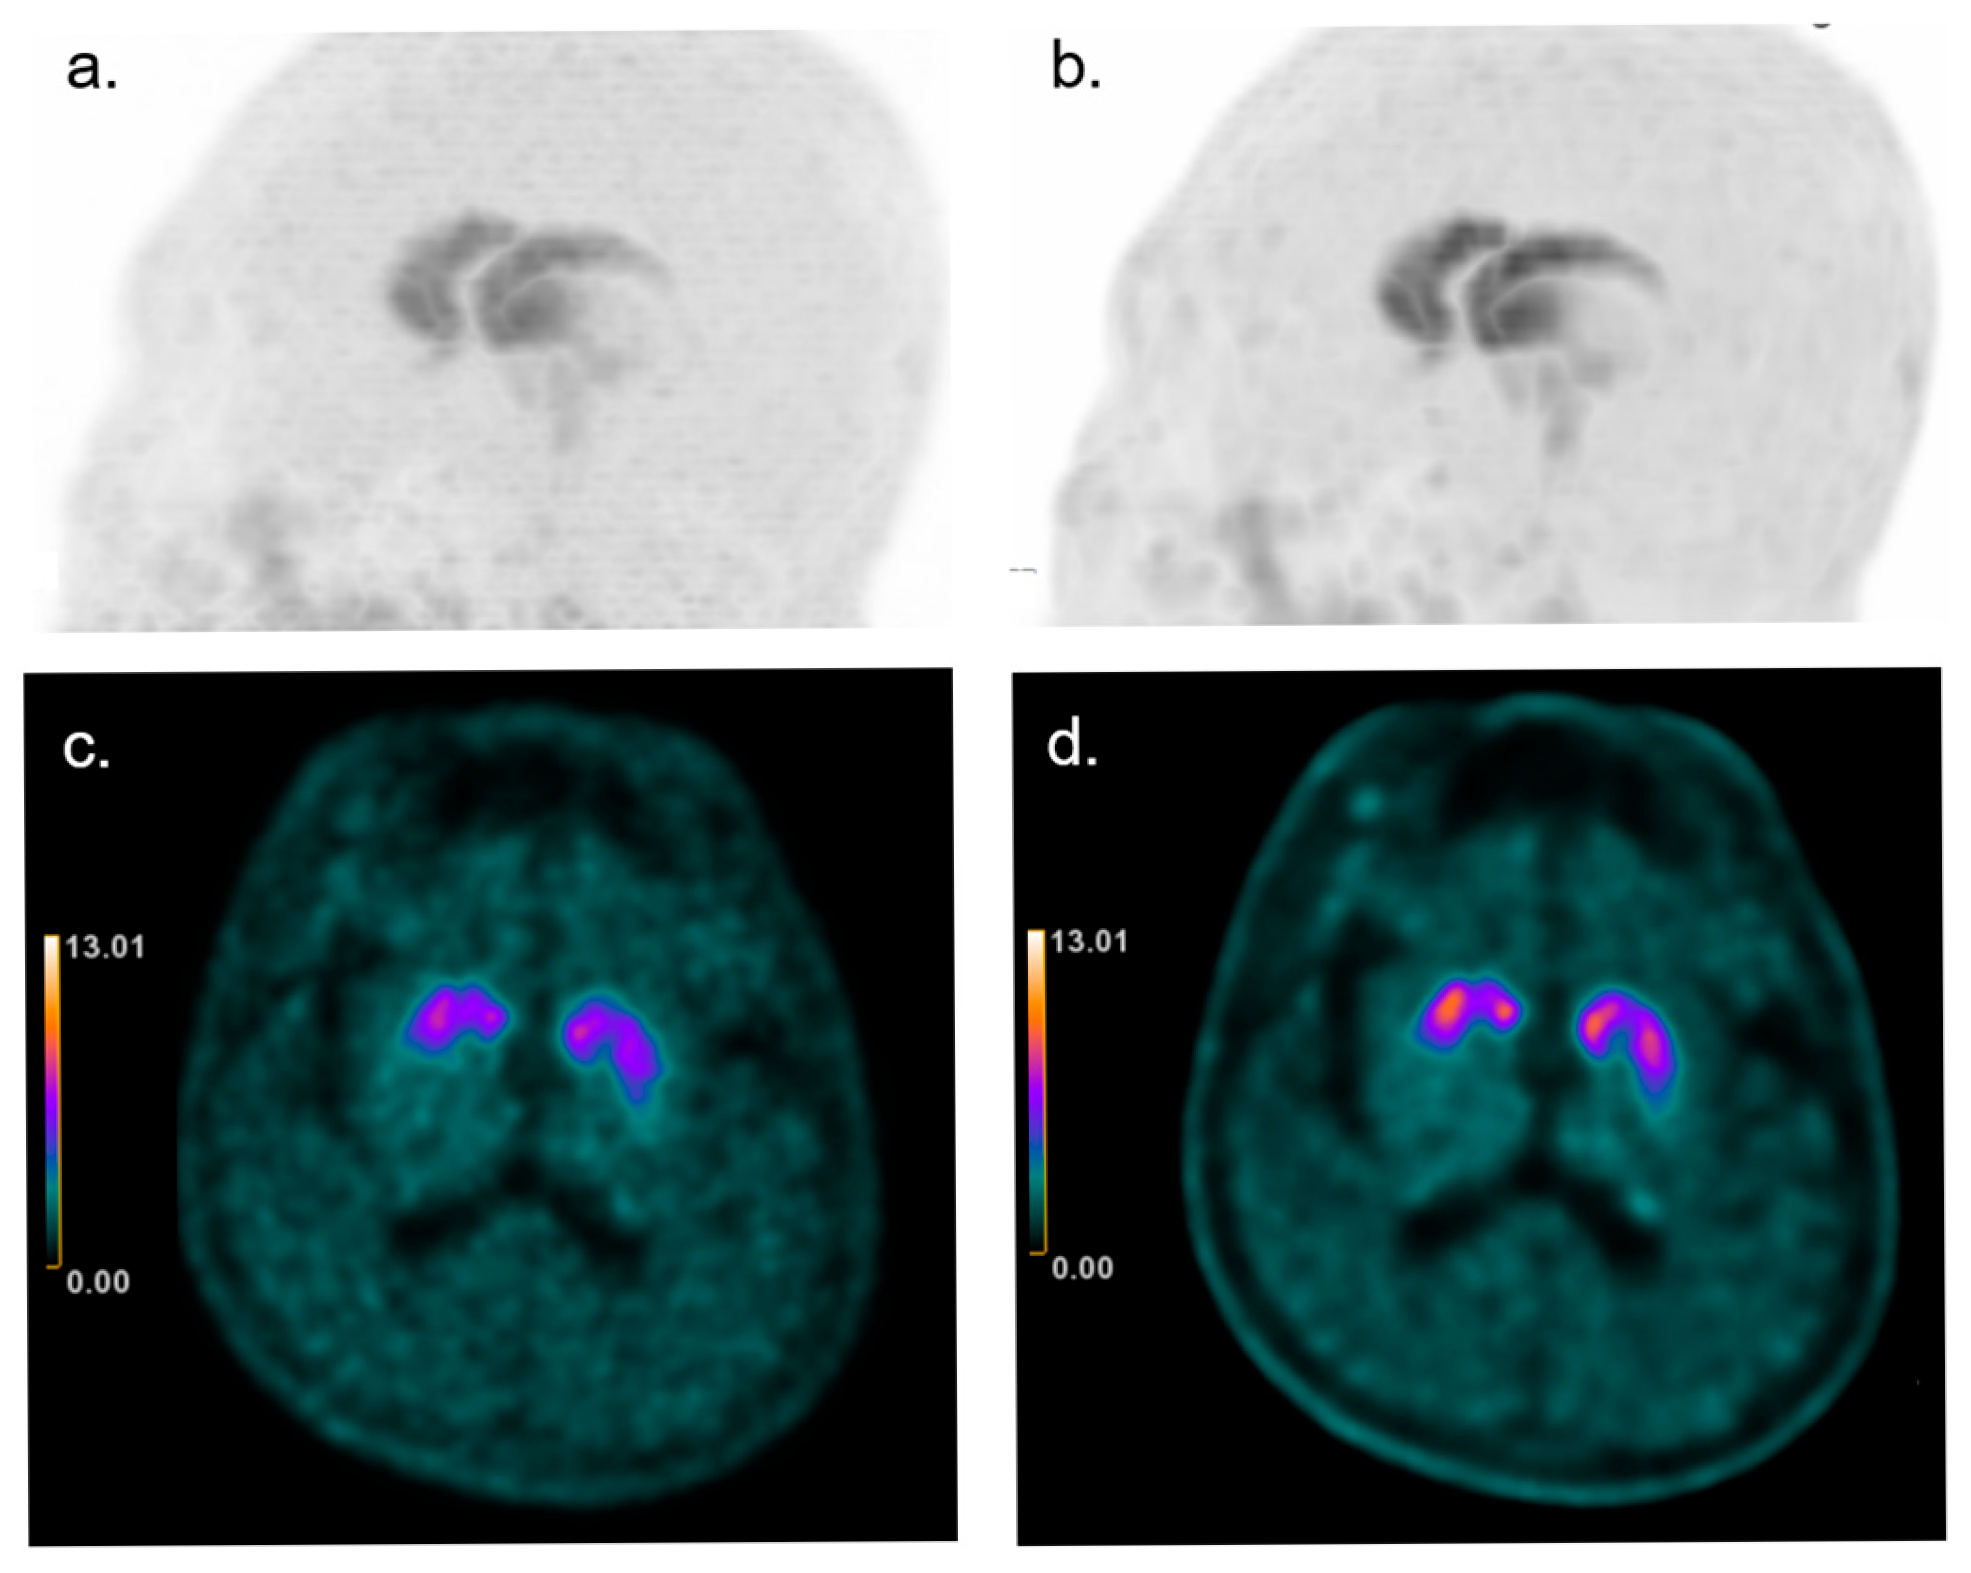
3.6. Effect on Visual Interpretation
4. Discussion
5. Conclusions
Author Contributions
Funding
Institutional Review Board Statement
Informed Consent Statement
Data Availability Statement
Acknowledgments
Conflicts of Interest
References
- Sung, C.; Oh, S.J.; Kim, J.S. Imaging Procedure and Clinical Studies of [(18)F]FP-CIT PET. Nucl. Med. Mol. Imaging 2024, 58, 185–202. [Google Scholar] [CrossRef] [PubMed]
- Nicastro, N.; Nencha, U.; Burkhard, P.R.; Garibotto, V. Dopaminergic imaging in degenerative parkinsonisms, an established clinical diagnostic tool. J. Neurochem. 2023, 164, 346–363. [Google Scholar] [CrossRef]
- Oh, M.; Lee, N.; Kim, C.; Son, H.J.; Sung, C.; Oh, S.J.; Lee, S.J.; Chung, S.J.; Lee, C.S.; Kim, J.S. Diagnostic accuracy of dual-phase (18)F-FP-CIT PET imaging for detection and differential diagnosis of Parkinsonism. Sci. Rep. 2021, 11, 14992. [Google Scholar] [CrossRef]
- Kong, Y.; Zhang, C.; Liu, K.; Wagle Shukla, A.; Sun, B.; Guan, Y. Imaging of dopamine transporters in Parkinson disease: A meta-analysis of (18) F/(123) I-FP-CIT studies. Ann. Clin. Transl. Neurol. 2020, 7, 1524–1534. [Google Scholar] [CrossRef]
- Kazumata, K.; Dhawan, V.; Chaly, T.; Antonini, A.; Margouleff, C.; Belakhlef, A.; Neumeyer, J.; Eidelberg, D. Dopamine transporter imaging with fluorine-18-FPCIT and PET. J. Nucl. Med. 1998, 39, 1521–1530. [Google Scholar]
- Park, K.-S.; Cho, S.-G.; Kim, J.; Song, H.-C.; Min, J.-J.; Kang, S.-R.; Yoo, S.W.; Kwon, S.-Y.; Moon, J.B. Differentiating neurodegenerative diseases in FP-CIT PET images using automated quantification software BTXBrain-DAT. J. Nucl. Med. 2024, 65, 241520. [Google Scholar]
- Morbelli, S.; Arnaldi, D.; Cella, E.; Raffa, S.; Donegani, M.I.; Capitanio, S.; Massa, F.; Miceli, A.; Filippi, L.; Chincarini, A.; et al. Striatal dopamine transporter SPECT quantification: Head-to-head comparison between two three-dimensional automatic tools. EJNMMI Res. 2020, 10, 137. [Google Scholar] [CrossRef]
- Fiorenzato, E.; Antonini, A.; Bisiacchi, P.; Weis, L.; Biundo, R. Asymmetric Dopamine Transporter Loss Affects Cognitive and Motor Progression in Parkinson’s Disease. Mov. Disord. 2021, 36, 2303–2313. [Google Scholar] [CrossRef]
- Jeong, Y.J.; Son, H.J.; Yoon, H.J.; Kang, D.Y. Functional volumetric analysis of striatum using F-18 FP-CIT PET in patients with idiopathic Parkinson’s disease and normal subjects. Ann. Nucl. Med. 2016, 30, 572–578. [Google Scholar] [CrossRef]
- Jeong, E.; Oh, S.Y.; Pahk, K.; Lee, C.N.; Park, K.W.; Lee, J.S.; Cheon, G.J.; Choe, J.G. Feasibility of PET Template-Based Analysis on F-18 FP-CIT PET in Patients with De Novo Parkinson’s Disease. Nucl. Med. Mol. Imaging 2013, 47, 73–80. [Google Scholar] [CrossRef] [PubMed]
- Kim, Y.I.; Im, H.J.; Paeng, J.C.; Lee, J.S.; Eo, J.S.; Kim, D.H.; Kim, E.E.; Kang, K.W.; Chung, J.K.; Lee, D.S. Validation of Simple Quantification Methods for (18)F-FP-CIT PET Using Automatic Delineation of Volumes of Interest Based on Statistical Probabilistic Anatomical Mapping and Isocontour Margin Setting. Nucl. Med. Mol. Imaging 2012, 46, 254–260. [Google Scholar] [CrossRef] [PubMed][Green Version]
- Teoh, E.J.; McGowan, D.R.; Macpherson, R.E.; Bradley, K.M.; Gleeson, F.V. Phantom and Clinical Evaluation of the Bayesian Penalized Likelihood Reconstruction Algorithm Q.Clear on an LYSO PET/CT System. J. Nucl. Med. 2015, 56, 1447–1452. [Google Scholar] [CrossRef]
- Barrington, S.F.; Sulkin, T.; Forbes, A.; Johnson, P.W.M. All that glitters is not gold—New reconstruction methods using Deauville criteria for patient reporting. Eur. J. Nucl. Med. Mol. Imaging 2018, 45, 316–317. [Google Scholar] [CrossRef]
- Lysvik, E.K.; Mikalsen, L.T.G.; Rootwelt-Revheim, M.E.; Emblem, K.E.; Hjornevik, T. Optimization of Q.Clear reconstruction for dynamic (18)F PET imaging. EJNMMI Phys. 2023, 10, 65. [Google Scholar] [CrossRef]
- Tomse, P.; Jensterle, L.; Rep, S.; Grmek, M.; Zaletel, K.; Eidelberg, D.; Dhawan, V.; Ma, Y.; Trost, M. The effect of 18F-FDG-PET image reconstruction algorithms on the expression of characteristic metabolic brain network in Parkinson’s disease. Phys. Med. 2017, 41, 129–135. [Google Scholar] [CrossRef]
- Wyrzykowski, M.; Siminiak, N.; Kazmierczak, M.; Ruchala, M.; Czepczynski, R. Impact of the Q.Clear reconstruction algorithm on the interpretation of PET/CT images in patients with lymphoma. EJNMMI Res. 2020, 10, 99. [Google Scholar] [CrossRef]
- AI Solutions BTXBrain-Dopamine. Available online: https://brtnx.com/en/product/product_ai_dopamine.php (accessed on 30 November 2024).
- Morbelli, S.; Esposito, G.; Arbizu, J.; Barthel, H.; Boellaard, R.; Bohnen, N.I.; Brooks, D.J.; Darcourt, J.; Dickson, J.C.; Douglas, D.; et al. EANM practice guideline/SNMMI procedure standard for dopaminergic imaging in Parkinsonian syndromes 1.0. Eur. J. Nucl. Med. Mol. Imaging 2020, 47, 1885–1912. [Google Scholar] [CrossRef]
- Mishra, P.; Pandey, C.M.; Singh, U.; Gupta, A.; Sahu, C.; Keshri, A. Descriptive statistics and normality tests for statistical data. Ann. Card. Anaesth. 2019, 22, 67–72. [Google Scholar] [CrossRef]
- Friston, K.J. Statistical Parametric Mapping. In Neuroscience Databases: A Practical Guide; Kötter, R., Ed.; Springer: Boston, MA, USA, 2003; pp. 237–250. [Google Scholar]
- Tian, D.; Yang, H.; Li, Y.; Cui, B.; Lu, J. The effect of Q.Clear reconstruction on quantification and spatial resolution of 18F-FDG PET in simultaneous PET/MR. EJNMMI Phys. 2022, 9, 1. [Google Scholar] [CrossRef] [PubMed]
- Miwa, K.; Yoshii, T.; Wagatsuma, K.; Nezu, S.; Kamitaka, Y.; Yamao, T.; Kobayashi, R.; Fukuda, S.; Yakushiji, Y.; Miyaji, N.; et al. Impact of gamma factor in the penalty function of Bayesian penalized likelihood reconstruction (Q.Clear) to achieve high-resolution PET images. EJNMMI Phys. 2023, 10, 4. [Google Scholar] [CrossRef] [PubMed]
- Yamaguchi, S.; Wagatsuma, K.; Miwa, K.; Ishii, K.; Inoue, K.; Fukushi, M. Bayesian penalized-likelihood reconstruction algorithm suppresses edge artifacts in PET reconstruction based on point-spread-function. Phys. Med. 2018, 47, 73–79. [Google Scholar] [CrossRef] [PubMed]
- Liu, J.; Malekzadeh, M.; Mirian, N.; Song, T.A.; Liu, C.; Dutta, J. Artificial Intelligence-Based Image Enhancement in PET Imaging: Noise Reduction and Resolution Enhancement. PET Clin. 2021, 16, 553–576. [Google Scholar] [CrossRef] [PubMed]
- Caribe, P.; Koole, M.; D’Asseler, Y.; Van Den Broeck, B.; Vandenberghe, S. Noise reduction using a Bayesian penalized-likelihood reconstruction algorithm on a time-of-flight PET-CT scanner. EJNMMI Phys. 2019, 6, 22. [Google Scholar] [CrossRef] [PubMed]
- Tossici-Bolt, L.; Dickson, J.C.; Sera, T.; Booij, J.; Asenbaun-Nan, S.; Bagnara, M.C.; Borght, T.V.; Jonsson, C.; de Nijs, R.; Hesse, S.; et al. [(123)I]FP-CIT ENC-DAT normal database: The impact of the reconstruction and quantification methods. EJNMMI Phys. 2017, 4, 8. [Google Scholar] [CrossRef]
- Ayati, N.; McIntosh, L.; Buteau, J.; Alipour, R.; Pudis, M.; Daw, N.; Jackson, P.; Hofman, M.S. Comparison of quantitative whole body PET parameters on [(68)Ga]Ga-PSMA-11 PET/CT using ordered Subset Expectation Maximization (OSEM) vs. bayesian penalized likelihood (BPL) reconstruction algorithms in men with metastatic castration-resistant prostate cancer. Cancer Imaging 2024, 24, 57. [Google Scholar] [CrossRef]
- Lindstrom, E.; Oddstig, J.; Danfors, T.; Jogi, J.; Hansson, O.; Lubberink, M. Image reconstruction methods affect software-aided assessment of pathologies of [(18)F]flutemetamol and [(18)F]FDG brain-PET examinations in patients with neurodegenerative diseases. Neuroimage Clin. 2020, 28, 102386. [Google Scholar] [CrossRef]
- Wagatsuma, K.; Miwa, K.; Kamitaka, Y.; Koike, E.; Yamao, T.; Yoshii, T.; Kobayashi, R.; Nezu, S.; Sugamata, Y.; Miyaji, N.; et al. Determination of optimal regularization factor in Bayesian penalized likelihood reconstruction of brain PET images using [(18) F]FDG and [(11) C]PiB. Med. Phys. 2022, 49, 2995–3005. [Google Scholar] [CrossRef]
- Kang, S.K.; Kim, D.; Shin, S.A.; Kim, Y.K.; Choi, H.; Lee, J.S. Fast and Accurate Amyloid Brain PET Quantification Without MRI Using Deep Neural Networks. J. Nucl. Med. 2023, 64, 659–666. [Google Scholar] [CrossRef]
- Kang, S.K.; Heo, M.; Chung, J.Y.; Kim, D.; Shin, S.A.; Choi, H.; Chung, A.; Ha, J.M.; Kim, H.; Lee, J.S. Clinical Performance Evaluation of an Artificial Intelligence-Powered Amyloid Brain PET Quantification Method. Nucl. Med. Mol. Imaging 2024, 58, 246–254. [Google Scholar] [CrossRef]
- Fezeu, F.; Jbara, O.F.; Jbarah, A.; Choucha, A.; De Maria, L.; Ciaglia, E.; De Simone, M.; Samnick, S. PET imaging for a very early detection of rapid eye movement sleep behaviour disorder and Parkinson’s disease—A model-based cost-effectiveness analysis. Clin. Neurol. Neurosurg. 2024, 243, 108404. [Google Scholar] [CrossRef]


| Baseline-DICOM | Q.Clear-DICOM | |||||||||||
|---|---|---|---|---|---|---|---|---|---|---|---|---|
| Total SBR | Min | Max | Average | Stdev | Median | Min | Max | Average | Stdev | Median | p Value | |
| Putamen ventral anterior (VA) | 0.94 | 6.61 | 3.62 | 1.15 | 3.72 | 1.02 | 7.84 | 4.25 | 1.39 | 4.35 | <0.001 | |
| Ventral striatum | 0.75 | 5.21 | 3.22 | 0.90 | 3.25 | 0.92 | 6.42 | 3.96 | 1.11 | 4.00 | <0.001 | |
| Putamen dorsal anterior (DA) | 0.61 | 6.53 | 3.19 | 1.25 | 3.34 | 0.60 | 7.82 | 3.72 | 1.52 | 3.90 | <0.0001 | |
| Putamen | 0.60 | 5.94 | 2.94 | 1.18 | 3.11 | 0.61 | 7.33 | 3.51 | 1.48 | 3.68 | <0.0001 | |
| Areas average | Caudate DA | 0.25 | 5.44 | 2.90 | 1.00 | 2.93 | 0.28 | 7.18 | 3.70 | 1.31 | 3.71 | <0.001 |
| SBR > 1 | Dorsal striatum | 0.47 | 5.69 | 2.89 | 1.06 | 2.96 | 0.50 | 7.20 | 3.56 | 1.36 | 3.59 | <0.001 |
| (base-DICOM) | Caudate VA | 0.17 | 5.11 | 2.88 | 0.92 | 2.84 | 0.26 | 6.61 | 3.69 | 1.19 | 3.66 | <0.001 |
| Caudate nucleus | 0.16 | 5.15 | 2.79 | 0.93 | 2.81 | 0.23 | 6.93 | 3.64 | 1.24 | 3.65 | <0.001 | |
| Caudate body | 0.03 | 5.17 | 2.69 | 0.92 | 2.70 | 0.06 | 7.20 | 3.62 | 1.25 | 3.55 | <0.001 | |
| Putamen dorsal posterior (DP) | 0.26 | 5.46 | 2.60 | 1.21 | 2.86 | 0.24 | 6.85 | 3.13 | 1.53 | 3.45 | <0.0001 | |
| Putamen VP | 0.33 | 5.36 | 2.49 | 1.18 | 2.70 | 0.32 | 6.96 | 3.09 | 1.55 | 3.28 | <0.0001 | |
| Caudate tail | 0.00 | 4.27 | 2.35 | 0.81 | 2.34 | 0.04 | 6.09 | 3.36 | 1.19 | 3.30 | <0.001 | |
| Ant Pallidum | 0.48 | 1.53 | 0.94 | 0.21 | 0.94 | 0.40 | 1.37 | 0.83 | 0.18 | 0.82 | <0.001 | |
| Substantia nigra | 0.40 | 1.41 | 0.92 | 0.20 | 0.93 | 0.49 | 1.97 | 1.12 | 0.24 | 1.13 | <0.001 | |
| Areas average | Pallidum | 0.39 | 1.36 | 0.84 | 0.19 | 0.84 | 0.29 | 1.11 | 0.70 | 0.15 | 0.70 | <0.001 |
| SBR < 1 | Dorsal raphe nucleus | 0.01 | 1.41 | 0.78 | 0.27 | 0.83 | 0.08 | 1.72 | 0.85 | 0.30 | 0.90 | <0.0001 |
| (base-DICOM) | Post Pallidum | 0.28 | 1.23 | 0.71 | 0.18 | 0.72 | 0.17 | 0.87 | 0.54 | 0.12 | 0.54 | <0.0001 |
| Subthalamic nucleus | 0.18 | 1.01 | 0.67 | 0.15 | 0.66 | 0.28 | 1.34 | 0.77 | 0.17 | 0.75 | <0.001 | |
| Locus coeruleus | 0.00 | 0.74 | 0.42 | 0.15 | 0.44 | 0.07 | 0.93 | 0.53 | 0.18 | 0.55 | <0.0001 | |
| Striatal asymmetry index Caudate asymmetry index Putamen asymmetry index | −53.24 | 45.42 | 4.00 | 15.13 | 5.23 | −43.03 | 49.02 | 4.77 | 15.54 | 6.12 | <0.0001 | |
| −93.14 | 238.86 | 7.76 | 22.77 | 6.87 | −66.03 | 231.80 | 9.16 | 21.82 | 8.72 | <0.0001 | ||
| −52.86 | 55.87 | 2.57 | 18.59 | 4.62 | −55.16 | 59.54 | 2.74 | 19.72 | 5.41 | <0.0001 | ||
| Putamen-caudate ratio Caudate-putamen ratio Anterior–posterior putamen ratio | −13.27 | 2.88 | 0.98 | 1.14 | 1.12 | −11.54 | 2.38 | 0.89 | 1.00 | 1.03 | <0.0001 | |
| 0.15 | 2.18 | 1.03 | 0.35 | 0.89 | 0.19 | 2.49 | 1.14 | 0.42 | 0.97 | <0.0001 | ||
| 1.09 | 3.55 | 1.52 | 0.47 | 1.28 | 1.03 | 4.11 | 1.50 | 0.54 | 1.23 | <0.0001 | ||
Disclaimer/Publisher’s Note: The statements, opinions and data contained in all publications are solely those of the individual author(s) and contributor(s) and not of MDPI and/or the editor(s). MDPI and/or the editor(s) disclaim responsibility for any injury to people or property resulting from any ideas, methods, instructions or products referred to in the content. |
© 2025 by the authors. Licensee MDPI, Basel, Switzerland. This article is an open access article distributed under the terms and conditions of the Creative Commons Attribution (CC BY) license (https://creativecommons.org/licenses/by/4.0/).
Share and Cite
Chong, A.; Ha, J.-M.; Chung, J.Y. Does Q.Clear Processing Change PET Ratios? Quantitative Evidence Using BTXBrain-DAT. Brain Sci. 2025, 15, 1036. https://doi.org/10.3390/brainsci15101036
Chong A, Ha J-M, Chung JY. Does Q.Clear Processing Change PET Ratios? Quantitative Evidence Using BTXBrain-DAT. Brain Sciences. 2025; 15(10):1036. https://doi.org/10.3390/brainsci15101036
Chicago/Turabian StyleChong, Ari, Jung-Min Ha, and Ji Yeon Chung. 2025. "Does Q.Clear Processing Change PET Ratios? Quantitative Evidence Using BTXBrain-DAT" Brain Sciences 15, no. 10: 1036. https://doi.org/10.3390/brainsci15101036
APA StyleChong, A., Ha, J.-M., & Chung, J. Y. (2025). Does Q.Clear Processing Change PET Ratios? Quantitative Evidence Using BTXBrain-DAT. Brain Sciences, 15(10), 1036. https://doi.org/10.3390/brainsci15101036


