The Long and Winding Road to Real-Life Experiments: Remote Assessment of Executive Functions with Computerized Games—Results from 8 Years of Naturalistic Interventions

 , , , , and
Abstract
1. Introduction
2. Materials and Methods
2.1. Participants and Procedure
2.2. Description of the Computerized Cognitive Assessments
2.2.1. Tasks without Time Constraint
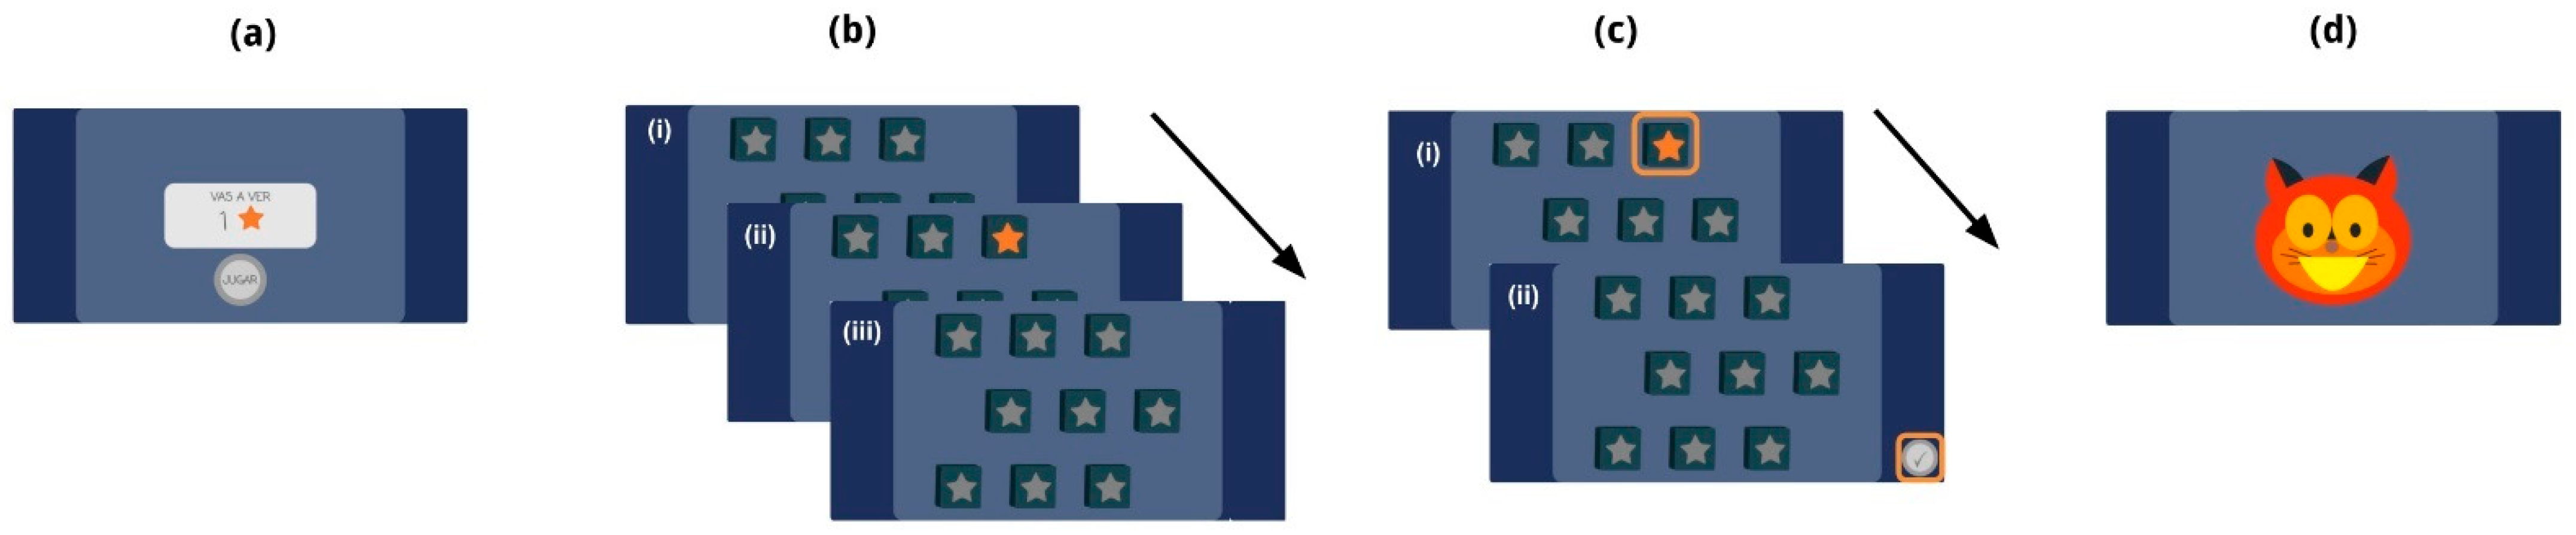
[1] Corsi Task
[2] Test of Nonverbal Intelligence
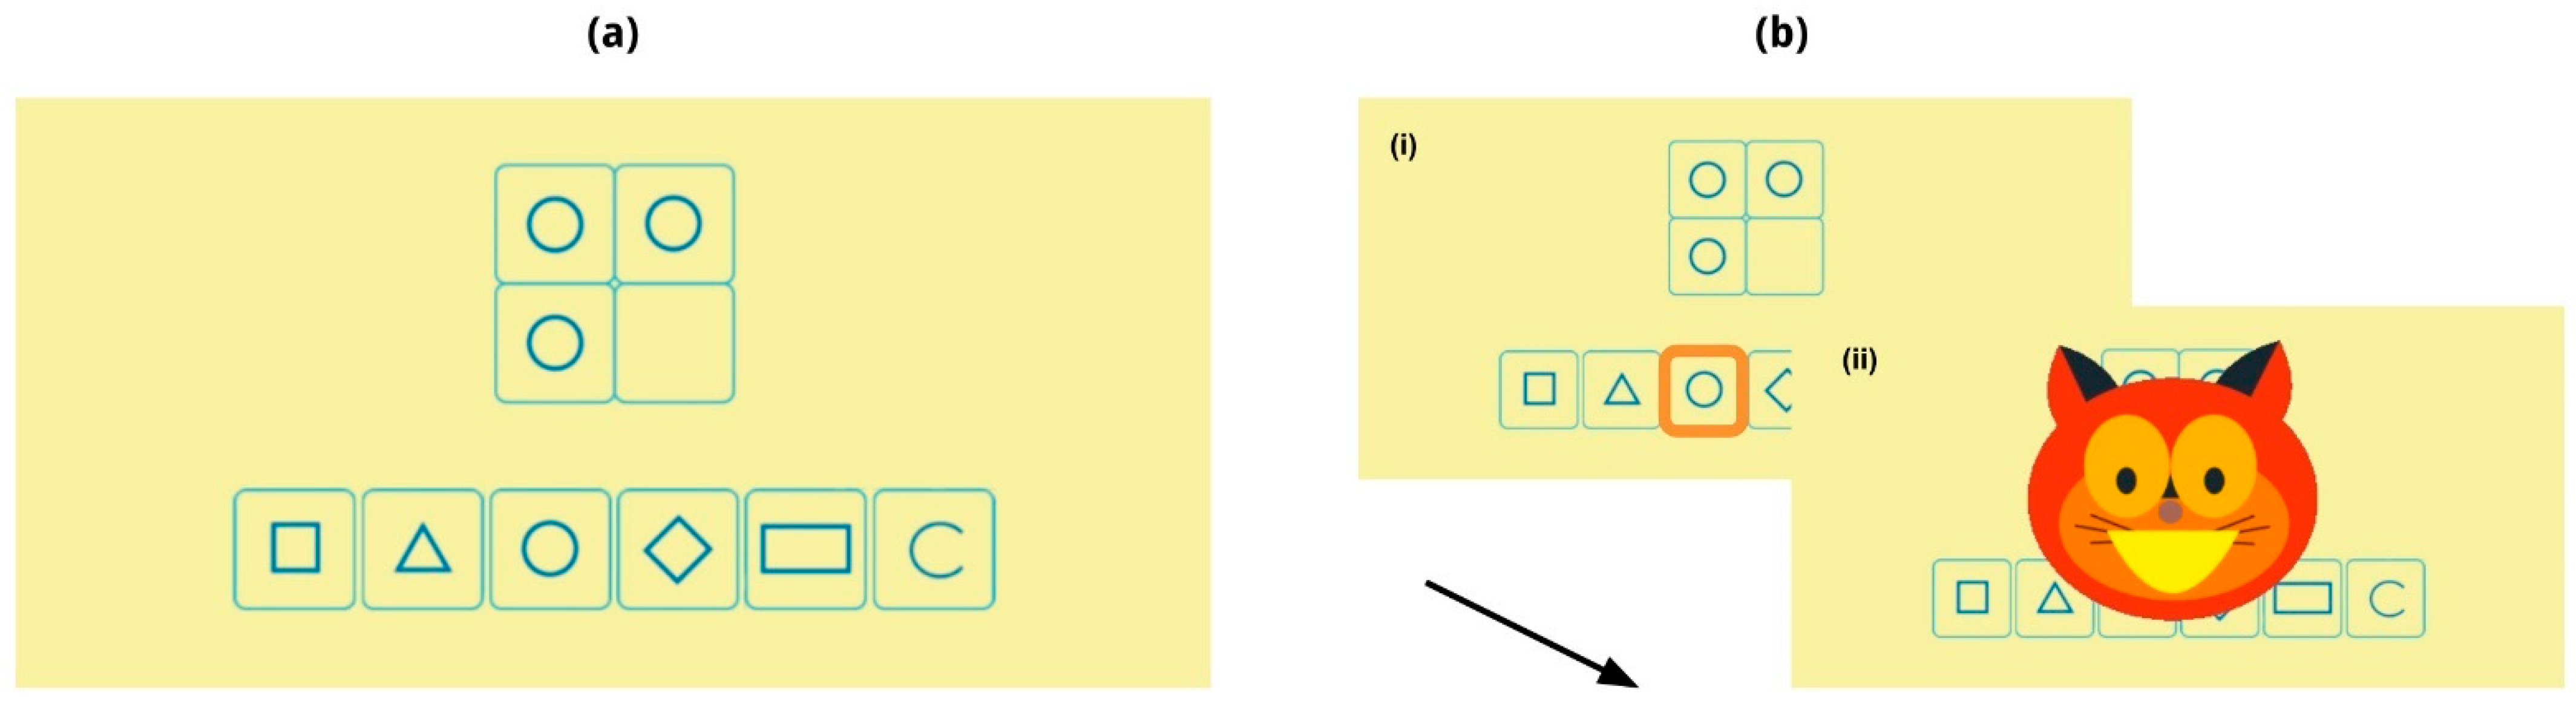
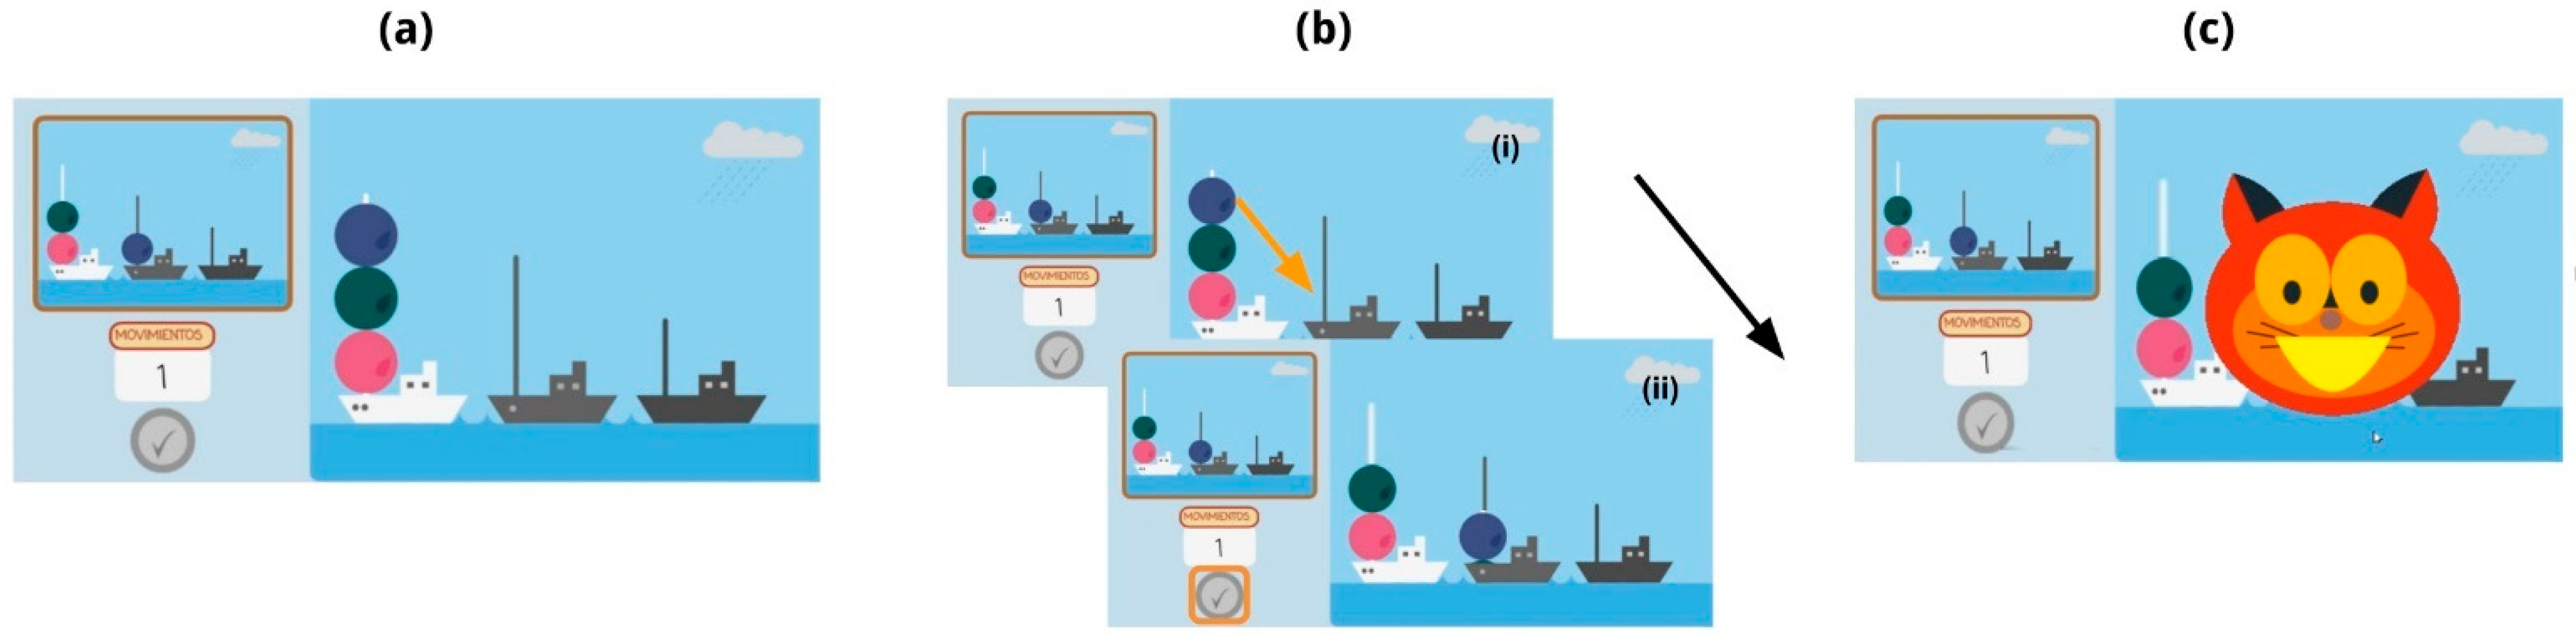
[3] Tower of London Task
2.2.2. Time-Constrained Tasks
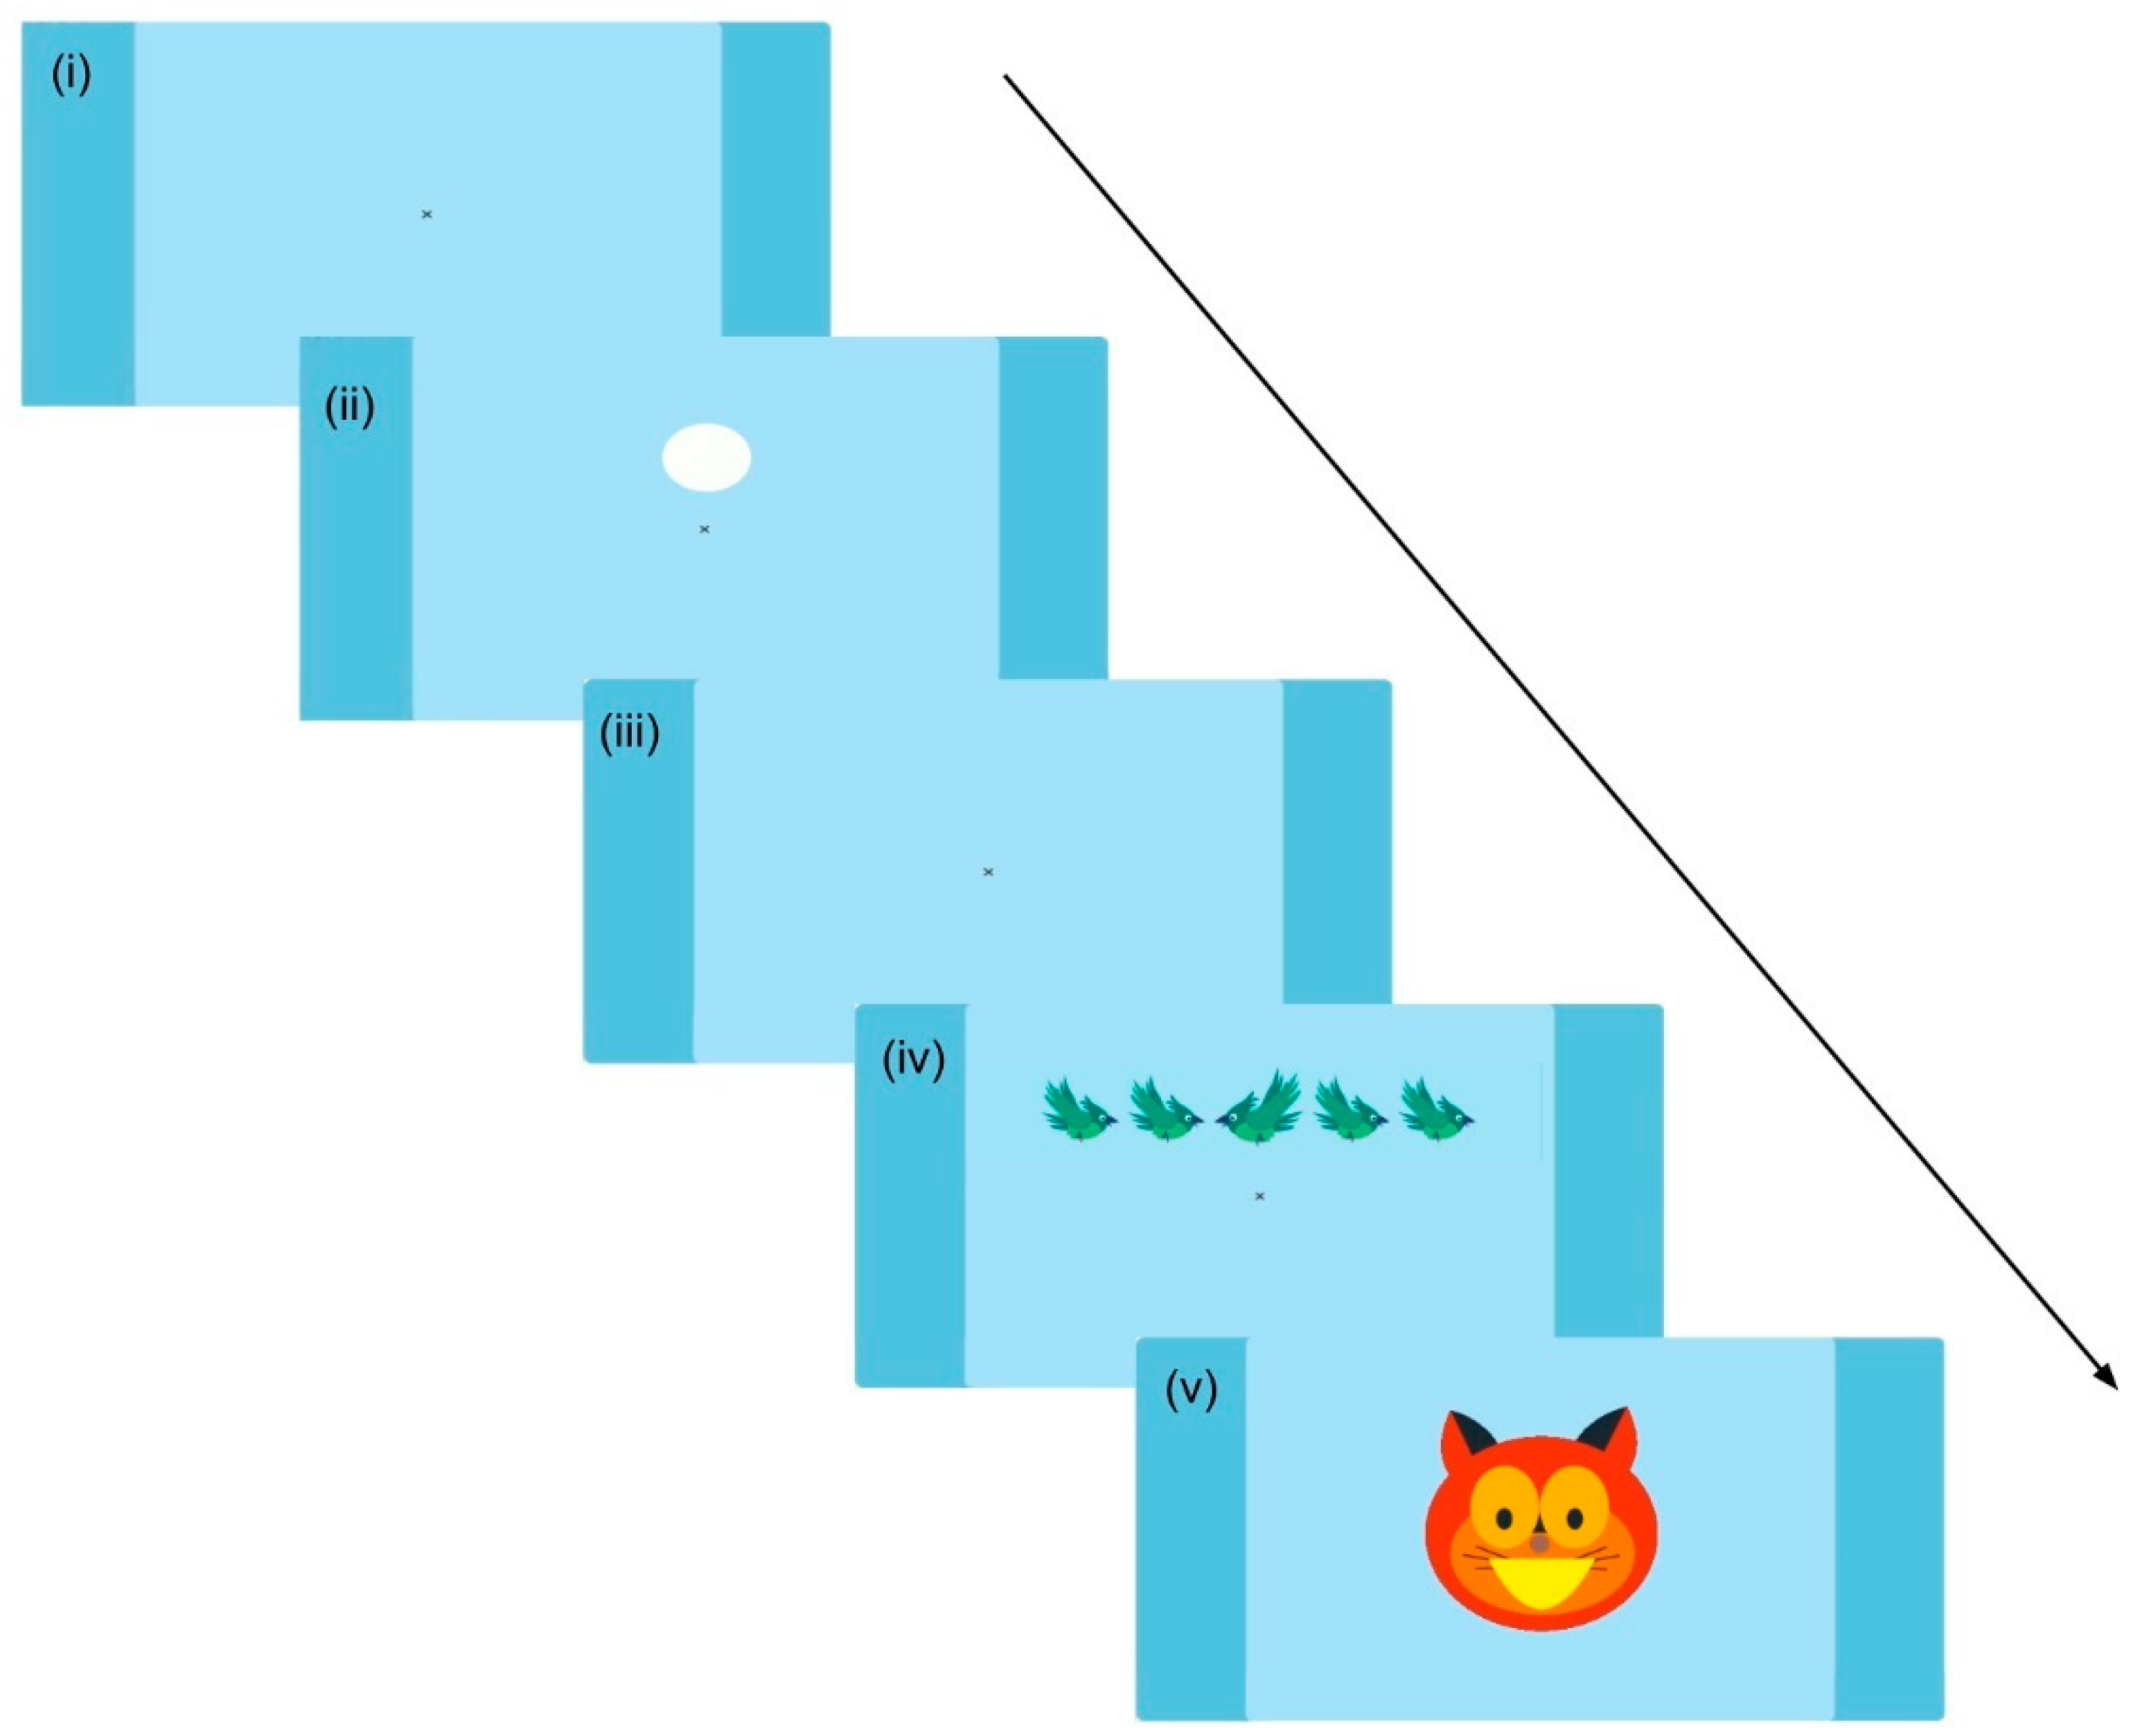
[4] The Child Attentional Networks Task (Child-ANT)
[5] The Heart–Flower Stroop Test
2.3. Testing Procedures
2.4. Paper’s Structure and Statistical Analysis
2.4.1. Data Cleansing Process and Descriptive Statistics
2.4.2. Tasks without Time Constraint
- Span: Gauges the difficulty of the most challenging trial successfully completed.
- Score: The sum of the difficulty levels of all correctly answered trials.
- Average RT: The mean RT of each difficulty level.
2.4.3. Time-Constrained Tasks
- Percentage of Won Trials: The proportion of trials that a participant successfully completed, out of the total number of answered trials.
- Median RT for Won Trials: This refers to the middle value of the RT recorded in successfully completed trials by each participant.
2.4.4. Composite Cognitive Performance Score

| Task Type | Outcome Measure(s) | Explanatory Variable(s) | Task(s) | Hypothesis |
|---|---|---|---|---|
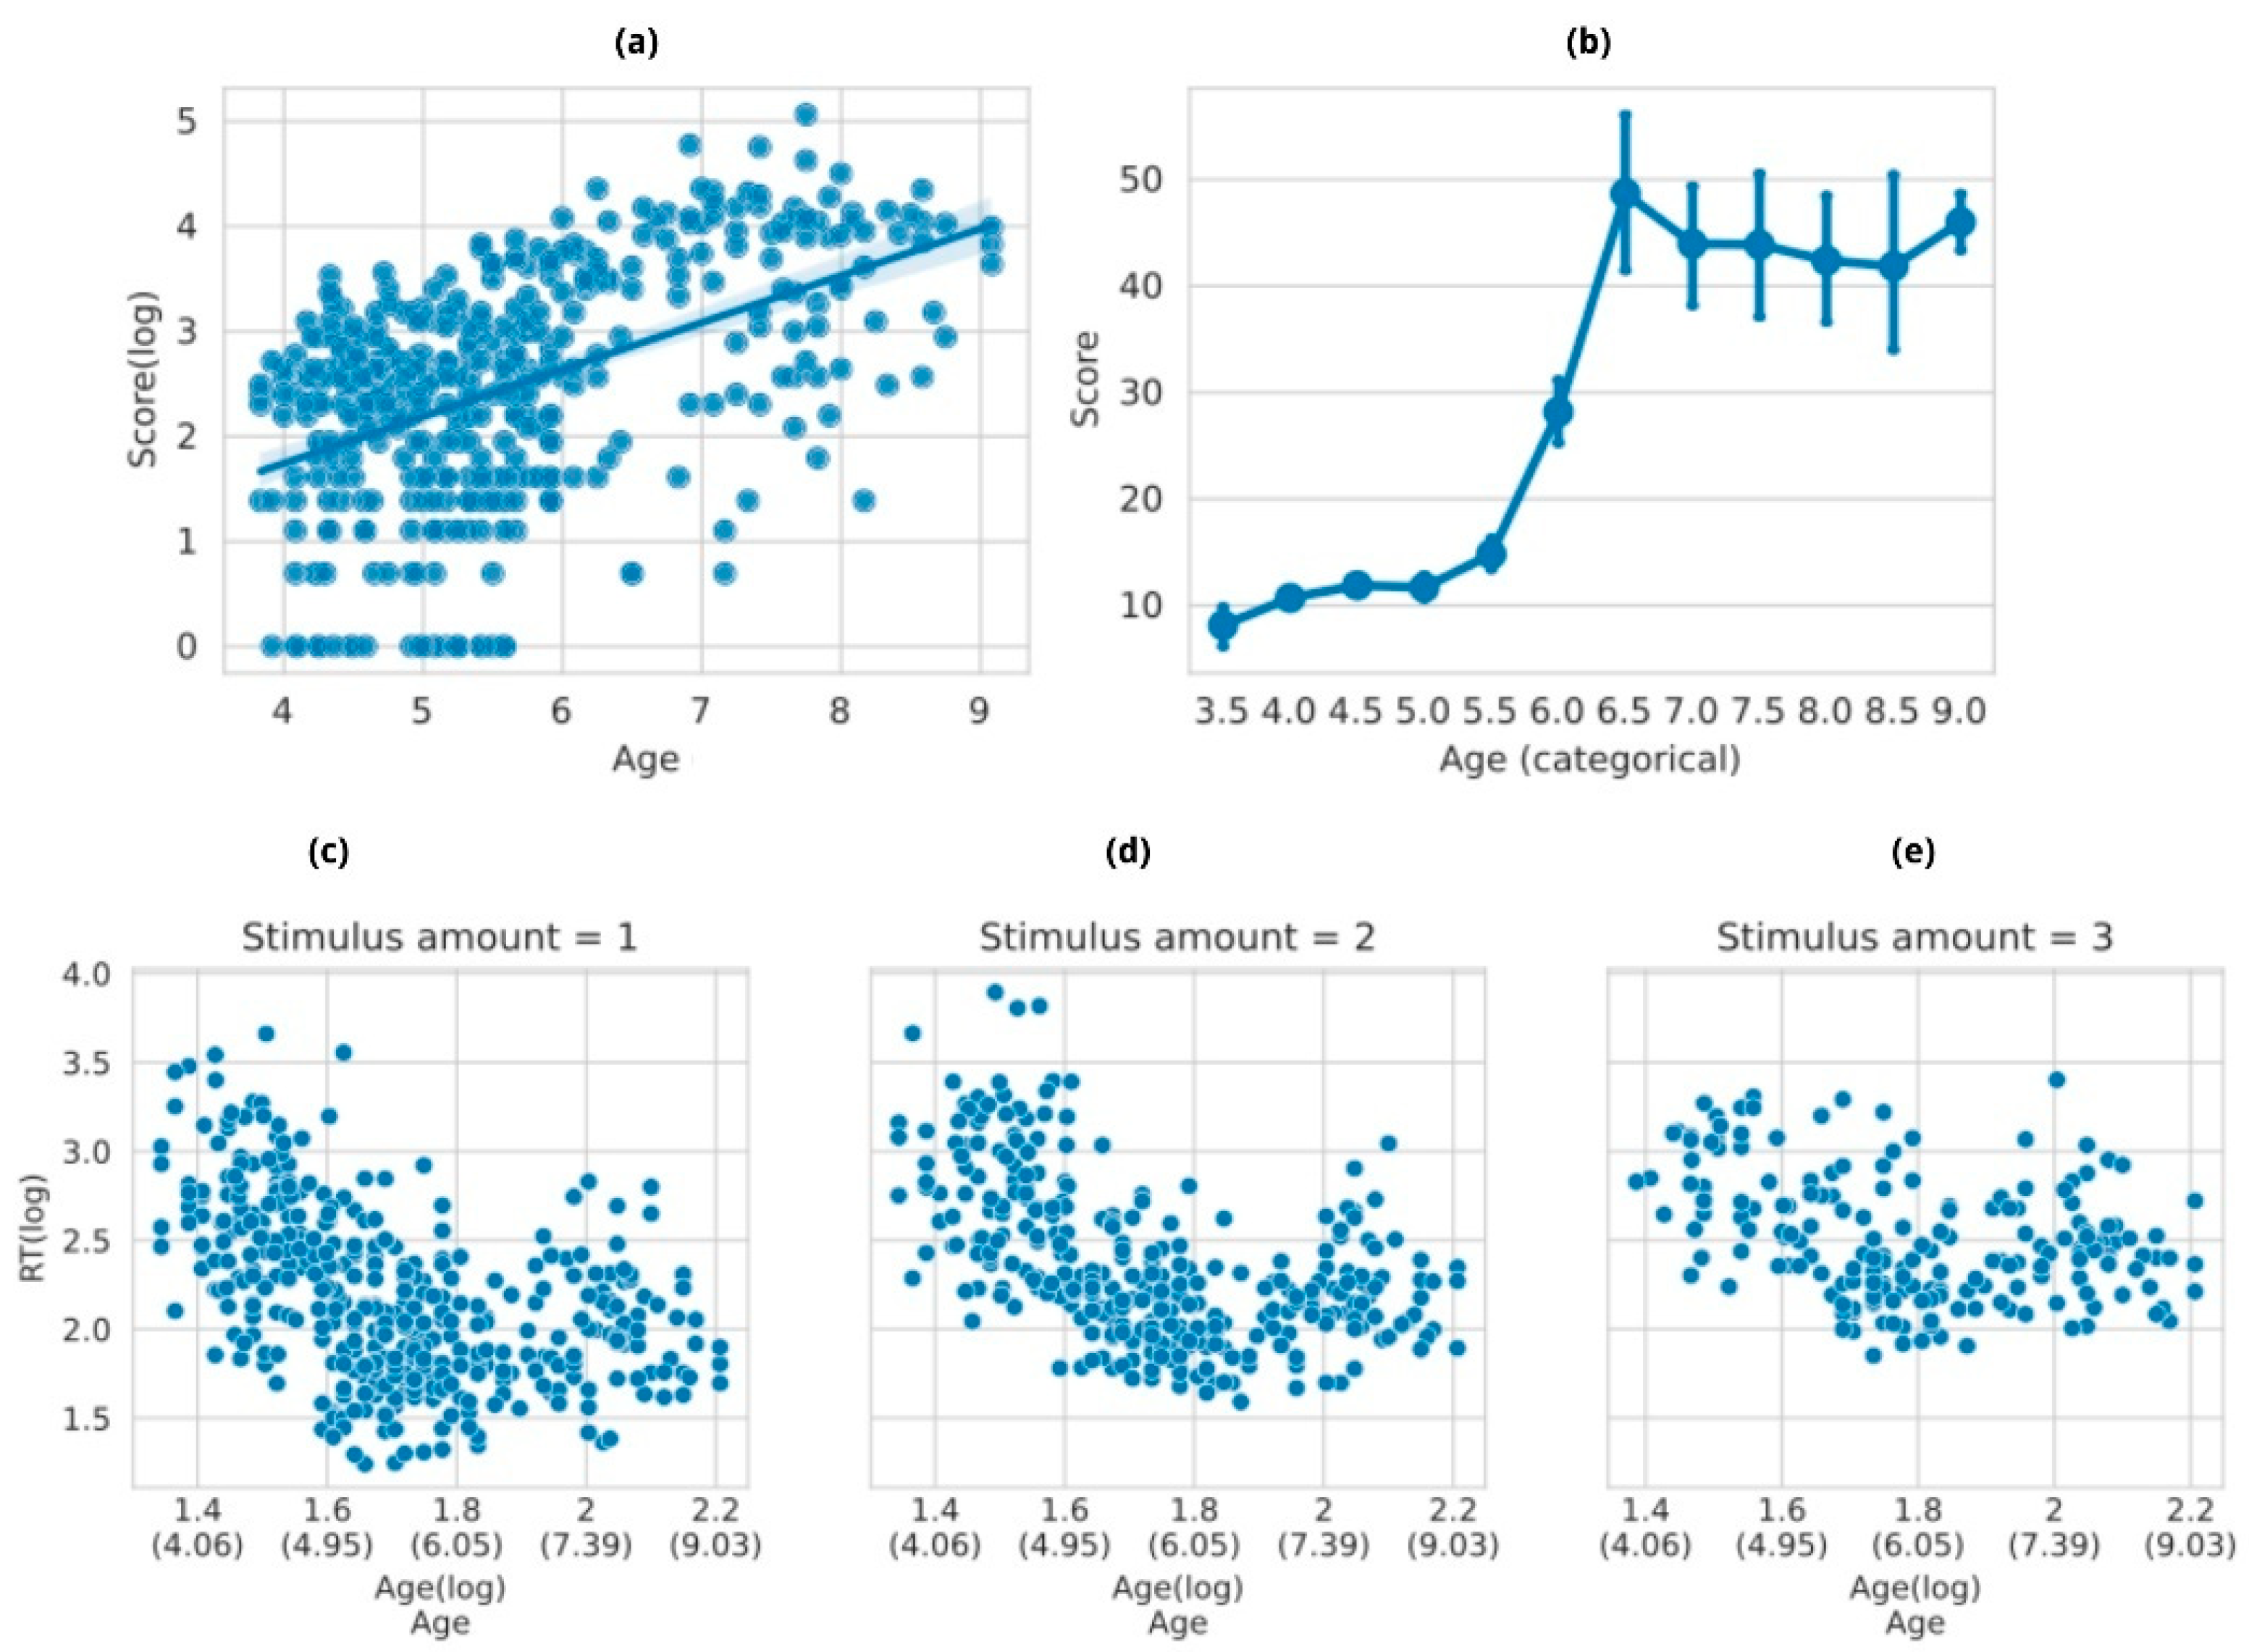
| Time-unconstrained tasks | (1) Span (2) Score (3) Response time (RT) per difficulty level | (A) Age (cont) (B) Difficulty | Corsi task [15] | Older children are expected to show higher values of (1) and (2). Trials with higher amounts of stimuli to be remembered are expected to be harder and, therefore, show an increase in (3), and that effect is expected to be modulated by age. |
| ToNI task [18] | Older children are expected to show higher values of (1) and (2). Trials with a higher amount of relations that have to be identified and integrated to respond correctly are expected to be harder and therefore show an increase in (3), and that effect is expected to be modulated by age [12]. | |||
| ToL task [19] | Older children are expected to show higher values of (1) and (2). Trials with higher amounts of movements required to solve the trial are expected to be harder and therefore show an increase in (3), and that effect is expected to be modulated by age. | |||
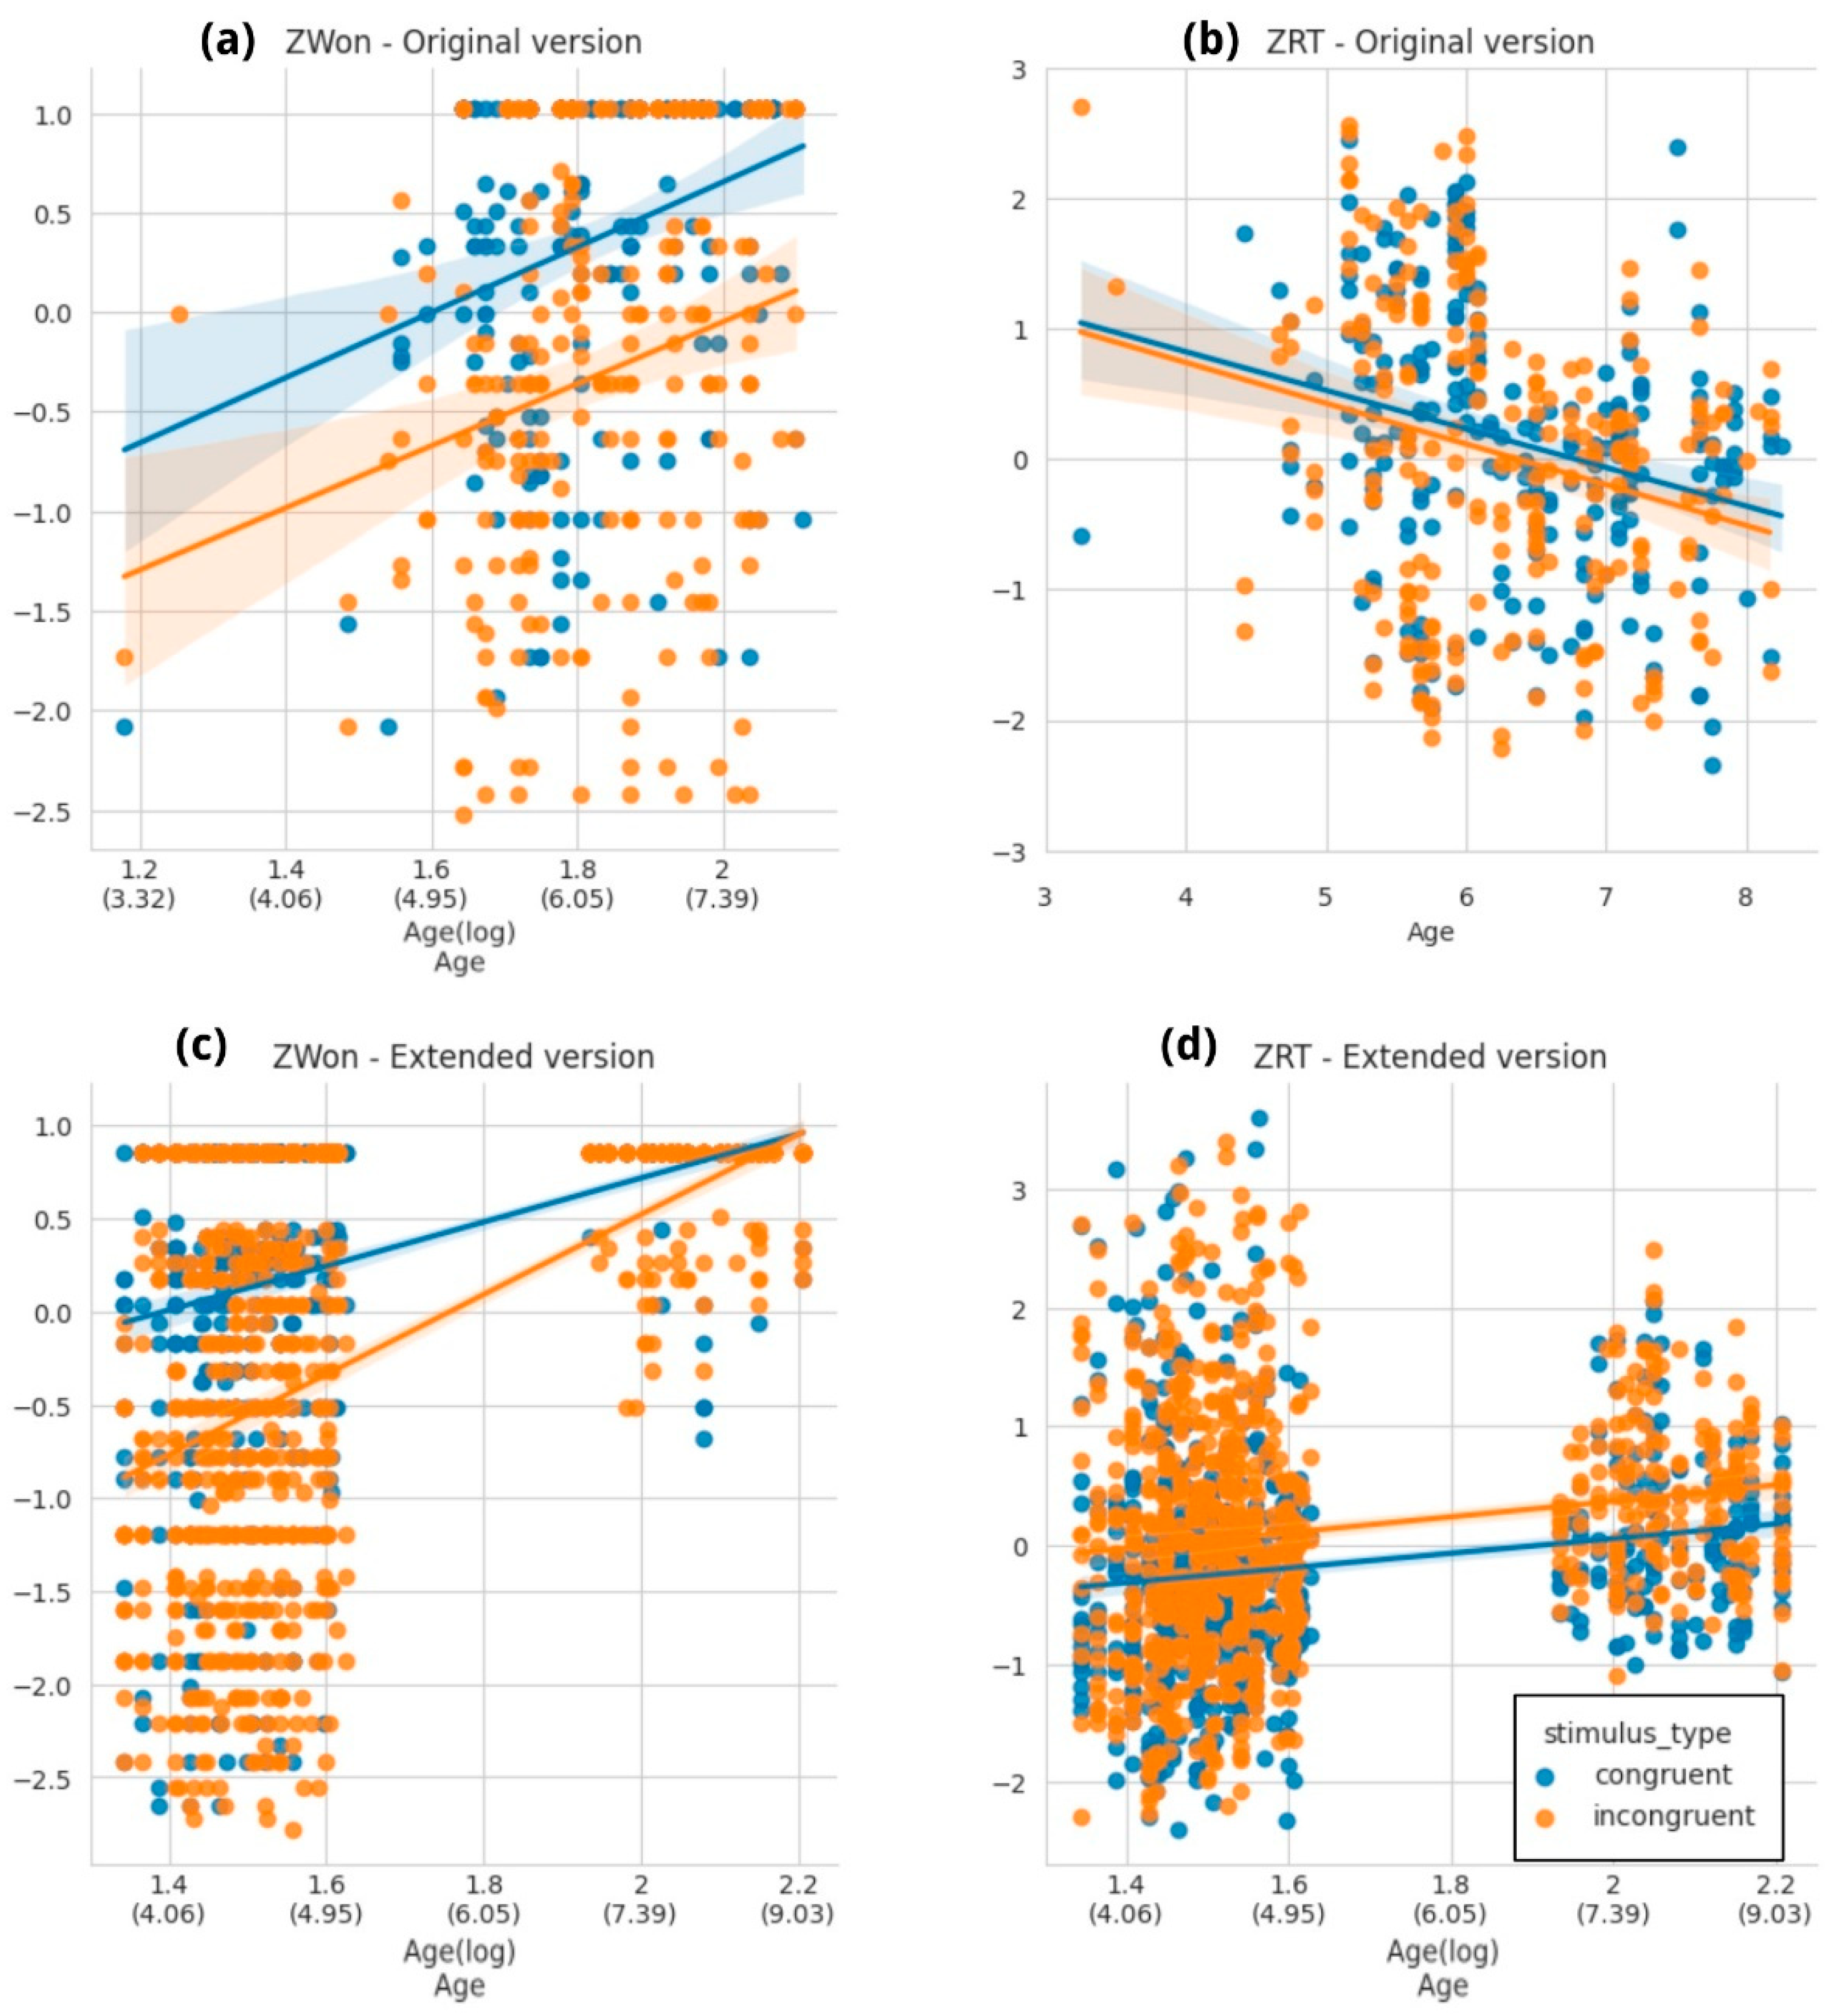
| Time-constrained tasks | (1) Proportion of correct answers (won) (2) Median RT for correct answers | (A) Age (cont) (B) Trial type | Child-ANT task [20] | Older children are expected to show higher values of (1) and lower values of (2). That effect is expected to be modulated by trial type, as follows: - incongruent trials should be harder than congruent trials. - trials without cue should be harder than the double-cued. - trials with central cue should be harder than the ones with spatial cues. |
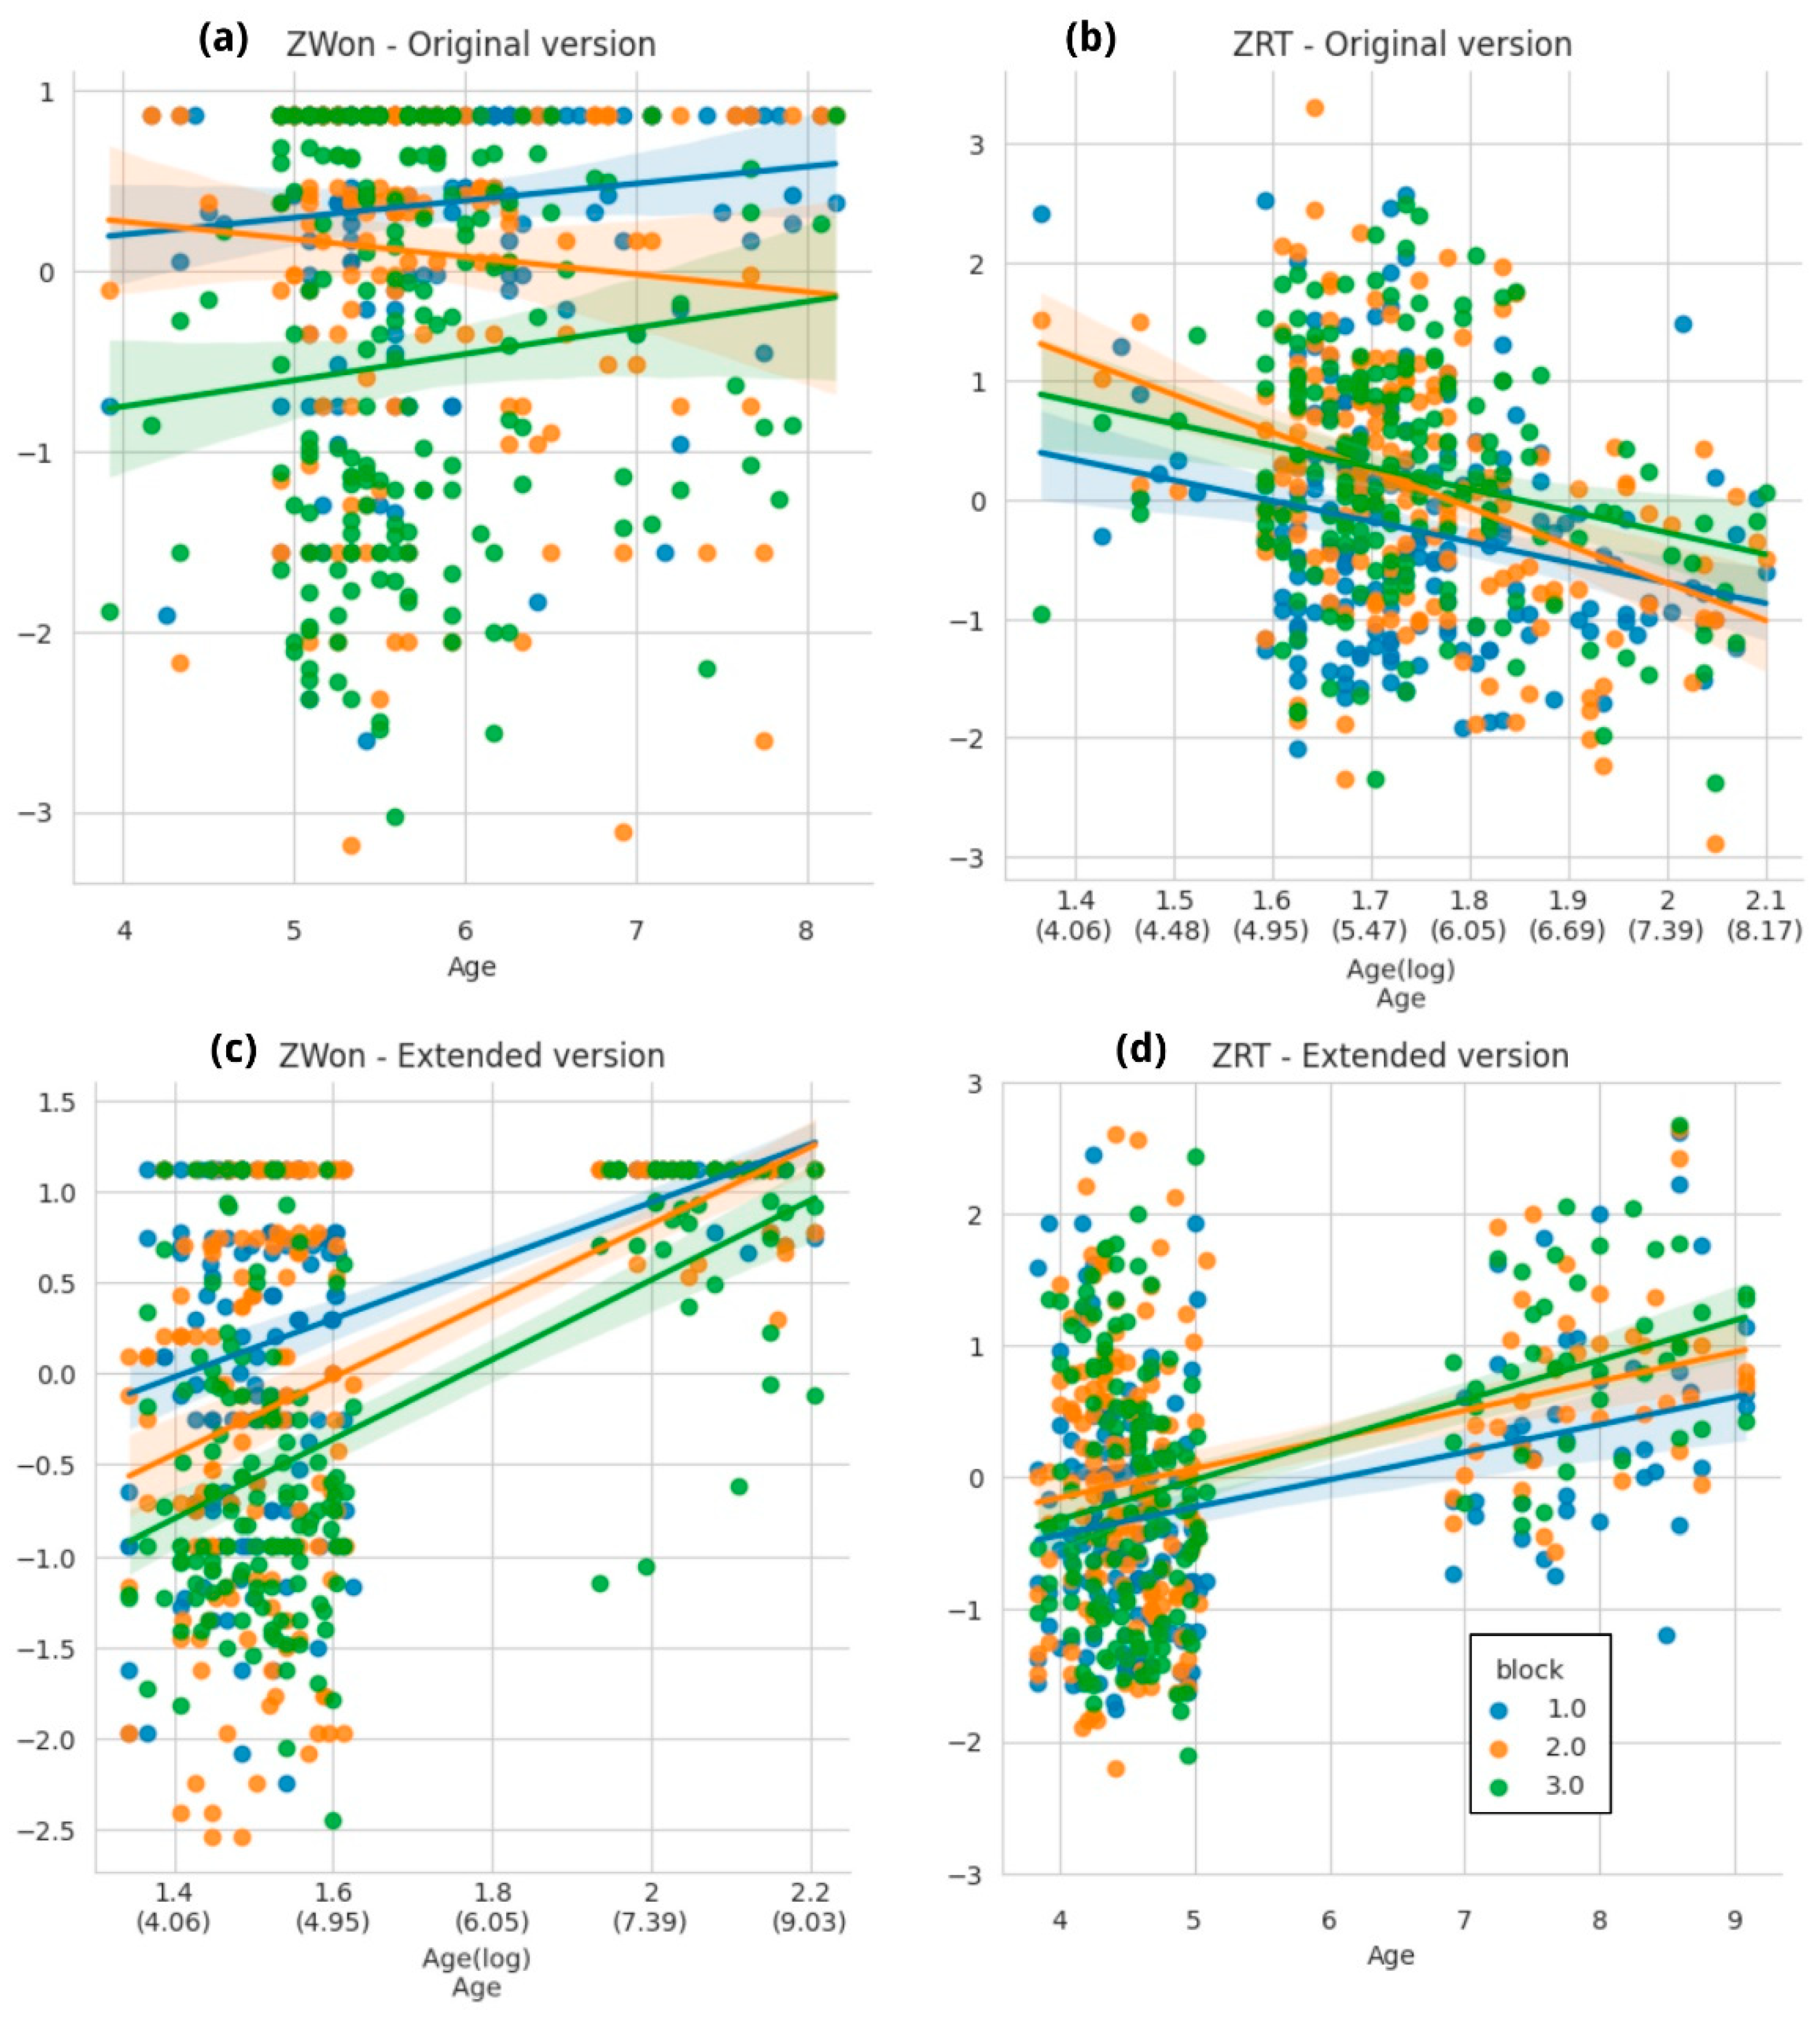
| Heart–Flower Stroop task [21] | Older children are expected to show higher values of (1) and lower values of (2). That effect is expected to be modulated by trial type, as follows: - incongruent trials should be harder than congruent trials. - stage 3 trials should be harder than respective trials from stages 1 and 2. | |||
| Composite cognitive performance score | (1) Average Z-score for accuracy | (A) Age | All of the above | Older children are expected to show higher (1). |
| Task Type | Task | Initial Participants | Outliers | Excluded (Pathology) | Excluded (Failed Completion Criteria) | Final Sample (% Original) | Available Birthdate |
|---|---|---|---|---|---|---|---|
| Without time constraint | Corsi task | 548 | 7 | 4 | 43 | 494 (90.14%) | 422 |
| ToNI-4 | 480 | 14 | 4 | 11 | 451 (93.96%) | 412 | |
| Tower of London task | 234 | 3 | 0 | 10 | 221 (94.44%) | 211 | |
| Time-constrained | Child-ANT | 384 | 8 | 4 | 23 | 349 (90.88%) | 306 |
| Heart–Flower Stroop | 488 | 4 | 4 | 28 | 452 (92.62%) | 406 |
3. Results
3.1. Descriptive Statistics
3.2. Time-Unconstrained Tasks
3.2.1. Corsi Task
3.2.2. ToNI Task
3.2.3. ToL Task
3.3. Time-Constrained Tasks
3.3.1. Child-ANT Task
3.3.2. Heart–Flower Stroop Task
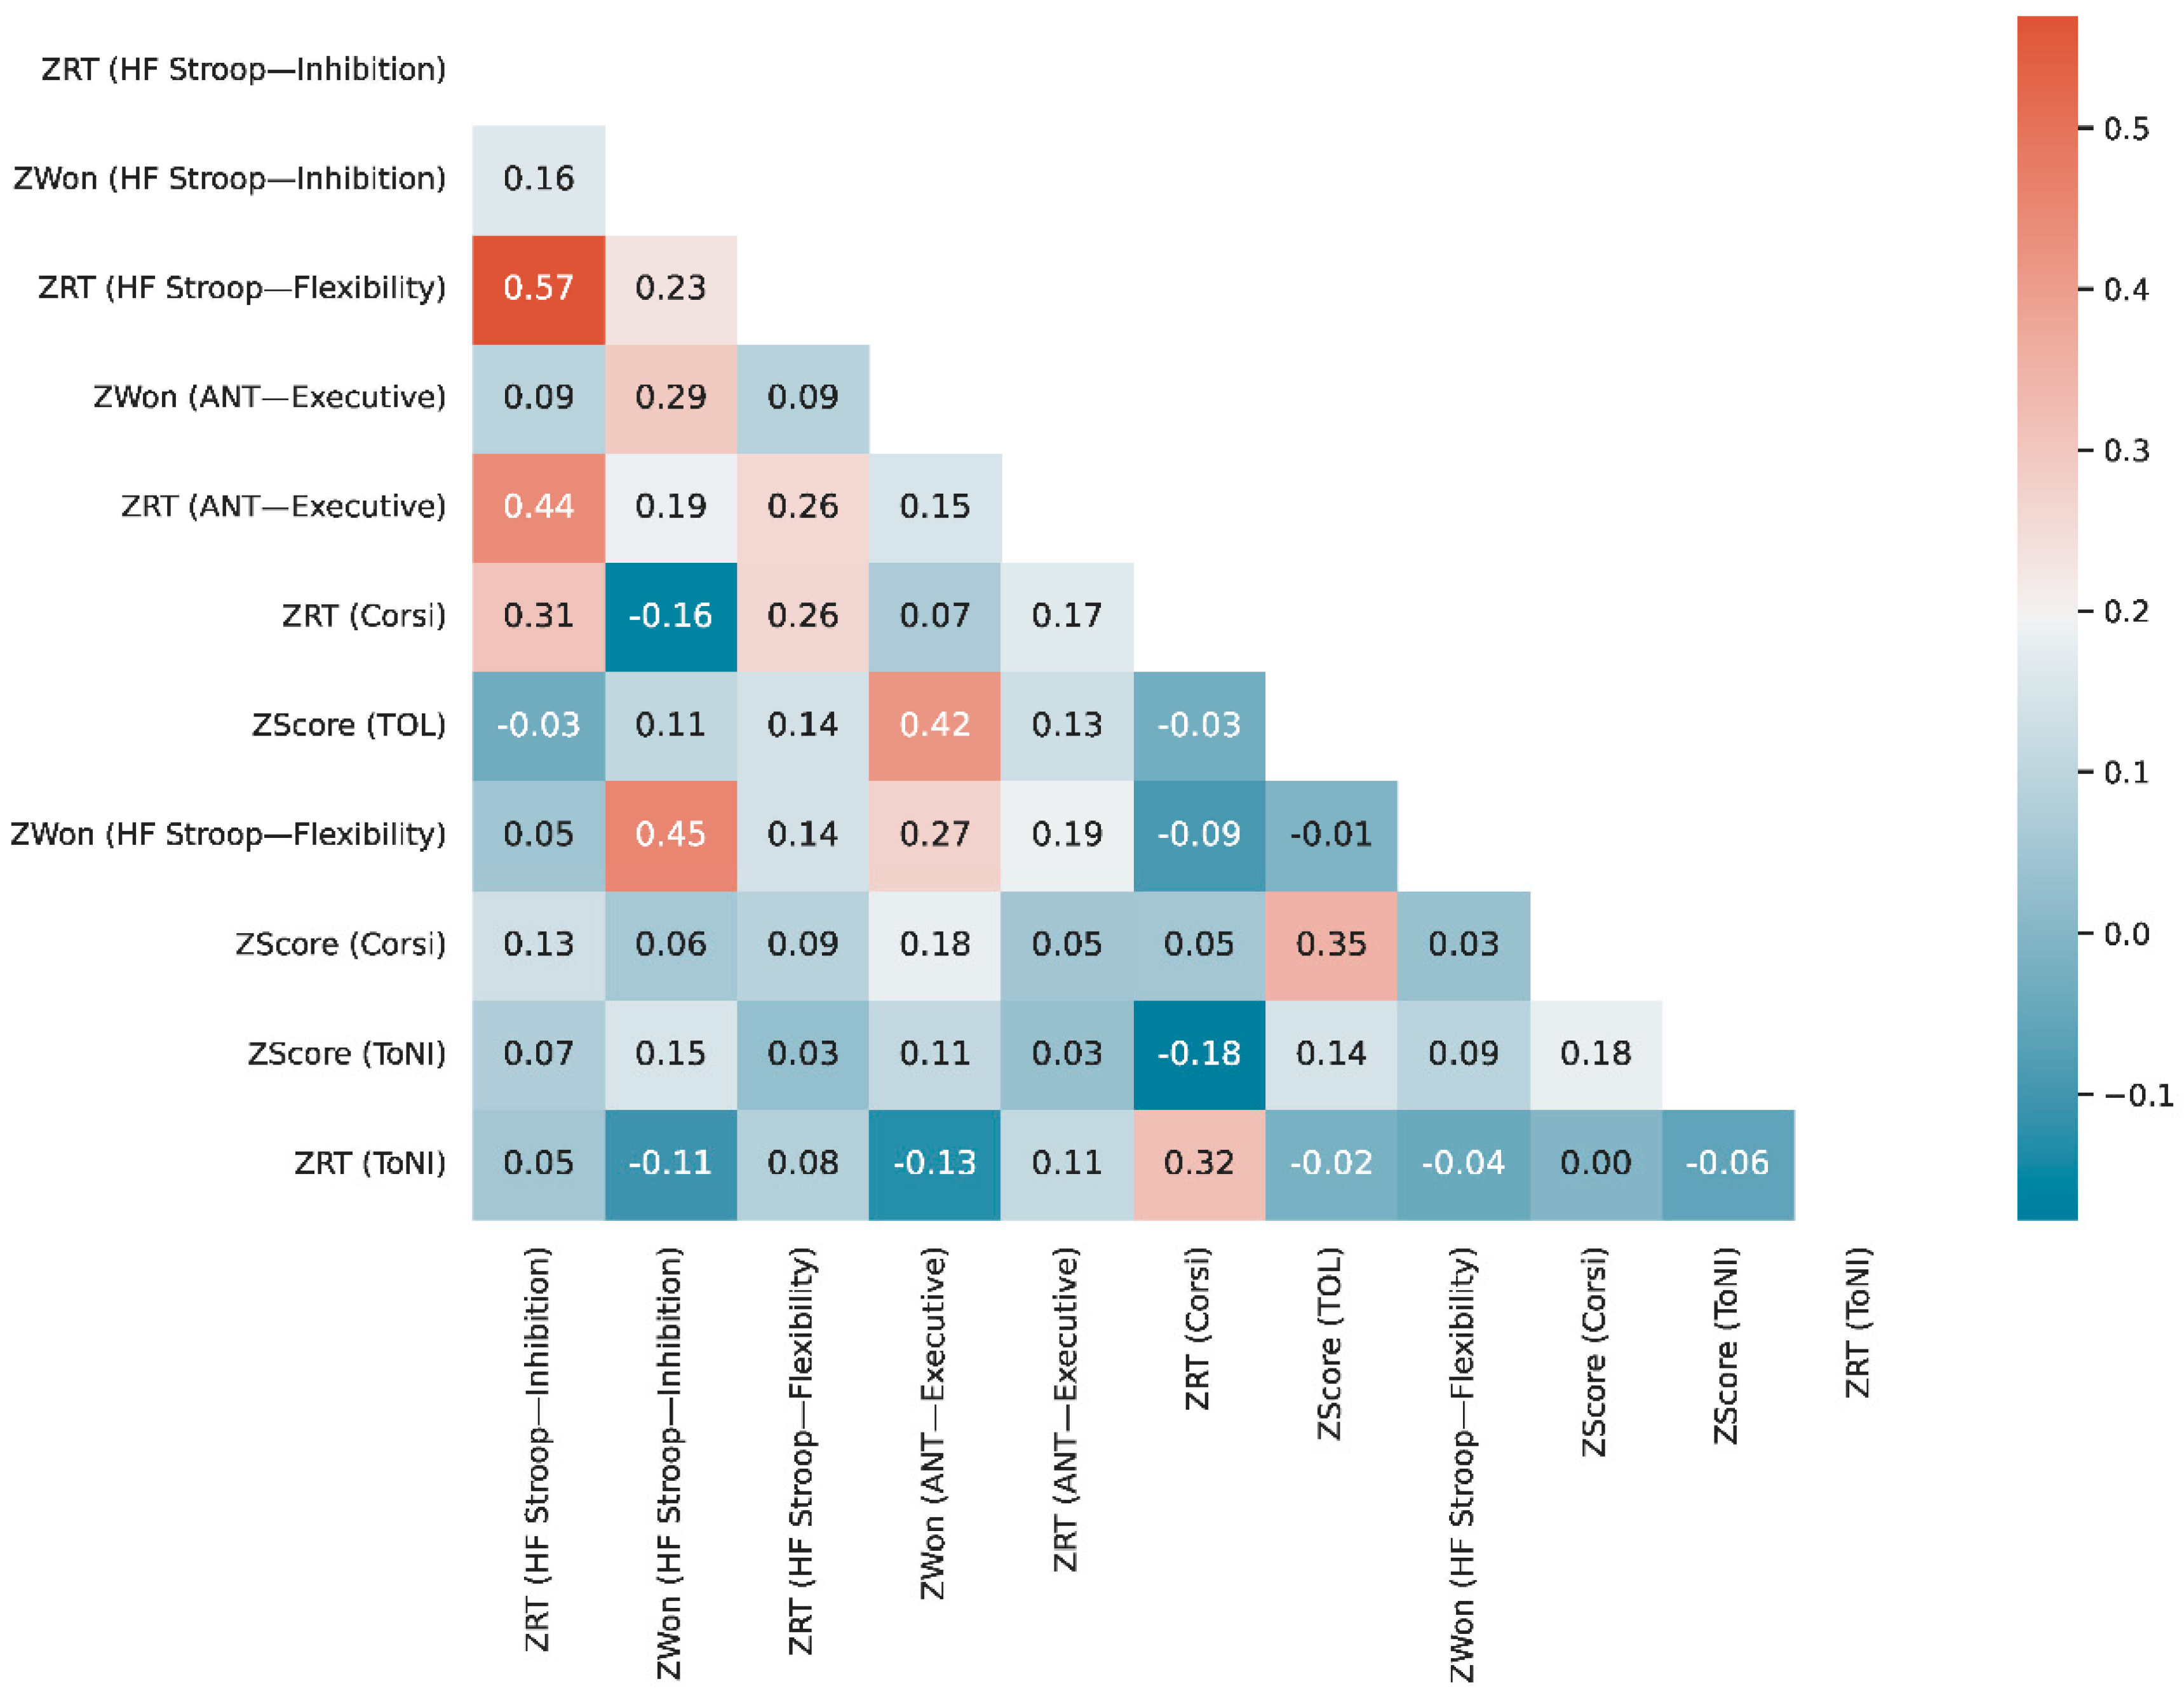
3.4. Composite Cognitive Performance Score
4. Discussion
4.1. Time-Unconstrained
4.2. Time-Constrained Tasks
4.3. General Discussion: Strengths and Limitations
5. Conclusions
Supplementary Materials
Author Contributions
Funding
Institutional Review Board Statement
Informed Consent Statement
Data Availability Statement
Acknowledgments
Conflicts of Interest
Correction Statement
References
- Nin, V.; Goldin, A.P.; Carboni, A. Mate Marote: Videojuegos para Estimular el Desarrollo de Procesos Cognitivos. IEEE-RITA 2019, 14, 1–10. [Google Scholar]
- Belloli, L.; Miguel, M.A.; Goldin, A.P.; Slezak, D.F. Mate Marote: A BigData platform for massive scale educational interventions. AGRANDA 2016, 107–114. Available online: https://core.ac.uk/download/pdf/301072908.pdf (accessed on 30 October 2023).
- Goldin, A.P.; Hermida, M.J.; Shalom, D.E.; Costa, M.E.; Lopez-Rosenfeld, M.; Segretin, M.S.; Fernandez Slezak, D.; Lipina, S.J.; Sigman, M. Far transfer to language and math of a short software-based gaming intervention. Proc. Natl. Acad. Sci. USA 2014, 54, 311–313. [Google Scholar] [CrossRef]
- Nin, V.; Delgado, H.; Goldin, A.P.; Fernández-Slezak, D.; Belloli, L.; Carboni, A. A Classroom-Embedded Video Game Intervention Improves Executive Functions in Kindergarteners. J. Cogn. Enhanc. 2023, 7, 19–38. [Google Scholar] [CrossRef]
- Deater-Deckard, K.; Li, M.; Lee, J.; King-Casas, B.; Kim-Spoon, J. Poverty and Puberty: A Neurocognitive Study of Inhibitory Control in the Transition to Adolescence. Psychol. Sci. 2019, 30, 1573–1583. [Google Scholar] [CrossRef]
- Delalande, L.; Moyon, M.; Tissier, C.; Dorriere, V.; Guillois, B.; Mevell, K.; Charron, S.; Salvia, E.; Poirel, N.; Vidal, J.; et al. Complex and subtle structural changes in prefrontal cortex induced by inhibitory control training from childhood to adolescence. Dev. Sci. 2020, 23, e12898. [Google Scholar] [CrossRef] [PubMed]
- Buttelmann, F.; Karbach, J. Development and plasticity of cognitive flexibility in early and middle childhood. Front. Psychol. 2017, 8, 1040. [Google Scholar] [CrossRef]
- Colé, P.; Duncan, L.G.; Blaye, A. Cognitive flexibility predicts early reading skills. Front. Psychol. 2014, 40, 56. [Google Scholar]
- Johann, V.E.; Karbach, J. Effects of game-based and standard executive control training on cognitive and academic abilities in elementary school children. Dev. Sci. 2020, 23, e12866. [Google Scholar] [CrossRef]
- Baddeley, A.D. Working Memory. Science 1992, 302, 239–435. [Google Scholar] [CrossRef]
- Diamond, A. Executive functions. In Handbook of Clinical Neurology; Elsevier: Amsterdam, The Netherlands, 2020; Volume 173, Chapter 19. [Google Scholar]
- Bunge, S.A. How Should We Slice Up the Executive Function Pie? Striving Toward an Ontology of Cognitive Control Processes. Mind Brain Educ. 2024. early view. [Google Scholar] [CrossRef]
- Akshoomoff, N.; Beaumont, J.L.; Bauer, P.J.; Dikmen, S.S.; Gershon, R.C.; Mungas, D.; Slotkin, J.; Tulsky, D.; Weintraub, S.; Zelazo, P.D.; et al. VIII. Nih Toolbox Cognition Battery (cb): Composite Scores of Crystallized, Fluid, and Overall Cognition. Monogr. Soc. Res. Child. Dev. 2013, 78, 119–132. [Google Scholar] [CrossRef]
- De Luca, C.R.; Wood, S.J.; Anderson, V.; Buchanan, J.-A.; Proffitt, T.M.; Mahony, K.; Pantelis, C. Normative Data From the Cantab. I: Development of Executive Function Over the Lifespan. J. Clin. Exp. Neuropsychol. 2003, 25, 242–254. [Google Scholar] [CrossRef] [PubMed]
- Berch, D.B.; Krikorian, R.; Huha, E.M. The Corsi block-tapping task: Methodological and theoretical considerations. Brain Cogn. 1998, 38, 317–338. [Google Scholar] [CrossRef] [PubMed]
- Kessels, R.P.C.; Van Zandvoort, M.J.E.; Postma, A.; Kappelle, L.J.; De Haan, E.H.F. The Corsi Block-Tapping Task: Standardization and normative data. Appl. Neuropsychol. 2000, 7, 252–258. [Google Scholar] [CrossRef] [PubMed]
- Lassiter, K.S.; Harrison, T.K.; Matthews, T.D.; Bell, N.L. The validity of the comprehensive test of nonverbal intelligence as a measure of fluid intelligence. Psychol. Assesment 2001, 33, 928–940. [Google Scholar] [CrossRef]
- Ritter, N.; Kilinc, E.; Navruz, B.; Bae, Y. Test Review: L. Brown, R.J. Sherbenou, & S. K. Johnsen Test of Nonverbal Intelligence-4 (TONI-4). Austin, TX: PRO-ED, 2010. J. Psychoeduc. Assess. 2011, 29, 484–488. [Google Scholar]
- Phillips, L.H.; Wynn, V.E.; McPherson, S.; Gilhooly, K.J. Mental planning and the Tower of London task. Q. J. Exp. Psychol. Sect. A 2001, 54, 579–597. [Google Scholar] [CrossRef]
- Rueda, M.R.; Fan, J.; McCandliss, B.D.; Halparin, J.D.; Gruber, D.B.; Lercari, L.P.; Posner, M.I. Development of attentional networks in childhood. Neuropsychologia 2004, 42, 1029–1040. [Google Scholar] [CrossRef] [PubMed]
- Davidson, M.C.; Amso, D.; Anderson, L.C.; Diamond, A. Development of cognitive control and executive functions from 4 to 13 years: Evidence from manipulations of memory, inhibition, and task switching. Neuropsychologia 2006, 44, 2037–2078. [Google Scholar] [CrossRef] [PubMed]
- Lopez-Rosenfeld, M.; Goldin, A.P.; Lipina, S.; Sigman, M.; Fernandez Slezak, D. Mate Marote: A flexible automated framework for large-scale educational interventions. Comput. Educ. 2013, 68, 307–313. [Google Scholar] [CrossRef]
- Pietto, M.L.; Giovannetti, F.; Segretin, M.S.; Belloli, L.M.L.; Lopez-Rosenfeld, M.; Goldin, A.P.; Fernández-Slezak, D.; Kamienkowski, J.E.; Lipina, S.J. Enhancement of inhibitory control in a sample of preschoolers from poor homes after cognitive training in a kindergarten setting: Cognitive and ERP evidence. Trends Neurosci. Educ. 2018, 13, 34–42. [Google Scholar] [CrossRef]
- Wiebe, S.A.; Karbach, J. Executive Function: Development Across the Life Span; Routledge: New York, NY, USA, 2018. [Google Scholar]
- Goldin, A.P.; Segretin, M.S.; Hermida, M.J.; Paz, L.; Lipina, S.J.; Sigman, M. Training planning and working memory in third graders. Mind Brain Educ. 2013, 7, 136–146. [Google Scholar] [CrossRef]
- Claessen, M.H.G.; Van Der Ham, I.J.M.; Van Zandvoort, M.J.E. Computerization of the standard corsi block-tapping task affects its underlying cognitive concepts: A pilot study. Appl. Neuropsychol. 2015, 22, 180–188. [Google Scholar] [CrossRef] [PubMed]
- Corsi, P.M. Human Memory and the Medial Temporal Region of the Brain. Ph.D. Thesis, McGill University, Montreal, QC, Canada, 1973. [Google Scholar]
- Brunetti, R.; Indraccolo, A.; Del Gatto, C.; Farina, B.; Imperatori, C.; Fontana, E.; Penso, J.; Ardito, R.B.; Adenzato, M. eStroop: Implementation, Standardization, and Systematic Comparison of a New Voice-Key Version of the Traditional Stroop Task. Front. Psychol. 2021, 12, 663786. [Google Scholar] [CrossRef]
- Lipina, S.; Segretin, M.S.; Hermida, M.J.; Prats, L.; Fracchia, C.S.; Lopez Camelo, J.; Colombo, J.A. Linking childhood poverty and cognition: Environmental mediators of non-verbal executive control in an Argentine sample. Dev. Sci. 2013, 16, 697–707. [Google Scholar] [CrossRef]
- Farrell Pagulayan, K.; Busch, R.; Medina, K.; Bartok, J.; Krikorian, R. Developmental normative data for the Corsi Block-Tapping task. J. Clin. Exp. Neuropsychol. 2006, 28, 1043–1052. [Google Scholar] [CrossRef]
- Starr, A.; Leib, E.R.; Younger, J.W.; Uncapher, M.R.; Bunge, S.A. Relational thinking: An overlooked component of executive functioning. Dev. Sci. 2023, 26, e13320. [Google Scholar] [CrossRef]
- Ferrer, E.; O’Hare, E.; Bunge, S. Fluid reasoning and the developing brain. Front. Neurosci. 2009, 3, 481. [Google Scholar] [CrossRef]
- Shallice, T. Specific impairments of planning. Philos. Trans. R. Soc. Lond. 1982, 298, 199–209. [Google Scholar]
- Kotovsky, K.; Hayes, J.R.; Simon, H.A. Why are some problems hard? Evidence from Tower of Hanoi. Cogn. Psychol. 1985, 17, 248–294. [Google Scholar] [CrossRef]
- Nakagawa, S.; Schielzeth, H. A general and simple method for obtaining R2 from generalized linear mixed-effects models. Methods Ecol. Evol. 2013, 4, 133–142. [Google Scholar] [CrossRef]
- McDonald, J.H. Handbook of Biological Statistics; Sparky House Publishing: Baltimore, MA, USA, 2009. [Google Scholar]
- Harrison, X.A.; Donaldson, L.; Correa-Cano, M.E.; Evans, J.; Fisher, D.N.; Goodwin, C.E.D.; Robinson, B.S.; Hodgson, D.J.; Inger, R. A brief introduction to mixed effects modelling and multi-model inference in ecology. PeerJ 2018, 6, e4794. [Google Scholar] [CrossRef]
- Hodson, T.O. Root-mean-square error (RMSE) or mean absolute error (MAE): When to use them or not. Geosci. Model. Dev. 2022, 15, 5481–5487. [Google Scholar] [CrossRef]
- Viterbori, P.; Usai, M.C.; Traverso, L.; De Franchis, V. How preschool executive functioning predicts several aspects of math achievement in Grades 1 and 3: A longitudinal study. J. Exp. Child. Psychol. 2015, 140, 38–55. [Google Scholar] [CrossRef] [PubMed]
- Willoughby, M.T.; Piper, B.; Oyanga, A.; Merseth King, K. Measuring executive function skills in young children in Kenya: Associations with school readiness. Dev. Sci. 2019, 22, e12818. [Google Scholar] [CrossRef] [PubMed]
- Orsini, A.; Grossi, D.; Capitani, E.; Laiacona, M.; Papagno, C.; Vallar, G. Verbal and spatial immediate memory span: Normative data from 1355 adults and 1112 children. Ital. J. Neurol. Sci. 1987, 8, 537–548. [Google Scholar] [CrossRef] [PubMed]
- Giovannetti, F.; Pietto, M.L.; Segretin, M.S.; Lipina, S.J. Impact of an individualized and adaptive cognitive intervention on working memory, planning and fluid reasoning processing in preschoolers from poor homes. Child Neuropsychol. 2022, 28, 597–626. [Google Scholar] [CrossRef] [PubMed]
- Owen, A.M.; Downes, J.J.; Sahakjan, B.J.; Polkey, C.E.; Robbins, T.W. Planning and Spatial Working Memory Following Frontal Lobe Lesions in Man. Neuropsychologia 1990, 28, 1021–1034. [Google Scholar] [CrossRef] [PubMed]
- Diamond, A.; Barnett, W.S.; Thomas, J.; Munro, S. Preschool Program Improves Cognitive Control. Science 2007, 318, 1387–1388. [Google Scholar] [CrossRef] [PubMed]
- Best, J.R.; Miller, P.H. A Developmental Perspective on Executive Function. Child Dev. 2010, 81, 1641–1660. [Google Scholar] [CrossRef] [PubMed]


Disclaimer/Publisher’s Note: The statements, opinions and data contained in all publications are solely those of the individual author(s) and contributor(s) and not of MDPI and/or the editor(s). MDPI and/or the editor(s) disclaim responsibility for any injury to people or property resulting from any ideas, methods, instructions or products referred to in the content. |
© 2024 by the authors. Licensee MDPI, Basel, Switzerland. This article is an open access article distributed under the terms and conditions of the Creative Commons Attribution (CC BY) license (https://creativecommons.org/licenses/by/4.0/).
Share and Cite
Vladisauskas, M.; Paz, G.O.; Nin, V.; Guillén, J.C.; Belloli, L.; Delgado, H.; Miguel, M.A.; Macario Cabral, D.; Shalom, D.E.; Forés, A.; et al. The Long and Winding Road to Real-Life Experiments: Remote Assessment of Executive Functions with Computerized Games—Results from 8 Years of Naturalistic Interventions. Brain Sci. 2024, 14, 262. https://doi.org/10.3390/brainsci14030262
Vladisauskas M, Paz GO, Nin V, Guillén JC, Belloli L, Delgado H, Miguel MA, Macario Cabral D, Shalom DE, Forés A, et al. The Long and Winding Road to Real-Life Experiments: Remote Assessment of Executive Functions with Computerized Games—Results from 8 Years of Naturalistic Interventions. Brain Sciences. 2024; 14(3):262. https://doi.org/10.3390/brainsci14030262
Chicago/Turabian StyleVladisauskas, Melina, Gabriel O. Paz, Verónica Nin, Jesús C. Guillén, Laouen Belloli, Hernán Delgado, Martín A. Miguel, Daniela Macario Cabral, Diego E. Shalom, Anna Forés, and et al. 2024. "The Long and Winding Road to Real-Life Experiments: Remote Assessment of Executive Functions with Computerized Games—Results from 8 Years of Naturalistic Interventions" Brain Sciences 14, no. 3: 262. https://doi.org/10.3390/brainsci14030262
APA StyleVladisauskas, M., Paz, G. O., Nin, V., Guillén, J. C., Belloli, L., Delgado, H., Miguel, M. A., Macario Cabral, D., Shalom, D. E., Forés, A., Carboni, A., Fernández-Slezak, D., & Goldin, A. P. (2024). The Long and Winding Road to Real-Life Experiments: Remote Assessment of Executive Functions with Computerized Games—Results from 8 Years of Naturalistic Interventions. Brain Sciences, 14(3), 262. https://doi.org/10.3390/brainsci14030262