
Probing the Bottleneck of Awareness Formed by Foveal Crowding: A Neurophysiological Study

Abstract
1. Introduction
2. Methods
2.1. Participants
2.2. Stimuli and Procedures
2.3. Apparatus
EEG Recording and Processing
2.4. Data Analysis
3. Results
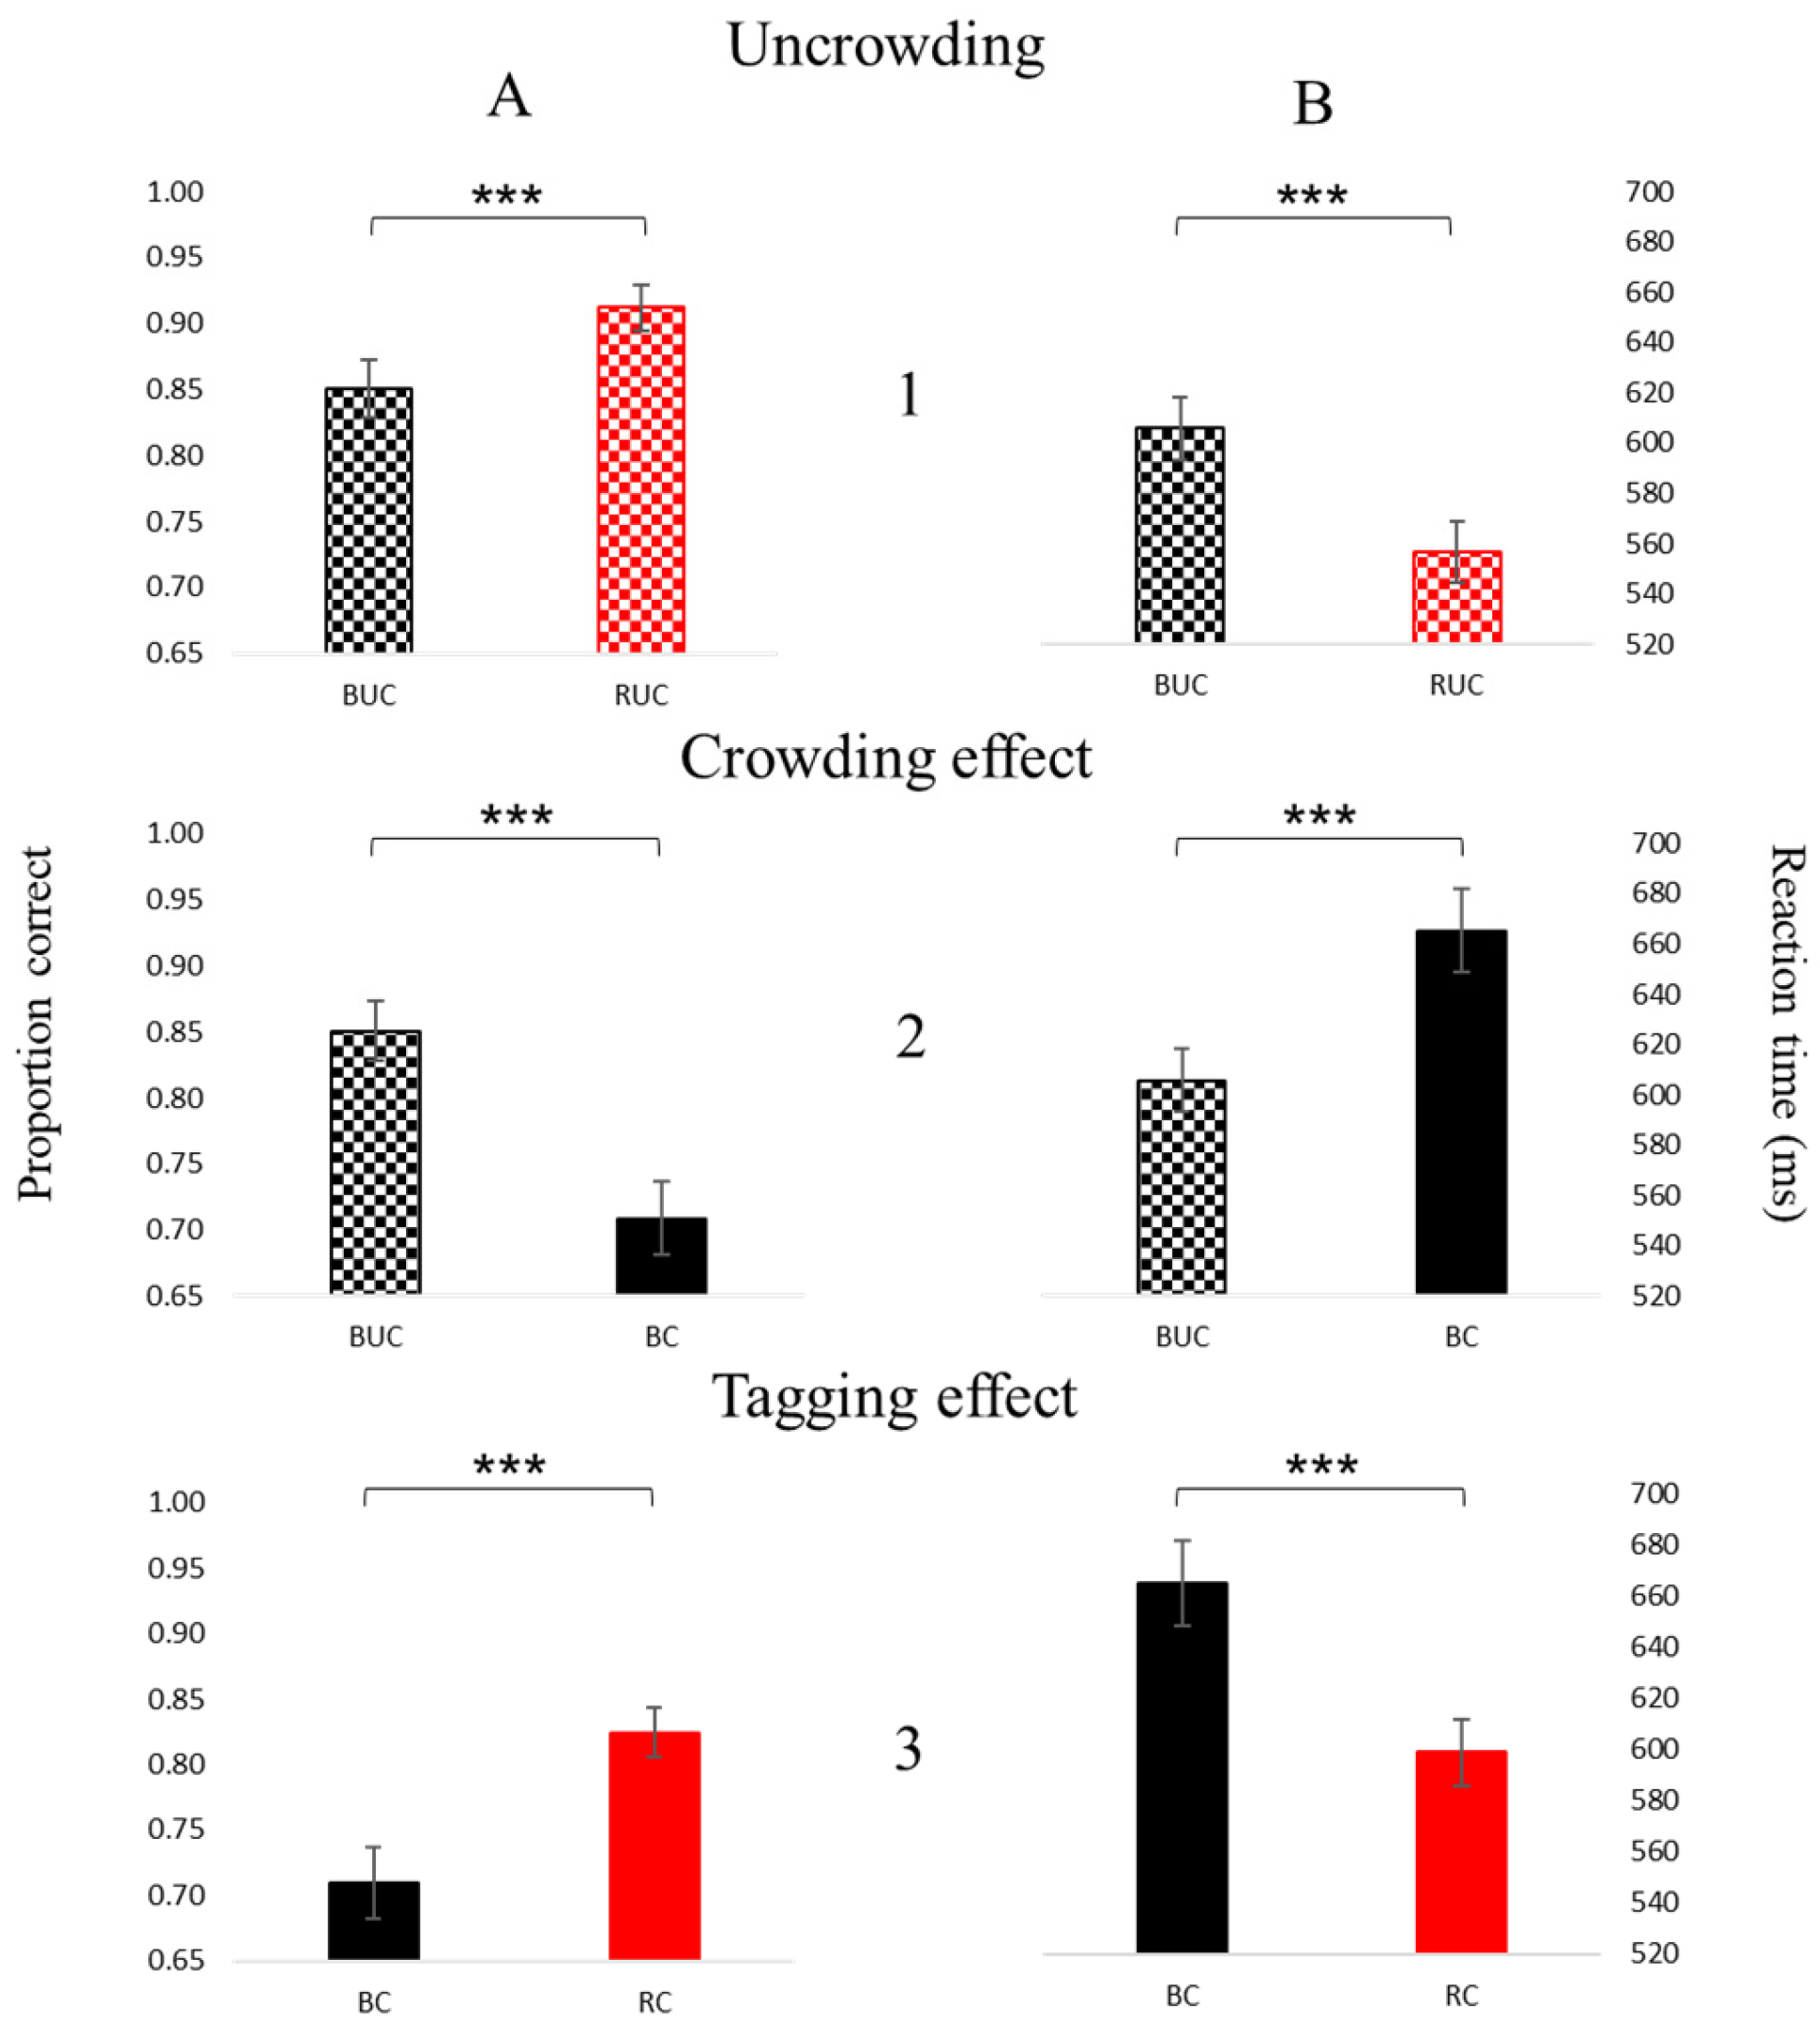
3.1. Psychophysics
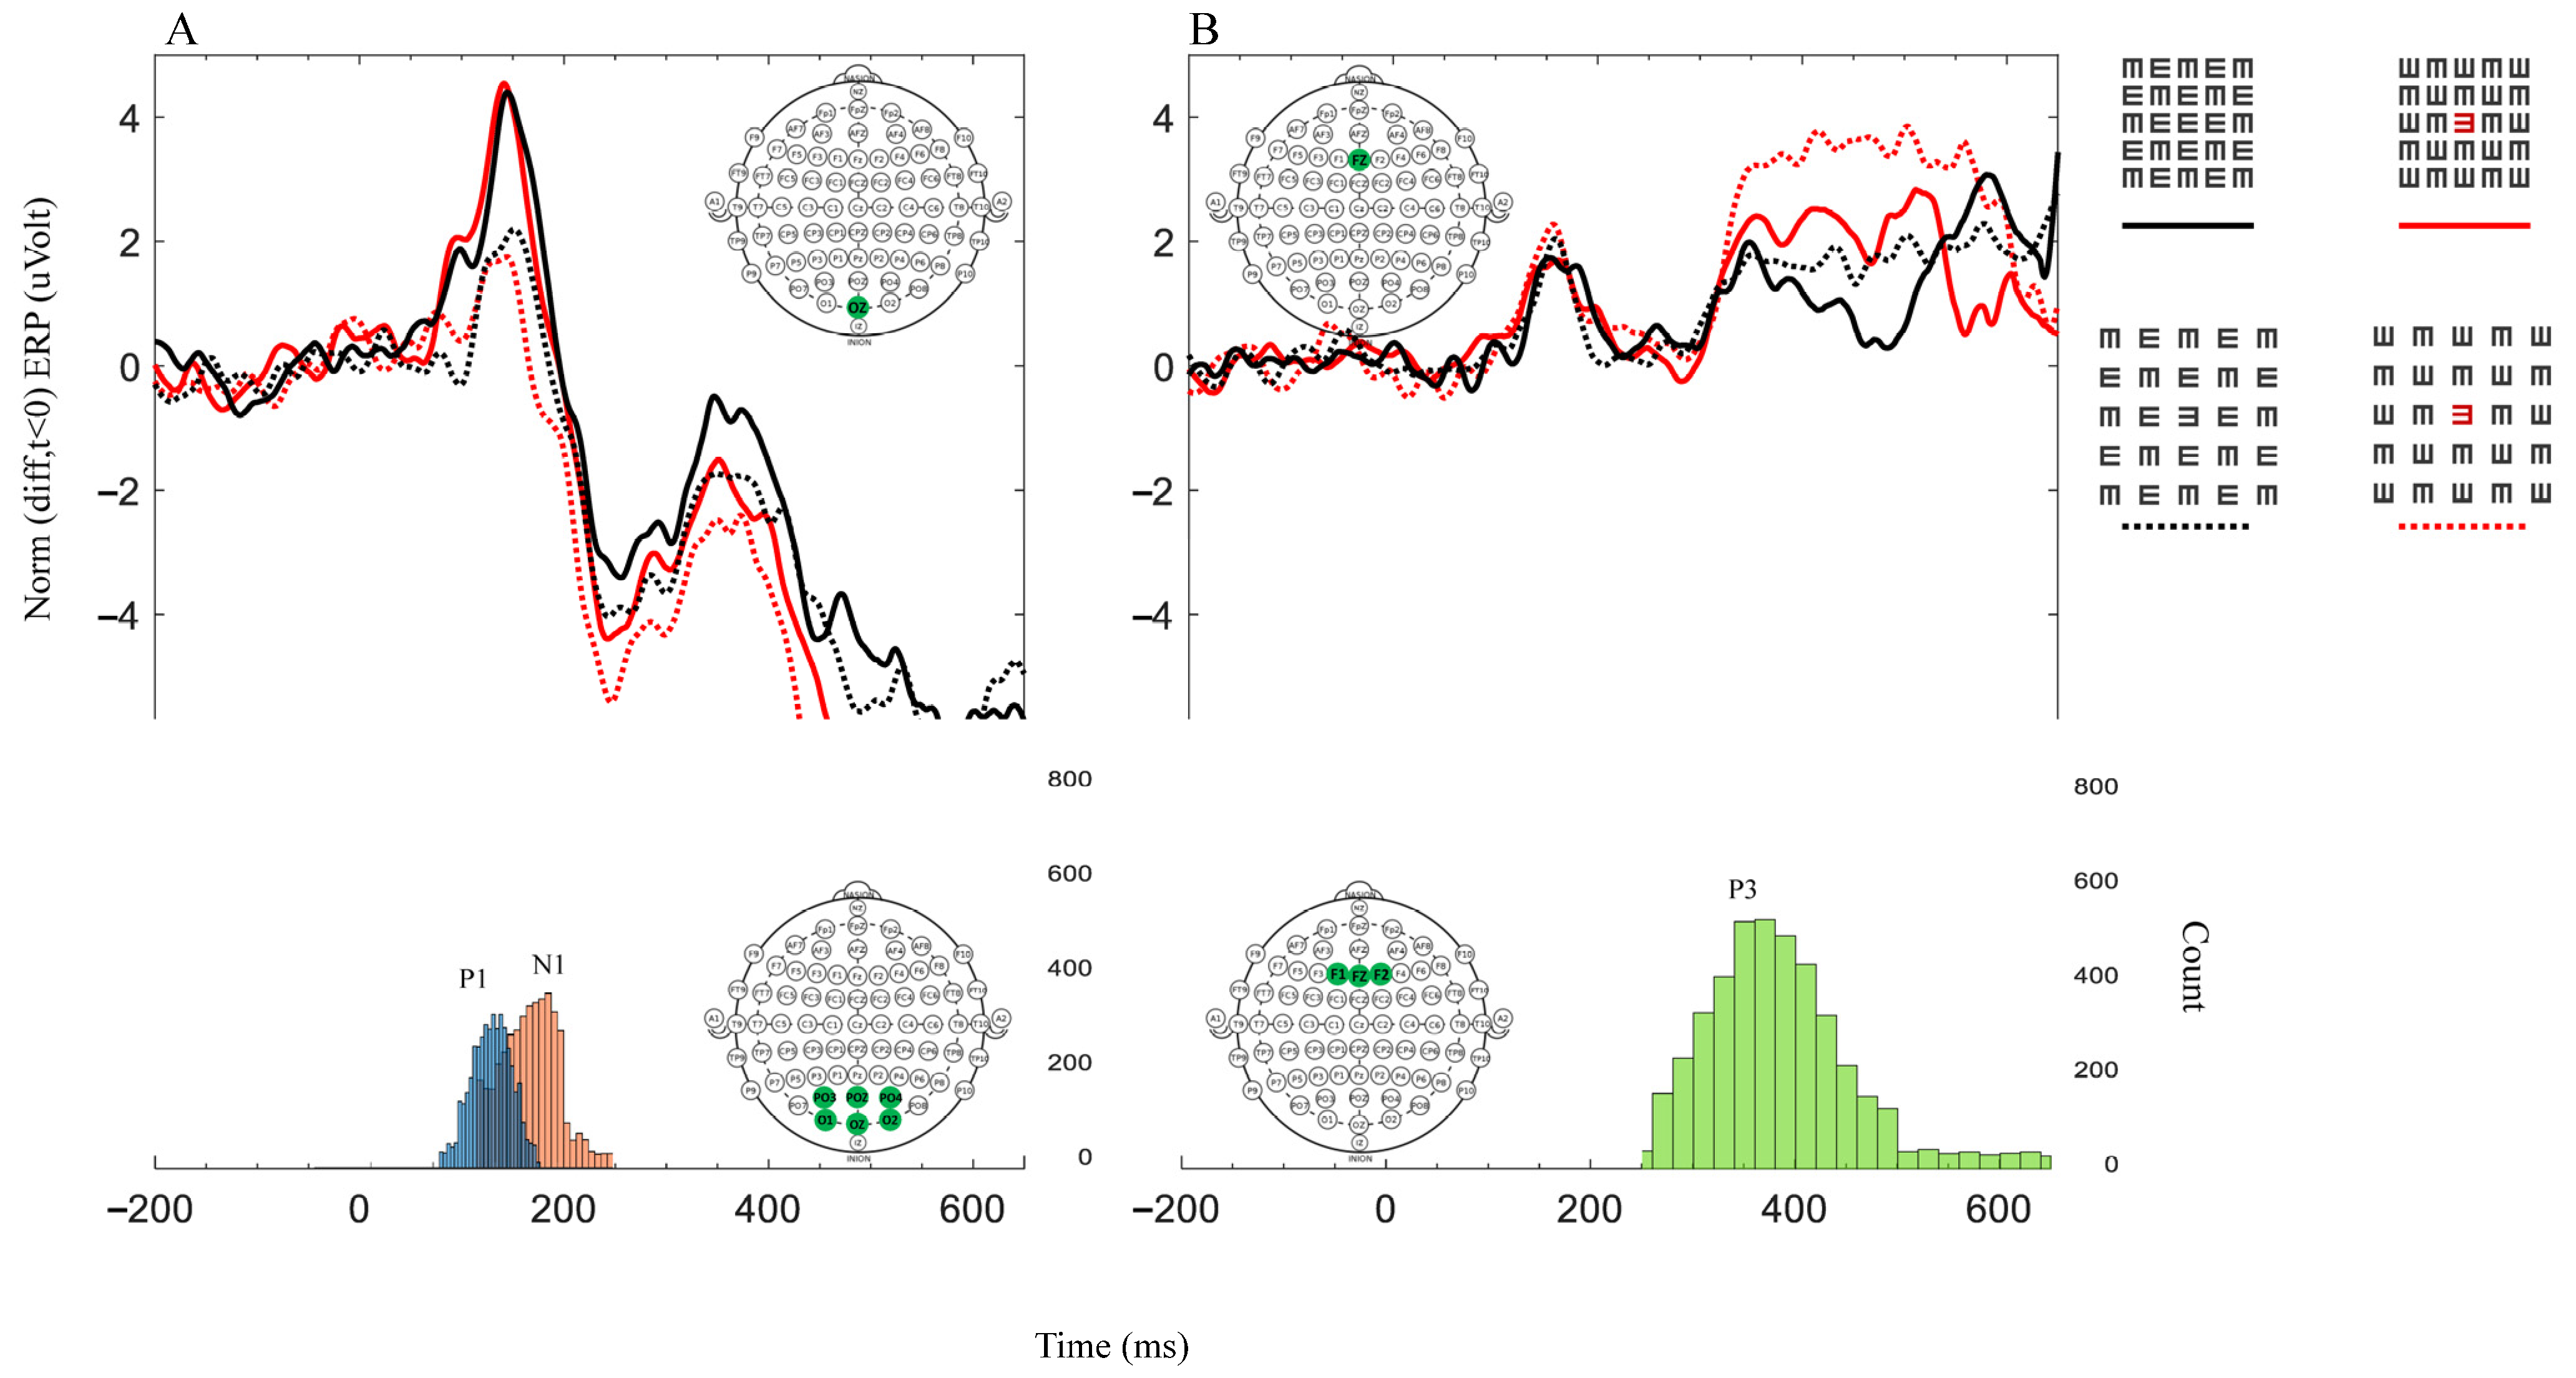
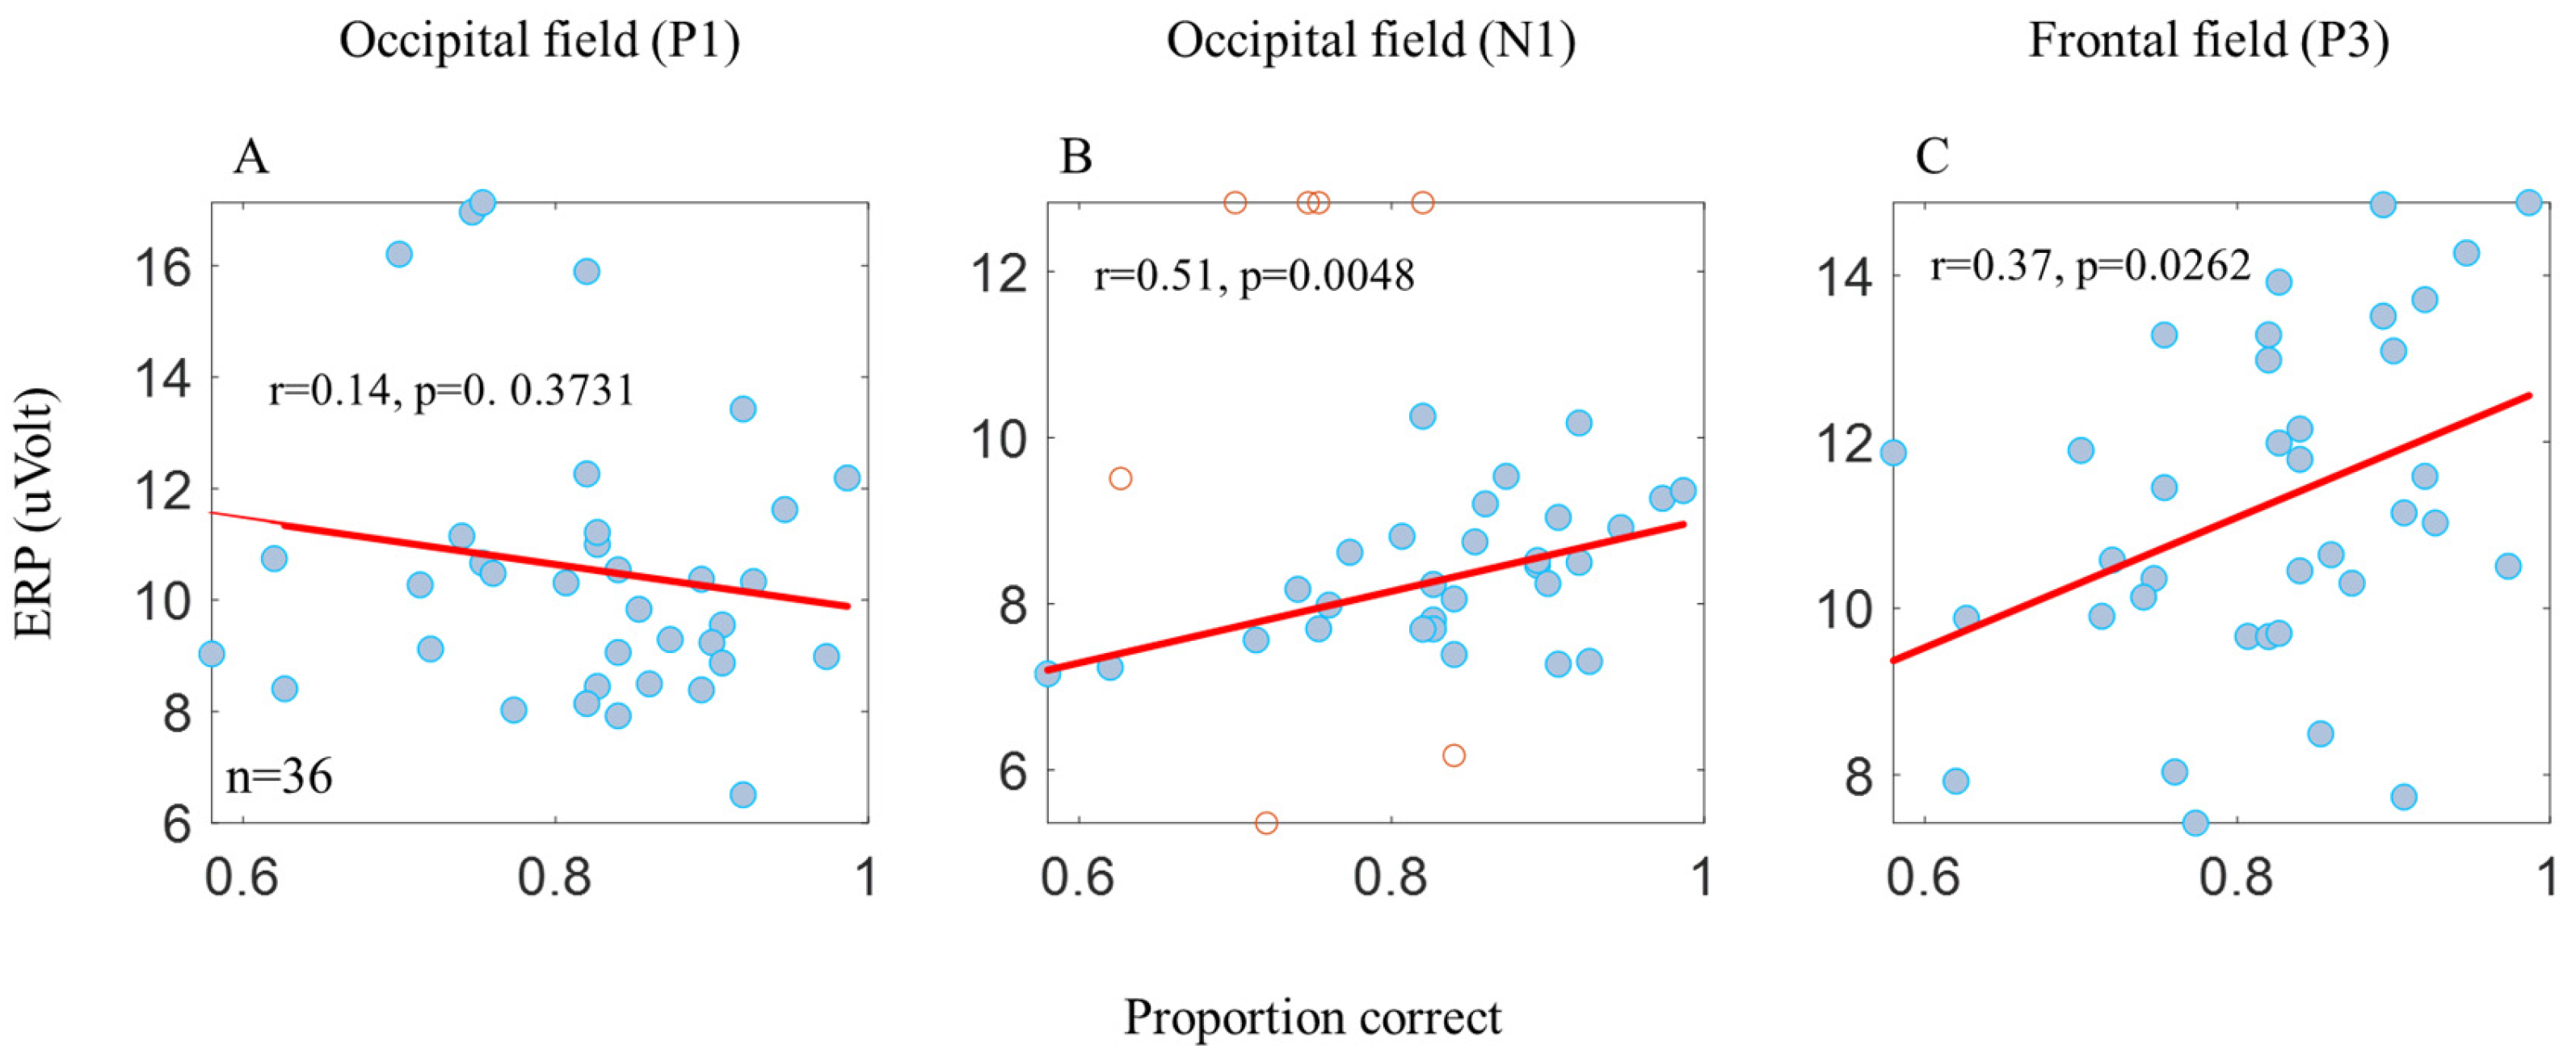
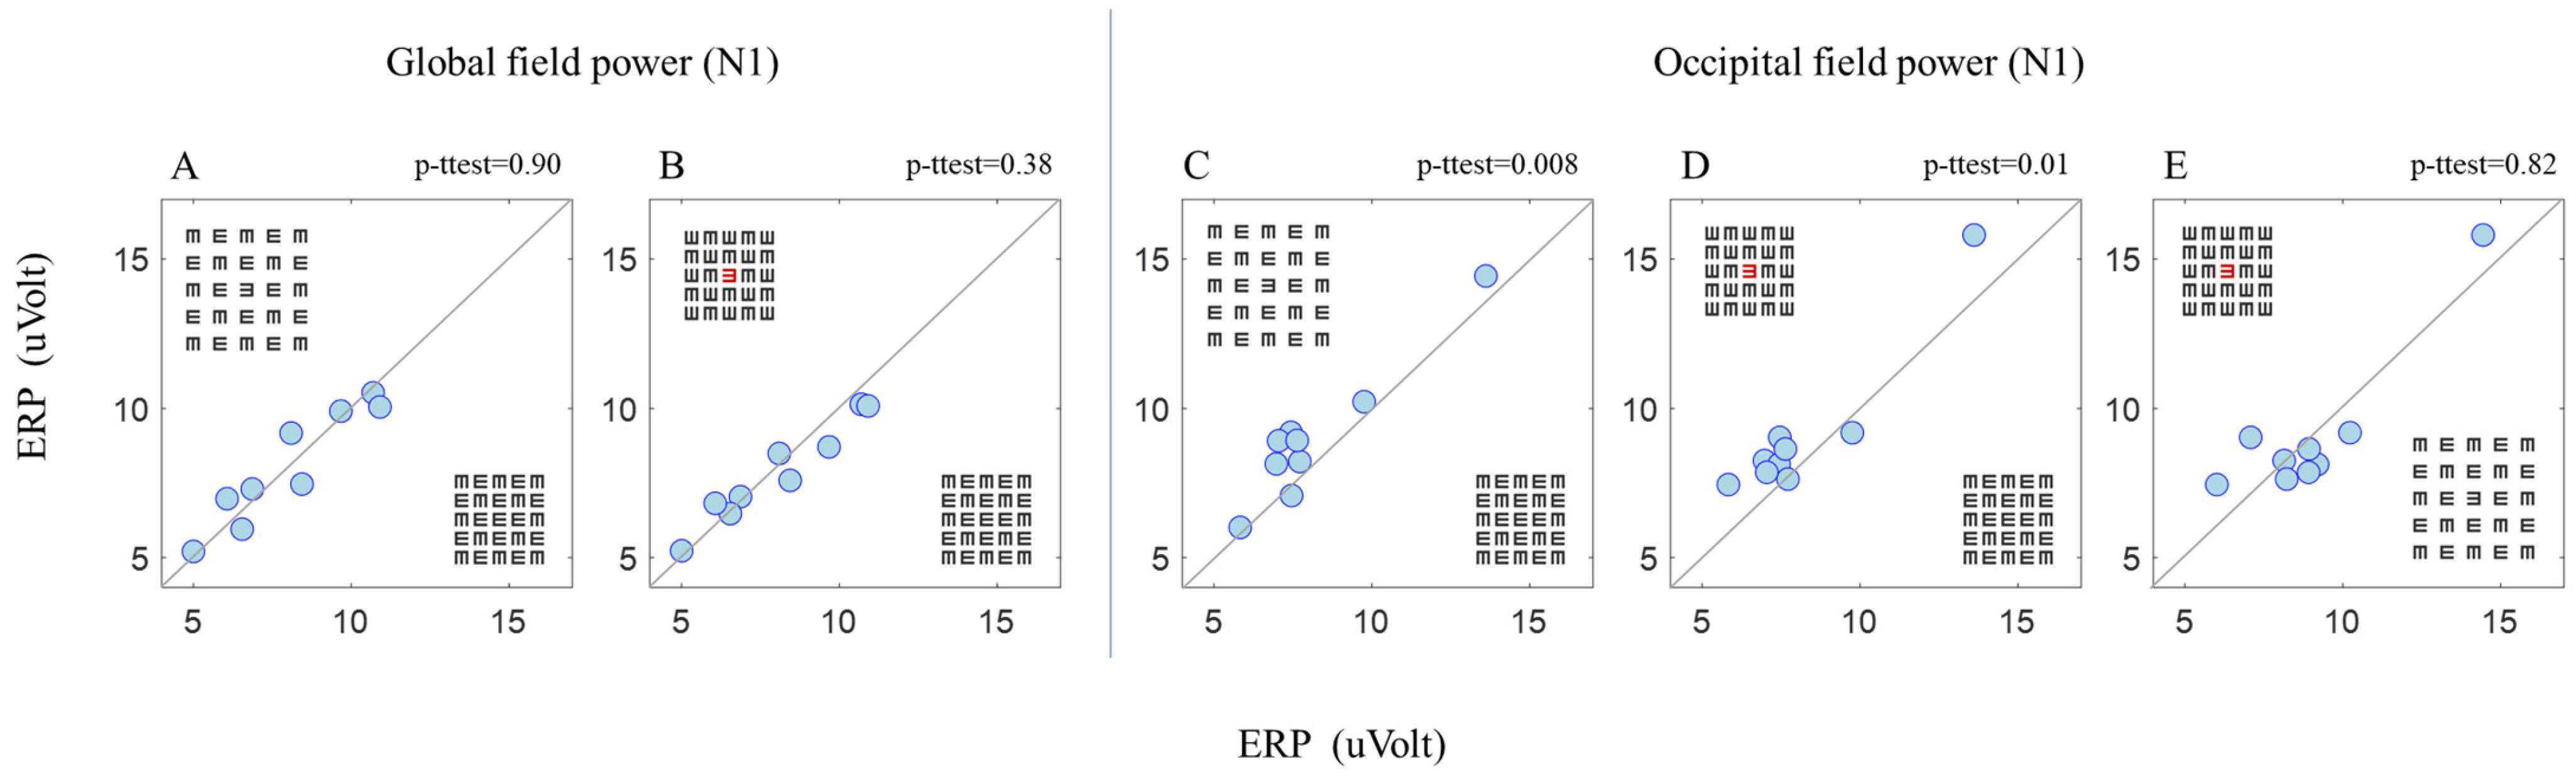
3.2. ERP
4. Discussion
5. Conclusions
Author Contributions
Funding
Institutional Review Board Statement
Informed Consent Statement
Data Availability Statement
Acknowledgments
Conflicts of Interest
References
- Cicchini, G.M.; D’errico, G.; Burr, D.C. Crowding results from optimal integration of visual targets with contextual information. Nat. Commun. 2022, 13, 5741. [Google Scholar] [CrossRef]
- Levi, D.M. Crowding—An essential bottleneck for object recognition: A mini-review. Vis. Res. 2008, 48, 635–654. [Google Scholar] [CrossRef]
- Wallis, T.S.; Bex, P.J. Visual Crowding Is Correlated with Awareness. Curr. Biol. 2011, 21, 254–258. [Google Scholar] [CrossRef]
- Malania, M.; Herzog, M.H.; Westheimer, G. Grouping of contextual elements that affect vernier thresholds. J. Vis. 2007, 7, 1. [Google Scholar] [CrossRef]
- Saarela, T.P.; Sayim, B.; Westheimer, G.; Herzog, M.H. Global stimulus configuration modulates crowding. J. Vis. 2009, 9, 5. [Google Scholar] [CrossRef] [PubMed]
- Sayim, B.; Westheimer, G.; Herzog, M. Gestalt Factors Modulate Basic Spatial Vision. Psychol. Sci. 2010, 21, 641–644. [Google Scholar] [CrossRef] [PubMed]
- Nador, J.; Reeves, A. Crowding expands and is less sensitive to target-flanker differences during a shift of visual attention. Vis. Res. 2023, 212, 108305. [Google Scholar] [CrossRef] [PubMed]
- Banks, W.P.; Larson, D.W.; Prinzmetal, W. Asymmetry of visual interference. Percept. Psychophys. 1979, 25, 447–456. [Google Scholar] [CrossRef] [PubMed]
- Estes, W.K.; Allmeyer, D.H.; Reder, S.M. Serial position functions for letter identification at brief and extended exposure durations. Percept. Psychophys. 1976, 19, 1–15. [Google Scholar] [CrossRef]
- Whitney, D.; Levi, D.M. Visual crowding: A fundamental limit on conscious perception and object recognition. Trends Cogn. Sci. 2011, 15, 160–168. [Google Scholar] [CrossRef] [PubMed]
- Levi, D.M.; Toet, A.; Tripathy, S.P.; Kooi, F.L. The effect of similarity and duration on spatial interaction in peripheral vision. Spat. Vis. 1994, 8, 255–279. [Google Scholar] [CrossRef]
- Põder, E. Effect of colour pop-out on the recognition of letters in crowding conditions. Psychol. Res. 2007, 71, 641–645. [Google Scholar] [CrossRef]
- Reichenthal, A.; Ben-Tov, M.; Ben-Shahar, O.; Segev, R. What pops out for you pops out for fish: Four common visual features. J. Vis. 2019, 19, 1. [Google Scholar] [CrossRef]
- Treisman, A.M.; Gelade, G. A feature-integration theory of attention. Cogn. Psychol. 1980, 12, 97–136. [Google Scholar] [CrossRef]
- Treisman, A.; Souther, J. Search asymmetry: A diagnostic for preattentive processing of separable features. J. Exp. Psychol. Gen. 1985, 114, 285–310. [Google Scholar] [CrossRef]
- Polat, U.; Bonneh, Y.; Sagi, D. Lateral interactions and crowding in amblyopia. J. Vis. 2003, 3, 342. [Google Scholar] [CrossRef]
- Parkes, L.; Lund, J.; Angelucci, A.; Solomon, J.A.; Morgan, M. Compulsory averaging of crowded orientation signals in human vision. Nat. Neurosci. 2001, 4, 739–744. [Google Scholar] [CrossRef]
- Ho, C.; Cheung, S.-H. Crowding by Invisible Flankers. PLoS ONE 2011, 6, e28814. [Google Scholar] [CrossRef] [PubMed]
- Pelli, D.G.; A Tillman, K. The uncrowded window of object recognition. Nat. Neurosci. 2008, 11, 1129–1135. [Google Scholar] [CrossRef] [PubMed]
- He, S.; Cavanagh, P.; Intriligator, J. Attentional resolution and the locus of visual awareness. Nature 1996, 383, 334–337. [Google Scholar] [CrossRef] [PubMed]
- He, S.; Cavanagh, P.; Intriligator, J. Attentional resolution. Trends Cogn. Sci. 1997, 1, 115–121. [Google Scholar] [CrossRef] [PubMed]
- Yeshurun, Y.; Carrasco, M. Attention improves or impairs visual performance by enhancing spatial resolution. Nature 1998, 396, 72–75. [Google Scholar] [CrossRef] [PubMed]
- Yeshurun, Y.; Rashal, E. Precueing attention to the target location diminishes crowding and reduces the critical distance. J. Vis. 2010, 10, 16. [Google Scholar] [CrossRef] [PubMed]
- Strasburger, H.; Harvey, L.O.; Rentschler, I. Contrast thresholds for identification of numeric characters in direct and eccentric view. Percept. Psychophys. 1991, 49, 495–508. [Google Scholar] [CrossRef] [PubMed]
- Spillmann, L. Receptive Fields of Visual Neurons: The Early Years. Perception 2014, 43, 1145–1176. [Google Scholar] [CrossRef]
- Winsler, K.; Grainger, J.; Holcomb, P.J. On letter-specific crowding and reading: Evidence from ERPs. Neuropsychologia 2022, 176, 108396. [Google Scholar] [CrossRef] [PubMed]
- Chen, J.; He, Y.; Zhu, Z.; Zhou, T.; Peng, Y.; Zhang, X.; Fang, F. Attention-Dependent Early Cortical Suppression Contributes to Crowding. J. Neurosci. 2014, 34, 10465–10474. [Google Scholar] [CrossRef]
- Ronconi, L.; Bertoni, S.; Marotti, R.B. The neural origins of visual crowding as revealed by event-related potentials and oscillatory dynamics. Cortex 2016, 79, 87–98. [Google Scholar] [CrossRef]
- Chicherov, V.; Herzog, M.H. Targets but not flankers are suppressed in crowding as revealed by EEG frequency tagging. NeuroImage 2015, 119, 325–331. [Google Scholar] [CrossRef]
- Peng, C.; Hu, C.; Chen, Y. The Temporal Dynamic Relationship Between Attention and Crowding: Electrophysiological Evidence from an Event-Related Potential Study. Front. Neurosci. 2018, 12, 844. [Google Scholar] [CrossRef]
- Siman-Tov, Z.; Lev, M.; Polat, U. Binocular summation is affected by crowding and tagging. Sci. Rep. 2021, 11, 4843. [Google Scholar] [CrossRef]
- Lev, M.; Yehezkel, O.; Polat, U. Uncovering foveal crowding? Sci. Rep. 2015, 4, 4067. [Google Scholar] [CrossRef]
- Lev, M.; Polat, U. Space and time in masking and crowding. J. Vis. 2015, 15, 10. [Google Scholar] [CrossRef]
- Chicherov, V.; Plomp, G.; Herzog, M.H. Neural correlates of visual crowding. NeuroImage 2014, 93, 23–31. [Google Scholar] [CrossRef] [PubMed]
- Sterkin, A.; Yehezkel, O.; Polat, U. Learning to be fast: Gain accuracy with speed. Vis. Res. 2012, 61, 115–124. [Google Scholar] [CrossRef] [PubMed]
- Sterkin, A.; Yehezkel, O.; Bonneh, Y.S.; Norcia, A.; Polat, U. Backward masking suppresses collinear facilitation in the visual cortex. Vis. Res. 2009, 49, 1784–1794. [Google Scholar] [CrossRef] [PubMed][Green Version]
- Karni, A.; Sagi, D. Where practice makes perfect in texture discrimination: Evidence for primary visual cortex plasticity. Proc. Natl. Acad. Sci. USA 1991, 88, 4966–4970. [Google Scholar] [CrossRef] [PubMed]
- Isreal, J.B.; Chesney, G.L.; Wickens, C.D.; Donchin, E. P300 and Tracking Difficulty: Evidence for Multiple Resources in Dual-Task Performance. Psychophysiology 1980, 17, 259–273. [Google Scholar] [CrossRef] [PubMed]
- Ritter, W.; Simson, R.; Vaughan, H.G. Event-Related Potential Correlates of Two Stages of Information Processing in Physical and Semantic Discrimination Tasks. Psychophysiology 1983, 20, 168–179. [Google Scholar] [CrossRef] [PubMed]
- Schubö, A.; Schröger, E.; Meinecke, C. Texture segmentation and visual search for pop-out targets: An ERP study. Cogn. Brain Res. 2004, 21, 317–334. [Google Scholar] [CrossRef]
- Wickens, C.D.; Isreal, J.; Donchin, E. The Event Related Cortical Potential as an Index of Task Workload. Proc. Hum. Factors Soc. Annu. Meet. 1977, 21, 282–286. [Google Scholar] [CrossRef]
- Ye, M.; Lyu, Y.; Sclodnick, B.; Sun, H.-J. The P3 Reflects Awareness and Can Be Modulated by Confidence. Front. Neurosci. 2019, 13, 510. [Google Scholar] [CrossRef]
- Koivisto, M.; Revonsuo , A. Event-related brain potential correlates of visual awareness. Neurosci. Biobehav. Rev. 2010, 34, 922–934. [Google Scholar]
- Nieuwenhuis, S.; Aston-Jones, G.; Cohen, J.D. Decision making, the P3, and the locus coeruleus-norepinephrine system. Psychol. Bull. 2005, 131, 510–532. [Google Scholar] [CrossRef] [PubMed]
- Jimenez, M.; Kimchi, R.; Yashar, A. Mixture-modeling approach reveals global and local processes in visual crowding. Sci. Rep. 2022, 12, 6726. [Google Scholar] [CrossRef]
- Siman-Tov, Z.; Lev, M.; Polat, U. Foveal crowding modifies a target’s properties under a brief presentation time. J. Vis. 2024. manuscript under Review. [Google Scholar]
- Crick, F.; Koch, C. Consciousness and neuroscience. Cereb. Cortex 1998, 8, 97–107. [Google Scholar] [CrossRef]
- Yehezkel, O.; Sterkin, A.; Lev, M.; Polat, U. Training on spatiotemporal masking improves crowded and uncrowded visual acuity. J. Vis. 2015, 15, 12. [Google Scholar] [CrossRef] [PubMed]
- Bonneh, Y.S.; Adini, Y.; Polat, U. Contrast sensitivity revealed by microsaccades. J. Vis. 2015, 15, 11. [Google Scholar] [CrossRef] [PubMed]
- Johannes, S.; Münte, T.; Heinze, H.; Mangun, G. Luminance and spatial attention effects on early visual processing. Cogn. Brain Res. 1995, 2, 189–205. [Google Scholar] [CrossRef] [PubMed]
- Luck, S.J. An Introduction to the Event-Related Potential Technique; MIT Press: Cambridge, MA, USA, 2005. [Google Scholar]
- Lakens, D. Sample Size Justification. Collabra Psychol. 2022, 8, 1–28. [Google Scholar] [CrossRef]
- Sayim, B.; Westheimer, G.; Herzog, M.H. Contrast polarity, chromaticity, and stereoscopic depth modulate contextual interactions in vernier acuity. J. Vis. 2008, 8, 12. [Google Scholar] [CrossRef] [PubMed]
- Baylis, G.C.; Driver, J. Visual parsing and response competition: The effect of grouping factors. Percept. Psychophys. 1992, 51, 145–162. [Google Scholar] [CrossRef] [PubMed]
- Blake, R.; Tadin, D.; Sobel, K.V.; Raissian, T.A.; Chong, S.C. Strength of early visual adaptation depends on visual awareness. Proc. Natl. Acad. Sci. USA 2006, 103, 4783–4788. [Google Scholar] [CrossRef] [PubMed]
- Flom, M.C.; Heath, G.G.; Takahashi, E. Contour Interaction and Visual Resolution: Contralateral Effects. Science 1963, 142, 979–980. [Google Scholar] [CrossRef] [PubMed]
- Chakravarthi, R.; Cavanagh, P. Temporal properties of the polarity advantage effect in crowding. J. Vis. 2007, 7, 11. [Google Scholar] [CrossRef]
- Doo, W.K.; Kweon, S.L. The Ten Twenty Electrode System: International Federation of Societies for Electroencephalography and Clinical Neurophysiology. Am. J. EEG Technol. 1961, 1, 13–19. [Google Scholar]
- Poletti, M.; Rucci, M.; Carrasco, M. Selective attention within the foveola. Nat. Neurosci. 2017, 20, 1413–1417. [Google Scholar] [CrossRef]


| A | ||||
|---|---|---|---|---|
| Proportion correct | ||||
| Source of Variation | df | F | p-value | Effect Size |
| Sample (dense vs. spacious) | 1 | 30.0193 | 0.0000 | 0.45 (large) |
| Columns (black vs. red) | 1 | 17.8622 | 0.0002 | 0.33 (large) |
| Interaction (density and color) | 1 | 1.6663 | 0.2050 | |
| Within | 36 | |||
| Total | 39 | |||
| B | ||||
| Reaction time (Log) | ||||
| Source of Variation | df | F | p-value | Effect Size |
| Sample (dense vs. spacious) | 1 | 15.1317 | 0.0004 | 0.3 (large) |
| Columns (black vs. red) | 1 | 19.6670 | 0.0001 | 0.35 (large) |
| Interaction (density and color) | 1 | 0.2171 | 0.6441 | |
| Within | 36 | |||
| Total | 39 | |||
| A | ||||
|---|---|---|---|---|
| Pl (Occipital) | ||||
| Source of Variation | df | F | p-value | Effect Size |
| Sample (dense vs. spacious) | 1 | 6.2978 | 0.0173 | 0.16 (large) |
| Columns (black vs. red) | 1 | 0.0514 | 0.8220 | |
| Interaction (density and color) | 1 | 0.4730 | 0.4965 | |
| Within | 32 | |||
| Total | 35 | |||
| B | ||||
| Nl (Occipital) | ||||
| Source of Variation | df | F | p-value | Effect Size |
| Sample (dense vs. spacious) | 1 | 10.8759 | 0.0024 | 0.25 (large) |
| Columns (black vs. red) | 1 | 14.4843 | 0.0006 | 0.31 (large) |
| Interaction (density and color) | 1 | 2.1420 | 0.1531 | |
| Within | 32 | |||
| Total | 35 | |||
| C | ||||
| Nl (Global field) | ||||
| Source of Variation | df | F | p-value | |
| Sample (dense vs. spacious) | 1 | 0.8967 | 0.3508 | |
| Columns (black vs. red) | 1 | 0.6066 | 0.4418 | |
| Interaction (density and color) | 1 | 0.5173 | 0.4772 | |
| Within | 32 | |||
| Total | 35 | |||
Disclaimer/Publisher’s Note: The statements, opinions and data contained in all publications are solely those of the individual author(s) and contributor(s) and not of MDPI and/or the editor(s). MDPI and/or the editor(s) disclaim responsibility for any injury to people or property resulting from any ideas, methods, instructions or products referred to in the content. |
© 2024 by the authors. Licensee MDPI, Basel, Switzerland. This article is an open access article distributed under the terms and conditions of the Creative Commons Attribution (CC BY) license (https://creativecommons.org/licenses/by/4.0/).
Share and Cite
Siman-Tov, Z.; Lev, M.; Polat, U. Probing the Bottleneck of Awareness Formed by Foveal Crowding: A Neurophysiological Study. Brain Sci. 2024, 14, 169. https://doi.org/10.3390/brainsci14020169
Siman-Tov Z, Lev M, Polat U. Probing the Bottleneck of Awareness Formed by Foveal Crowding: A Neurophysiological Study. Brain Sciences. 2024; 14(2):169. https://doi.org/10.3390/brainsci14020169
Chicago/Turabian StyleSiman-Tov, Ziv, Maria Lev, and Uri Polat. 2024. "Probing the Bottleneck of Awareness Formed by Foveal Crowding: A Neurophysiological Study" Brain Sciences 14, no. 2: 169. https://doi.org/10.3390/brainsci14020169
APA StyleSiman-Tov, Z., Lev, M., & Polat, U. (2024). Probing the Bottleneck of Awareness Formed by Foveal Crowding: A Neurophysiological Study. Brain Sciences, 14(2), 169. https://doi.org/10.3390/brainsci14020169