
Using Automated Speech Processing for Repeated Measurements in a Clinical Setting of the Behavioral Variability in the Stroop Task
 , ,
, ,
Abstract
1. Introduction
2. Materials and Methods
2.1. Participants
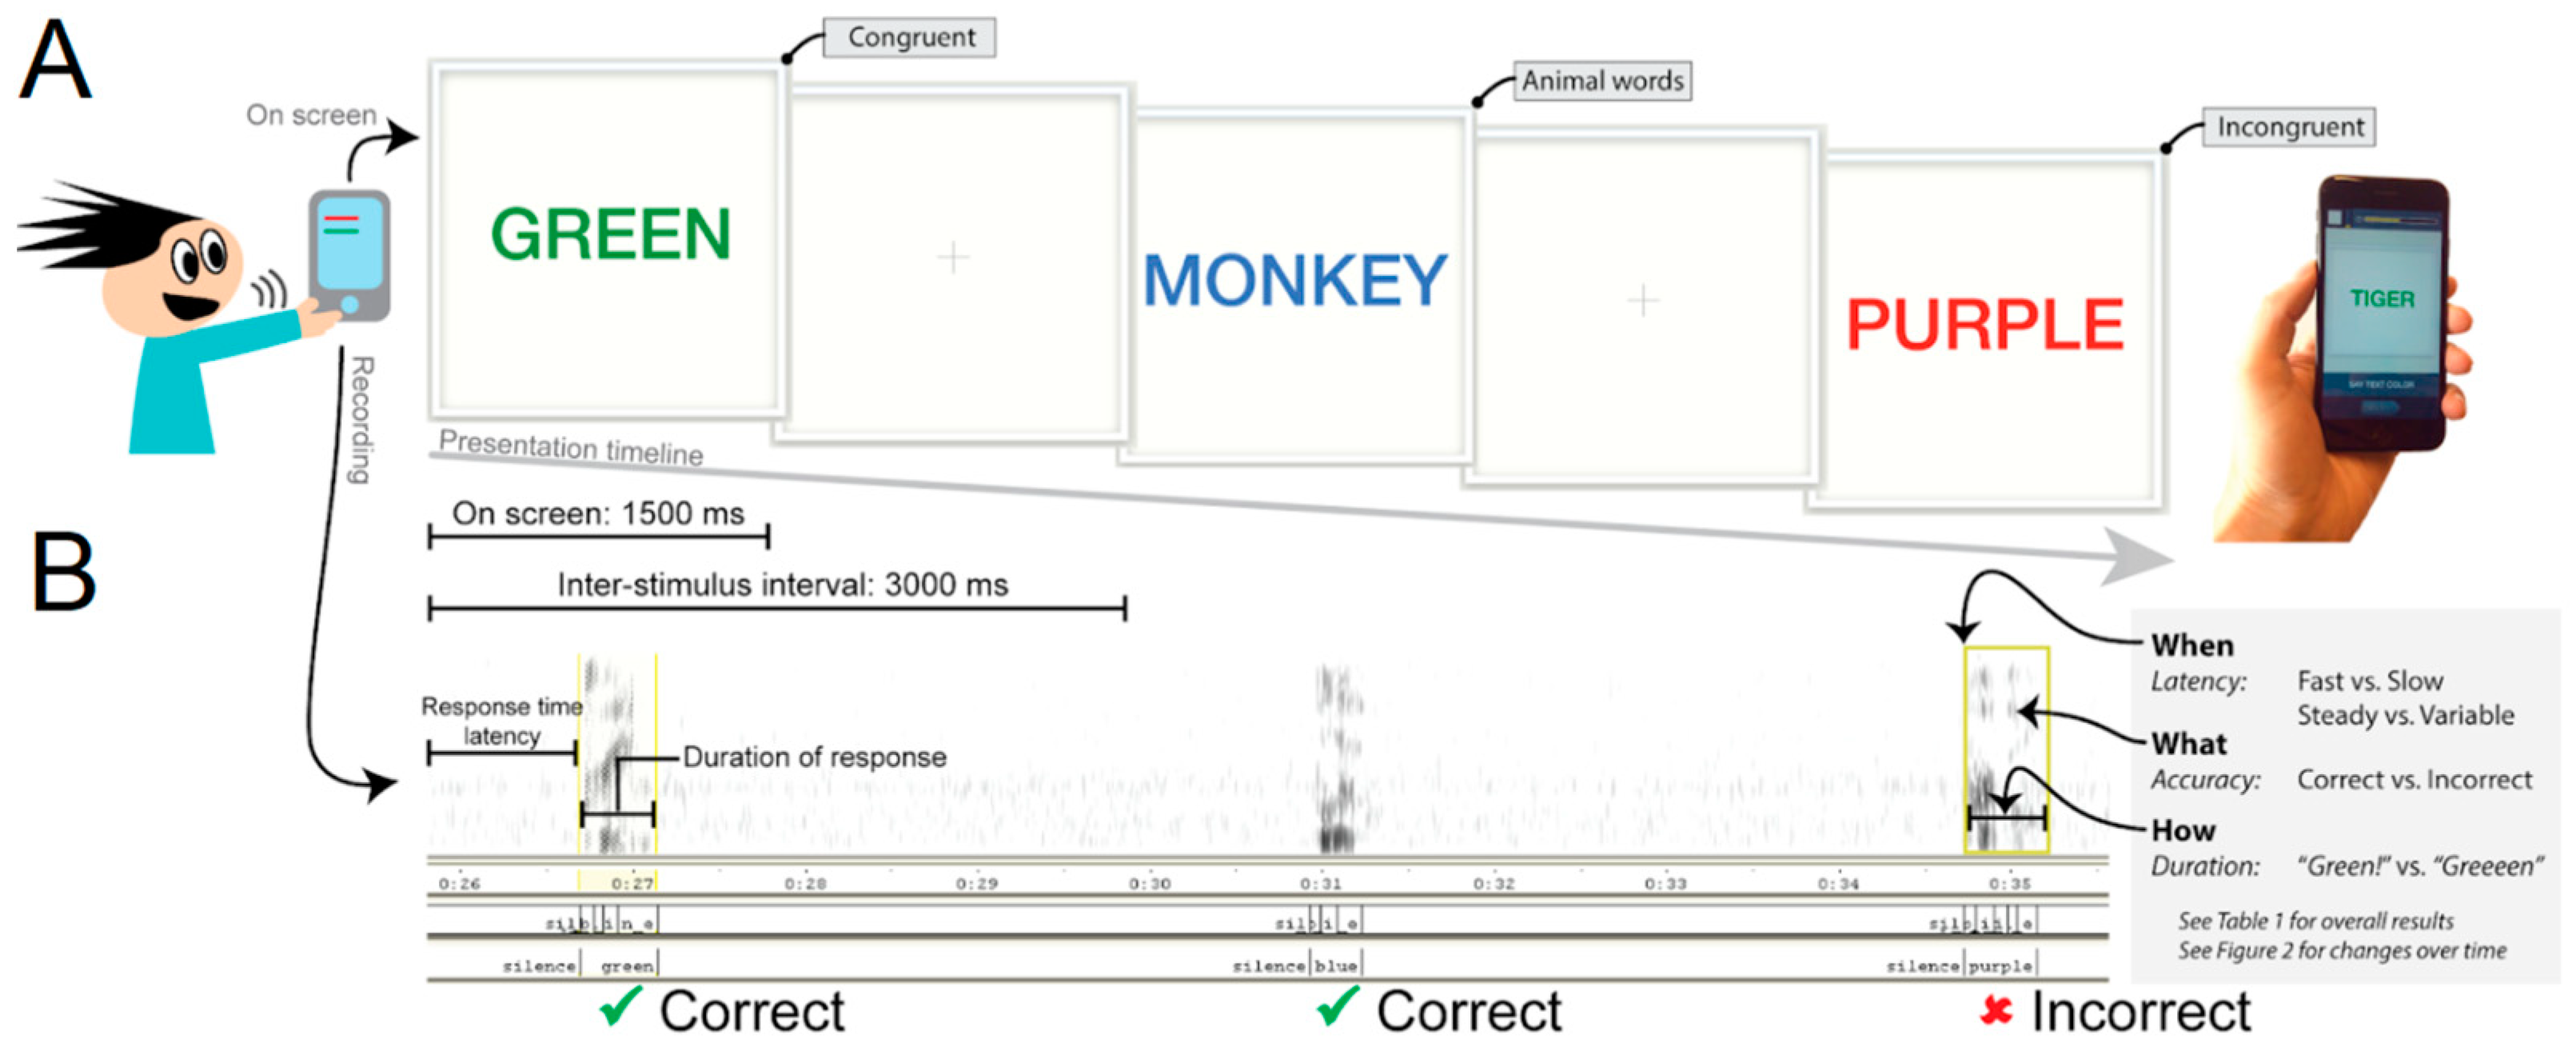
2.2. Procedure
2.3. Clinical and Functioning Measures
2.4. Analysis
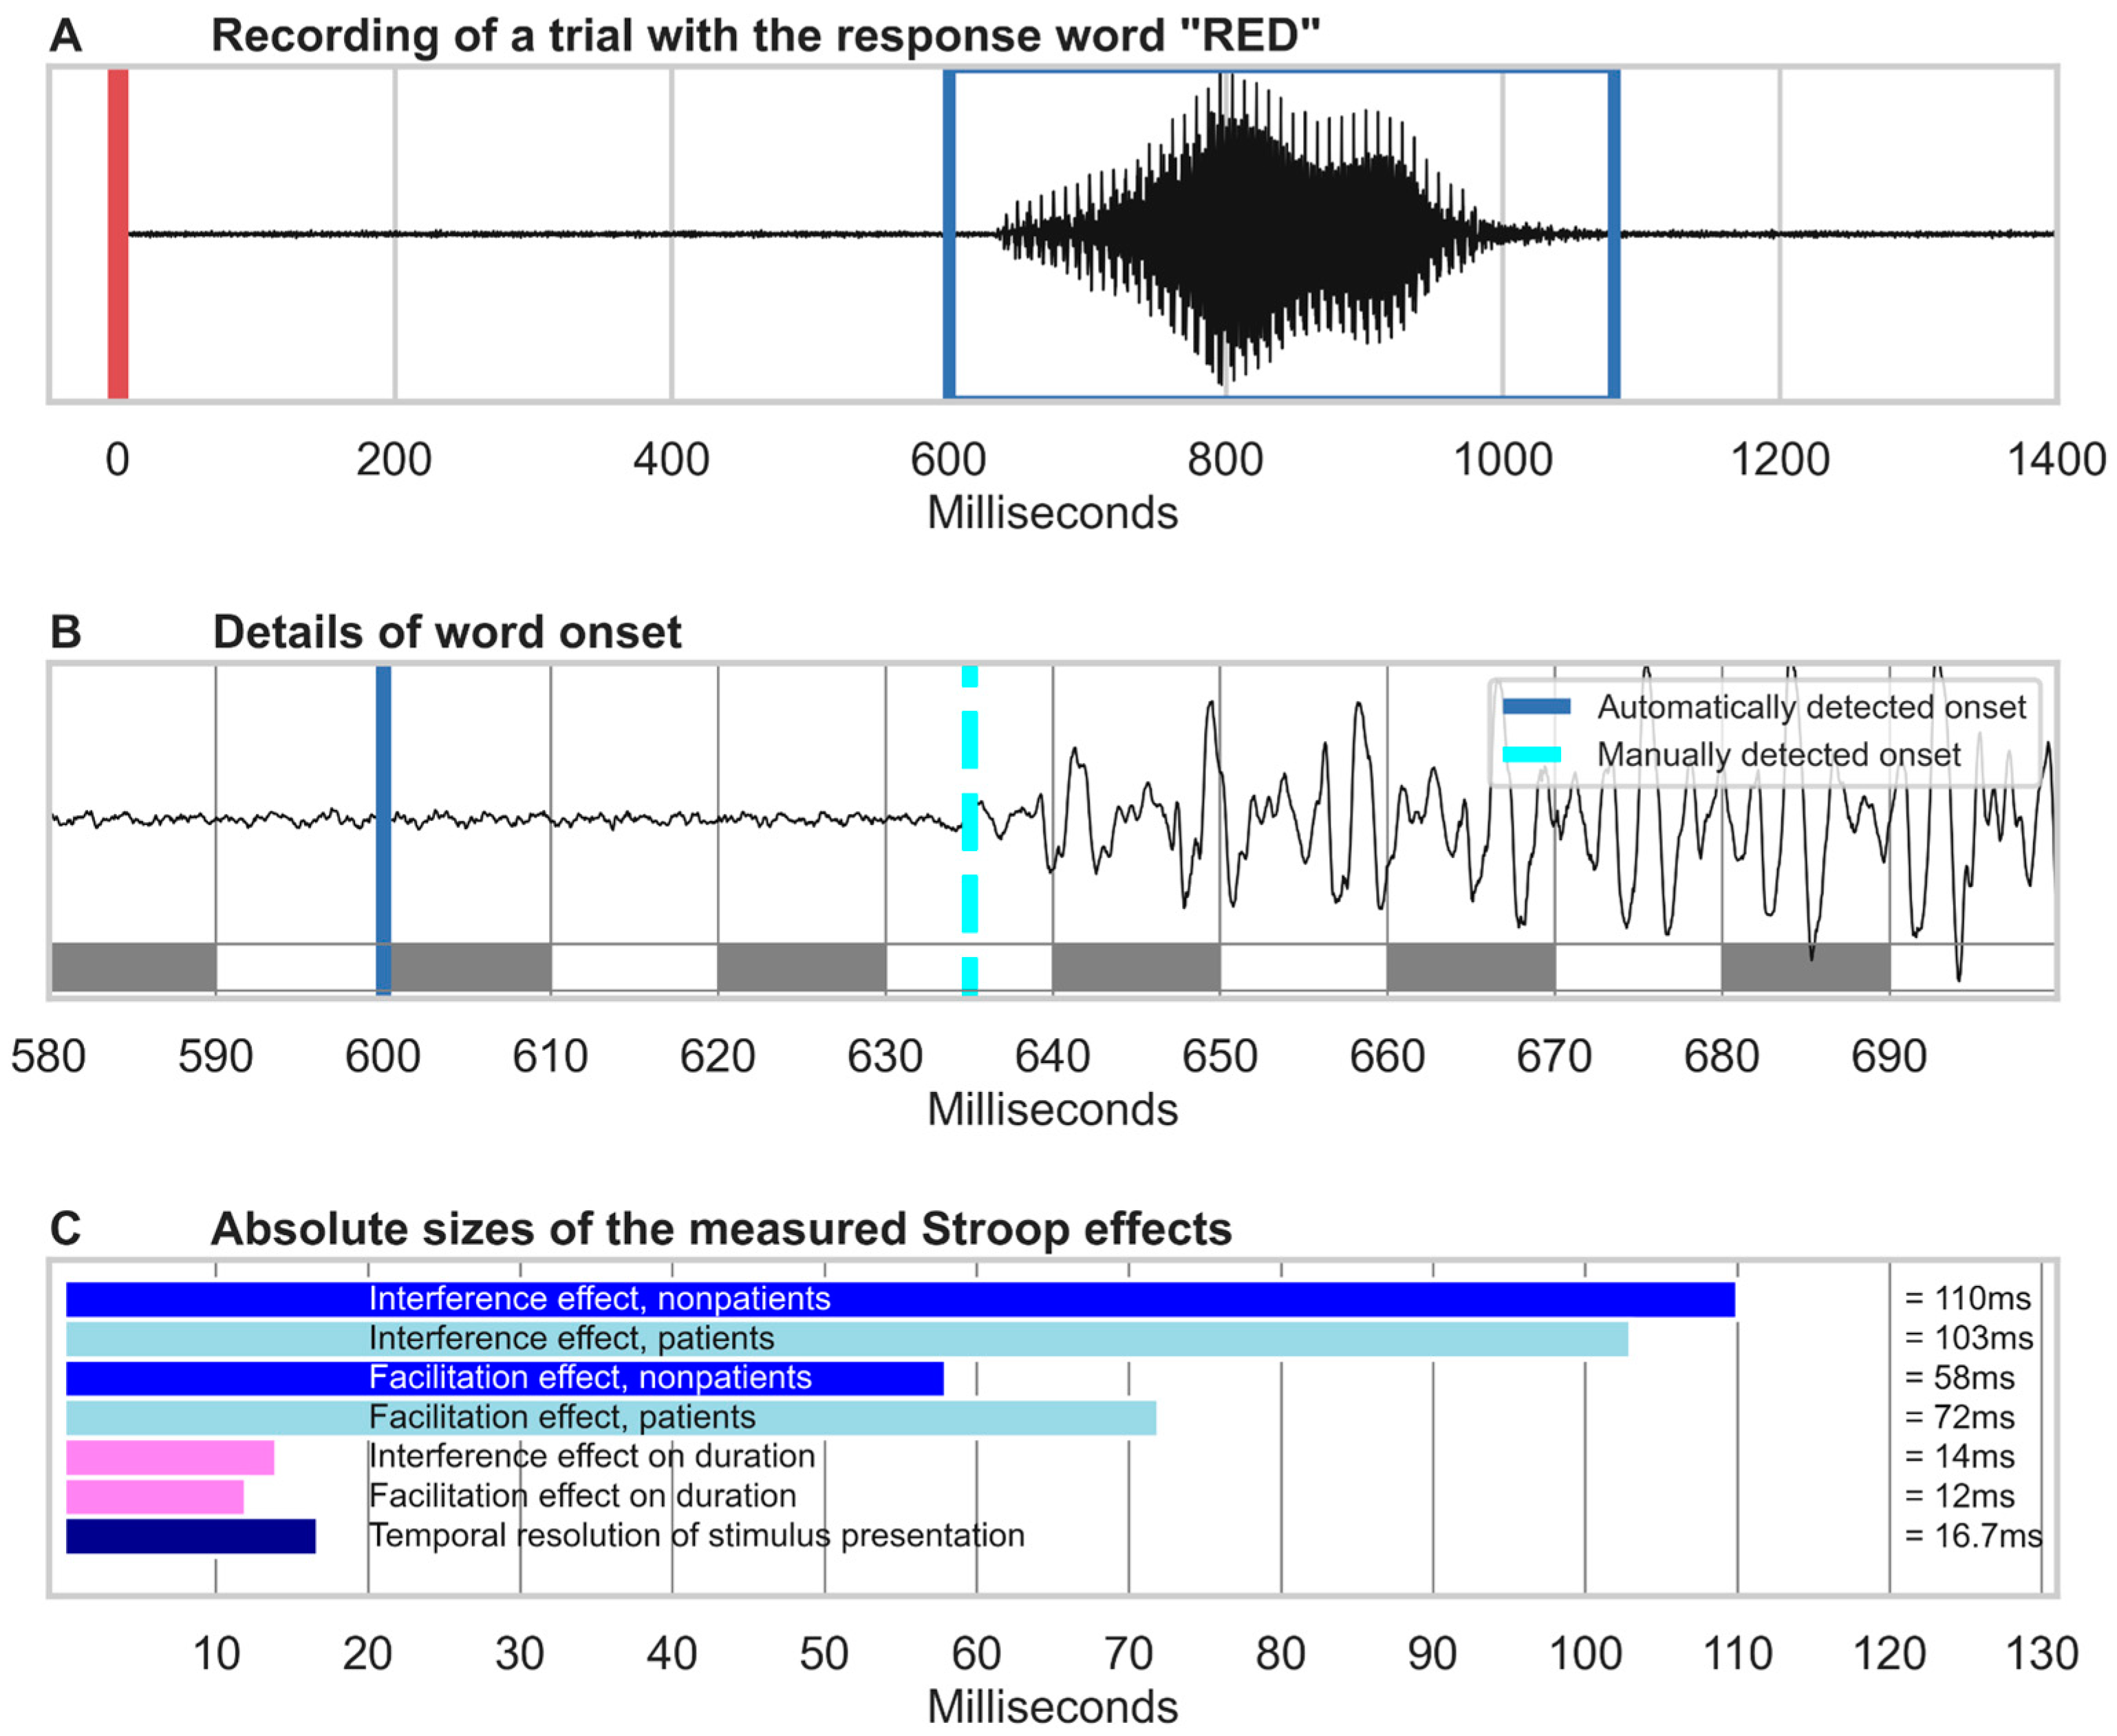
2.4.1. Speech Recognition
2.4.2. Performance Analysis
2.4.3. Statistical Methods
3. Results
3.1. Data Considerations
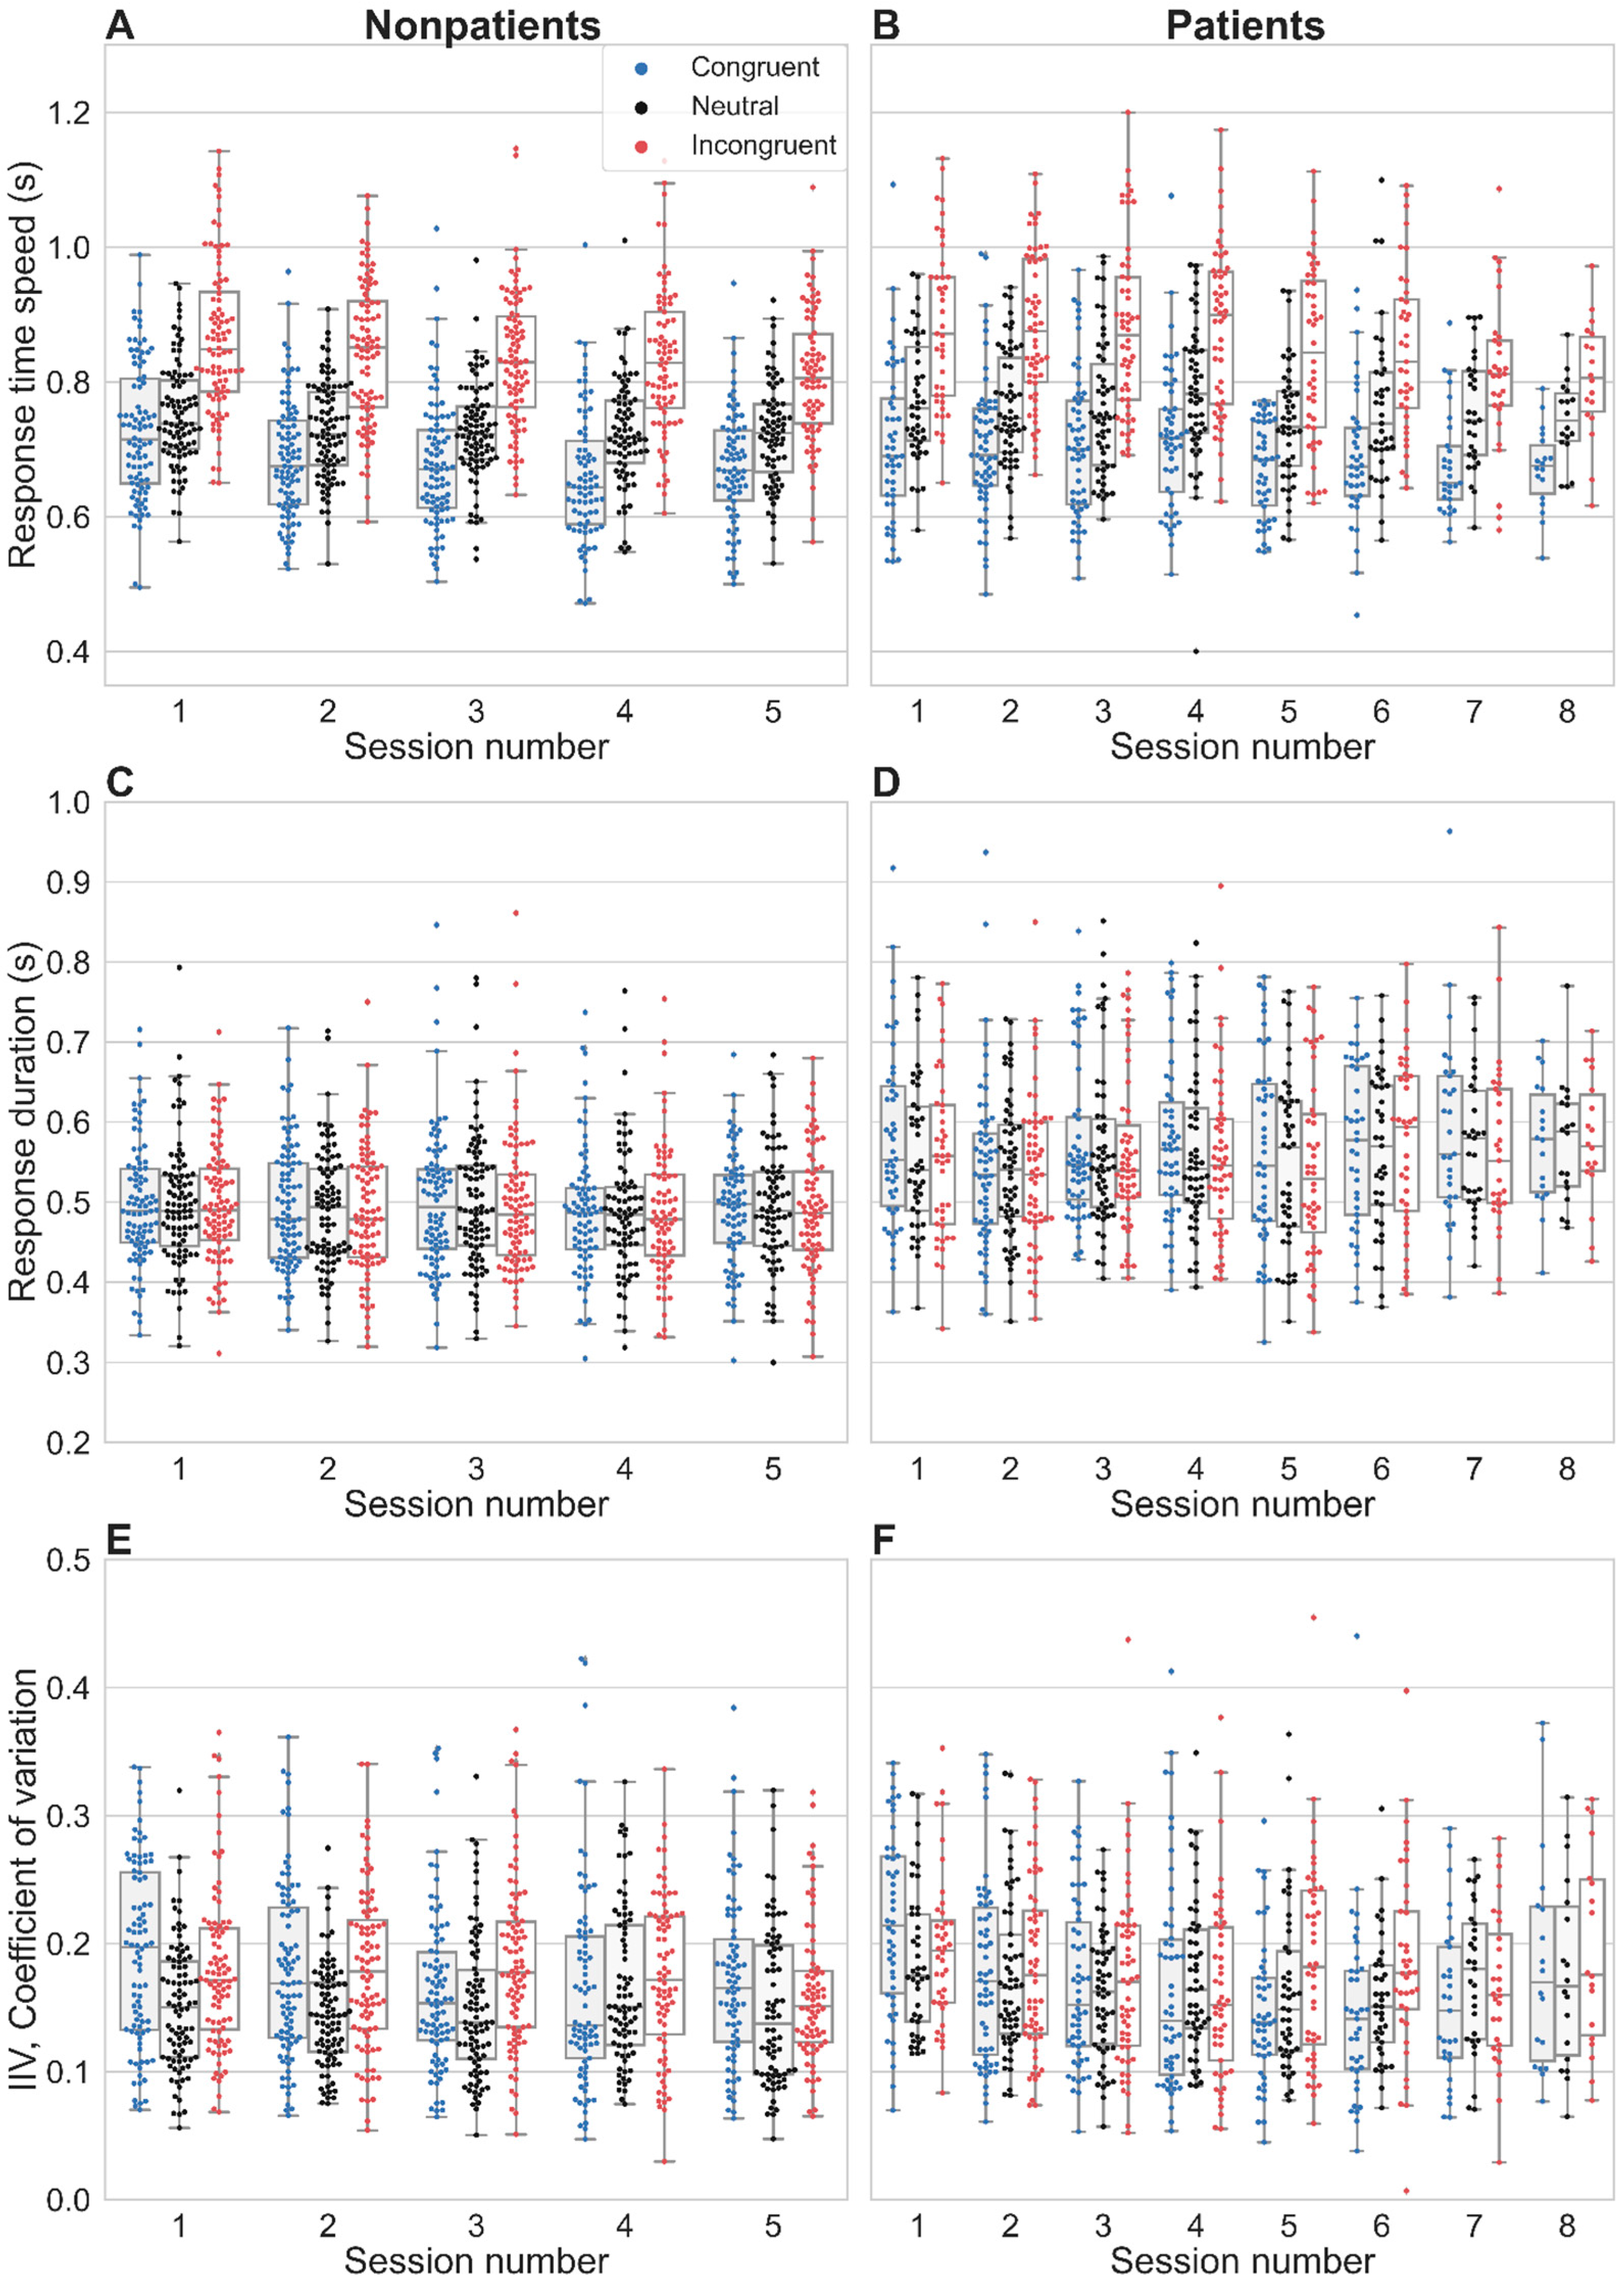
3.2. Stroop Interference and Facilitation on Response Time Latency
3.3. Temporal Properties
3.4. Convergence with Clinical Symptoms Rating Scales
3.5. Convergence with Self-Reported Concentration and Helplessness
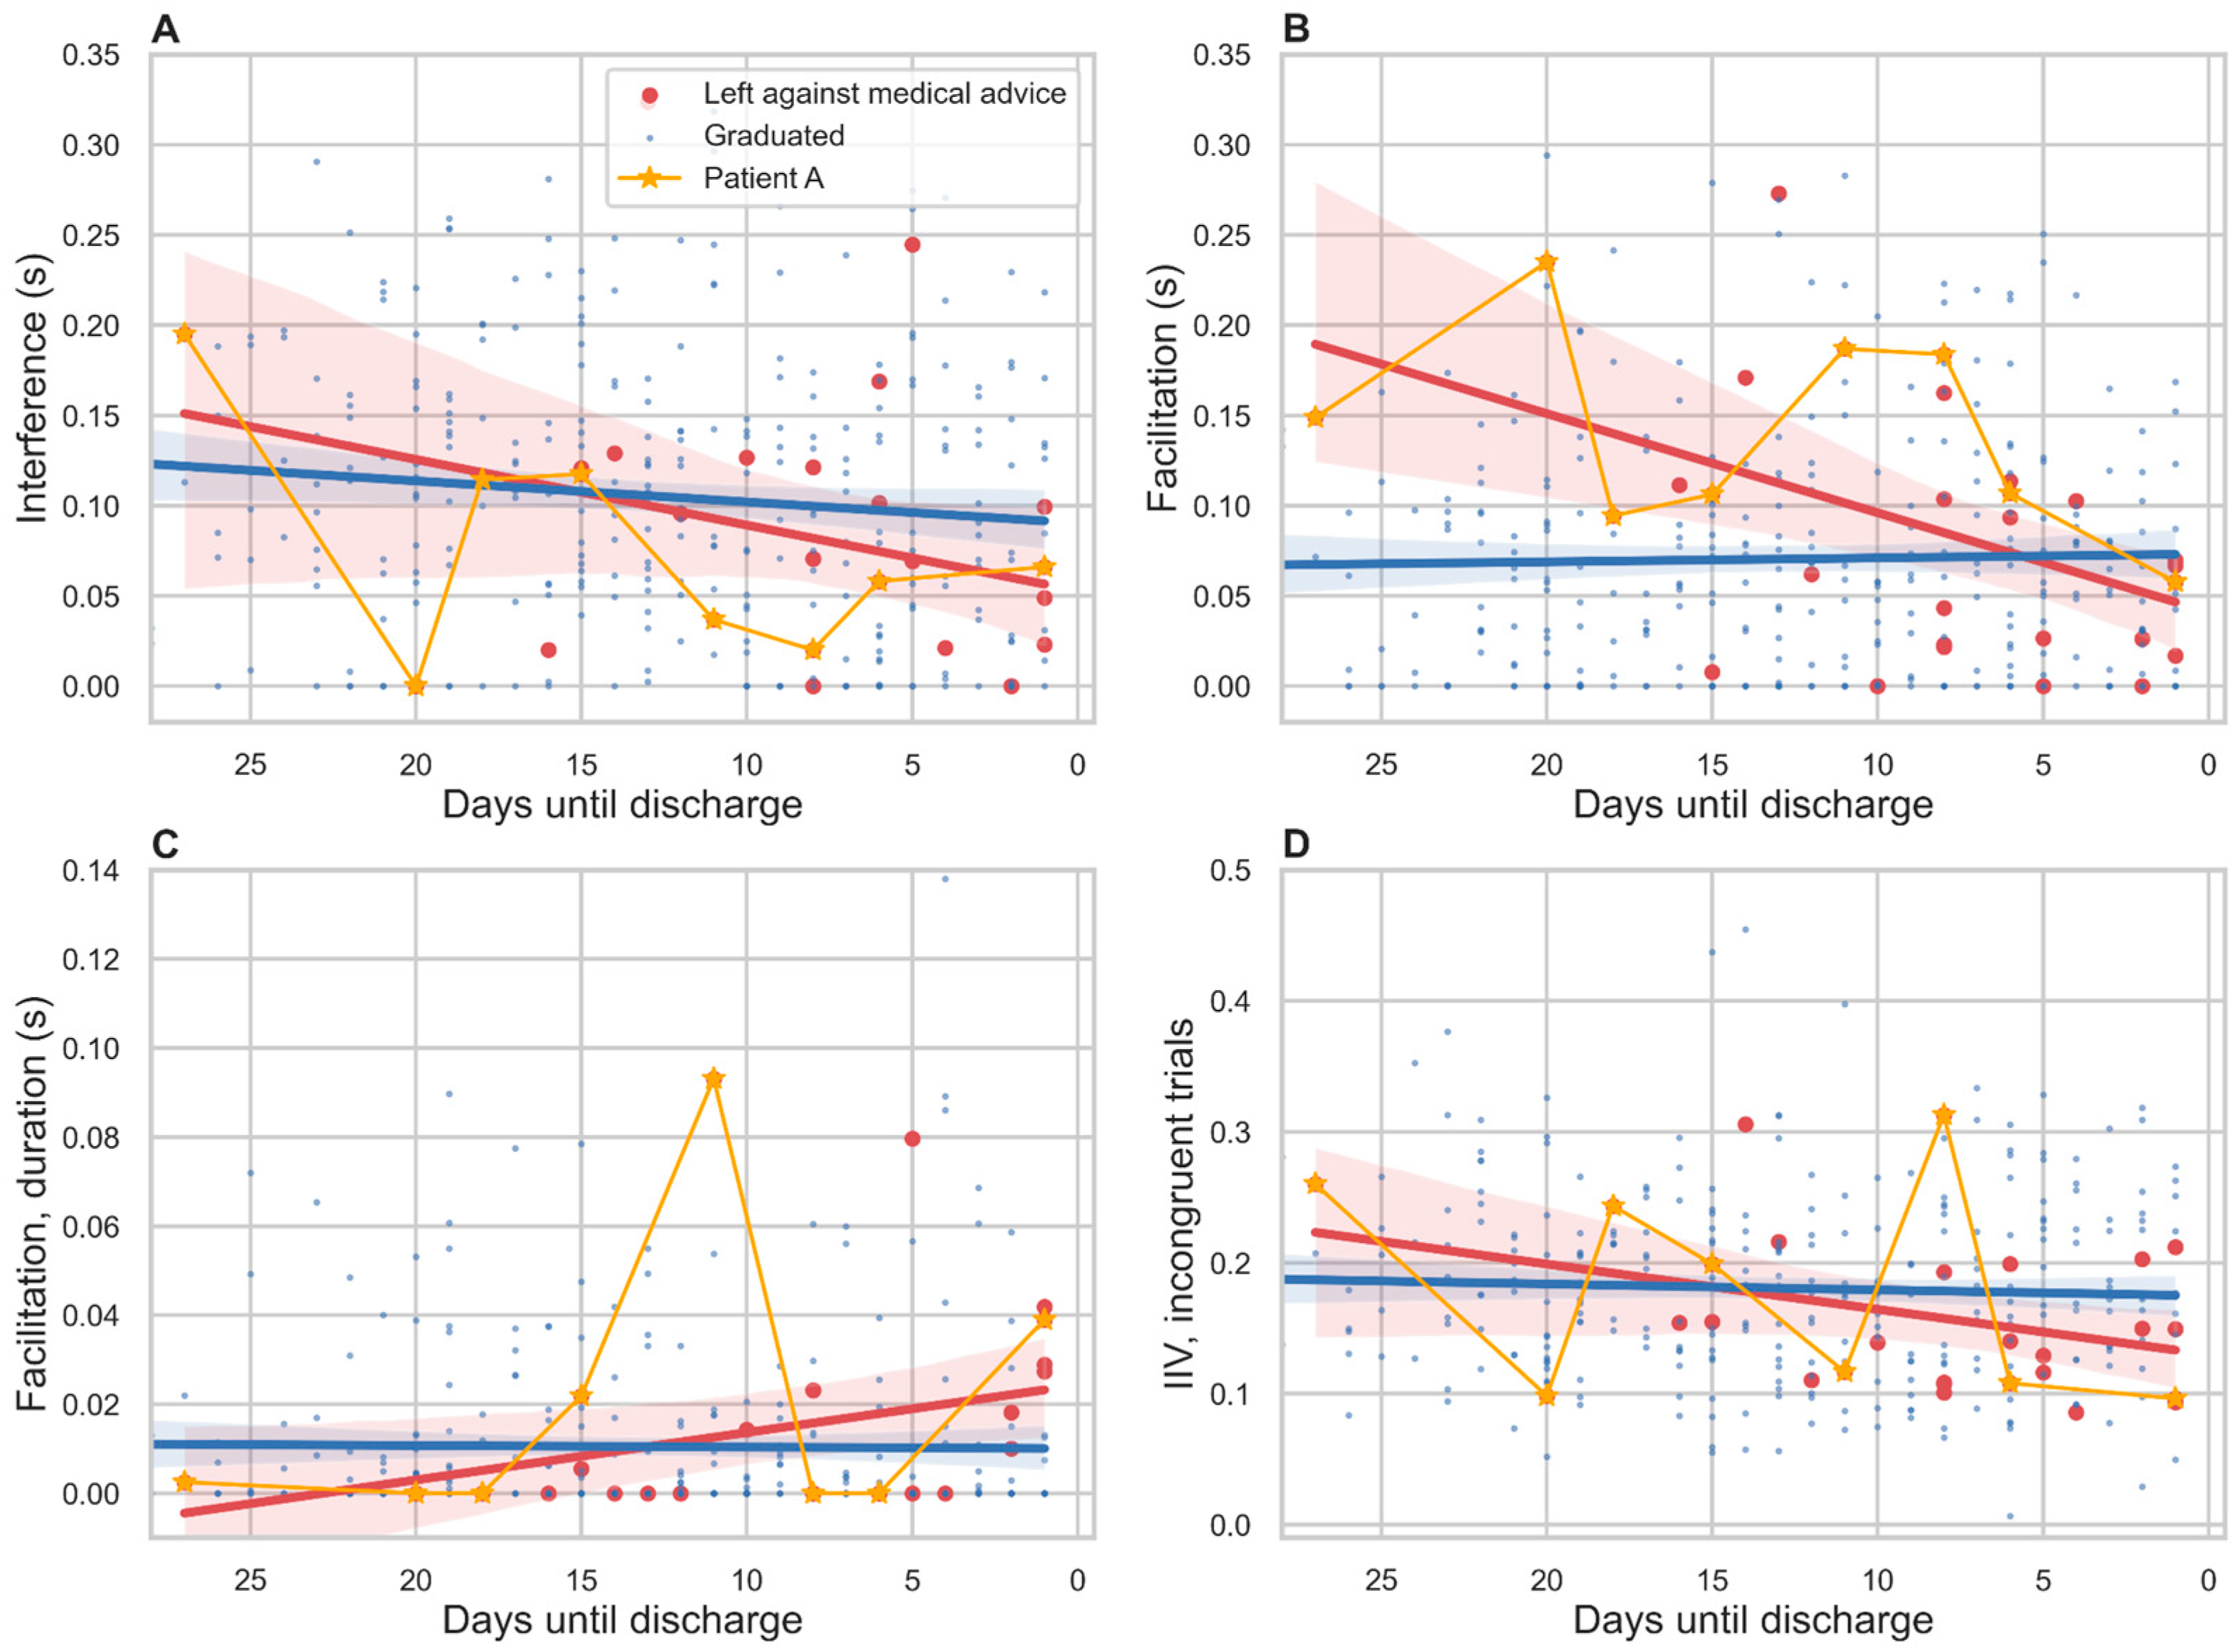
3.6. Relation to Treatment Outcome
3.7. Response Duration
3.8. Intra-Individual Variability
4. Discussion
4.1. Constraints on the Temporal Resolution of Automated Speech Analysis
4.2. Future Improvements
5. Conclusions
Supplementary Materials
Author Contributions
Funding
Institutional Review Board Statement
Informed Consent Statement
Data Availability Statement
Acknowledgments
Conflicts of Interest
References
- Stroop, J.R. Studies of interference in serial verbal reactions. J. Exp. Psychol. Gen. 1935, 18, 643–662. [Google Scholar] [CrossRef]
- MacLeod, C.M. Half a century of research on the Stroop effect: An integrative review. Psychol. Bull. 1991, 109, 163–203. [Google Scholar] [CrossRef]
- MacLeod, C.M. The Stroop task: The “gold standard” of attentional measures. J. Exp. Psychol. Gen. 1992, 121, 12–14. [Google Scholar] [CrossRef]
- Williams, J.M.; Mathews, A.; MacLeod, C. The Emotional Stroop Task and psychopathology. Psychol. Bull. 1996, 122, 3–24. [Google Scholar] [CrossRef] [PubMed]
- Watts, F.; McKenna, F.; Sharrock, R.; Trezise, L. Colour naming of phobia-related words. Br. J. Psychol. 1986, 77, 97–108. [Google Scholar] [CrossRef]
- Pal, R.; Mendelson, J.; Clavier, O.; Baggott, M.J.; Coyle, J.; Galloway, G.P. Development and Testing of a Smartphone-Based Cognitive/Neuropsychological Evaluation System for Substance Abusers. J. Psychoact. Drugs 2016, 48, 288–294. [Google Scholar] [CrossRef] [PubMed]
- Henik, A.; Salo, R. Schizophrenia and the Stroop Effect. Behav. Cogn. Neurosci. Rev. 2004, 3, 42–59. [Google Scholar] [CrossRef] [PubMed]
- Westerhausen, R.; Kompus, K.; Hugdahl, K. Impaired cognitive inhibition in schizophrenia: A meta-analysis of the Stroop interference effect. Schizophr. Res. 2011, 133, 172–181. [Google Scholar] [CrossRef]
- Holmlund, T.B.; Foltz, P.W.; Cohen, A.S.; Johansen, H.D.; Sigurdsen, R.; Fugelli, P.; Bergsager, D.; Cheng, J.; Bernstein, J.; Rosenfeld, E.; et al. Moving psychological assessment out of the controlled laboratory setting: Practical challenges. Psychol. Assess. 2019, 31, 292–303. [Google Scholar] [CrossRef]
- Cohen, A.S.; Schwartz, E.; Le, T.; Cowan, T.; Cox, C.; Tucker, R.; Foltz, P.; Holmlund, T.B.; Elvevåg, B. Validating digital phenotyping technologies for clinical use: The critical importance of “resolution”. World Psychiatry 2020, 19, 114–115. [Google Scholar] [CrossRef]
- Cohen, A.S.; Cox, C.R.; Masucci, M.D.; Le, T.P.; Cowan, T.; Coghill, L.M.; Holmlund, T.B.; Elvevåg, B. Digital Phenotyping Using Multimodal Data. Curr. Behav. Neurosci. Rep. 2020, 7, 212–220. [Google Scholar] [CrossRef]
- Gordon, M.; Roettger, T. Acoustic correlates of word stress: A cross-linguistic survey. Linguist. Vanguard 2017, 3, 1–11. [Google Scholar] [CrossRef]
- MacDonald, S.W.S.; Nyberg, L.; Bäckman, L. Intra-individual variability in behavior: Links to brain structure, neurotransmission and neuronal activity. Trends Neurosci. 2006, 29, 474–480. [Google Scholar] [CrossRef] [PubMed]
- Bajaj, J.S.; Heuman, D.M.; Sterling, R.K.; Sanyal, A.J.; Siddiqui, M.; Matherly, S.; Luketic, V.; Stravitz, R.T.; Fuchs, M.; Thacker, L.R.; et al. Validation of EncephalApp, Smartphone-Based Stroop Test, for the Diagnosis of Covert Hepatic Encephalopathy. Clin. Gastroenterol. Hepatol. 2014, 13, 1828–1835.e1. [Google Scholar] [CrossRef]
- Spanakis, P.; Jones, A.; Field, M.; Christiansen, P. A Stroop in the Hand is Worth Two on the Laptop: Superior Reliability of a Smartphone Based Alcohol Stroop in the Real World. Subst. Use Misuse 2019, 54, 692–698. [Google Scholar] [CrossRef]
- Waters, A.J.; Li, Y. Evaluating the utility of administering a reaction time task in an ecological momentary assessment study. Psychopharmacology 2008, 197, 25–35. [Google Scholar] [CrossRef]
- Ward, L. Dynamical Cognitive Science; MIT Press: Cambridge, UK, 2002. [Google Scholar]
- Carter, C.S.; Robertson, L.C.; Nordahl, T.E. Abnormal processing of irrelevant information in chronic schizophrenia: Selective enhancement of Stroop facilitation. Psychiatry Res. 1992, 41, 137–146. [Google Scholar] [CrossRef]
- Perlstein, W.M.; Carter, C.S.; Barch, D.M.; Baird, J.W. The Stroop task and attention deficits in schizophrenia: A critical evaluation of card and single-trial Stroop methodologies. Neuropsychology 1998, 12, 414–425. [Google Scholar] [CrossRef]
- Barch, D.; Carter, C.; Perlstein, W.; Baird, J.; Cohen, J.; Schooler, N. Increased Stroop facilitation effects in schizophrenia are not due to increased automatic spreading activation. Schizophr. Res. 1999, 39, 51–64. [Google Scholar] [CrossRef] [PubMed]
- Chandler, C.; Foltz, P.W.; Cohen, A.S.; Holmlund, T.B.; Cheng, J.; Bernstein, J.C.; Rosenfeld, E.P.; Elvevåg, B. Machine learning for ambulatory applications of neuropsychological testing. Intell. Med. 2020, 1–2, 100006. [Google Scholar] [CrossRef]
- Barch, D.M.; Carter, C.S. Amphetamine improves cognitive function in medicated individuals with schizophrenia and in healthy volunteers. Schizophr. Res. 2005, 77, 43–58. [Google Scholar] [CrossRef] [PubMed]
- Ventura, J.; Nuechterlein, K.H.; Subotnik, K.L.; Gutkind, D.; Gilbert, E.A. Symptom dimensions in recent-onset schizophrenia and mania: A principal components analysis of the 24-item Brief Psychiatric Rating Scale. Psychiatry Res. 2000, 97, 129–135. [Google Scholar] [CrossRef]
- Lukoff, D.; Nuechterlein, H.; Ventura, J. Appendix A. Manual for the expanded brief psychiatric rating scale. Schizophr. Bull. 1986, 12, 578–593. [Google Scholar] [CrossRef] [PubMed]
- Derogatis, L.; Melisaratos, N. The Brief Symptom Inventory: An introductory report. Psychol. Med. 1983, 13, 595–605. [Google Scholar] [CrossRef] [PubMed]
- Povey, D.; Ghoshal, A.; Boulianne, G.; Burget, L.; Glembek, O.; Hannemann, M.; Motlicek, P.; Qian, Y.; Schwarz, P.; Silovsky, J.; et al. The KALDI speech recognition toolkit. In Proceedings of the IEEE 2011 Workshop on Automatic Speech Recognition and Understanding, Waikoloa, HI, USA, 11–15 December 2011. [Google Scholar]
- Revelle, W. Psych: Procedures for Psychological, Psychometric, and Personality Research. R Package Version 1.8.10. 2018. Available online: https://CRAN.R-project.org/package=psych (accessed on 1 March 2023).
- Bridges, D.; Pitiot, A.; MacAskill, M.R.; Peirce, J.W. The timing mega-study: Comparing a range of experiment generators, both lab-based and online. PeerJ 2020, 8, e9414. [Google Scholar] [CrossRef]
- Shimizu, H. Measuring keyboard response delays by comparing keyboard and joystick inputs. Behavior Research Methods. Instrum. Comput. 2002, 34, 250–256. [Google Scholar] [CrossRef]
- Neath, I.; Earle, A.; Hallett, D.; Surprenant, A. Response time accuracy in Apple Macintosh computers. Behav. Res. Methods 2011, 43, 353–362. [Google Scholar] [CrossRef]
- Woodard, J.L. A quarter century of advances in the statistical analysis of longitudinal neuropsychological data. Neuropsychology 2017, 31, 1020–1035. [Google Scholar] [CrossRef]
- Cheng, J.; Bernstein, J.; Rosenfeld, E.; Foltz, P.W.; Cohen, A.S.; Holmlund, T.B.; Elvevåg, B. Modelling self-reported and observed affect from speech. In Proceedings of the Interspeech, Hyderabad, India, 2–6 September 2018; pp. 3653–3657. [Google Scholar] [CrossRef]
- Weinbach, N.; Kalanthroff, E.; Avnit, A.; Henik, A. Can arousal modulate response inhibition? J. Exp. Psychol. Learn. Mem. Cogn. 2015, 41, 1873–1877. [Google Scholar] [CrossRef]
- McGarrigle, R.; Dawes, P.; Stewart, A.; Kuchinsky, S.; Munro, K. Pupillometry reveals changes in physiological arousal during a sustained listening task. Psychophysiology 2017, 54, 193–203. [Google Scholar] [CrossRef]
- Laeng, B.; Ørbo, M.; Holmlund, T.; Miozzo, M. Pupillary Stroop effects. Cogn. Process. 2011, 12, 13–21. [Google Scholar] [CrossRef] [PubMed]
- Anwyl-Irvine, A.; Dalmaijer, E.; Hodges, N.; Evershed, J. Realistic precision and accuracy of online experiment platforms, web browsers, and devices. Behav. Res. Methods 2020, 53, 1407–1425. [Google Scholar] [CrossRef] [PubMed]
- Au, R.; Piers, R.J.; Devine, S. How technology is reshaping cognitive assessment: Lessons from the Framingham Heart Study. Neuropsychology 2017, 31, 846–861. [Google Scholar] [CrossRef] [PubMed]


| Nonpatients (N = 113) | Patients (N = 85) | ICC | |||
|---|---|---|---|---|---|
| M | SD | M | SD | ||
| Speed (s *) | |||||
| Overall | 0.745 | 0.079 | 0.766 | 0.092 | 0.83 |
| Congruent | 0.684 | 0.097 | 0.697 | 0.098 | 0.80 |
| Neutral | 0.731 | 0.077 | 0.762 | 0.095 | 0.82 |
| Incongruent | 0.839 | 0.112 | 0.860 | 0.122 | 0.85 |
| Stroop Effect scores (s *) | |||||
| Interference | 0.110 | 0.078 | 0.103 | 0.076 | 0.66 |
| Facilitation | 0.058 | 0.053 | 0.072 | 0.066 | 0.78 |
| Duration of utterance (s *) | |||||
| Overall | 0.495 | 0.078 | 0.563 | 0.100 | 0.57 |
| Congruent | 0.496 | 0.082 | 0.568 | 0.106 | 0.56 |
| Neutral | 0.495 | 0.081 | 0.558 | 0.099 | 0.39 |
| Incongruent | 0.494 | 0.084 | 0.555 | 0.101 | 0.53 |
| Coefficient of variation | |||||
| Overall | 0.190 | 0.045 | 0.198 | 0.052 | 0.68 |
| Congruent | 0.172 | 0.069 | 0.171 | 0.076 | 0.76 |
| Neutral | 0.151 | 0.053 | 0.169 | 0.059 | 0.70 |
| Incongruent | 0.174 | 0.062 | 0.179 | 0.071 | 0.43 |
Disclaimer/Publisher’s Note: The statements, opinions and data contained in all publications are solely those of the individual author(s) and contributor(s) and not of MDPI and/or the editor(s). MDPI and/or the editor(s) disclaim responsibility for any injury to people or property resulting from any ideas, methods, instructions or products referred to in the content. |
© 2023 by the authors. Licensee MDPI, Basel, Switzerland. This article is an open access article distributed under the terms and conditions of the Creative Commons Attribution (CC BY) license (https://creativecommons.org/licenses/by/4.0/).
Share and Cite
Holmlund, T.B.; Cohen, A.S.; Cheng, J.; Foltz, P.W.; Bernstein, J.; Rosenfeld, E.; Laeng, B.; Elvevåg, B. Using Automated Speech Processing for Repeated Measurements in a Clinical Setting of the Behavioral Variability in the Stroop Task. Brain Sci. 2023, 13, 442. https://doi.org/10.3390/brainsci13030442
Holmlund TB, Cohen AS, Cheng J, Foltz PW, Bernstein J, Rosenfeld E, Laeng B, Elvevåg B. Using Automated Speech Processing for Repeated Measurements in a Clinical Setting of the Behavioral Variability in the Stroop Task. Brain Sciences. 2023; 13(3):442. https://doi.org/10.3390/brainsci13030442
Chicago/Turabian StyleHolmlund, Terje B., Alex S. Cohen, Jian Cheng, Peter W. Foltz, Jared Bernstein, Elizabeth Rosenfeld, Bruno Laeng, and Brita Elvevåg. 2023. "Using Automated Speech Processing for Repeated Measurements in a Clinical Setting of the Behavioral Variability in the Stroop Task" Brain Sciences 13, no. 3: 442. https://doi.org/10.3390/brainsci13030442
APA StyleHolmlund, T. B., Cohen, A. S., Cheng, J., Foltz, P. W., Bernstein, J., Rosenfeld, E., Laeng, B., & Elvevåg, B. (2023). Using Automated Speech Processing for Repeated Measurements in a Clinical Setting of the Behavioral Variability in the Stroop Task. Brain Sciences, 13(3), 442. https://doi.org/10.3390/brainsci13030442