Abstract
A growing body of evidence suggests immune involvement in the pathology of multiple system atrophy (MSA). Research on detailed peripheral immune indices, however, is relatively sparse, and is one of the intriguing aspects of MSA yet to be elucidated. A total of 26 MSA patients and 56 age-and sex-matched healthy controls (HC) were enrolled in the current case-control study to delineate the peripheral immune traits of MSA patients. The ratio of CD4+/CD8+ T cells, natural killer cells, CD28 expression on both CD4+ T cells and CD8+ T cells increased in MSA patients compared to HC, but CD8+ T cells and active marker (HLA-DR) expression on total T cells decreased (p < 0.05). This study sheds light on the dysregulation of cellular immunity in MSA, pointing to future mechanistic research.
1. Introduction
Multiple system atrophy (MSA) is an adult-onset, progressive neurodegenerative disease characterized by varying degrees of parkinsonism, cerebellar ataxia, and dysautonomia [1]. MSA is classified clinically into two types based on the most prominent symptoms: parkinsonian MSA (MSA-P) and cerebellar MSA (MSA-C) [1]. The argyrophilic filamentous glial cytoplasmic inclusions (GCIs), whose core component is misfolded alpha-synuclein (α-synuclein), are indicative of MSA [2]. However, the pathologic mechanisms by which MSA develops and progresses are poorly understood. No disease-modifying treatments are currently available to delay disease progression in MSA.
Potential pathogenic mechanisms previously reported include cell-to-cell spreading of α-synuclein, oxidative stress, mitochondrial dysfunction, and neuroinflammation [3,4]. Among all possible causes of MSA pathology, the neuroinflammation theory has received attention in the last decade. MSA patients had higher levels of proinflammatory cytokines in their frontal cortex and cerebrospinal fluid (CSF) [5,6,7,8]. Both astrocytes and microglia are involved in the abnormal deposition of α-synuclein, and GCI may trigger a cascade of inflammatory immune responses that result in neuronal cell degeneration and necrosis [9].
In neurodegenerative diseases, there has recently been an increase in evidence of immune crosstalk between the central nervous immune system and the peripheral immune system [10,11]. The concept of immune privilege and deprivation of peripheral immune cells in the central nervous system (CNS) has been disproven [12]. The presence of CD4+ and CD8+ T cells in the substantia nigra of a Parkinson’s disease mouse model and of patients, altered cytokine profile in serum, as well as the proximity of infiltrating T cells to major histocompatibility complex-expressing microglia, suggests the circulation and migration of peripheral immune cells to sites of inflammation [13,14]. Antigen-specific immune cell migration from the periphery to the CNS, and consequent immune cell interactions with resident glial cells, affect neuroinflammation and neuronal survival [15]. Thus, studying peripheral immune abnormalities helps us to understand immune-related mechanisms in neurodegenerative diseases. According to preliminary studies, peripheral immune abnormalities are involved in the pathology of MSA [16,17,18,19]. T cell infiltration in the putamen and substantia nigra was found to be increased in MSA patients [19]. According to Cao et al., the ratio of CD4+/CD8+ T cells was higher in male MSA patients compared to healthy controls (HC) [16]. In the current study, the ration of CD4+/CD8+ T cells was also higher in MSA patients compared to HC. In another study, Zhang et al. reported that a high neutrophil-to-lymphocyte ratio (NLR) predicts short survival in MSA patients [17]. Madetko et al. found that the NLR was positively correlated with disease duration in MSA-P patients [18]. However, previous researchers either only explored the changes of blood routine test, or simply divided the peripheral T cells into CD4+ T cells (helper T cells: Th) and CD8+ T cells (cytotoxic T cells: Tc). Other T cell subsets, such as CD28+ T cells and regulatory T cells (Tregs), were recently shown to be closely associated with α-synuclein pathology [20,21]. A detailed examination of these T cell subsets in MSA patients is currently lacking. A thorough examination of changes in peripheral immune traits in MSA patients provides clues for future mechanistic studies. Therefore, this study aims to: (1) provide a comprehensive analysis of 34 kinds of peripheral immunity-related indices in patients with MSA; and (2) review previous studies and propose new research directions.
2. Materials and Methods
2.1. Study Design, Patient Recruitment, and Ethics Approval
The study flow chart is displayed in Figure 1. In this case-control study, 26 MSA patients and 56 age- and sex-matched HC were consecutively recruited at the Department of Neurology, Tongji Hospital, Tongji Medical College, Huazhong University of Science and Technology, from May 2019 to May 2022. According to the 2008 diagnostic criteria, all patients with MSA had disease onset after the age of 30 years and were diagnosed at probable or definite levels [1]. Participants were excluded if they had a family history of neurodegenerative disorders, immunodeficiency or autoimmune diseases, or if they were taking immunomodulatory medications. Serum biochemical tests (normal level of C-reactive protein and erythrocyte sedimentation rate) revealed no evidence of systemic inflammation in any of the participants. Demographic information of all subjects and clinical information of MSA patients were recorded. This study was approved by the ethics committee of Tongji Hospital, Tongji Medical College, and the Huazhong University of Science and Technology (TJ-IRB20220829). All participants provided written informed consent, and the study was carried out in accordance with the Helsinki Declaration [22].
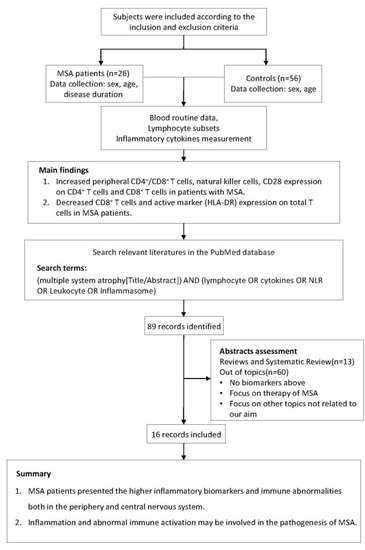
Figure 1.
The research flow chart.
2.2. Blood Sample Collection and Flow Cytometry
Heparinized venous blood samples were collected by venipuncture from MSA patients and HC between 6:00–7:00 a.m. The absolute numbers and phenotypes of lymphocyte subsets were then determined using flow cytometry. The percentages and absolute numbers of CD4+ T cells, CD8+ T cells, B cells, and natural killer (NK) cells were determined using TruCOUNT tubes and BD Multitest 6-color TBNK Reagent Kit (BD Biosciences Pharmingen, San Diego, CA, USA) following the manufacturer’s instructions. In brief, 50 µL of whole blood was incubated for 15 min at room temperature with a six-color TBNK antibody cocktail. Samples were analyzed with a FACSCanto flow cytometer and FACSCanto clinical software after adding 450 µL of FACS lysing solution (BD Biosciences Pharmingen). The following mAbs were added to 100 µL whole blood. The antibodies in panel 1 were anti-CD45-PerCP (BD Biosciences Pharmingen, 2D1), anti-CD3-APC-H7 (BD Biosciences Pharmingen, SK7), anti-CD4-V450 (BD Biosciences Pharmingen, RPA-T4), anti-CD8-PE/Cy7 (BD Biosciences Pharmingen, SK1), anti-CD28-PE (BD Biosciences Pharmingen, L293), and anti-HLA-DR-APC (BD Biosciences Pharmingen, L243). The antibodies in panel 2 were anti-CD45-PerCP (BD Biosciences Pharmingen, 2D1), anti-CD3-APC-H7 (BD Biosciences Pharmingen, SK7), anti-CD4-BV510 (BD Biosciences Pharmingen, SK3), anti-CD45RA-FITC (BD Biosciences Pharmingen, L48), anti-CD8-PE/Cy7 (BD Biosciences Pharmingen, SK1), anti-CCR7-PE (BD Biosciences Pharmingen, 3D12), anti-CD25-APC (BD Biosciences Pharmingen, 2A3), and anti-CD127-BV421 (BD Biosciences Pharmingen, HIL-7R-M21). The antibodies in panel 3 were anti-CD38-FITC (BD Biosciences Pharmingen, HB7), anti-CD19-PE/Cy7 (BD Biosciences Pharmingen, SJ25C1), anti-CD27-PerCP (BD Biosciences Pharmingen, 2D1) and CD45-V500C (BD Biosciences Pharmingen, 2D1), and anti-IgD-APC (BD Biosciences Pharmingen, IA6–2). The total percentage of T cells (%), B cells (%), and NK cells (%) were calculated as the proportion of CD3+CD19– cells, CD3–CD19+ cells, and CD3–CD16+CD56+ cells in lymphocytes, respectively. The total percentage of helper T cells (Th%), cytotoxic T cells (Tc%), activated T cells (%), Treg (%), natural Treg (%), and induced Treg (%) were calculated as the proportion of CD3+CD4+ T cells, CD3+CD8+ T cells, CD3+HLA-DR+ T cells, CD3+CD4+CD25+CD127low+ T cells, CD45RA+CD3+CD4+CD25+CD127low+ T cells, and CD45RO+CD3+CD4+CD25+CD127low+ T cells in total T cells, respectively.
2.3. Serum Cytokine Detection
A chemiluminescent immunometric assay was used to detect serum interleukin-2 receptor (IL-2R), IL-1β, IL-10, IL-8, and tumor necrosis factor-α (TNF-α) (IMMULITE 1000 Analyzer, Siemens). Serum IL-6 was measured using the electrochemiluminescence method (Roche Diagnostics, South San Francisco, CA, USA) [23].
2.4. Search Strategy for Literature Review
In order to learn more about peripheral immunity in MSA, we summarized data from previously conducted clinical investigations. We searched the PubMed database for studies that had been published prior to November 2022 describing the changes in the peripheral immune system in MSA patients. The search terms used were “(multiple system atrophy [Title/Abstract]) AND (lymphocyte OR cytokines OR NLR OR leukocyte OR inflammasome)”. Studies were considered for inclusion if they met both of the following criteria: (1) the study had to be written in English with its entire text publicly accessible; (2) the study had to be focused on the changes of peripheral immunity in MSA patients. Reviews, clinical trials, and studies focused on other topics were excluded. In total, 15 studies were summarized for this review (Table 1).

Table 1.
Literature review of studies on immunity traits in patients with MSA.
2.5. Statistical Analysis
Continuous variables were either represented as mean (standard deviation, SD) or median (25% quartile and 75% quartile). Depending on the distribution of data, differences between the two groups were analyzed using Student’s t-test or Mann–Whitney U test. Categorical variables were represented as frequencies and were compared using the chi-square test. In the partial least squares discriminate analysis (PLS-DA), samples with different peripheral immune characteristics have different aggregation regions in the two-dimensional coordinate system, which was further validated using a permutation test (200 permutations). The variable importance in the projection (VIP) values were calculated to screen for major immune indices contributing to the peripheral immunity differences between MSA and HC. p < 0.05 indicated statistical significance. All statistical analyses were performed with SPSS (IBM, version 26.0) and SIMCA-P (Umetrics, version 14.1) software. Graphs were generated using GraphPad Prism 7.0.
3. Results
3.1. Demographic and Clinical Characteristics
In this study, age- and gender-matched 26 MSA and 56 HC were enrolled (Table 2). The median age of onset and disease duration for MSA patients was 54 years and 15 months, respectively. Twenty-four patients were diagnosed as MSA-C and two patients as MSA-P, based on their clinical symptoms.
Table 2.
Demographic and clinical characteristics.
3.2. Changes of Peripheral Immune Traits in Multiple System Atrophy Patients
There was no statistically significant difference between MSA and HC in the counts of white blood cells, neutrophils, lymphocytes, monocytes, eosinophils, and basophils. The neutrophil-to-lymphocyte ratio was also comparable between MSA and HC (Table 3). The ration of Th/total T cells, the ratio of CD4+/CD8+ T cells, natural killer cells, CD28 expression on both CD4+ T cells and CD8+ T cells were higher in the MSA group (p < 0.05), but Tc and active marker (HLA-DR) expression on total T cells was lower (p < 0.05) (Table 4). There was no statistical difference in serum cytokine levels between MSA and HC (Table 5). The correlations between clinical characteristics and lymphocyte subsets in MSA patients were estimated. We observed positive correlations between the NK cells (%) and onset age (rs = 0.463, p = 0.017), the NK cell counts and onset age (rs = 0.427, p = 0.030), and the ratio of CD3+CD8+HLA-DR+ Ts/Ts with onset age (rs = 0.462, p = 0.017). No correlation was observed between these indices and disease duration (Supplementary Table S1). Additionally, we compared the lymphocyte subsets between males and females in patients with MSA. There was no statistical difference between male and female patients (Supplementary Table S2).
Table 3.
Comparison of blood routine data between MSA and HC.
Table 4.
Comparison of lymphocyte subsets data between MSA and HC.
Table 5.
Comparison of cytokines between MSA and HC.
We also compared the overall similarity of peripheral immune characteristics between MSA and HC using PLS-DA, which showed discrete distributions, indicating distinctive peripheral immune characteristics (Figure 2A). The permutation test demonstrated that the PLS-DA models were valid (Intercepts: R2 = 0.109 < 0.3, Q2 = −0.182 < 0.05). The top ten peripheral immune indices were screened based on the VIP score (Figure 2B).
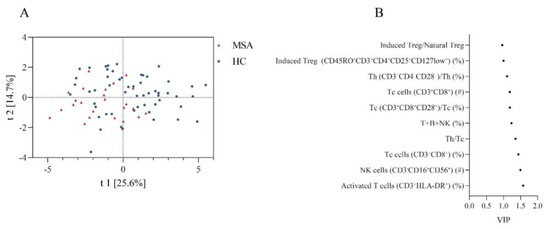
Figure 2.
The discrepancy of peripheral immune traits between MSA and HC. (A) Obvious separation in the PLS-DA model indicates a different structure of peripheral immune traits between MSA and HC. (B) Top 10 peripheral immune indices with highest VIP value between MSA and HC. Abbreviations: MSA: multiple system atrophy; HC: healthy controls; PLS-DA: partial least squares discriminate analysis; VIP: variable importance in the projection.
4. Discussion
We observed an increase in peripheral Th/Tc, natural killer cells, CD28 expression on both CD4+ T cells and CD8+ T cells, a decrease in CD8+ T cells and active marker (HLA-DR) expression on total T cells in MSA patients. The current study provides, to the best of our knowledge, the most extensive assessments of peripheral immunity in MSA patients, offering some fresh evidence for peripheral immune dysregulation in these patients.
4.1. Increased Natural Killer Cells and Alpha-Synuclein Pathology
NK cells are one of the important components of human lymphocyte lineages, accounting for about 10–15% of circulating lymphocytes [32]. Besides being the first defense of innate immunity, NK cells are also involved in adaptive immunity by producing a wide variety of cytokines and chemokines, including IFN-γ, TNF-α, GM-CSF, IL-10, IL-5, IL-13, MIP-1α, MIP-1β, IL-8, and CCL5 [33,34]. Evidence from neurodegenerative diseases over the past decade suggests that NK cells play a major role in response to central nervous system inflammation [35,36,37]. Increased peripheral NK cells have been reported in previous studies on Parkinson’s disease [37,38,39,40,41,42,43], which seems to be a consistent finding [44]. Although both MSA and PD are neurodegenerative diseases characterized by aberrant α-synuclein deposition, only one study has looked into the changes in peripheral NK cells of MSA patients [26]. In contrast to earlier reports that showed a similar number of peripheral NK cells between MSA and HC [26], we found an increase in peripheral NK cells in the MSA patients. Systemic depletion of NK cells exacerbated α-synuclein pathology in a mouse model of α-synuclein. Peripheral NK cells efficiently infiltrate into the CNS and are involved in the degradation of α-synuclein aggregation via the endosomal/lysosomal pathway [45]. Our findings regarding the increase in NK cells suggest a potential defense mechanism to clear excess α-synuclein in MSA patients. Positive NK cell staining in the substantia nigra has been reported in patients with PD [45], and postmortem brain tissue in MSA requires a similar pathological evaluation. Another issue that cannot be overlooked is that NK cells in humans displayed dynamic expression of surface markers involved in differentiation, trafficking, and cytotoxicity, and distinct subpopulations of NK cells have varied immune functions [46]. Tian et al. reported an increase in the frequency of high cytotoxic NK subsets (CD56+CD16+CD57+CD28– NK) in PD [47]. Reports have shown that CD56dim NK cells, rather than CD56bright NK subtypes, played a vital role in α-synuclein pathology [48]. There is a lack of investigation on precise NK subsets in MSA patients, and further research is needed to answer these unknown but important questions.
4.2. Activated Helper T Cells and Multiple System Atrophy
Our study revealed a higher CD28 expression on both CD4+ T cells and CD8+ T cells, and a lower active marker (HLA-DR) expression on total T cells in MSA patients, suggesting a disrupted T cell immunity. T cells constitute 65–75% of the total lymphocytes playing vital roles in adaptive immunity [49]. Previous reports have shown infiltrated CD3+ T cells in the prefrontal cortex [6], putamen and substantia nigra [19] of postmortem MSA tissue. The immunological reactions between these infiltrated T cells and α-synuclein are intricate [50]. Based on the differential expression of cell surface molecules, T cells can be classified into two categories: Th and Tc [51]. Earlier reports have shown an increased proportion of peripheral CD4+ T cells in MSA patients [16]. The infiltrated CD4+ T cells were higher than CD8+ T cells in postmortem brain tissue of MSA patients [19]. In oligodendroglial α-synuclein viral vector models of MSA, the entry of CD4+ T cells into intracranial tissue was significantly more robust than CD8+ T cells, indicating the importance of CD4+ T cells in MSA pathology [19]. Our study showed a higher ratio of CD3+CD4+CD28+ Th/Th in MSA patients. CD28 present on the surface of T cells is responsible for co-stimulation, and CD3+CD4+CD28+ Th is a subpopulation of activated Th cells [52]. In T cells, CD28 expression induces several intracellular events, including cytokines production and signal transduction, leading to their survival or differentiation [53]. The role of CD28+ T cells in MSA is unknown at present. Previous studies have classified PD and healthy controls based on CD28 signaling in Th cells using bioinformatic approaches [21]. On the contrary, cytotoxic T-lymphocyte-associated antigen 4 (CTLA4) negatively regulates T cell responses by competing with CD28 for CD80/86 site [54]. The imbalance of CD28 and CTLA4 leads to high inflammatory tendency and dopamine neuron injury [55], which may contribute to the onset and exacerbation of movement disorders in MSA patients. Being the first to detect the detailed subsets of T cells in MSA patients, our findings about the increased CD3+CD4+CD28+ Th cells necessitate further investigation into the underlying mechanisms.
4.3. A Summary of Altered Immune Traits in Multiple System Atrophy
Previous studies have shown that postmortem tissues from MSA patients contain an infiltration of CD3+, CD4+, and CD8+ T cells in the putamen and substantia nigra [19]. Compared to controls, there was an increase in the proportion of CD4+ T cells, but no change in the proportion of CD8+ T cells [16]. In the current study, the proportion of CD4+ T cells and CD4+/CD8+ T cells increased in MSA patients, while the CD8+ T cells decreased in MSA patients. No studies have analyzed NK cells subsets and Tregs in MSA patients. There has not been a single study that has analyzed NK cell subsets and Tregs in MSA patients. The NLR, an inflammatory marker, can predict the severity and prognosis of neurodegenerative diseases such as PD [56], progressive supranuclear palsy [57] and amyotrophic lateral sclerosis [58]. Three studies have reported higher NLR in MSA patients being associated with a poor outcome [17,18,24]. However, our current study did not find a significant difference in NLR between MSA and controls. Previous studies on inflammatory cytokines in peripheral blood were inconclusive [27,28,30]. Our study could not find any significant difference in the inflammatory cytokines between the two groups; however, there was a slight increase in IL-6 in MSA patients, corroborating previous findings in cerebrospinal fluid [5,7,8,29] and postmortem brain issues [6]. Additionally, a previous study reported an increased number of NOD-like receptor thermal protein domain associated protein 3 inflammasome-related microglia in the putamen of MSA [31].
4.4. Limitations
There are several limitations in the current study. First, this is a single-center case-control study, so more researches involving multi-center longitudinal cohort studies are needed to understand the dynamic changes of peripheral immune traits throughout disease progression. In this study, just two of the patients had MSA-P. Although MSA-C predominates in the Chinese population, increasing the sample size and distinguishing disease subtypes will help us further elucidate the changes of peripheral immunity in MSA patients. Second, using standardized tools, such as the united multiple system atrophy rating scale (UMSARS), to comprehensively assess the condition of patients with MSA, and taking disease severity into consideration, will help us to better understand the role of dysregulated peripheral immune traits in the progress of MSA. Third, NK cells are highly heterogenous, and activated NK cells secrete a wide variety of cytokines. Some important cytokines and chemokines, such as IFN-γ, MIP-1α, MIP-1β, and RANTES, have not been investigated in our study, calling for a more complete cytokine release assay in future research. Additionally, as α-synuclein pathology is a common feature of PD and MSA, PD patients should be included in further studies to help us explore immune markers that distinguish MSA from other neurodegenerative disorders.
5. Conclusions
This is the first study to compare peripheral immune traits comprehensively between MSA patients and HC. Our findings suggest that NK cells, CD28 expression on T cells, and HLA-DR expression on T cells might be involved in the pathology of MSA.
Supplementary Materials
The following are available online at https://www.mdpi.com/article/10.3390/brainsci13020205/s1, Table S1: Spearman correlations of clinical characteristics with lymphocyte subsets of MSA patients. Table S2: Comparison of lymphocyte subsets data in MSA patients of different genders.
Author Contributions
H.H. and M.Z. designed the study and revised the manuscript. Z.G., R.G., L.B. and Y.L. conducted clinical assessment and sample collection. Z.G. and R.G. performed the statistical analysis and wrote the manuscript. All authors have read and agreed to the published version of the manuscript.
Funding
This study was supported by a grant from the National Natural Science Foundation of China (No. 82271478).
Institutional Review Board Statement
The study was conducted according to the guidelines of the Declaration of Helsinki, and approved by the ethics committee of Tongji Hospital, Tongji Medical College, and Huazhong University of Science and Technology (TJ-IRB20220829).
Informed Consent Statement
All participants provided written informed consent.
Written informed consent has been obtained from the patients to publish this paper.
Data Availability Statement
The original datasets in this study are available from the corresponding author upon reasonable request.
Acknowledgments
We are grateful to all participants who took part in this study. We also thank Professor Daishi Tian for his help in recruiting participants.
Conflicts of Interest
The authors declare no conflict of interest.
References
- Gilman, S.; Wenning, G.K.; Low, P.A.; Brooks, D.J.; Mathias, C.J.; Trojanowski, J.Q.; Wood, N.W.; Colosimo, C.; Durr, A.; Fowler, C.J.; et al. Second consensus statement on the diagnosis of multiple system atrophy. Neurology 2008, 71, 670–676. [Google Scholar] [CrossRef]
- Stefanova, N.; Bucke, P.; Duerr, S.; Wenning, G.K. Multiple system atrophy: An update. Lancet Neurol. 2009, 8, 1172–1178. [Google Scholar] [CrossRef] [PubMed]
- Jellinger, K.A. Multiple System Atrophy: An Oligodendroglioneural Synucleinopathy1. J. Alzheimers Dis. 2018, 62, 1141–1179. [Google Scholar] [CrossRef]
- Jellinger, K.A. Heterogeneity of Multiple System Atrophy: An Update. Biomedicines 2022, 10, 599. [Google Scholar] [CrossRef]
- Compta, Y.; Dias, S.P.; Giraldo, D.M.; Perez-Soriano, A.; Munoz, E.; Saura, J.; Fernandez, M.; Bravo, P.; Camara, A.; Pulido-Salgado, M.; et al. Cerebrospinal fluid cytokines in multiple system atrophy: A cross-sectional Catalan MSA registry study. Park. Relat. Disord. 2019, 65, 3–12. [Google Scholar] [CrossRef]
- Rydbirk, R.; Elfving, B.; Andersen, M.D.; Langbøl, M.A.; Folke, J.; Winge, K.; Pakkenberg, B.; Brudek, T.; Aznar, S. Cytokine profiling in the prefrontal cortex of Parkinson’s Disease and Multiple System Atrophy patients. Neurobiol. Dis. 2017, 106, 269–278. [Google Scholar] [CrossRef]
- Starhof, C.; Winge, K.; Heegaard, N.H.H.; Skogstrand, K.; Friis, S.; Hejl, A. Cerebrospinal fluid pro-inflammatory cytokines differentiate parkinsonian syndromes. J. Neuroinflammation 2018, 15, 305. [Google Scholar] [CrossRef]
- Hall, S.; Janelidze, S.; Surova, Y.; Widner, H.; Zetterberg, H.; Hansson, O. Cerebrospinal fluid concentrations of inflammatory markers in Parkinson’s disease and atypical parkinsonian disorders. Sci. Rep. 2018, 8, 13276. [Google Scholar] [CrossRef]
- Vieira, B.D.; Radford, R.A.; Chung, R.S.; Guillemin, G.J.; Pountney, D.L. Neuroinflammation in Multiple System Atrophy: Response to and Cause of alpha-Synuclein Aggregation. Front. Cell. Neurosci. 2015, 9, 437. [Google Scholar] [CrossRef] [PubMed]
- Harms, A.S.; Ferreira, S.A.; Romero-Ramos, M. Periphery and brain, innate and adaptive immunity in Parkinson’s disease. Acta Neuropathol. 2021, 141, 527–545. [Google Scholar] [CrossRef]
- Chen, X.; Feng, W.; Ou, R.; Liu, J.; Yang, J.; Fu, J.; Cao, B.; Chen, Y.; Wei, Q.; Shang, H. Evidence for Peripheral Immune Activation in Parkinson’s Disease. Front. Aging Neurosci. 2021, 13, 617370. [Google Scholar] [CrossRef]
- Engelhardt, B.; Vajkoczy, P.; Weller, R.O. The movers and shapers in immune privilege of the CNS. Nat. Immunol. 2017, 18, 123–131. [Google Scholar] [CrossRef] [PubMed]
- Williams, G.P.; Schonhoff, A.M.; Jurkuvenaite, A.; Gallups, N.J.; Standaert, D.G.; Harms, A.S. CD4 T cells mediate brain inflammation and neurodegeneration in a mouse model of Parkinson’s disease. Brain 2021, 144, 2047–2059. [Google Scholar] [CrossRef] [PubMed]
- Nicoletti, A.; Fagone, P.; Donzuso, G.; Mangano, K.; Dibilio, V.; Caponnetto, S.; Bendtzen, K.; Zappia, M.; Nicoletti, F. Parkinson’s disease is associated with increased serum levels of macrophage migration inhibitory factor. Cytokine 2011, 55, 165–167. [Google Scholar] [CrossRef] [PubMed]
- Martinez-Pasamar, S.; Abad, E.; Moreno, B.; Velez de Mendizabal, N.; Martinez-Forero, I.; Garcia-Ojalvo, J.; Villoslada, P. Dynamic cross-regulation of antigen-specific effector and regulatory T cell subpopulations and microglia in brain autoimmunity. BMC Syst. Biol. 2013, 7, 34. [Google Scholar] [CrossRef]
- Cao, B.; Chen, X.; Zhang, L.; Wei, Q.; Liu, H.; Feng, W.; Chen, Y.; Shang, H. Elevated Percentage of CD3+ T-Cells and CD4+/CD8+ Ratios in Multiple System Atrophy Patients. Front. Neurol. 2020, 11, 658. [Google Scholar] [CrossRef]
- Zhang, L.; Cao, B.; Hou, Y.; Wei, Q.; Ou, R.; Zhao, B.; Shang, H. High neutrophil-to-lymphocyte ratio predicts short survival in multiple system atrophy. NPJ Parkinsons Dis. 2022, 8, 11. [Google Scholar] [CrossRef]
- Madetko, N.; Migda, B.; Alster, P.; Turski, P.; Koziorowski, D.; Friedman, A. Platelet-to-lymphocyte ratio and neutrophil-tolymphocyte ratio may reflect differences in PD and MSA-P neuroinflammation patterns. Neurol. Neurochir. Pol. 2022, 56, 148–155. [Google Scholar] [CrossRef] [PubMed]
- Williams, G.P.; Marmion, D.J.; Schonhoff, A.M.; Jurkuvenaite, A.; Won, W.J.; Standaert, D.G.; Kordower, J.H.; Harms, A.S. T cell infiltration in both human multiple system atrophy and a novel mouse model of the disease. Acta Neuropathol. 2020, 139, 855–874. [Google Scholar] [CrossRef]
- Schwab, A.D.; Thurston, M.J.; Machhi, J.; Olson, K.E.; Namminga, K.L.; Gendelman, H.E.; Mosley, R.L. Immunotherapy for Parkinson’s disease. Neurobiol. Dis. 2020, 137, 104760. [Google Scholar] [CrossRef] [PubMed]
- Li, T.; Tang, W.; Zhang, L. Monte Carlo cross-validation analysis screens pathway cross-talk associated with Parkinson’s disease. Neurol. Sci. 2016, 37, 1327–1333. [Google Scholar] [CrossRef] [PubMed]
- World Medical Association. World Medical Association Declaration of Helsinki: Ethical principles for medical research involving human subjects. JAMA 2013, 310, 2191–2194. [Google Scholar] [CrossRef] [PubMed]
- Wang, F.; Hou, H.; Luo, Y.; Tang, G.; Wu, S.; Huang, M.; Liu, W.; Zhu, Y.; Lin, Q.; Mao, L.; et al. The laboratory tests and host immunity of COVID-19 patients with different severity of illness. JCI Insight 2020, 5, e137799. [Google Scholar] [CrossRef]
- Jiang, L.; Zhong, Z.; Huang, J.; Bian, H.; Huang, W. Monocytohigh-density lipoprotein ratio has a high predictive value for the diagnosis of multiple system atrophy and the differentiation from Parkinson’s disease. Front. Aging Neurosci. 2022, 14, 1035437. [Google Scholar] [CrossRef]
- Matsuse, D.; Yamasaki, R.; Maimaitijiang, G.; Yamaguchi, H.; Masaki, K.; Isobe, N.; Matsushita, T.; Kira, J.I. Early decrease in intermediate monocytes in peripheral blood is characteristic of multiple system atrophy-cerebellar type. J. Neuroimmunol. 2020, 349, 577395. [Google Scholar] [CrossRef]
- Rydbirk, R.; Folke, J.; Busato, F.; Roche, E.; Chauhan, A.S.; Lokkegaard, A.; Hejl, A.M.; Bode, M.; Blaabjerg, M.; Moller, M.; et al. Epigenetic modulation of AREL1 and increased HLA expression in brains of multiple system atrophy patients. Acta Neuropathol. Commun. 2020, 8, 29. [Google Scholar] [CrossRef]
- Kaufman, E.; Hall, S.; Surova, Y.; Widner, H.; Hansson, O.; Lindqvist, D. Proinflammatory cytokines are elevated in serum of patients with multiple system atrophy. PLoS ONE 2013, 8, e62354. [Google Scholar] [CrossRef]
- Csencsits-Smith, K.; Suescun, J.; Li, K.; Luo, S.; Bick, D.L.; Schiess, M. Serum Lymphocyte-Associated Cytokine Concentrations Change More Rapidly over Time in Multiple System Atrophy Compared to Parkinson Disease. Neuroimmunomodulation 2016, 23, 301–308. [Google Scholar] [CrossRef]
- Yamasaki, R.; Yamaguchi, H.; Matsushita, T.; Fujii, T.; Hiwatashi, A.; Kira, J.I. Early strong intrathecal inflammation in cerebellar type multiple system atrophy by cerebrospinal fluid cytokine/chemokine profiles: A case control study. J. Neuroinflammation 2017, 14, 89. [Google Scholar] [CrossRef]
- Kim, R.; Kim, H.J.; Kim, A.; Jang, M.; Kim, A.; Kim, Y.; Yoo, D.; Im, J.H.; Choi, J.H.; Jeon, B. Does peripheral inflammation contribute to multiple system atrophy? Parkinsonism Relat. Disord. 2019, 64, 340–341. [Google Scholar] [CrossRef]
- Li, F.; Ayaki, T.; Maki, T.; Sawamoto, N.; Takahashi, R. NLRP3 Inflammasome-Related Proteins Are Upregulated in the Putamen of Patients with Multiple System Atrophy. J. Neuropathol. Exp. Neurol. 2018, 77, 1055–1065. [Google Scholar] [CrossRef] [PubMed]
- Hu, W.; Wang, G.; Huang, D.; Sui, M.; Xu, Y. Cancer Immunotherapy Based on Natural Killer Cells: Current Progress and New Opportunities. Front. Immunol. 2019, 10, 1205. [Google Scholar] [CrossRef] [PubMed]
- Caligiuri, M.A. Human natural killer cells. Blood 2008, 112, 461–469. [Google Scholar] [CrossRef]
- Paolini, R.; Bernardini, G.; Molfetta, R.; Santoni, A. NK cells and interferons. Cytokine Growth Factor Rev. 2015, 26, 113–120. [Google Scholar] [CrossRef]
- Poli, A.; Kmiecik, J.; Domingues, O.; Hentges, F.; Bléry, M.; Chekenya, M.; Boucraut, J.; Zimmer, J. NK cells in central nervous system disorders. J. Immunol. 2013, 190, 5355–5362. [Google Scholar] [CrossRef]
- Wang, S.; van de Pavert, S.A. Innate Lymphoid Cells in the Central Nervous System. Front. Immunol. 2022, 13, 837250. [Google Scholar] [CrossRef]
- Menees, K.B.; Lee, J.K. New Insights and Implications of Natural Killer Cells in Parkinson’s Disease. J. Parkinsons Dis. 2022, 12, S83–S92. [Google Scholar] [CrossRef]
- Cen, L.; Yang, C.; Huang, S.; Zhou, M.; Tang, X.; Li, K.; Guo, W.; Wu, Z.; Mo, M.; Xiao, Y.; et al. Peripheral Lymphocyte Subsets as a Marker of Parkinson’s Disease in a Chinese Population. Neurosci. Bull. 2017, 33, 493–500. [Google Scholar] [CrossRef]
- Huang, Y.; Liu, H.; Hu, J.; Han, C.; Zhong, Z.; Luo, W.; Zhang, Y.; Ling, F. Significant Difference of Immune Cell Fractions and Their Correlations with Differential Expression Genes in Parkinson’s Disease. Front. Aging Neurosci. 2021, 13, 686066. [Google Scholar] [CrossRef]
- Mihara, T.; Nakashima, M.; Kuroiwa, A.; Akitake, Y.; Ono, K.; Hosokawa, M.; Yamada, T.; Takahashi, M. Natural killer cells of Parkinson’s disease patients are set up for activation: A possible role for innate immunity in the pathogenesis of this disease. Parkinsonism Relat. Disord. 2008, 14, 46–51. [Google Scholar] [CrossRef]
- Niwa, F.; Kuriyama, N.; Nakagawa, M.; Imanishi, J. Effects of peripheral lymphocyte subpopulations and the clinical correlation with Parkinson’s disease. Geriatr. Gerontol. Int. 2012, 12, 102–107. [Google Scholar] [CrossRef]
- Sun, C.; Zhao, Z.; Yu, W.; Mo, M.; Song, C.; Si, Y.; Liu, Y. Abnormal subpopulations of peripheral blood lymphocytes are involved in Parkinson’s disease. Ann. Transl. Med. 2019, 7, 637. [Google Scholar] [CrossRef]
- Stevens, C.H.; Rowe, D.; Morel-Kopp, M.C.; Orr, C.; Russell, T.; Ranola, M.; Ward, C.; Halliday, G.M. Reduced T helper and B lymphocytes in Parkinson’s disease. J. Neuroimmunol. 2012, 252, 95–99. [Google Scholar] [CrossRef]
- Jiang, S.; Gao, H.; Luo, Q.; Wang, P.; Yang, X. The correlation of lymphocyte subsets, natural killer cell, and Parkinson’s disease: A meta-analysis. Neurol. Sci. 2017, 38, 1373–1380. [Google Scholar] [CrossRef] [PubMed]
- Earls, R.H.; Menees, K.B.; Chung, J.; Gutekunst, C.A.; Lee, H.J.; Hazim, M.G.; Rada, B.; Wood, L.B.; Lee, J.K. NK cells clear alpha-synuclein and the depletion of NK cells exacerbates synuclein pathology in a mouse model of alpha-synucleinopathy. Proc. Natl. Acad. Sci. USA 2020, 117, 1762–1771. [Google Scholar] [CrossRef] [PubMed]
- O'Brien, K.L.; Finlay, D.K. Immunometabolism and natural killer cell responses. Nat. Rev. Immunol. 2019, 19, 282–290. [Google Scholar] [CrossRef]
- Tian, J.; Dai, S.B.; Jiang, S.S.; Yang, W.Y.; Yan, Y.Q.; Lin, Z.H.; Dong, J.X.; Liu, Y.; Zheng, R.; Chen, Y.; et al. Specific immune status in Parkinson’s disease at different ages of onset. NPJ Parkinsons Dis. 2022, 8, 5. [Google Scholar] [CrossRef]
- Liu, S.H.; Wang, Y.L.; Jiang, S.M.; Wan, X.J.; Yan, J.H.; Liu, C.F. Identifying the hub gene and immune infiltration of Parkinson’s disease using bioinformatical methods. Brain Res. 2022, 1785, 147879. [Google Scholar] [CrossRef]
- Xia, Y.; Liu, A.; Li, W.; Liu, Y.; Zhang, G.; Ye, S.; Zhao, Z.; Shi, J.; Jia, Y.; Liu, X.; et al. Reference range of naive T and T memory lymphocyte subsets in peripheral blood of healthy adult. Clin. Exp. Immunol. 2022, 207, 208–217. [Google Scholar] [CrossRef]
- George, S.; Tyson, T.; Rey, N.L.; Sheridan, R.; Peelaerts, W.; Becker, K.; Schulz, E.; Meyerdirk, L.; Burmeister, A.R.; von Linstow, C.U.; et al. T Cells Limit Accumulation of Aggregate Pathology Following Intrastriatal Injection of alpha-Synuclein Fibrils. J. Parkinsons Dis. 2021, 11, 585–603. [Google Scholar] [CrossRef]
- Ochoa, J.B.; Makarenkova, V. T lymphocytes. Crit. Care Med. 2005, 33 (Suppl. S12), S510–S513. [Google Scholar] [CrossRef] [PubMed]
- Azuma, M. Co-signal Molecules in T-Cell Activation : Historical Overview and Perspective. Adv. Exp. Med. Biol. 2019, 1189, 3–23. [Google Scholar] [CrossRef]
- Esensten, J.H.; Helou, Y.A.; Chopra, G.; Weiss, A.; Bluestone, J.A. CD28 Costimulation: From Mechanism to Therapy. Immunity 2016, 44, 973–988. [Google Scholar] [CrossRef]
- Lenschow, D.J.; Walunas, T.L.; Bluestone, J.A. CD28/B7 system of T cell costimulation. Annu. Rev. Immunol. 1996, 14, 233–258. [Google Scholar] [CrossRef] [PubMed]
- Dong, L.; Zheng, Y.M.; Luo, X.G.; He, Z.Y. High Inflammatory Tendency Induced by Malignant Stimulation through Imbalance of CD28 and CTLA-4/PD-1 Contributes to Dopamine Neuron Injury. J. Inflamm. Res. 2021, 14, 2471–2482. [Google Scholar] [CrossRef]
- Bas, J.; Calopa, M.; Mestre, M.; Mollevı, D.G.; Cutillas, B.; Ambrosio, S.; Buendia, E. Lymphocyte populations in Parkinson s disease and in rat models of parkinsonism. J. Neuroimmunol. 2001, 113, 146–152. [Google Scholar] [CrossRef]
- Inci, I.; Kusbeci, O.Y.; Eskut, N. The neutrophil-to-lymphocyte ratio as a marker of peripheral inflammation in progressive supranuclear palsy: A retrospective study. Neurol. Sci. 2020, 41, 1233–1237. [Google Scholar] [CrossRef]
- Wei, Q.Q.; Hou, Y.B.; Zhang, L.Y.; Ou, R.W.; Cao, B.; Chen, Y.P.; Shang, H.F. Neutrophil-to-lymphocyte ratio in sporadic amyotrophic lateral sclerosis. Neural Regen. Res. 2022, 17, 875–880. [Google Scholar] [CrossRef] [PubMed]


Disclaimer/Publisher’s Note: The statements, opinions and data contained in all publications are solely those of the individual author(s) and contributor(s) and not of MDPI and/or the editor(s). MDPI and/or the editor(s) disclaim responsibility for any injury to people or property resulting from any ideas, methods, instructions or products referred to in the content. |
© 2023 by the authors. Licensee MDPI, Basel, Switzerland. This article is an open access article distributed under the terms and conditions of the Creative Commons Attribution (CC BY) license (https://creativecommons.org/licenses/by/4.0/).